effectiveness of methods of testing conceptual
TRANSCRIPT

EFFECTIVENESS OF METHODS OF TESTING CONCEPTUAL
UNDERSTANDING IN PHYSICS: A STUDY DONE IN THE CONCEPT
OF FLOATING AND SINKING IN FORM 3 STUDENTS AT
MBOONI – EAST DISTRICT
MWALIMU JOSEPH NZOMO
UNIVERSITY OF NAIROBI
SCHOOL OF EDUCATION
DEPARTMENT OF PSYCHOLOGY
2015

i
A RESEARCH PROJECT IS SUBMITTED TO THE UNIVERSITY OF
NAIROBI IN PARTIAL FULFILLMENT OF THE REQUIREMENT FOR
THE AWARD OF MASTERS OF EDUCATION IN MEASUREMENT
AND EVALUATION
© Copyright
all rights preserved no part of this project report may be reproduced, stored in a
retrieval system or transmitted in any form or by any means, electronic, mechanical
photocopying ,recording or presented in any university for any degree award
without the prior written permission of the university of Nairobi.

ii
DECLARATION
This project report is my original work and it has not been presented for an award
of master‟s degree in any other university.
Signature……………………………… Date…………………………………
MWALIMU JOSEPH NZOMO
E58/70485/2013
This project report has been submitted with my approval as a university
supervisor
Signature……………………………… Date…………………………………
DR. LUKE ODIEMO
Department of psychology
University of Nairobi

iii
DEDICATION
This project is dedicated to the creator, Almighty God for good health, sound
mind and His divine provision in order to undertake and accomplish this project
in time and to my dear wife Brigid Mbithe, children Victor and praise and mum
Phyllis Ndulu for according me the encouragement and support throughout the
course.

iv
ACKNOWLEGEMENT
This work would not have been possible without the cooperation and assistance of
some people of good intentions and institutions. However it would be difficult to
mention all of them but I can‟t fail to give them some minimum credit.
The first and foremost gratitude goes to my supervisor Dr Luke Odiemo of the
Department of psychology in the University of Nairobi for his extra ordinary
advice, guidance and concern he accorded to me. He really devoted his time to
this study and manuscript preparation.
Secondly I would like to appreciate Dr Karen Odhiambo of the department of
psychology and coordinator of measurement and evaluation course in the
University of Nairobi.
Thirdly I would like to extend my gratitude to Mr. Pascal Musyimi the Principal
Kitondo Boys Secondary School, for the support and encouragement he gave me
throughout the course. He never hesitated to give me permission to attend my
classes and visit the supervisor.
Lastly I would like to appreciate the form 3 students in Mbooni East more so
Kitondo boys form 3 students for their cooperation during data collection process.
MAY ALMIGHTY GOD BLESS YOU ALL
THANK YOU.

v
ABSTRACT
The central problem of this study was to determine the most effective method of
testing prior knowledge and conceptual understanding in physics in the concept of
floating and sinking among form three students from Mbooni – East district in
Makueni County. The study was comparing between Essay tests, Experimental
test and Objective tests. It was hypothesized that Experimental method of testing
was hypothesized to be the most effective method of testing conceptual
knowledge. The study employed a comparative case study design which involved
pretest, instruction and then pre-test. A school in Mbooni east was sampled
randomly where the research was to be conducted. In the selected school 30 form
3 students were chosen at random in from the form 3 students who take physics
randomly. The selected sample was further divided three groups in which a test
was administered to the student one group with essay test, the other group with
Experimental test while the third group with objective test after which the sample
population was taken through an instructional process using guided discovery
method for one the once again tested using the same test. The scripts were marked
and the scores obtained formed the data for the research. The selected sample was
again given questioners to respond to establish the demographic factors of the
sample of study. The collected data was analysed using descriptive and inferential
statistics. The main technique used to analyse the data was paired t-Test and
Analysis of variance (ANOVA), Means, standard deviations and percentages.
And reported using tables and frequency graphs. From the study it was
established that objective test were the most effective method of testing prior
knowledge and conceptual understanding followed by Experimental test and the
least effective was Essay tests was recommended that tests should be incorporated
in our teaching before and after. In order to test the scope of the prior knowledge
and the extent in which the learners have understood the scientific concepts.
Finally suggestions for further research were made either to replicate this study to
cover a wide area to find out the most effective method of testing conceptual
understanding in other areas of the country and in other subjects. Also it can done
using a different method of instruction.

vi
TABLE OF CONTENTS
DECLARATION................................................................................................... ii
DEDICATION...................................................................................................... iii
ACKNOWLEGEMENT...................................................................................... iv
ABSTRACT ........................................................................................................... v
LIST OF TABLES ............................................................................................... ix
LIST OF FIGURES .............................................................................................. x
CHAPTER ONE: INTRODUCTION ................................................................. 1
1.1 Background to the study ................................................................................ 1
1.2 Statement of the problem .............................................................................. 7
1.3 Purpose of study .......................................................................................... 10
1.4 Research questions ...................................................................................... 10
1.5 Objectives of the study ................................................................................ 10
1.6 Significance of the study ............................................................................. 11
1.7 Scope and limitations .................................................................................. 11
1.8 Definition of terms used .............................................................................. 12
CHAPTER TWO: LITERATURE REVIEW .................................................. 13
2.1 Conceptual changes in learning of floating and sinking ............................. 13
2.2 Factors that may influence conceptual understanding for the learners ....... 20
2.2.1 Family background ............................................................................... 20
2.2.2 The type of the school .......................................................................... 22
2.2.3 Culture of the people where the students comes from .......................... 23
2.2.4 Social economic status of the learner ................................................... 24
2.2.5 Peer influence ....................................................................................... 25
2.3 Theoretical frame work ............................................................................... 26
2.3.1 Constructivist theory of teaching and learning ..................................... 26
2.3.2 Classical Test Theory ........................................................................... 28
2.4 Conceptual frame work ............................................................................... 30
vii
CHAPTER THREE: METHODOLOGY ........................................................ 32
3.1 Introduction ................................................................................................. 32
3.2 Research design ........................................................................................... 32
3.3 Population.................................................................................................... 33
3.4 The study sample ......................................................................................... 33
3.5 Research instruments................................................................................... 33
3.6 Data collection procedure............................................................................ 34
3.7 Methods of data analysis ............................................................................. 34
CHAPTER FOUR: DATA REPRESENTATION AND ANALYSIS ............ 35
4.1 Introduction ................................................................................................. 35
4.2 Distribution of scores .................................................................................. 35
4.3 The statistical analysis for the scores for both post and pre-test in science 48
4.4 The most effective method to elicit the conceptual understanding science 49
4.6 Factors that may influence the conceptual understanding of the learners
science ............................................................................................................... 55
CHAPTER FIVE: DISCUSSION, RECOMMENDATION AND
CONCLUSION ................................................................................................... 58
5.1 introduction ................................................................................................. 58
5.2 Generalization ............................................................................................. 58
5.2.1 Internal validity..................................................................................... 58
5.2.2 External validity ................................................................................... 60
5.3 Discussion of the findings ........................................................................... 60
5.3.1 The most appropriate method to elicit prior in science ........................ 60
5.3.2 The most appropriate method to test conceptual understanding science
....................................................................................................................... 61
5.4 Factors affecting learner‟s conceptual understanding science .................... 62
5.5 Contribution of the study to the theoretical framework .............................. 63
5.6 Recommendations ....................................................................................... 64
5.7 Further research ........................................................................................... 65
5.8 Conclusion ................................................................................................... 65

viii
REFERENCES .................................................................................................... 67
APPENDICES ..................................................................................................... 78
Appendix I: Reference letter ............................................................................. 78
Appendix II: Questionnaire for the students to investigate demographic factors
........................................................................................................................... 79
Appendix III: Exams ......................................................................................... 81
Appendix IV: Marking schemes ....................................................................... 88
Appendix IV: Raw scores for both pre and post test......................................... 91

ix
LIST OF TABLES
Table 1: Results for Pre-test using experimental test experiment test ...................36
Table 2: Score distribution for Post-test for experiment test .................................38
Table 3: The score distribution in Pre-test for objective question test ..................40
Table 4: Scores for Post-test in objective question test .........................................42
Table 5: Results for Pre-test in an essay test..........................................................44
Table 6: Results for post-test in an essay test ........................................................46
Table 7: Statistical analysis for both post and pre-test in all categories ................48
Table 8: Showing a paired t-test for experimental testing .....................................50
Table 9: Showing t-test analysis for Objective question test .................................51
Table 10: Showing a paired t-test for Essay Test ..................................................52
Table 11: showing ANOVA tables ........................................................................53
Table 12: showing the occupation of the parents of the learners ...........................56
Table 13: Educational level of the parents .............................................................56
Table 14: when they do understand physics concept best .....................................56
Table 15: Concerning those who influenced them to take physics ........................57

x
LIST OF FIGURES
Figure 1: Conceptual framework ...........................................................................30
Figure 2: Pre-test using experimental test experiment test ....................................37
Figure 3: Distribution for Post-test for experiment test .........................................39
Figure 4: Distribution in Pre-test for objective question test .................................41
Figure 5: Scores for post-test in objective question test ........................................43
Figure 6: Results for Pre-test in an essay test ........................................................45
Figure 7: Results for post-test in an essay test .......................................................47

1
CHAPTER ONE
INTRODUCTION
1.1 Background to the study
Physics being one of the science subjects taught in secondary school curriculum,
which deals with matter in relation to energy but it has been facing a lot of
challenges in its performance and the number of students taking it up to the form
4 and is a key subject for the progress of Kenya in becoming industrialized in the
vision 2030 as projected in the national development plan. This is because the
leaners perceive it to be too difficult and abstract this arises simply because of the
method of instructions and also the teachers believe that the students can‟t make
it.
The main problem is the approach in which the teachers use in teaching science
physics. This problem has been brought about by the belief by most teachers that
students are empty vessel which filled with knowledge. That is they approach
teaching as a process of transferring knowledge from the teacher to the student.
This problem can be solved by use the constructivist approach of teaching and
learning which is one of the most influential contemporary approaches to
understanding how children come to learn science in school classrooms. The
constructivist perspective maintains the view that children will have formed some
representations of many of the phenomena studied in school science based on
their previous experiences and reflection on those experiences in order to

2
understand the world around them (Driver, Asoko, Leach, Mortimer &Scott,
1994). These initial representations are proposed to take the form of „alternative
frameworks‟ because of the explanatory scope that they provide children with.
These „alternative frameworks‟ contain conceptual understanding that frequently
contrasts with scientific explanations of the same phenomena and therefore they
are subject to change when children begin their formal science education (Driver
& Easley, 1978; Driver & Bell, 1986). Research investigating learning from this
perspective has led to the development of a number of explanatory models
identifying underlying mechanisms that support such „conceptual changes‟ (for
example Vosniadou & Brewer, 1987; diSessa, 1988; Sharp & Kuerbis, 2006,
summaries in Vosniadou 2008; Limon & Mason, 2002). These modeling of their
depth and scope with some placing a high emphasis on purely cognitive processes
(Rumelhart & Norman, 1978; Posner, Strike, Hewson & Gertzog, 1982) while
others attribute a strong role to motivational and affective factors (Pintrich, Marx
& Boyle, 1993, Dole & Sinatra, 1998). The development of ideas of force studied
in physics is the focus of diSessa‟s fragmentation theory (1988). Models also
frequently lack consistency between the ages of participants recruited, notably
diSessa‟s original contributions from college students whereas Vosnidou‟s
research recruited school age children. One criticism that is more fundamental
originates from the lack of consensus regarding the level of mental representation
studied. In some cases the aim is to study individual concepts and in others mental
models which result from theory structures are utilized. Taken as a whole, this
3
diversity of subjects studied restricts comparison and evaluation of models across
scientific domains and prevents the models being evaluated for their utility in
informing teaching across scientific curricula. In order to overcome these
difficulties the work presented here evaluates the models within comparative
contexts in one science domains, notably in the development of children‟s ideas in
floating and sinking (the Archimedes principle) class.
The core commitment of a constructivist position, that knowledge is not
transmitted directly from one knower to another, but is actively built up by the
learner, is shared by a wide range of different research traditions relating to
science education. One tradition focuses on personal construction of meanings
and the many informal theories that individuals develop about natural
phenomena(Carey, 1985; Carmichael et al., 1990; Pfundt &Duit, 1985) as
resulting from learners' personal interactions with physical events in their daily
lives (Piaget, 1970) For instance the concept of floating and sinking is not such a
new concept to the learner because the learner have always had an interaction
with the knowledge or applied it in one way or the other in their play in their
childhood. For example when they are swimming in a swimming pool they find it
easier to lift and object while the same object lifted in air is heavier, flying of
kites depending on the background of the learner some have seen a steel vessel
floating on water.

4
Therefore learning in classroom settings, from this perspective, is seen to require
well-designed practical activities that challenge learners' prior conceptions
encouraging learners to reorganize their personal theories. These activities should
be designed to explore the following key concepts
Whether something floats depend on the material it is made of, not its Weight.
Objects float if they are light for their size and sink if they are heavy for their
size.
An object can be light for its size if it contains air, such as a hollow ball.
Materials with a boat shape will float because they effectively contain air.
Water pushes up on objects with an up thrust force.
Objects float if the up thrust force from the water can balance their weight
(gravity force).
Objects float depending on their density compared to water; for an object to
float its density needs to be less than that of water.
Objects float when air is enclosed in an object; their density is lowered,
thereby increasing the likelihood of floating.
The up thrust depends on the amount of water displaced.
Objects float better in salt water (density of salt water is greater than that of
pure water).
Water surfaces have a cohesive force (surface tension) that makes them act
like a „skin‟.

5
Small, dense objects (e.g. a pin; a water spider) can „float‟ on the surface of
water without breaking it, due to surface tension effects.
A different tradition portrays the knowledge-construction process as coming
about through learners being uncultured into scientific discourses (e.g., Edwards
& Mercer, 1987; Lemke, 1990). Yet others see-it as involving apprenticeship into
scientific practices (Rogoff & Lave, 1984). We need to study the ways in which
school students' informal knowledge can be drawn upon and interacts with the
scientific ways of knowing introduced in the classroom (e.g., Johnston& Driver,
1990; Scott, 1993; Scott, Asoko, Driver, & Emberton, 1994). Clearly there is a
range of amounts of processes by which knowledge construction takes place.
Some clarification of these distinct perspectives and how they may interrelate
appears to be needed. A further issue that requires clarification among science
educators is the relationship being proposed between constructivist views of
learning and implications for pedagogy. Indeed, Millar (1989) has argued that
particular views of learning do not necessarily entail specific pedagogical
practices. Furthermore, the attempts that have been made to articulate
"constructivist" approaches to pedagogy in science (Driver & Oldham, 1986;
Fensham, Gunstone, & White, 1994; Osborne & Freyberg, 1985) have been
criticized on the grounds that such pedagogical practices are founded on an
empiricist view of the nature of science itself (Matthews, 1992; Osborne, 1993),
the study shall present view of the interplay among the various factors of personal
experience, language, and socialization in the process of learning science in
6
classrooms, and discuss the problematic relationships between scientific
knowledge, the learning of science, and pedagogy. Any account of teaching and
learning science needs to consider the nature of the knowledge to be taught.
Although recent writings in the field of science studies emphasize that scientific
practices cannot be characterized in a simplistic unitary way, that is, there is no
single "nature of science"(Millar, Driver, Leach, &Scott, 19931, there are some
core commitments associated with scientific practices and knowledge claims that
have implications for science education. We argue that it is important in science
education to appreciate that scientific knowledge is both symbolic in nature and
also socially negotiated.
From the above discussion then it is necessary always to inquire the student‟s
depth of conceptual understanding or misunderstanding of the concept of floating
and sinking before teaching and the conceptual change that has taken place after
instruction. This calls for research to determine the most effective ways of testing
learner‟s conceptual understanding or misconception. This will help the teacher to
the method of instruction to use during his teaching. If the learners lack sufficient
prior knowledge they are unable to activate the knowledge and may struggle to
access participate and progress in the subject matter while those with sufficient
prior knowledge find it possible and easy to activate the knowledge, participate
during the lesson and progress with the subject matter.

7
Teachers can facilitate their students‟ literacy success science by helping them to
build and activate background knowledge by first testing them their conceptual
understanding on the topic. This can be done by the teacher designing a test which
will be administered to the learners before a new concept is introduced and after
the instruction, it is marked and scores are analyzed to see how much a person
knows about a particular domain. A person who receives a high score on the test
is considered to have a deep conceptual understanding of the concept. Both
psychologists and consumer behavior researchers have implemented this
definition by administering tests to subjects to assess their knowledge of a
particular product class. (Bruck forthcoming, Spilich, Vesonder, Chiesi dc Voss
1979, Staelin 1978). The underlying assumption is that people with equivalent
scores on the knowledge test should perform in similar ways on tasks such as
recall of new information. The tests can take various forms
Objective questions
Essay questions
Practical approach
1.2 Statement of the problem
Much research has indicated that students enter their classrooms with ideas about
science that have been influenced by their prior experiences, textbooks, teachers‟
explanations, or everyday language (Osborne, 1982; Nakleh, 1992; Fleer,
1999;Palmer, 2001; Coştu & Ayas, 2005; Çalık & Ayas, 2005). According to the

8
constructivist view, students often construct their own knowledge and theories
about how the natural world works. Therefore, their construction of knowledge or
theories may sometimes be contrary to those of scientists (Osborne and Wittrock,
1983; Bodner, 1986; Geelan, 1995). Such views or conceptions have been called
misconceptions, preconceptions, alternative frameworks, naïve conceptions or
common sense conceptions (Driver & Erickson, 1983; Treagust, 1988; Nakleh,
1992).Over the last two decades, educators have shown great interest in
identifying students „misconceptions about various science phenomena, either
prior to or following an instruction. One of the areas that science education and
cognitive development.
Students‟ views on floatation were first reported by Inhelder and Piaget (1958).
They revealed that because the formulation of floatation rules requires advanced
reasoning skills, it may not be understood by students and it is possible for
students to have misunderstandings. Rowell and Dawson (1977a, 1977b,1981)
carried out studies related to the results of Piaget‟s work to elicit students‟
understanding and help them improve their understanding of the phenomenon of
floatation. In addition, there are numerous studies reporting students‟
misconceptions and investigating the effectiveness of alternative teaching models
for floatation and related concepts (Simington, 1983; Biddulph and Osborne,
1984; Smith, Carey, &Wiser, 1985; Halford, Brown, & Thompson, 1986; Smith,
Snir & Grosslight, 1992; Hewson & Hewson, 1993; Kariotogloy, Koumaras, &
Psillos, 1993).Although there have been many studies on students‟ conceptions of

9
sinking and floating in the international science literature, few studies are
available in Turkey. Gürdal and Macaroğlu (1997) investigated fifth grade
students‟ conceptions of sinking, floating and the Archimedes principle. They also
discussed how to teach these phenomena by taking into account primary school
students‟ cognitive skills. Their study revealed that as students did not give
correct response to any test item, they couldn't construct scientific understanding
about these concepts. Macaroğlu and Şentürk (2001) also carried out a study to
elicit fourth grade students‟ understanding of the floatation. They found that
students could not identify whether a material sank or floated, because of their
non-scientific rules for sinking and floating. Although there are some studies
investigating primary school students‟ conceptions of sinking and floating, similar
studies on grade-eight students‟ conceptions have not been studied so far in
Turkey. As the Archimedes principle and other related concepts are first
introduced to students at the seventh grade, one important question should be
asked whether students still hold their earlier misconceptions or alternative ideas
even after formal instruction in class Therefore, this study was aimed to
investigate form three students‟ conceptions, understandings and
misunderstandings of sinking and floating concepts. The main problem under
investigation was to investigate the most effective method of testing the prior
knowledge and conceptual understanding of learners before and after an
instruction.
10
1.3 Purpose of study
The purpose of the study was to determine the most effective method of
determining the students conceptual understanding and misunderstanding of the
concept of floating and sinking.
1.4 Research questions
1. Was there an improvement in scores and mean scores in post-test
compared to pre- test?
2. Which of the three methods of testing was able to elicit prior knowledge
well from the learners?
3. Which of these three methods was able to examine the learner‟s
conceptual knowledge better?
4. What are the factors that may affect conceptual understanding of the
learners in the concept of floating and sinking?
1.5 Objectives of the study
The objectives of the study are to investigate;
1. The most appropriate method of eliciting prior knowledge
2. The most appropriate method of testing conceptual understanding
3. The factors that may affect conceptual understanding of the learners.

11
1.6 Significance of the study
The findings of the study will help teachers greatly especially in testing the
learners their prior knowledge which will help them to know what the students
know about the topic and their misconception since it will guide them on the most
appropriate way of testing prior knowledge it will also help the teachers to know
the effectiveness of the method used in teaching a concept by comparing how
much the learner has changed his conceptual understanding. This will also enable
the teachers to choose the method of instruction. The policy makers will also
benefit from the study since they will know the best method of testing conceptual
understanding and put it as a requirement to all instructors before introducing a
topic and after. They will also be able to know what content to be included at
what level of learning.
1.7 Scope and limitations
The study will capture only one concept in one subject of all the possible over 15
subjects. It will also take just a few students in the selected school since physics is
an optional subject in the 8-4-4 curriculum. The study will only be done in
Mbooni East Sub County only out of the many sub counties in the country.
12
1.8 Definition of terms used
Force: a push or a pull.
Density: amount of mass per unit mass of an object (i.e. the concentration
of mass, or how „heavy for its size‟ an object is). The density of water is1
kg per litre.
Pressure: amount of force applied per unit area. At a given pressure,
twice the area will experience twice the force.
Archimedes’ principle: A floating object will experience an up thrust
force from water, equal to the weight of water displaced.

13
CHAPTER TWO
LITERATURE REVIEW
2.1 Conceptual changes in learning of floating and sinking
Conceptual change is regarded a gradual process (Chi, 1997; Vosniadou, 2001).
Vosniadou (1994) argues that student‟s concepts are embedded in larger
theoretical structures constraining them. Conceptual change thus involves the
restructuring of underlying concepts, which can take place in various ways. For
instance, an understanding of the concept of density requires the simultaneous
consideration of the two dimensions of mass and volume. A concept that young
children often lack is mass as a continuous and measurable characteristic of the
material world (Smith et al., 1985). It is therefore difficult for them to grasp the
concept of density as a whole and all its related consequences.
When students are confronted with experiences, information, or instruction that is
inconsistent with their existing conception of a phenomena they will gradually
assimilate the new information in their existing explanatory framework. While the
shift from the misconception to a more coherent pre-conception to the finally
scientifically grounded concept occurs, the different concepts remain side by side
(Zimmermann, 2007). Dependent on the (learning) situation one of the pre-
conceptions is chosen as a basis for an explanation of the phenomenon at hand.
The comparison of mass and volume thus require the simultaneous consideration

14
and integration of concepts. At least an intuitional idea of this notion is the first
step toward a revise of the pre-conception.
Although, according to Smith et al. (1985), especially young children have a
tendency to adopt an undifferentiated conception of mass and density. Kohn
(1993) showed in his study that even between preschooler‟s and adults are
considerable parallels with regard to their inadequate strategies for judging an
object‟s floating or sinking. The issues of density and buoyancy force are often
presented first in secondary school, based on the argument that students need to
be mature enough to be able to grasp the abstract aspects of the involved formulas
such as proportions. Nonetheless, there is indication that concept improvement
may be reached when early curricula explicitly address these concepts.
In this line Ilonca Hardy et al. (2006) argues If, however, children were also
introduced to the explanations for the behavior of different materials in water,
thus receiving the opportunity to revise misconceptions early on, there is good
reason to expect that they will be able to profit more from the formulas of density
and buoyancy force treated in secondary school. Unfortunately most often
contemporary curricula in elementary school only introduce a material based pre-
concept, e. g. that solid objects of the same material behave the same way when
immersed in water. But even this relative simple pre-concept of continuity of
characteristics is easily neglected as students are asked to explain why thinks float
or sink (Biddulph & Osborne, 1984).

15
Conceptual change has generally been investigated only through cognitive
functions as a general process without consideration of the context. However, the
process of conceptual learning in an instructional context supported by a teacher,
as in this study, is not governed only by cognitive factors, and thus conceptual
change should be discussed within the context in which the process is taking
place. Tyson (1997) and Duit and Treagust (2003) have provided a relevant model
for analyzing conceptual change from three different viewpoints: ontological,
epistemological and social/affective. The analyses are useful in splitting up the
components of the process, but for developmental work in the schools more
discussion is needed in order to include the situational and cultural contexts in the
cognitive context, as discussed by Halldén (1999), who observed the role of
everyday contexts in the use of scientific knowledge and of the explanations in
the speech genre. Accordingly, this brings up the question of the holistic
interpretation of conceptual change, which is relevant to this study. Halldén‟s way
of thinking can be applied to analyzing young children‟s conceptual change
processes in the instructional context, and especially allows emphasis to be placed
on their ways of discussing. The social context of cognitive development, and
especially the role of language in the learning process, was initially rooted in L.S.
Vygotsky‟s work. Vygotsky (1962, 1978) saw knowledge construction as an
ongoing, zig-zag process in which the child, in collaboration with a teacher or
other children, integrates everyday concepts into a system of related concepts and
transforms the raw material of experience into a coherent system. In interaction

16
and communication the children start to reflect on their limitations, contradictions,
presuppositions and the implications of their conceptions. This kind of awareness
constitutes a critical condition for experiencing conceptual change in one‟s own
knowledge structures (Vosniadou 1994) and, consequently, provides a key for
encouraging conceptual change in young children. Discursive communication in
the classroom provides an opportunity for knowledge construction and
reconstruction, which is embedded in the instructional process (Havu 2000).
Through the analysis of the instructional process, a deeper understanding is
obtained about how conceptual change is reached and what are the elements that
are involved in the change process. On the other hand, different problem-solving
skills, the social discourse in the context of learning (Boulter 2000), and also an
interpretation of scientific world and nature of scientific knowledge (see Osborne
1996) seem to have significant roles in the learning process.
In this study it was considered that the understanding of young children‟s teaching
and learning as a process of conceptual change, underpinned by the view that the
social interaction, especially collaborative interaction (Boulter 2000), during the
learning process has an impact on conceptual change at an individual level. The
model presented next is constructed based on knowledge of previous studies and
theories, and shapes the analysis of conceptual change process Young children‟s
processes of conceptual change which occur in an instructional context and in the
environment in which a cognitive conflict can be established, happen mostly in
social interaction with other peers and the teacher. The children‟s personal
17
conceptual structures based on their everyday experiences interact with the views
of other children and the teacher. The conditions that facilitate or hinder the
cognitive conflict, or in some other ways affect the conceptual reorganization, can
be either internal or collaborative factors, which are continuously involved in the
process of reorganization of everyday experiences. Because the meaning of the
collaborative talk has a varying role in knowledge construction or reconstruction,
the contexts and their social aspects need to be described and interpreted.
Conceptual change itself is an individual cognitive process, in which the new
conceptions may change in several ways, ontologically or epistemologically (Chi
et al. 1994, Duit and Treagust 2003, Thagard 1992) and through several phases,
being continuously in interaction with the child‟s internal or collaborative
learning. The children‟s epistemological or ontological conceptions may be
deeply this study is an attempt to find the answer to how form 3 physics students
change their conceptual understanding when instruction has been provided.
Hence, it is also essential to pay attention to new verbal interaction and
construction of how shared knowledge facilitates the process of conceptual
change. This study was to interpret the conceptual change process through
children‟s verbal expressions, which are seen to express their current thoughts and
understanding within the limitations of their skills to express themselves. The
verification for the interpretations of verbal expressions was derived from analysis
of the children‟s experimental work during the study.

18
The Orientation (Driver and Oldham 1986: 119), based on general discussion in
the classroom, attempted to initiate a discussion of the phenomena. The children
were asked to describe, in general, sinking and floating, and to talk about their
previous concrete experiences with sinking and floating objects. For conceptual
change, orientation is the stage at which the teacher gains an idea about the
children‟s existing knowledge and provides an environment for enriching,
reorganizing or changing the children‟s conceptions. Conceptual change should
start and continue in the experimental session, where learning activities will be
planned to support the children‟s conceptual restructuring and make their ideas
explicit (Driver and Oldham 1986). The approach for that was collaborative
working, in which the children worked in three mixed groups, each having three
to four participants. The results of group work will be discussed generally with all
children under the teacher‟s guidance.
The alternative perspectives, like heaviness/lightness, size, materials, and
hollowness/vacuum, will be discussed and the general reasons for flotation will be
built-up. If necessary, the children‟s language and new concepts will be
„sharpened up‟ (Driver and Oldham 1986) by the teacher. The teaching session in
the present study progressed as shown in figure below.

19
According to Inhelder‟s (1974) arguments that the young children are incapable
of differentiating concepts of global quantity (see Smith et al. 1985). The objects
for the investigation allow the determination of which of the object‟s properties
influence the subject‟s judgments and provide several examples of each different
dimension used in explaining floating and sinking. In addition, most of these
materials were familiar to the children and had a meaningful relation to their
everyday life. A similar worksheet was used in all parts of the study, except for
the elaboration part, where a special worksheet was prepared. The worksheet for
elaboration did not include any particular objects, but rather the children were
expected to fill it in with their own objects from home. Children marked their
predictions and the empirical results of the experiment on the worksheet. The
general discussion with the teacher was based on the observations and on the
completed worksheets.
Orientation
Motivation
Activating
existing
knowledge
Prediction
experiment
Reconstructing
knowledge
structure
Explanations
for floating and
sinking
General
discussion
General
conceptualiza
tion
Connection to
daily life
reflection
Elaboration
orientation
prediction
experiments
General
discussion

20
2.2 Factors that may influence conceptual understanding for the learners
2.2.1 Family background
Many researchers and scientists agree that success at school is associated with
social background factors (e.g., Giddens, 1997), as these factors can greatly affect
young children‟s cognitive skills. Disadvantaged children (children with poor
social background) start schooling with significantly lower cognitive skills than
their more advantaged peers. Development according to their abilities and stage of
development (by balancing their cognitive, emotional and social development); to
convey to them the basic knowledge and skills that will allow an independent,
efficient and creative confrontation in the social and natural environment; to
develop their awareness of belonging to a specific cultural tradition. Since public
school is the institution where students are (supposed to be) considered equal,
regardless of their social background, it is expected that factors related to social
and family background should be less associated to a student‟s performance as
he/she progresses to higher grades. A research done by Barbaraneza Breck to
establish, whether there is a correlation between the students‟ social and family
background and his/her school performance. Whereby he used three populations
of Slovene student‟s fourth graders and eighth graders in primary school, and
students in the final year of secondary school were tested. He used population of 1
students aged 9 years (n = 2566), population 2, students aged 13 years (n = 2708),
and students in the final year of secondary school population 3 (n = 3372).
Analyses were done on weighted data. The data analyzed was derived from

21
student‟s background questionnaires, where students were (among other things)
asked about family and social background. For the analysis of social background
the variables indicating social and family background were used, and to study
school performance, achievement scores (plausible values for science and math)
were used. Population 3 was a bit more development according to their abilities
and stage of development (by balancing their cognitive, emotional and social
development); it was found that knowing and understanding the language of a test
is an important factor in relation to how successful the student would be, it was
supposed that students not born in the country, or not speaking the Slovene
language at home, would achieve lower results at the beginning of schooling. In
the fourth grade 96.1% students were born in the country. Students born in the
county are more successful - there are 12.5% not successful students in that group
in contrast to 34% not successful students in the group of those who were not
born in the country. The differences between groups are statistically significant.
In the eighth grade we still observe differences between the two groups but as
seen from the figure, the differences tend to be lower. Still students born in
Slovenia achieved better results and the differences between the two groups are
significant. In the eighth grade there were 96.7% students born in the country. The
family background is a key to the student‟s life and outside of the school since it
influences learning for instance parenting practices, aspirations for the future
which influences the learner to know more or less in a particular field
(Majoribanks 1996) This actually true in Kenya since the children born in the

22
urban areas seems to have more prior knowledge in many issue than those born in
rural areas whoever the difference is the only the ability to understand English
language. Once this barrier is broken the students from rural areas still find that
they still have an ability to understand scientific concepts as well as children from
well of families. The study will be done in the public schools where the family
background barrier has already been broken and the learner have a feeling as
though that the family background has no effect to their performance.
2.2.2 The type of the school
A number of studies have examined the effect of school quality on student
achievement (e.g. Ehrenberg and Brewer, 1994, 1995; Hanushek, 1986, 1996).
These studies find that, on balance, improving school resources such as the pupil–
teacher ratio or per pupil spending do not improve Students‟ performance on
standardized achievement tests. This general conclusion runs counter to the
conventional wisdom that the way to improve student achievement at public
elementary and secondary schools is to allocate more money to them. Studies
which analyze the effectiveness of school quality on student performance have
primarily relied on estimation approaches such as Ordinary Least Squares (OLS)
or Instrumental Variables (IV), which estimate the mean effect of school resource
variables on student achievement. While estimating how „on average‟ school
resources affect educational outcomes yields straightforward interpretations, the
standard methodology may miss what is crucial for policy purposes, namely, how

23
school resources affect achievement differently at different points of the
conditional test score distribution. For example, while increases in per pupil
spending may not matter for average test scores, it would be useful to know if
increased spending increases test scores at the bottom of the conditional
distribution. On the other hand students in high cost private schools are more
knowledgeable than their counterparts in the public schools since they have a
wide range of exposure and therefore they tend to understand concepts in sciences
faster than in public school. More so students in public schools they have different
levels of understanding simply because of their entry behavior. The ability of the
students in the national schools is not the same as the ability of the students in sub
county schools. In this study, it will be done with the students of the same level.
2.2.3 Culture of the people where the students comes from
For almost a century of intelligence testing, efforts have been made to develop
„„culture free‟‟ tests (Jensen, 1980). Different attempts are found in the history of
psychological testing to construct measures that would be „„culture-free‟‟
(Anastasi, 1988; Cattell, 1940). For some time, it was supposed that the effect of
culture could be controlled if verbal items were eliminated, and only non-verbal,
performance items were used. However, this assumption turned out to be wrong.
Researchers using a wide variety of cultural groups in many countries have
sometimes observed even larger group differences performance and other non-
verbal tests than in verbal tests (Anastasi, 1988; Irvine & Berry, 1988; Vernon,

24
1969). Therefore, not only verbal, but also non-verbal tests may be culturally
biased. The use of pictorial representations itself may be unsuitable in cultures
unaccustomed to representative drawings, and marked differences in the
perception of pictures by individuals of different cultures have been reported
(Miller, 1973). Furthermore, non-verbal tests often require specific strategies and
cognitive styles characteristic of middle-class Western cultures (Cohen,
1969).Regardless of the contrary evidence, the idea that non-verbal cognitive tests
can be culturally free has significantly remained. Currently, there is a diversity of
intellectual tests that are presented as „„culture-free,‟‟ or „„culture-fair‟‟ just
because they include mostly nonverbal items (e.g., Alexander, 1987; Crampton &
Jerabek, 2000). This point of view contradicts available anthropology and cross-
cultural psychology evidence (Berry, Poortinga, &Segall, 1992; Harris, 1983;
Irvine & Berry, 1988). Cole (1999), for example, has argued that the notion of
culture-free intelligence is a contradiction in terms. He points out that cross-
cultural test construction makes it clear that tests of ability are.
2.2.4 Social economic status of the learner
The social economic status combines both the parents‟ education level,
occupation status and income level (Jaynes 2002) studies have repeatedly found
that social economic status affects student‟s outcomes (Jaynes, 2002; Eamon,
2005; Majoribanks, 1996; Hochschild, 2003; Mcneal, 2001 and Jeyried, 1998).

25
Students who have low social economic score lower in test scores and are more
likely to drop out of school (Eamon 2005, Hoch child 2003) it is also believed that
students are also influenced by their parents especially in accessing vital resources
and the ability to visit as many places as possible which might help in building up
the learners experiences of life. With this understanding it can also be concluded
that at times the children from low social economic status tend to take long to
understand the scientific concepts. This could be because of the level of exposure,
the motivation from the parents and more so the siblings the language of such
student is really wanting. But in situation where the learners have interacted and
the discovered their abilities especially in public schools you even find that
students from low socio economic level they even understand better than those
from low social economic status. In private schools these differences do exist and
the learners from low social economic status tends to feel low and intimidated
hence perform poorly. This study will deal with the learners who have grown
beyond such boundaries and their performance is likely to almost the same in the
two tests.
2.2.5 Peer influence
Peer influence makes students participate in activities which give the learners
different experiences of life.(senator 2000) when one is engaged with the right
peer group is likely to affected positively than those who are associated with peers
with negative behaviors (sentor 2000) those peers with negative behavior they

26
adversely affect ones cognitive abilities. It is generally assumed that active
engagement of students during discussion with peers, some of whom know the
correct answer, leads to increased conceptual understanding, resulting in
improved performance after PI. However, there is an alternative explanation: that
students do not in fact learn from the discussion, but simply choose the answer
most strongly supported by neighbors they perceive to be knowledgeable. We
sought to distinguish between these alternatives, using an additional, similar
clicker question that students answered individually to test for gains in
understanding. Our results indicate that peer discussion enhances understanding,
even when none of the students in a discussion group originally knows the correct
answer. In this study group work discussion will be part of the instruction process
and this will help the learners to understand the concepts better hence showing a
greater margin of improvement in the post test.
2.3 Theoretical frame work
This study borrowed a lot from the constructivist theory of teaching and learning
and classical theory of testing.
2.3.1 Constructivist theory of teaching and learning
Constructivist teaching is based on the belief that learning occurs as learners are
actively involved in a process of meaning and knowledge construction as opposed
to passively receiving information. Learners are the makers of meaning and
knowledge. Constructivist teaching fosters critical thinking, and creates motivated

27
and independent learners. This theoretical framework holds that learning always
builds upon knowledge that a student already knows; this prior knowledge is
called a schema. Because all learning is filtered through pre-existing schemata,
constructivists suggest that learning is more effective when a student is actively
engaged in the learning process rather than attempting to receive knowledge
passively. A wide variety of methods claim to be based on constructivist learning
theory. Most of these methods rely on some form of guided discovery where the
teacher avoids most direct instruction and attempts to lead the student through
questions and activities to discover, discuss, appreciate, and verbalize the new
knowledge.
The constructivist perspective maintains that the view that children will have
formed some representations of many of the phenomenon studied in school their
previous experiences and reflections on those experiences (Driver Asoko Leach,
Mortimer & Scott, 1994).
In order teachers to be able to teach science effectively for the students not only to
perform well in exams but also to apply the scientific knowledge in their daily life
situations, they need to first find out what the learners know about a concept. Are
there misconceptions about the concept do the learners have any idea about the
concept and to what extent. This will help the teachers to choose the right
approach in teaching the concept. It is also necessary to come up with the most
suitable way to test the prior knowledge of the learners.

28
2.3.2 Classical Test Theory
According to Bejar (1983), random sampling theory and item response theory are
two major psychometric theories for the study of measurement procedures. In
random sampling theory, there are two approaches, the classical theory approach
and the generalizability theory approach. A CTT (also known as classical true
score theory) is a simple model that describes how errors of measurement can
influence observed scores (Marcoulides, 1999) .Classical test theory Ulliksen,
1950) is the earliest theory of measurement. The major target of this theory is
estimating the reliability of the observed scores of a test. If the test is applied on a
Particular sample of items, at that particular time, in the reliable conditions, this
exam gives an observed score of the examinee. Under all possible conditions at
various times, using all possible similar items, theme and of all these observed
scores would be the most unbiased estimate of the subject‟s ability. Thus, mean is
defined as the true score. In any single administration of a test, the observed score
is most likely different from the true score (Suen, 1990). This difference is called
random error score. In the framework of CTT each measurement (test score) is
considered being a value of a random variable X consisting of two components‟
true score and an error score (Steyer, 1999).This relationship is represented in
below formula: X=T+E Because the true score is not easily observable, instead,
the true score must be estimated from the individual‟s responses on a set of test
items. In CTT, the observed score is assumed to be measured with error.
However, in developing measures, the goal of CTT is to minimize this error

29
(Mc-Bridge, 2001) in that case, importance of are reliability of a test and
calculating the reliability coefficient increases. If we know reliability coefficient,
we can estimate the error variance. The square root of error variance is
determined as standard error of measurement (SEM) and helps to define the
confidence interval to have a more realistic estimation of the true score.
Reliability is considered an attribute of the test data and not the assessment itself
in CTT. In fact, APA standards (AERA, APA, & NCME, 1999) state that when
reliability is reported, it must be accompanied by a description of the methods
used to calculate the coefficient, the nature of the sample used in the calculations,
and conditions under which the data were collected. However, reliability
estimates calculated through these procedures are sample dependent and, as a
result, have a number of practical limitations. When building or evaluating
technology-enhanced assessments (Scott and Mead, 2011).The alpha formula is
one of several analyses that may be used to gauge the reliability (i.e., accuracy) of
psychological and educational measurements. This formula was designed to be
applied to a two-way table of data where rows represent persons (p) and columns
represent scores assigned to the person under two or more conditions (i). Because
the analysis examines the consistency of scores from one condition to another,
procedures like alpha are known as internal consistency analyses (Cronbach and
Shavelson, 2004).
30
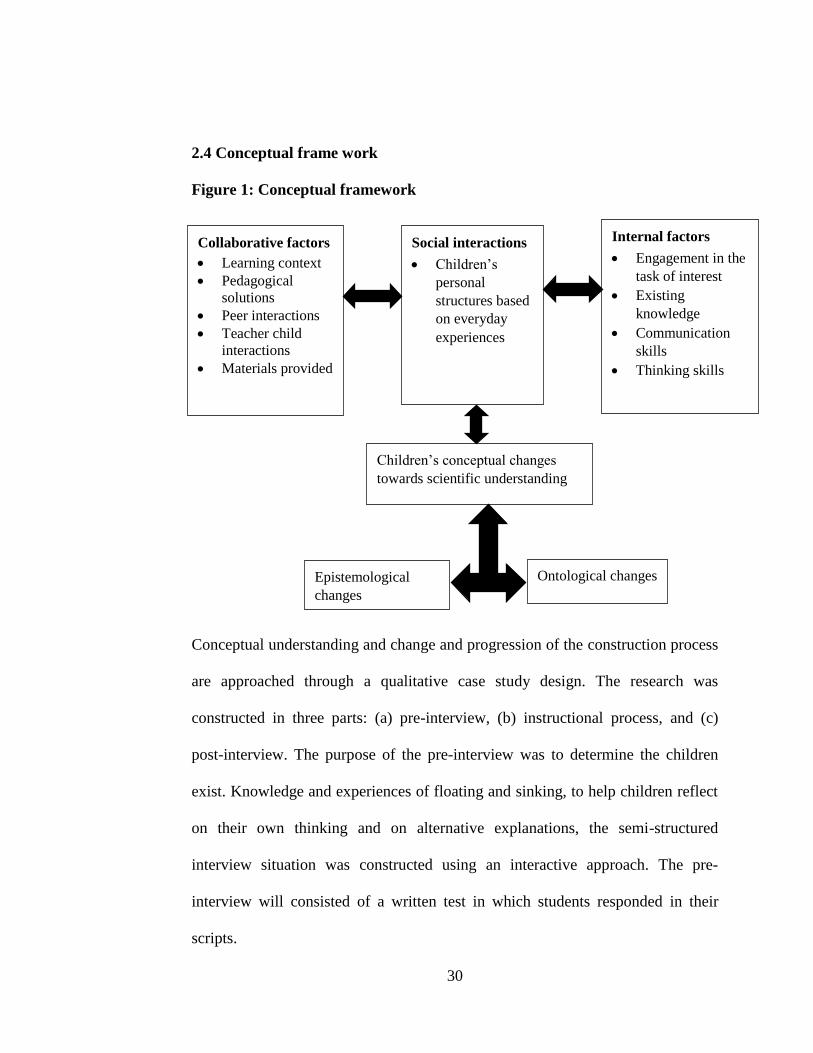
2.4 Conceptual frame work
Figure 1: Conceptual framework
Conceptual understanding and change and progression of the construction process
are approached through a qualitative case study design. The research was
constructed in three parts: (a) pre-interview, (b) instructional process, and (c)
post-interview. The purpose of the pre-interview was to determine the children
exist. Knowledge and experiences of floating and sinking, to help children reflect
on their own thinking and on alternative explanations, the semi-structured
interview situation was constructed using an interactive approach. The pre-
interview will consisted of a written test in which students responded in their
scripts.
Collaborative factors
Learning context
Pedagogical
solutions
Peer interactions
Teacher child
interactions
Materials provided
Social interactions
Children‟s
personal
structures based
on everyday
experiences
Internal factors
Engagement in the
task of interest
Existing
knowledge
Communication
skills
Thinking skills
Children‟s conceptual changes
towards scientific understanding
Epistemological
changes
Ontological changes

31
The instructional process, was conducted one week after the pre-test, it was an
attempt to support and develop the children‟s conceptual understanding of
floating and sinking. The teaching approach will be collaborative, using guided
discovery learning. Collaborative work places emphasis on social interaction
during the sessions, on one‟s own judgments, and on discussions with peers that
help to create situations where cognitive conflict can occur through discussions
and sharing meanings. The children had an opportunity to express their current
ideas, to make their predictions about flotation, explore the phenomenon with the
concrete materials and, afterwards, to give their explanations.
After the test was administered to the students and the items had been marked the
scores were analyzed The most appropriate method of testing conceptual
understanding was the one the learners were able to create an initiative to inquire
more of the topic, the learners expose their misconceptions clearly and the
learners can be able to argue well over the topic concepts. The findings obtained
in the study will have to be applied in order to improve the achievement of the
students in physics

32
CHAPTER THREE
METHODOLOGY
3.1 Introduction
This chapter was dealing with research design, the study area population and
sample, research instruments for data collection and data analysis procedures.
3.2 Research design
The study employed the comparative case study design which will involve pretest,
instruction process and finally post-test. The purpose of the pretest was to
determine the children‟s existing knowledge and experiences of floating and
sinking. The students were also given a questioner to respond to in order to
understand their background. The instructional process was conducted one week
after the pre-test, it was an attempt to support and develop the children‟s
conceptual understanding of floating and sinking. The teaching approach was
collaborative, using guided discovery learning. Collaborative work places
emphasis on social interaction during the sessions, on one‟s own judgments‟, and
on discussions with peers that help to create situations where cognitive conflict
can occur through discussions and sharing meanings. In this study the guided
discovery approach to learning was applied using a problem based approach, in
which the children actively participated in solving the problems of sinking and
floating. The children had an opportunity to express their current ideas, to make

33
their predictions about flotation, explore the phenomenon with the concrete
materials and, afterwards, give their explanations.
3.3 Population
The population of the study consisted of form 3 students in Mbooni east who take
physics. The area has 40 secondary schools .The students were pretested then
instruction was conducted then post tested and results analyzed.
3.4 The study sample
The study area has 40 secondary schools in which the study was done in one of
the secondary school in Mbooni East which was selected randomly. The study
employed two stage cluster sampling technique. Where by stage 1 involved
choosing the school where the study was to be conducted the stage 2 involved
selecting 30 students who took part in the study. The selection of the students was
done randomly.
3.5 Research instruments
The research instruments t used in this study were short questioner for the
students to study their demographic background and three different types of tests
to test the conceptual changes in the learners namely;
objective questions,
essay questions,
Experimental tests

34
The questioner is at appendix I; all the tests are found at appendix II and their
marking schemes at appendix III.
3.6 Data collection procedure
The data collection procedure involved designing the tests which the researcher
personally, administered the exams and then marking the scripts .The learners
were also given a questioner to respond to. The results of the marked scripts will
form the data for research.
3.7 Methods of data analysis
Once the tests were done, they were marked according to a prepared marking
scheme and the scores obtained by the learners in the both tests formed the
research data. The data was used to investigate the most appropriate method of
testing conceptual understanding.
The data was entered into a computer for analysis using statistical package for
social scientists (SPSS) the data analysis was done using t-test for proportions and
analysis of variance (ANOVA) and reported using frequency distribution,
histograms and tables.

35
CHAPTER FOUR
DATA REPRESENTATION AND ANALYSIS
4.1 Introduction
This chapter contains the data analysis method to arrive at the conclusion of the
study. The study was to investigate the most effective method to elicit conceptual
understanding in the concept of floating and sinking in form three students in
Mbooni East District.
The data analysis for the study was conducted sing data collected from 30
students in one particular school which was selected randomly .The data analysis
procedure and major findings of the study are discussed below as per each
research question.
4.2 Distribution of scores
The first research question was to investigate if there was a change in the results
obtained in the post-test from the pre-test scores.
This would establish whether the subjects were homogeneous or otherwise (but
not to what extent since the variable was not examined in this study). The
distribution of the scores was reported using tables and graphs for both post-test
and pre-test scores.

36
Table 1: Results for Pre-test using experimental test experiment test
Pre-test for Experiment Test
Frequency Per cent Valid Per cent Cumulative Per
cent
Valid
7 1 10.0 10.0 10.0
9 3 30.0 30.0 40.0
10 2 20.0 20.0 60.0
11 1 10.0 10.0 70.0
12 1 10.0 10.0 80.0
13 1 10.0 10.0 90.0
14 1 10.0 10.0 100.0
Total 10 100.0 100.0
In the experimental pre-test results it can be seen that the mean score was 10.4
with a standard deviation of ±2.119. It can also be seen that 60% of the learners
scored less than the mean mark while 40% scored above the mean mark. The
above information has also been represented using a graph below.

37
Figure 2: Pre-test using experimental test experiment test
It can be seen from the graph the scores ranged 7 to 15.it was able to execute a
normal curve performance. The performance was homogenous with the scores
well distributed. 50% of the students lied below the mean while the other 50% lies
above the mean.

38
Table 2: Score distribution for Post-test for experiment test
Post-test for Experiment Test
Frequency Per cent Valid Per cent Cumulative Per
cent
Valid
11 2 20.0 20.0 20.0
12 2 20.0 20.0 40.0
14 1 10.0 10.0 50.0
15 2 20.0 20.0 70.0
16 1 10.0 10.0 80.0
17 2 20.0 20.0 100.0
Total 10 100.0 100.0
From the post-test the mean score was 14 and a standard deviation of ±2.357.it
can also be seen that 50% of the students score above the mean. The scores were
uniformly spread.

39
Figure 3: Distribution for Post-test for experiment test
The score distribution ranged between 11 to 17 the performance was actually a
homogenous performance. The scores were all alike and well distributed.
However no student scored 13

40
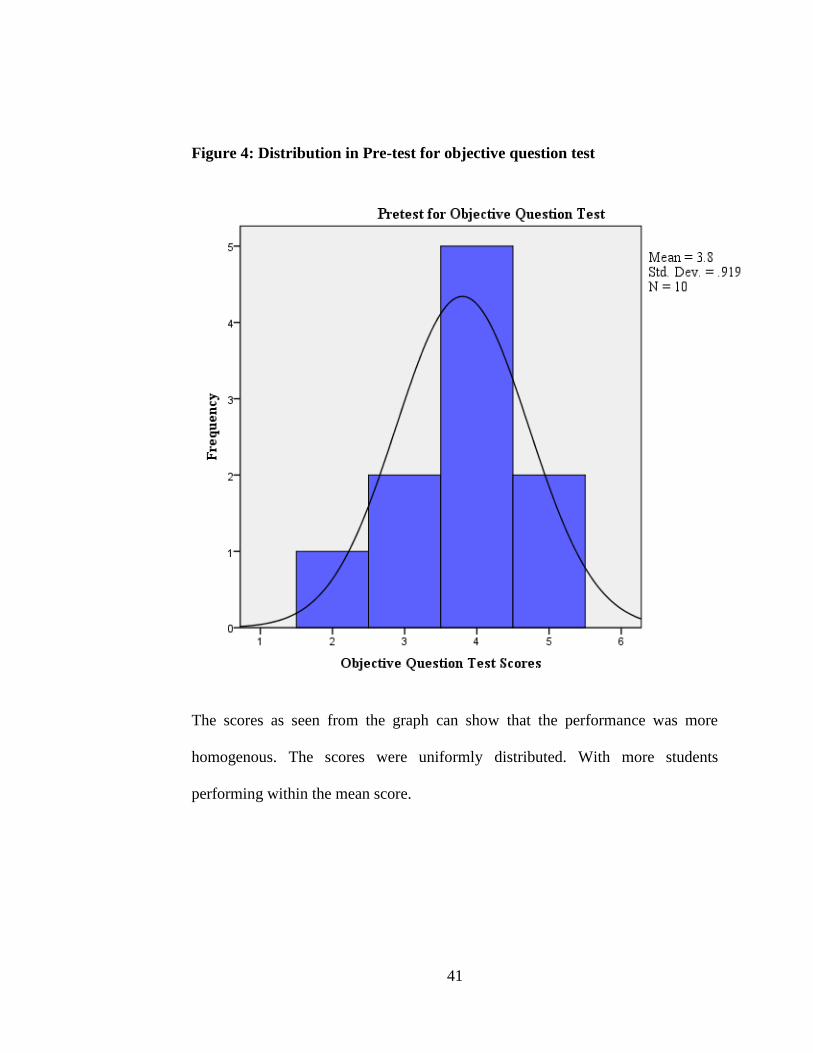
Table 3: The score distribution in Pre-test for objective question test
Pre-test for Objective Question Test
Frequency Per cent Valid Per cent Cumulative Per
cent
Valid
2 1 10.0 10.0 10.0
3 2 20.0 20.0 30.0
4 5 50.0 50.0 80.0
5 2 20.0 20.0 100.0
Total 10 100.0 100.0
As it can be seen from the above table, the performance for the pre-test for
objective questions was a homogeneous performance. The mean score was 3.8
and a standard deviation of ± 0.917 the graph for frequency against score for pre-
test scores in objective questions can be shown below.
41
Figure 4: Distribution in Pre-test for objective question test
The scores as seen from the graph can show that the performance was more
homogenous. The scores were uniformly distributed. With more students
performing within the mean score.
42
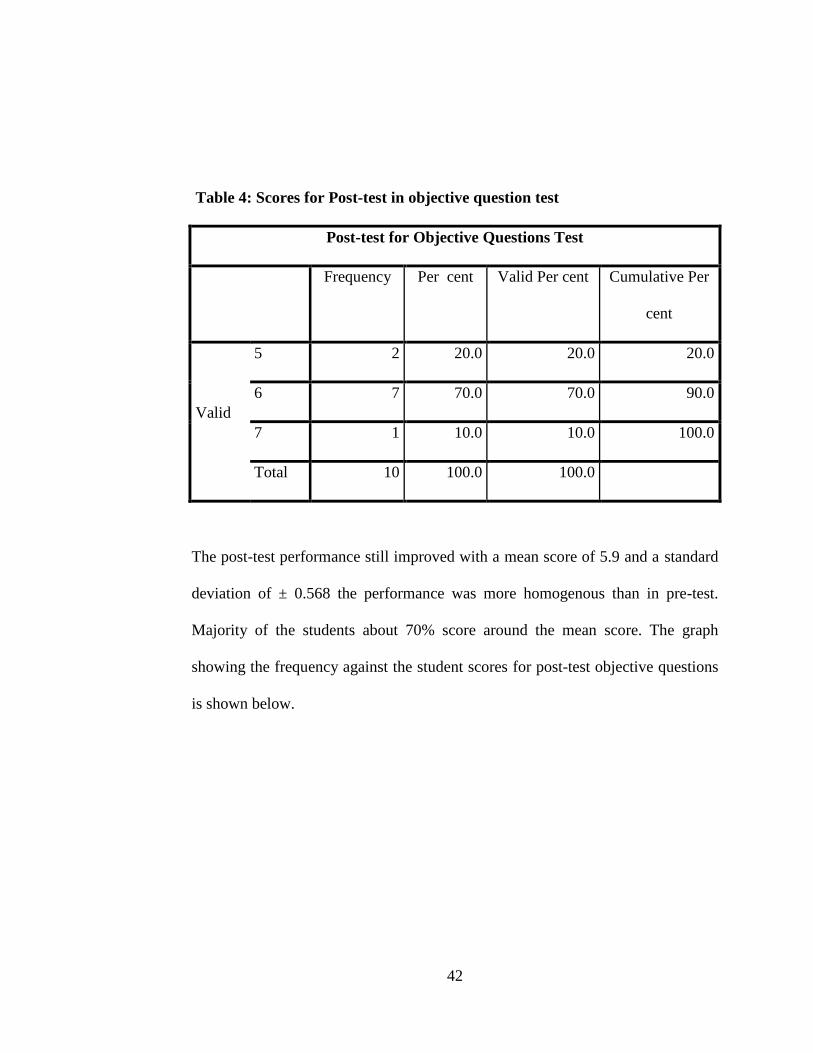
Table 4: Scores for Post-test in objective question test
Post-test for Objective Questions Test
Frequency Per cent Valid Per cent Cumulative Per
cent
Valid
5 2 20.0 20.0 20.0
6 7 70.0 70.0 90.0
7 1 10.0 10.0 100.0
Total 10 100.0 100.0
The post-test performance still improved with a mean score of 5.9 and a standard
deviation of ± 0.568 the performance was more homogenous than in pre-test.
Majority of the students about 70% score around the mean score. The graph
showing the frequency against the student scores for post-test objective questions
is shown below.

43
Figure 5: Scores for post-test in objective question test
The scores were well distributed. The performance was homogenous performance
with the highest number of students lying within the mean score.

44
Table 5: Results for Pre-test in an essay test
Pre-test for Essay Test
Frequency Per cent Valid Per cent Cumulative Per
cent
Valid
0 1 10.0 10.0 10.0
1 5 50.0 50.0 60.0
2 1 10.0 10.0 70.0
3 1 10.0 10.0 80.0
4 1 10.0 10.0 90.0
7 1 10.0 10.0 100.0
Total 10 100.0 100.0
As it can be seen from the table the essay pre-test, the performance was
heterogeneous. With a mean score of 2.1 and a standard deviation of ± 2.079.the
performance was skewed to the left since 70% of the students scored less than the
means score. The graph shown below shows the frequency against the student
scores.

45
Figure 6: Results for Pre-test in an essay test
The performance was somehow skewed toward the left though the performance
was somehow homogenous, more students performed below the mean score

46
Table 6: Results for post-test in an essay test
Post-test for Essay Test
Frequency Per cent Valid Per cent Cumulative Per
cent
Valid
3 2 20.0 20.0 20.0
4 1 10.0 10.0 30.0
5 1 10.0 10.0 40.0
6 3 30.0 30.0 70.0
7 1 10.0 10.0 80.0
9 1 10.0 10.0 90.0
17 1 10.0 10.0 100.0
Total 10 100.0 100.0
In post-test, the performance improved the mean score was 6.6 and a standard
deviation of ± 4.088.It can be seen that the performance was widely spread but the
performance was still skewed to the left since 70% of the students still scored
below the mean score. The graph below shows the frequency against test scores.

47
Figure 7: Results for post-test in an essay test
The performance was more heterogeneous since the score were not uniformly
distributed. More students scored less than the mean score. The score ranged
between 3 and 10. But only one student scored 17.

48
4.3 The statistical analysis for the scores for both post and pre-test in science
The second research question was dealing with the statistical analysis of the
scores, measures central tendency and measures of dispersion which can be
shown in the table shown below.
Table 7: Statistical analysis for both post and pre-test in all categories
Statistics
Pre-test for
Experiment
Test
Post-test
for
Experiment
Test
Pre-test
for
Objective
Question
Test
Post-test
for
Objective
Question
Test
Pre-
test
for
Essay
Test
Post-
test for
Essay
Test
N 10 10 10 10 10 10
Mean 10.40 14.00 3.80 5.90 2.10 6.60
Median 10.00 14.50 4.00 6.00 1.00 6.00
Std.
Deviation
2.119 2.357 .919 .568 2.079 4.088
Variance 4.489 5.556 .844 .322 4.322 16.711
Minimum 7 11 2 5 0 3
Maximum 14 17 5 7 7 17

49
It can be seen that the mean scores improved in the post-test from pre-test with
the highest mean score in objective with a mean score of 84%by experimental
with a mean score of 82% and the least in essay question in both pre-test and post-
test 12% and 35%.the objective test produced the highest improvement index of
30% The standard deviations also increased in both experimental and essay but
decreased in objective questions. The standard deviations improved in essay
questions with greater index.
4.4 The most effective method to elicit the conceptual understanding science
Since the design of the study was within subject (i.e. one subject was pretested
and post-tested), a paired t-test was used to compare the performance for both
post and pre-test results across the methods. This helped to eliminate the error of
between different subjects. To examine if there existed any significant difference
between pre-test and post-test groups, a paired sample t-test was applied. The
analysis was reported using tables as shown below.

50
Table 8: Showing a paired t-test for experimental testing
Paired Samples Test
Paired Differences T df Sig.
(2-
tailed)
Mea
n
Std.
Deviati
on
Std.
Error
Mean
95%
Confidence
Interval of the
Difference
Lowe
r
Upper
Pair
1
Pre-test for
Experiment
Test - post-
test for
Experiment
Test
-
3.60
0
1.897 .600 -
4.957 -2.243
-
6.00
0
9 .000
There is a statistically significant difference between pre and post-test since .000
is less than is less than the critical value of 0.001 at the degree of freedom of 9
and confidence level of 0.05. Hence we can conclude than the treatment worked
better (yields positive results).
51
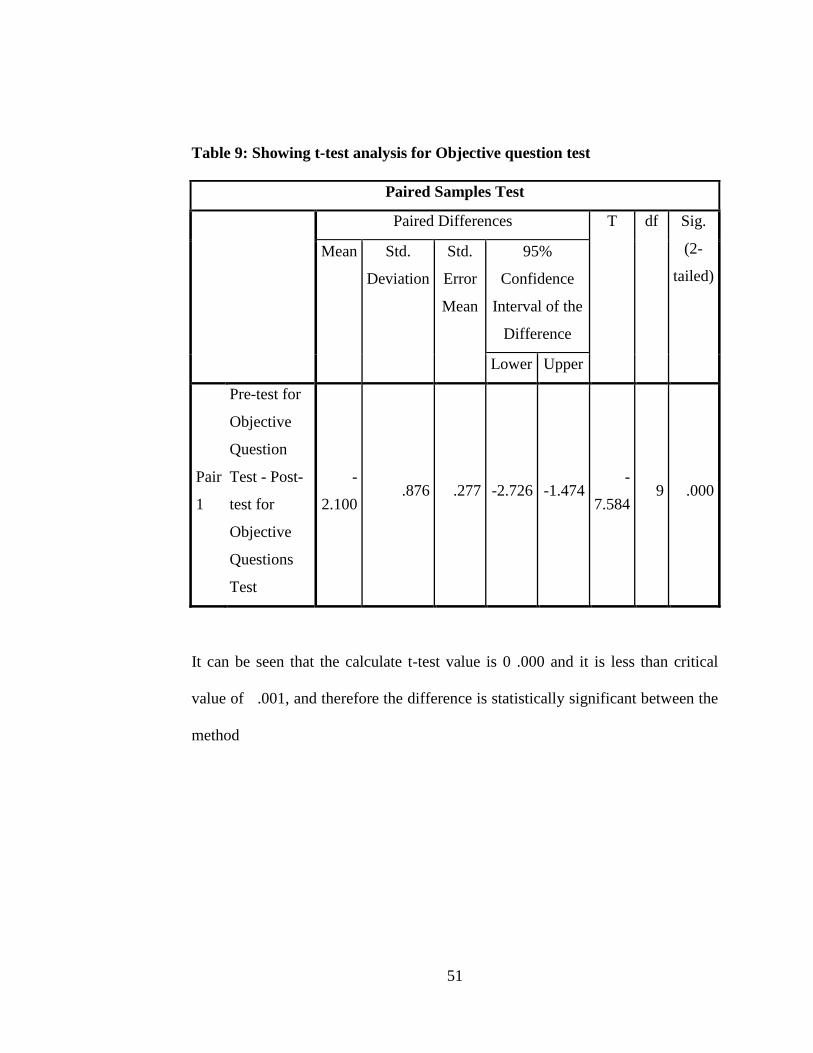
Table 9: Showing t-test analysis for Objective question test
Paired Samples Test
Paired Differences T df Sig.
(2-
tailed)
Mean Std.
Deviation
Std.
Error
Mean
95%
Confidence
Interval of the
Difference
Lower Upper
Pair
1
Pre-test for
Objective
Question
Test - Post-
test for
Objective
Questions
Test
-
2.100 .876 .277 -2.726 -1.474
-
7.584 9 .000
It can be seen that the calculate t-test value is 0 .000 and it is less than critical
value of .001, and therefore the difference is statistically significant between the
method

52
Table 10: Showing a paired t-test for Essay Test
Paired Samples Test
Paired Differences T Df Sig.
(2-
tailed) Mean Std.
Deviation
Std.
Error
Mean
95%
Confidence
Interval of the
Difference
Lower Upper
Pair
1
Pre-test for
Essay Test -
post-test for
Essay Test
-
4.500 2.759 .872 -6.474 -2.526
-
5.158 9 .001
It can be seen that the calculated value is 0.001 and it is the same as the critical
value at the confidence level of 0.05 and a degree of freedom of 9 which is 0.001,
then this implies that there is no statistical significance among the post and pre-
test scores hence the treatment yields a negative results. Further analysis was
done using analysis of variance as it can be seen below.

53
Table 11: Showing ANOVA tables
i) Pre-test for Experiment Test
ii) Post -test for Experiment Test
Sum of
Squares
df Mean
Square
F Sig.
Between
Groups 33.400 5 6.680 3.817 .109
Within Groups 7.000 4 1.750
Total 40.400 9
Sum of
Squares
df Mean
Square
F Sig.
Between
Groups 43.500 6 7.250 3.346 .175
Within Groups 6.500 3 2.167
Total 50.000 9
iii) Pre-test for Objective Question Test
Sum of
Squares
Df Mean
Square
F Sig.
Between
Groups 1.600 2 .800 .933 .437
Within Groups 6.000 7 .857
Total 7.600 9

54
iv) Post-test for Objective Questions Test
Sum of
Squares
df Mean
Square
F Sig.
Between
Groups .900 3 .300 .900 .494
Within Groups 2.000 6 .333
Total 2.900 9
v) Pre-test for Essay Test
Sum of
Squares
Df Mean
Square
F Sig.
Between
Groups 34.233 6 5.706 3.668 .157
Within Groups 4.667 3 1.556
Total 38.900 9
vi) Post-test for Essay Test
Sum of
Squares
Df Mean
Square
F Sig.
Between
Groups 123.200 5 24.640 3.624 .118
Within Groups 27.200 4 6.800
Total 150.400 9

55
From the above tables generated us ANOVA it can be seen that the F value for
pre-test was as follows 3.817, 0.9333 and 3.668 for experimental, objective and
essay testing respectively with respective levels of significance 0.109, 0.437 and
0.157. While for post-test was the F values were 3.346, 0.900 and 3.624 and
significance index of 0.175, 0.494 and 0.118 for experimental, objective and essay
testing respectively all had a degree of freedom of 9.
4.6 Factors that may influence the conceptual understanding of the learners
science
This was done by investigating the demographic factors for the leaners. This was
done by use of a questioner. It was noted that all the learners were form three
boys from a public school which is an extra county school.
The first question was investigating whether one attended a primary public school
or a private school.it was discovered that out of 30 students, 20 attended public
schools while 10 private schools.
It was also sought to know those who were borders and those were day
scholars.13 of those attended public schools were day scholars while 10 of them
were borders while those who attended private schools 7 were day scholars while
3 were borders.
The other question sought to know about the family back ground and the social
economic factors and the response was as follows.

56
Table 12: Showing the occupation of the parents of the learners
Employed Business Peasant Deceased
Father 16 3 9 2
Mother 11 8 9 1
This shows that over 50% of the students their fathers are working class, 10%
business men while 30% are peasants and about 40% their mothers are a working
class, 27% do business and 30% are peasants.
Table 13: Educational level of the parents
primary secondary
Father 0 7 16 3 5
Mother 2 5 11 11 2
It was also required to know if the students were sponsored or the parents pays
their school fees. Out 30 respondents‟ only three were sponsored.
Table 14: when they do understand physics concept best
When teachers are teaching 4
During discussion with friends 21
Reading alone 5
It can be seen that 70% of the students understand well when they discuss with
their peers, 17% when they read on themselves while 13% when teaching.

57
Table 15: Concerning those who influenced them to take physics
Parents 3
Friends 1
Self 24
Religious leaders 0
Other reasons 2
It can be seen that 80% of the students who take physics choose out of their will
while 10% were influenced by their parents but none was influenced by their
religious leaders

58
CHAPTER FIVE
DISCUSSION, RECOMMENDATION AND CONCLUSION
5.1 introduction
This chapter contains a summary of findings of the study of effectiveness of the
methods of testing conceptual understanding of the students in physics in the
concept of floating and sinking in Mbooni east district. The data was collected
from a sample and analyzed.
The study findings are being compared with other research work done elsewhere
either in the country or outside. There after a recommendation to various stake
holders in education sector concerning more inventions and pulling scarce
resources towards enhancing improvements of physics performance in secondary
schools and finally conclusion
The researcher also made some suggestions of other studies of similar aims in
other parts of the country.
5.2 Generalization
5.2.1 Internal validity
The study was aimed at investigating the most effective method of testing
conceptual understanding in physics. The study was done by use of three types of
59
tests namely experimental, objective and essay.in each case the sample was
pretest, given the same instructional technique and there after post tested.
The purpose of pretesting was to investigate whether the students had a prior
knowledge on the concept of floating and sinking or not. It was found in all the
three methods the learners were able to show out some elements of having prior
knowledge on the concept of floating and sinking.it was also able to show out
clearly that there was a bit of misconception especially in the reasons why a body
sinks or floats. The learners also had a problem in understanding the concept of
buoyancy. Out of the three methods, the objective testing was able to elicit prior
knowledge from the learners since the performance of the learners depicted a
normal curve. Followed by the experimental testing since objective test produced
the lowest F value and highest significance value. In the post testing, the
researcher was investigating whether a conceptual change has taken place after
instruction.it was discovered that in all the cases there was an improvement of the
mean scores and standard deviations this implied that a conceptual change has
taken place after instructional process. Therefore this question was well answered
by the study
The researcher‟s big question was, out of these three methods which method is
more effective in testing the conceptual change; this was done by carrying out t-
test for proportions and ANOVA using the SPSS programmer. For both objective
and experimental testing yielded to a positive change but for essay it produced a

60
negative response from the t-test. This means that essay test can‟t be used to test
conceptual change. From ANOVA it was seen that objective questions produced
the lowest F value and the highest significance index hence it is able to test
conceptual understanding.
Therefore the study had an internal validity since it was able to measure what it
ought to measure.
5.2.2 External validity
The results of this study can be statistically generalized since among the students
population all the factors that influence conceptual understanding in the concept
of floating and sinking are all significant. This can be attributed to a relatively
larger sample population. The only challenge is that the population of study was
cutting across boys there it might cause some biasness in making the general
statement.
To address this challenge in future, it will be necessary to randomly select both
boys and girls in order to eliminate the bias and ensure that the findings can be
extrapolated to a larger population.
5.3 Discussion of the findings
5.3.1 The most appropriate method to elicit prior in science
It was found in pretest the following results were obtained.in the experimental test the
mean score was 10.4 with a standard deviation of ±2.119 while in objective questions

61
the mean score was 3.8 with a standard deviation of ± 0.919 and finally the essay
questions with a mean of 2.1 and a standard deviation of ±2.079. This was a very
clear indication that the learners possess some prior knowledge however the main
agenda here was to investigate which one would be a better method to elicit prior
knowledge from the learners. This was done by use of paired t-test and ANOVA
and it was found that both experimental and objective test produced positive
results while the essay questions gave a negative results. When a further test was
done using ANOVA the F value for experimental was 3.668 with a P of value
0.109 done at a degree of freedom of 9 while the objective test had an F value of
0.933 and a P value of 0.437 done at a degree of freedom of 9. This results clearly
indicated that the objective questions had a better ability to elicit prior knowledge
from the learners.
5.3.2 The most appropriate method to test conceptual understanding science
The pretest scores displayed homogenous distribution. The scores were well
distributed assuming a normal curve.it was also found that the students‟ scores for
the posttest marked an improvement of the scores from posttest test in all the tests
.this is a clear indication that there was a change on the conceptual understanding
for the learners. The mean and the score distribution of the tests in posttest for all
the test were as follows for experimental tests was found to be 14 and a standard
deviation of ±2.357 In objective questions, the mean score was found to be 5.9
and a standard deviation of ±0.568 the scores for objective test were more

62
concentrated around the mean In essay questions, while in the post- test the mean
was 6.6 and a standard deviation of 4.088.for pretest the scores were less spread
but in post- test the scores were more spread.
The main objective was to investigate the most appropriate method of testing the
conceptual understanding.in this attempt, a paired t –test and ANOVA tests ware
done and it was discovered that the objective and experimental tests, they
produced a positive change while the essay questions produced a negative change.
This implied that the essay testing is not a good test for testing conceptual
knowledge. But objective and experimental testing are able to elicit conceptual
understanding. However it was observed that, for objective questioning, the
scores were more concentrated around the mean and it produced the F value of
0.900 with a degree of freedom of 9 in posttest with significance 0.494
respectively while in experimental method the scores were well distributed when
the ANOVA test was done, the F values obtained were 3.624 with a degree of
freedom of 9 in posttest and pretest respectively and significance index of 0.175.
Therefore, the objective test was able to elicit the prior knowledge and measure
the conceptual understanding better than all the experimental testing.
5.4 Factors affecting learner’s conceptual understanding science
It has been discovered that the conceptual understanding is not only affected by
the instructional methods only but also by other factors such as the type of the
school, culture of the school, the family background and the peer influence.

63
It was found that the respondent in this case all were from the same school
environment, the same type of the school. However their family back ground and
social economic varied. This greatly affected the language used in explanations
and prior knowledge due to the kind of experiences one has come across from
child hood.10% of the respondents were sponsored meaning that they come from
a humble back ground and therefore
It was also discovered that 70% of the learners understand well when then they
discuss with their peers, 17% when they read themselves while 13% are able
understand when they read on themselves. 80% 0f the learners choose physics out
their own self-drive this means that the population that the researcher used was
self-motivated to take physics.
5.5 Contribution of the study to the theoretical framework
The researcher employed two theories in the study namely constructivist theory of
teaching and learning and classical test theory. From the pretest the researcher
discovered that the learners always possess some scientific knowledge about the
topic of floating and sinking as result it is always necessary for the teachers to
build what the learners know. According to driver, leach, Asoko ,Mortimer and
Scott, the researcher also agreed with them that children will always have some
representations of many phenomena studied in school science based on their
experience.

64
The classical test theory was also applied in the scoring of the test especially in
objective questions where the learners were prone to guess work hence it helped
to obtain the true score of the learner‟s performance.
5.6 Recommendations
Since it was found that testing learners before instruction and after instruction
yielded a positive change, and can also have a great impact on the conceptual
understanding, since the teacher will have an understanding of the learners
misconception‟s and their prior knowledge. The researcher makes the following
recommendations.
i) The researcher recommends that it is necessary for teachers to give a
pretest exam to the learners before commencing any instructional
process in order to determine the depth of the learner‟s prior
knowledge.
ii) The researcher further recommends that the same test should be
administered to the learners after instruction in order to establish the
depth of conceptual understanding.
iii) The researcher recommends to the education stake holders to make a
requirement for the teachers to set up such tests for pretesting and post
testing in every topic in order to be able to establish the conceptual
changes

65
iv) The teacher training colleges and universities should make it as a part
of their requirement especially during teaching practice that the set
tests to be administered before instruction and after instruction and
make a record of such performance.
5.7 Further research
Further researcher should be carried out in other districts and find out if the same
findings will be achieved.it should also be done using the other topics in physics
and if possible extended to the other science subject and see its practicability in
the entire syllabus.
It is also important that the process can be repeated using other methods of
instructions and compare the results with the results in this study.
5.8 Conclusion
The researcher found that there is a positive correlation in the results obtained in
the pretest and posttest in all the tests. The method of instruction employed in this
case yielded a positive result in conceptual understanding. It was noted further
that objective testing yielded to a better method of testing thee conceptual
understanding since the performance was a normal curve with more students
concentrating around the mean and with the lowest F value and the highest
significance index. The learners also took a shorter time to do the test implying
that it is more convenient to be administered at the start of the topic. This method

66
of teaching and learning is able to cultivate positive attitude to the learners and
motivate the learners to do well in science subjects. Therefore it is worthy method
of teaching and learning.

67
REFERENCES
AERA, APA, & NCME (1999). Standards for educational and psychological
testing. Washington, D.C.
Anastasia, A. (1988). Psychological testing. New York: Macmillan
Ausubel, D.P and Robinson F.G. (1969). School Learning. An Introduction to
Educational Psychology (New York: Holt, Rinehart and Winston
Bejar, I. (1983). Subject matter experts‟ assessment of item statistics. Applied
Psychological Measurement, 7, 303-310 Bjorner, J.B.; Kosinski, M.; Ware
Berry, J. W., Poortinga, Y. P., & Segall, M. G. H. (1992). Cross cultural
psychology. Cambridge: Cambridge University Press.
Bettman, J. and Park, C. W. (1980) "Effects of Prior Knowledge and Experience
and Phase of Choice Process on Consumer Decision Processes A Protocol
Analysis," Journal of Consumer Research, 7:234-247.
Biddulph, F. & Osborne, R. (1984). Children's Questions and Science Teaching:
an alternative Approach. Learning in Science Project. Working Paper No
117. Waikato University Science
Bodner, G. M. (1986). Constructivism: A theory of knowledge, Journal of
Chemical Education, 63(10), 873-878.
Boivin, M. J., Giordani, B., & Bornefeld, B. (1995). Use of the tactual
performance test for cognitive ability testing with African children.

68
Boulter, C.J. (2000). Language, models and modelling in the primary science
classroom. In J.K.
Boulter, C.J. and Gilbert J.K. (1995). Argument and science education. In P.J.
Costello and S. Mitchell (eds.) Competing and Consensual Voices: The
Theory and Practice of Argument (Clevedon: Multilingual Matters), 84–
98.
Brucks, M. "The Effects of Product Class Knowledge of Information Search
Behavior," (Forthcoming, Journal of Consumer Research).
Çalık, M. & Ayas, A. (2005). A comparison of level of understanding of eight-
grade students and science student teachers related to selected chemistry
concepts, Journal of Research in Science Teaching (in press).
Carey, S. (1985). Conceptual Change in Childhood. Cambridge, MA: MIT Press
Crowder, E.M., & Newman, D. (1993). Telling what they know: the role
of gesture and language in children‟s scientific explanations. Pragmatics
and Cognition, 1, 341-376.
Cattell, R. B. (1940). A culture free intelligence test. Part I. Journal of
Educational Psychology, 31, 161–179.
Chi, M.T.H. (1997). Quantifying qualitative analyses of verbal data: a practical
guide. The Journal of Learning Sciences, 6(3), 271–315.

69
Chiesi, H, Spilich, G. & Voss, J. T. (1979) "Acquisition of Domain Related
Information in Relation to High and Low Domain Knowledge," Journal of
Verbal Learning and Verbal Behavior, 18:257-273.
Cohen, R. A. (1969). Conceptual styles, culture conflict, and non-verbal tests.
American Anthropologist, 71, 828–856.
Cole, M. (1999). Culture-free versus culture-based measures of cognition. In R. J.
Sternberg (Ed.), the nature of cognition (pp.645–664). MIT Press.
Collins, A. Brown J. & Newman S.E (1990) cognitive apprenticeship: teaching
the crafts of reading, writing and mathematics.
Costu, B. & Ayas, A. (2005) Evaporation in different liquids: secondary students'
conceptions, Research in Science & Technological Education, 23(1), 73-
95.
Cronbach, L.J.; Shavelson, R.J. (2004). My Current Thoughts on Coefficient
Alpha and Successor Procedures. Educational and Psychological
Measurement, 64(3), 391-418
Cultural [Appraisal of practical and culture-free intelligence]. Madrid: Tea
Ediciones
Driver, R. & Easley, J. (1978). Pupils and Paradigms: a Review of Literature
Related to Conceptual Development in Adolescent Science Students.
Studies in Science Education, 5,61-84.

70
Driver, R. & Erickson, G. (1983). Theories in Action: Some Theoretical and
Empirical Issues in The Study of Students, Conceptual Frameworks in
Science, Studies in Science Education, 10, 37-60.
Driver, R. and Oldham, V. (1986). A constructivist approach to curriculum
development in science. Studies in Science Education, 13, 105–122.
Driver, R., & Bell, B. (1986). Students‟ thinking and the learning of science: a
constructivist view. SSR, 443-455.
Driver, R., Asoko, H., Leach, J., Mortimer, E., & Scott, P. (1994). Constructing
Scientific knowledge in the classroom. Educational Researcher, 23:7, 5-
12.
Duit, R. and Treagust, D. (2003). Conceptual change: a powerful framework for
improving science teaching and learning. International Journal of Science
Education, 25(6), 671–688. Education Research Unit, Hamilton, New
Zealand.
Fiske, S., Kinder, D., and Larter, W. (1983) "The Novice and the Expert:
Knowledge Based Strategies in political Cognition," Journal of
Experimental Social Psychology, 19:381-400.
Fleer, M. (1999). Children's alternative views: Alternative to what? International
Journal of Science Education, 21(2): 119-135.

71
Gaeth, G. and Shanteau, J. (1984). "Reducing the Influence of Irrelevant
Information on Experienced Decision Makers," Organizational Behavior
and Human Performance, 33:263-282.
Geelan, D.R. (1995). Matrix Technique: A Constructivist Approach to
Curriculum Development in Science. Australian Science Teachers
Journal, 41(3), 32-37.
Giddens, A. (1997): Sociology. Polity Press, Cambridge.
Gilbert and C.J. Boulter (eds.) Developing Models in Science Education
(Dordrecht: Kluwer Academic Publishers), 289–305.
Gürdal, A. & Macaroglu, E. (1997). The Teaching of the Concepts Floating and
Sinking According to the Cognitive Developmental Stage of the Child,
Marmara University Journal of Science, 10, 9-20.
Halford, G.S., Brown, C.A. & Thompson, R.M. (1986). Children's concepts of
volume and flotation. Developmental Psychology, 22, 218-222.
Halldén, O. (1999). Conceptual change and contextualization. In W. Schnotz, S.
Vosniadou and M. Carretero (eds.) New Perspectives on Conceptual
Change (Oxford: Pergamon and Earli), 53–65.
Harris, M. (1983). Culture, people, nature: An introduction to general
anthropology (3rd ed.). New York: Harper and Row.

72
Havu, S. (2000). Changes in children‟s conceptions through social interaction in
pre-school education. Publications in Education no 60 (Joensuu:
University of Joensuu).
Hewson, M.G. & Hewson, P.W. (1983). Effect of instruction using students' prior
knowledge and conceptual change strategies on science learning. Journal
of Research in Science Teaching, 20, 731-743.
Hudson, W. (1960). Pictorial depth perception in subcultural Crampton, A., &
Jerabek, I. (2000). Culture-Fair IQ Test. Plumeus Inc.
Inhelder, B & Piaget, J. (1958). The growth of logical thinking from childhood to
adolescence. London: Routledge & Kegan Paul.
Irvine, S. H., & Berry, J. W. (Eds.). (1988). Human abilities in cultural context.
New York: Cambridge University Press.
Jensen, A. (1980). Bias in mental testing. New York: Free Press.
Johnson, E. and Russo, J. (1984) "Product Familiarity and Learning New
Information," Journal of Consumer Research 11(1):542-550.
Kariotogloy, P., Koumaras, P. & Psillos, D. (1993). A constructivist approach for
teaching fluid phenomena. Physics Education, 28, 164-169.
King, A (1994).Autonomy and questions asking: The role of personal control in
students generated questioning.
73
Kohn, A. S. (1993). Preschoolers‟ reasoning about density: Will it float? Child
Development, 64, 1637–1650., 45–69.
Limon, M, & Mason, L. (2002). Reconsidering Conceptual Change: Issues in
Theory and Practice. Dordrecht, Netherlands: Kluwer Academic
Publishers.
Macaroglu, E. & Sentürk, K. (2001). Development of Sinking and Floating
Concepts in Students' Mind. Symposium on Science Education in New
Millennium, Education Faculty of Maltepe University, Istanbul, Turkey.
Mc Bridge, N. (2001, May). An Item Response Theory Analysis of the Scales
from the International Personality Item Pool and the Neo Personality
Inventory. Virginia, USA.
Miller, R. J. (1973). Cross-cultural research in the perception of pictorial at
aerials. Psychological Bulletin, 80, 135–150.
Nakhleh, M.B. (1992). Why some students don't learn chemistry? Journal of
Chemical Education, 69(3) 191-196.
Neuropsychology, 9, 409–417.Brislin, R. W. (1983). Cross-cultural research in
psychology. Annual Review of Psychology, 34, 363–400.
Osborne, R. (1982). Science education: Where do we start? The Australian
Science Teachers' Journal, 28(1): 21-30.

74
Osborne, R., & Freyberg, P. (1985). Learning in Science: the implications of
children‟s science. Auckland: Heinemann Publishers.
Osborne, R.J. & Wittrock, M.C. (1983). Learning science: A Generative Process,
Science Education, 67(4), 489-508.
Palinesar, A.S & Brown A.L (1984). Reciprocal teaching a process of reading
comprehension monitoring strategies.
Palmer, D. (2001). Students' alternative conceptions and scientifically acceptable
conceptions about gravity, International Journal of Science Education, 23
(7), 691-706.
Pintrich, P. R., Marx, R. W., & Boyle, R. A. (1993). Beyond cold conceptual
change: the role of motivational beliefs and classroom contextual factors
in the process of conceptual change. Review of Educational Research,
63:2, 167-199.
Posner, G. J., Strike, K. A., Hewson, P. W., Gertzog, W. A. (1982).
Accommodation of a scientific conception: toward a theory of conceptual
change. Science Education, 66:2, 211- 227.
Rowell, J. A. & Dawson, C. J. (1981). Volume, Conservation and Instruction: A
Classroom Based Solomon Four Group Study of Conflict. Journal of
Research in Science Teaching, 8,53,35,46.

75
Rowell, J.A., & Dawson, C.J. (1977a). Teaching about floating and sinking: An
attempt to link cognitive psychology with classroom practice. Science
Education, 61, 245-253.
Rowell, J.A., & Dawson, C.J. (1977b). Teaching about floating and sinking:
Further studies toward closing the gap between cognitive psychology and
classroom practice. Science Education, 61, 527-540.
Rumelhart, D. E., & Norman, D. A. (1978). Accretion, Tuning and Restructuring:
Three modes of learning. In J. W. Cotton, & R. L. Klatzky (Eds.)
Semantic Factors in Cognition (pp.37-53) Hillsdale, NJ: Lawrence
Erlbaum Associates Publishing.
Scott, J.S.; Mead, A.D. (2011). Foundations for Measurement. In N. Tippins, & S.
Adler, Technology-Enhanced Assessment of Talent (1st ed.). CA, USA:
Jossey-Bass, Wiley, 21-66.
Sharp, J. G. & Kuerbis, P. (2006). Children‟s ideas about the solar system and the
chaos in learning science. Science Education, 90:1, 124-147.
Simington, D. (1983). An analyses of the LISP unit -floating and sinking.
Learning in Science Project. Working Paper No 118. Waikato University
Science Education Research Unit, Hamilton, New Zealand.
Singer, (1978) Active compression from answering to questioning.

76
Smith, C., Carey, S. & Wiser, M. (1985). On differentiation: A case study of the
development of the concepts of size, weight, and density. Cognition, 21,
177-237.
Smith, C., Carey, S., & Wiser, M. (1985). On differentiation: A case study of the
development of the concepts of size, weight, and density. Cognition,21,
177–237.
Smith, C., Snir, J. & Grosslight, L. (1992). Using conceptual models to facilitate
conceptual change: The case of weight-density differentiation. Cognition
and Instruction, 9, 221-283.
Steyer, R. (1999). Steyer, R. Classical (Psychometric) Test Theory. Jena,
Germany
Suen, H. K. (1990). Principles of Test Theories. Hillsdale, NJ: Lawrence Erlbaum
Taboada & John. T.G (2006).Contributions of student questioning and prior
knowledge to construction of knowledge from reading information text.
Thagard, P. (1992). Conceptual Revolutions (Princeton, NJ: Princeton University
Press).
Tomasini, N.G., Gandol E. and Balandi, B.P. (1990). Teaching strategies and
conceptual change: sinking and floating at elementary school level. Paper
presented at the Annual Meeting of the American Educational Research
Association. Boston, MA, 16–20 April1990.

77
Treagust, D.F. (1988). Development and Use of Diagnostic Tests to Evaluate
Students' Misconceptions in Science, International Journal of Science
Education, 10 (2) 159-169.
Tyson, L.M., Venville, G.J., Harrison, A.G. and Treagust, D.F. (1997).
Multidimensional framework for interpreting conceptual change events in
the classroom. Science Education, 81 (4), 387–404.
Vernon, P. E. (1969). Intelligence and cultural environment. London: Methuen.
Further reading.
Vosniadou, S. (1994). Capturing and modelling the process of conceptual change.
Learning and Instruction, 4.
Vosniadou, S., & Brewer, W. F. (1987). Theories of Knowledge Restructuring in
Development. Review of Educational Psychology, 57:1, 51-67.
Vygotsky, L.S. (1962). Thought and Language (Cambridge: M. I. T. Press).
Vygotsky, L.S. (1978). Mind in Society. The Development of Higher
Psychological Processes. (Cambridge, MA: Harvard University Press).

78
APPENDICES
Appendix I: Reference letter
UNIVERSITY OF NAIROBI
FACLTY OF ARTS
DEPARTMENT OF PSYCHOLOGY
Telegrams: Varsity Nairobi P. O. BOX 30197
Telephone: 3318262 ext. 28439 NAIROBI
Telex: 22095 KENYA
September 15, 2015
TO WHOM IT MAY CONCERN
RE: JOSEPH NZOMO MWALIMU – E58/70485/2013
The above named is a student in the Department of Psychology studying Masters
Psychology in M.Ed of Arts in counseling Psychology programme at the University
of Nairobi. He is doing a research on “Effectiveness of Methods of Testing
Conceptual Understanding in Physics: A Study done in the Concept of Floating
and Sinking in Form 3 Students at Mbooni – East District in Makueni County.”
The requirement of this course is that the student conducts research and collects data
in the field on the topic area.
In order to fulfill this requirement, I would like to re-affirm that the said student is a
registered student and is intending to go and carry out field work. Any assistance
accorded to him will be highly appreciated.
Should there be any queries do not hesitate to contact the Chair of the Department of
Psychology, University of Nairobi.

79
Appendix II: Questionnaire for the students to investigate demographic
factors
Kindly respond to the following questions appropriately noting that the
researcher will treat the responses confidential. Note that the success of the
researcher will depend on your honesty.
1. What is your gender?
Male ( ) Female ( )
2. Which class are you? …………….
3. What is your age …………………..
4. What type of primary school did you attend?
Private ( ) public ( )
5. Where you a day scholar or a boarder? …………………..
6. Where was your primary school located from your home?
Less than 1km ( ) between 1 -2 km ( ) between 2 – 3 km ( ) over 5km ( )
7. What type of secondary school are you in.
Public ( ) private ( )
8. If public what category is it?
Sub county school ( ) county school ( ) extra county school ( ) National ( )
9. Are you a day scholar or a boarder? ……………………..
10. Who pays your school fees?
My parents ( ) sponsor ( )

80
11. When do you normally understand physics concepts more?
When a teacher is teaching ( ) when I discuss with my friends ( ) when I read a
lone
12. Who influenced you to choose physics?
My parents ( ) my friends ( ) myself ( ) Religious leaders ( )
Any other …………………………………………………
13. The occupation of my father is…………………………..
14. The occupation of my mother is ……………………..
15. The educational level of my father is
Primary ( ) secondary ( ) tertiary ( ) Not applicable ( )
16. The educational level of my mother is
Primary ( ) secondary ( ) tertiary ( ) Not applicable ( )

81
Appendix III: Exams
(a) Objective questions
Name………………………………………………..…………class………………
Time: 20 mins
Instructions
Choose the correct answer out of the four choices given
Write your name and class in the spaces provided`
1. A piece of paper floats in water because of its
A) Mass
B) Density
C) Volume
D) Shape
2. Why does a piece of wood float in water but a n iron ball sinks
A) Wood is less dense than iron
B) Wood is less dense than water but iron is denser than water.
C) Wood has large volume than iron
D) The mass of wood is less than that of wood.
3. Why does ship and ferry float in water yet they are made of metal.
A) They have large surface area.
B) They are made of less dense metal
C) They have large volume
D) They displace large volume of water
4. Why does increase in weight make a floating body sink in water
A) The weight of the body increases beyond up thrust
B) It breaks surface tension
C) It makes an object more heavy
D) It lowers the up thrust

82
5. What is the effect of the volume of displaced water to the ability of the object
to float or sink?
A) The more the water displaced the higher the up thrust hence the object
floats
B) Less water displaced the higher the up thrust hence the object floats
C) The less the water displaced the less the up thrust hence the object
sinks
D) It has no effect.
6. An object floats more in water than in paraffin because
A) Density of water is less than that of paraffin
B) Density of water is higher than that of paraffin
C) Water has high cohesive force than paraffin
D) Paraffin has higher adhesive force than water.
7. Why does a ship or a ferry have large air spaces below it?
A) It increases its buoyancy
B) It makes it less dense
C) It increases surface area
D) It lowers its weight

83
(b) Essay questions
NAME……………………………………………………….CLASS……………
………..
Time: 20 mins
Instructions
Write your name and class in the spaces provided above.
Answer all the questions in the spaces provided above?
1. A boy threw a maize cob and a small stone on the surface of water
simultaneously state and explains what will be observed. (4 mks)
2. A student was fetching water from a dam. He observed that it is easier to carry
a 20 litter container while in water than in air. Explain this observation. (5
mks)
3. Explain how an inflated tube can help a person to swim across a flooded river
(3 mks)
84
4. A fishing boats can be improvised. Describe the shape and the type of the
material used to make the boat giving reasons. (4 mks)
5. Explain what will happen if the tube in question 4 above is deflected when on
is swimming .(4mks)

85
(c) Experimental approach
NAME……………………………………………….CLASS……………………..
Time: 20 mins
Instructions
Write your name and class in the spaces provided above.
Perform the tasks and answer all the questions in the spaces provided above?
1. You are provided with a basin of water, a small piece of wood, a stone, a long
tick, a short stick, a plastic pen and a steel ball. Place each one of them in turn
on the surface on the surface of water.
a) Which objects floated in water?
b) Which items sank in the water
c) The materials which floated in water are made of
d) The materials that sank in water are made of.
e) Compare the mass of the materials that floated in water with the mass of
materials that sank in water.

86
f) Compare the densities of materials that floated and those sank with that of
water.
g) In your own opinion explain why some materials float and others sink.
2. You are provided with a basin of water, a bottle top crushed bottle top and
small stones. Place each bottle top on the surface of the water each at a time
and observe what happens
a) Which bottle top sank?
b) Why did it sink?
c) Add a few stones on the bottle top that floated and observe what happens
as you continue adding the stones. Did it sink or float?
d) Why do you think it happened in c above?

87
3. From the above experiment
a) State three factors that affect if a body will sink or float.
b) In your own opinion why does a ship float in water yet it‟s made of
steel.
4. You are provided with a spring balance, eureka can, water, a beaker and a
mass.fill the eureka can with water until it the water begins to flow out
through the sprout. Wait until it stops and place the empty below the sprout.
Weigh the mass in air, and while suspended using the spring balance weigh it
again when in water. Also take the weight of the displaced water.
a) When does a body weigh less? When in water or when in air?
b) Find the difference between the weight in air and the weight in water
and compare it with the weight of displaced fluid.

88
Appendix IV: Marking schemes
a. Objective questions
1. B 2. B 3. D 4. A 5. A 6. B
7. A

89
b. Essay questions
Point note. A comma ( , ) indicates a making point
1. The stone sank while the maize cob floated, the stone has a higher density
than water while the maize cob has lower density than that of water, and the
maize cob experiences a higher up thrust than the stone.
2. The up thrust is high in water than in air, since water is denser than air, this
makes the resultant weight in air to more than in water.
3. The density of the air in the inflated tube is lower than the density of water,
this increases the buoyancy of the tube. The tube also experiences higher up
thrust when inflated than when deflated since it displaces more fluid.
4. They should be oval in shape, this will enable it to displace more fluid, hence
increasing the magnitude of the up thrust making it possible to float,
5. The air will flow out hence decreasing the amount of fluid displaced thus
reducing the magnitude of the up thrust hence the swimmer sinks.

90
c. Experimental
1 a) Plastic pen, piece of wood, long stick and short stick.
b) Steel ball, a stone
d. metal and stone
e. plastic/wood
f. The one that floated have large mass than the ones that sank.
g. They are less dense than water
h. Because they are made of materials which are less dense than water.
2. a) crushed one
b) It is small in size
c) It will sink
d) Its weight has increased
3. a) i )density of the liquid
ii) Weight of the object
iii) Shape of the object
b) It displaces large volume of water
4. a) when in water
b) When in water it is being pushed upward by up thrust force
c) 1.0 – 0.9 = 0.1N, it is equal to the weight of displaced fluid

91
Appendix IV: Raw scores for both pre and post test
Post test results
a) Experimental tests
Student Q1 Q2 Q3 Q4
1 7 2 1 1 11
2 5 4 2 1 12
3 6 3 4 1 14
4 7 4 3 3 17
5 4 4 1 2 11
6 7 2 3 3 15
7 5 3 3 1 12
8 7 3 3 3 16
9 7 3 3 4 17
10 7 4 2 2 15
b) Pre-test experimental results
Student Q1 Q2 Q3 Q4
1 4 2 1 0 7
2 3 3 2 2 10
3 5 3 3 2 13
4 5 4 3 2 14
5 4 3 2 1 10
6 4 2 2 1 9
7 4 2 2 1 9
8 5 3 2 1 11
9 5 2 3 2 12
10 2 3 2 2 9

92
c) Objective questions pre-test results
Student Q1 Q2 Q3 Q4 Q5 Q6 Q7
1 1 1 0 0 0 1 1 4
2 1 1 0 0 0 1 0 3
3 1 0 0 0 0 1 0 2
4 0 1 0 1 1 1 1 5
5 0 1 0 0 1 1 1 4
6 0 0 0 1 1 1 1 4
7 1 1 0 1 0 1 1 5
8 0 0 0 1 0 1 1 3
9 1 1 0 1 0 1 0 4
10 0 0 0 1 1 1 1 4
d) Post test results, Objective questions
Student Q1 Q2 Q3 Q4 Q5 Q6 Q7
1 0 0 1 1 1 1 1 5
2 0 1 1 1 1 1 1 6
3 0 1 1 0 1 1 1 5
4 0 1 1 1 1 1 1 6
5 0 1 1 1 1 1 1 6
6 0 1 1 1 1 1 1 6
7 0 1 1 1 1 1 1 6
8 0 1 1 1 1 1 1 6
9 1 1 1 0 1 1 1 6
10 1 1 1 1 1 1 1 7

93
e) Essay post test results
f) Results for essay pre-test results
Students Q1 Q2 Q3 Q4 Q5
1 4 4 2 3 4 17
2 1 2 2 0 1 6
3 1 2 1 3 2 9
4 1 1 1 0 2 5
5 1 2 0 0 0 3
6 2 1 1 1 1 6
7 1 3 1 1 0 6
8 1 1 0 1 0 3
9 1 1 0 1 1 4
10 2 0 0 4 1 7
Student Q1 Q2 Q3 Q4 Q5
1 3 1 1 0 2 7
2 1 1 1 0 0 3
3 1 0 0 0 0 1
4 1 1 0 0 0 2
5 1 0 0 0 0 1
6 1 0 0 0 0 1
7 1 1 2 0 0 4
8 0 1 0 0 0 1
9 0 0 0 0 0 0
10 1 0 0 0 0 1