effectiveness of carbon accounting methodologies for...
TRANSCRIPT

Effectiveness of carbon accounting
methodologies for LULUCF and
harvested wood products in
supporting climate-conscious
policy measures
Robert MatthewsForest Research UK
Rebecca HeatonCardiff University

OBJECTIVES OF THE STUDY
• To evaluate the impact of different
LULUCF and HWP accounting methods
on the reduction estimates reported by
participating countries.
• Explore gross-net, net-net and article
3.7.
• Examine the baseline on which to
compare reductions.

PentagonLand area; 900000000
Forest area; 180000000
Fossil emissions; 1500
CircleLand area; 90000000
Forest area; 36000000
Fossil emissions; 1
OvalLand area; 900000000
Forest area; 540000000
Fossil emissions; 100
TrapeziumLand area; 900000000
Forest area; 270000000
Fossil emissions; 150
OblongLand area; 30000000
Forest area; 21000000
Fossil emissions; 15
DiamondLand area; 30000000
Forest area; 9000000
Fossil emissions; 10
TriangleLand area; 20000000
Forest area; 2000000
Fossil emissions; 150
StarLand area; 800000000
Forest area; 40000000
Fossil emissions; 100
HYPOTHETICAL COUNTRIES OF BERNHARD-WORLD

Projected land cover in country Trapezium
BUSINESS AS USUAL
0
10
20
30
40
50
60
70
80
90
100
1990 2010 2030 2050 2070 2090 2110 2130 2150
Year
Lan
d c
over
(%)
non-forest
exploited
unexploited

Projected land cover in country Star
BUSINESS AS USUAL
0
10
20
30
40
50
60
70
80
90
100
1990 2010 2030 2050 2070 2090 2110 2130 2150
Year
La
nd
co
ve
r (%
)
non-forested
exploited
unexploited

0%
20%
40%
60%
80%
100%
1990 2000 2010 2020 2030 2040 2050 2060 2070 2080 2090 2100 2110 2120 2130 2140 2150
Year
La
nd
co
ve
r (
%)
non-forest
exploited
unexploited
Projected land cover in country Diamond,
BUSINESS AS USUAL

0%
20%
40%
60%
80%
100%
1990 2000 2010 2020 2030 2040 2050 2060 2070 2080 2090 2100 2110 2120 2130 2140 2150
Year
La
nd
co
ve
r (%
)
non-forest
exploited
unexploited
Projected land cover in country Triangle,
BUSINESS AS USUAL

Projected land cover in country Pentagon,
BUSINESS AS USUAL
Country Pentagon
0
20
40
60
80
100
1990 2010 2030 2050 2070 2090 2110 2130 2150
Year
Perc
enta
ge L
and A
rea

Projected land cover in country Oval,
BUSINESS AS USUAL
Country Oval
0
20
40
60
80
100
1990 2010 2030 2050 2070 2090 2110 2130 2150
Year
Perc
enta
ge L
and A
rea

0%
20%
40%
60%
80%
100%
1990 2000 2010 2020 2030 2040 2050 2060 2070 2080 2090 2100 2110 2120 2130 2140 2150
Year
La
nd
co
ve
r (%
)
non-forest
exploited
unexploited
Projected land cover in country Circle,
BUSINESS AS USUAL

Projected land cover in country Oblong
BUSINESS AS USUAL
0
10
20
30
40
50
60
70
80
90
100
1990 2010 2030 2050 2070 2090 2110 2130 2150
Year
La
nd
co
ve
r (%
)
non-forest
exploited
unexploited
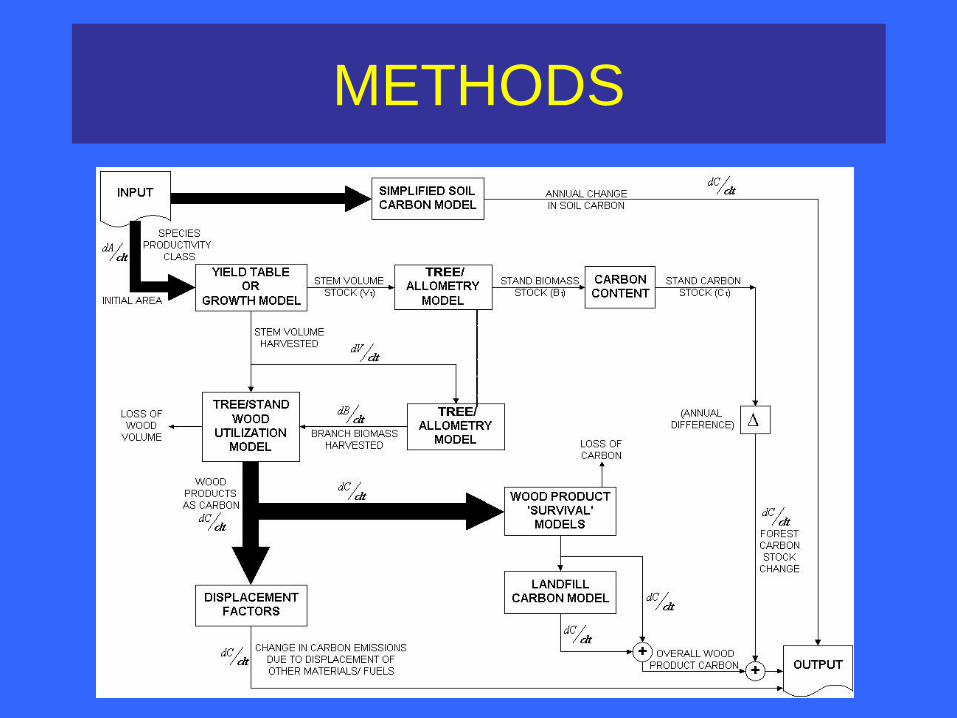
METHODS

METHODS
LULUCF Accounting:
Real-time, One-off, Benchmark, Simplified
benchmark.
Tonne-year, Advanced tonne-year, Rental
HWP Accounting:
IPCC, Stock Change, Production, Atmospheric Flow

METHODS
Article 3.7:
Strict interpretation, gross-net, net-net
Baselines:
Zero, 1990 value, 1990 projection, BAU projection

-105
-90
-75
-60
-45
-30
-15
0
15
30
45
60
75
90
105
1990
1995
2000
2005
2010
2015
2020
2025
2030
2035
2040
2045
2050
2055
2060
2065
2070
2075
2080
2085
2090
2095
2100
2105
2110
2115
2120
2125
2130
2135
2140
2145
2150
Year
Ch
an
ge i
n C
arb
on
Net
sin
k/s
ou
rce (
%)
Default BAU Projection : Country Circle
-105
-90
-75
-60
-45
-30
-15
0
15
30
45
60
75
90
105
1990
1995
2000
2005
2010
2015
2020
2025
2030
2035
2040
2045
2050
2055
2060
2065
2070
2075
2080
2085
2090
2095
2100
2105
2110
2115
2120
2125
2130
2135
2140
2145
2150
Year
Ch
an
ge i
n C
arb
on
Net
sin
k/s
ou
rce (
%)
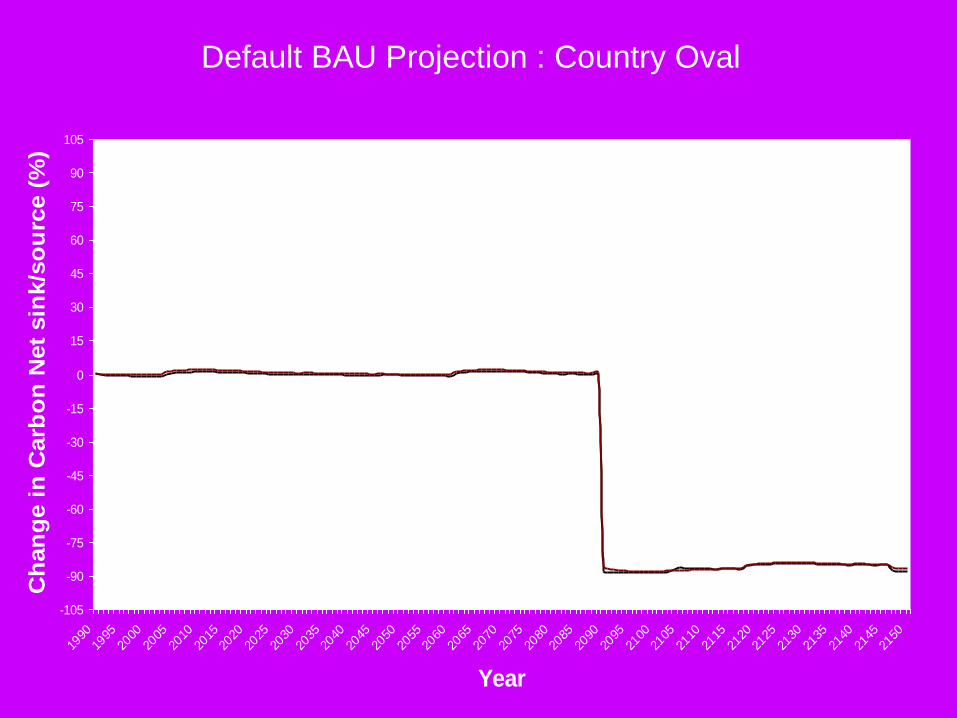
Default BAU Projection : Country Oval

-105
-90
-75
-60
-45
-30
-15
0
15
30
45
60
75
90
105
1990
1995
2000
2005
2010
2015
2020
2025
2030
2035
2040
2045
2050
2055
2060
2065
2070
2075
2080
2085
2090
2095
2100
2105
2110
2115
2120
2125
2130
2135
2140
2145
2150
Year
Ch
an
ge i
n C
arb
on
Net
sin
k/s
ou
rce (
%)
Default BAU Projection : Country Trapezium

-105
-90
-75
-60
-45
-30
-15
0
15
30
45
60
75
90
105
19901995
20002005
20102015
20202025
20302035
20402045
20502055
20602065
20702075
20802085
20902095
21002105
21102115
21202125
21302135
21402145
2150
Year
Ch
an
ge i
n C
arb
on
Net
sin
k/s
ou
rce (
%)
Default BAU Projection : Country Oblong

-105
-90
-75
-60
-45
-30
-15
0
15
30
45
60
75
90
105
1990
1995
2000
2005
2010
2015
2020
2025
2030
2035
2040
2045
2050
2055
2060
2065
2070
2075
2080
2085
2090
2095
2100
2105
2110
2115
2120
2125
2130
2135
2140
2145
2150
Year
Ch
an
ge i
n C
arb
on
Net
sin
k/s
ou
rce (
%)
Default BAU Projection : Country Diamond

-105
-90
-75
-60
-45
-30
-15
0
15
30
45
60
75
90
105
1990
1995
2000
2005
2010
2015
2020
2025
2030
2035
2040
2045
2050
2055
2060
2065
2070
2075
2080
2085
2090
2095
2100
2105
2110
2115
2120
2125
2130
2135
2140
2145
2150
Year
Ch
an
ge i
n C
arb
on
Net
sin
k/s
ou
rce (
%)
Default BAU Projection : Country Star

-105
-90
-75
-60
-45
-30
-15
0
15
30
45
60
75
90
105
1990
1995
2000
2005
2010
2015
2020
2025
2030
2035
2040
2045
2050
2055
2060
2065
2070
2075
2080
2085
2090
2095
2100
2105
2110
2115
2120
2125
2130
2135
2140
2145
2150
Year
Ch
an
ge i
n C
arb
on
Net
sin
k/s
ou
rce (
%)
Default BAU Projection : Country Pentagon

-105
-90
-75
-60
-45
-30
-15
0
15
30
45
60
75
90
105
19901995
20002005
20102015
20202025
20302035
20402045
20502055
20602065
20702075
20802085
20902095
21002105
21102115
21202125
21302135
21402145
2150
Year
Ch
an
ge i
n C
arb
on
Net
sin
k/s
ou
rce (
%)
Default BAU Projection : Country Triangle

-105
-90
-75
-60
-45
-30
-15
0
15
30
45
60
75
90
105
0 1 2 3 4
Calculation method
Ch
an
ge i
n C
arb
on
Net
sin
k/s
ou
rce (
%)
Star
Oval
Trapezium
Oblong
Triangle
Diamond
Circle
Pentagon
Influence of percentage calculation method 2008 - 2012
Net-net Gross-net Article 3.7

Influence of percentage calculation method 1990-2150
Net-net Gross-net Article 3.7
-100
-75
-50
-25
0
25
50
75
100
0 1 2 3 4
Article 3.7 calculation
Change in N
et carb
on s
ink/s
ourc
e
(%)
Star
Oval
Trapezium
Oblong
Triangle
Diamond
Circle
Pentagon

-100
-75
-50
-25
0
25
50
75
100
0 1 2 3 4 5 6 7 8 9
Country
Change in C
arb
on N
et sin
k/sourc
e
(%)
The impact of accounting for HWP, 2008-2012

-100
-75
-50
-25
0
25
50
75
100
0 1 2 3 4 5 6 7 8 9
Country
Ch
ange in C
arb
on N
et sin
k/s
ourc
e
(%)
The impact of accounting for HWP, 1990-2150

Impact of accounting indices, zero baseline
(1990-2150)
-105-90-75-60-45-30-15
0153045607590
105
0 1 2 3 4 5 6 7 8
Accounting index
Change in N
et carb
on
sin
k/s
ourc
e (
%)
Star
Oval
Trapezium
Oblong
Triangle
Diamond
Circle
Pentagon

Impact of accounting indices, zero baseline
(2008-2012)
-105
-85-65
-45-25
-515
3555
7595
0 1 2 3 4 5 6 7 8
Accounting index
Ch
ange in N
et carb
on
sin
k/s
ourc
e (
%)
Star
Oval
Trapezium
Oblong
Triangle
Diamond
Circle
Pentagon

Impact of accounting indices, 1990 value
Graph 7 (1990-2150)
-105-90-75-60-45-30-15
0153045607590
105
0 1 2 3 4 5 6 7 8
Accounting index
Ch
ange in N
et carb
on
sin
k/s
ourc
e (
%)
Star
Oval
Trapezium
Oblong
Triangle
Diamond
Circle
Pentagon

Impact of accounting indices, 1990 value
(2008-2012)
-100
-75
-50
-25
0
25
50
75
100
0 1 2 3 4 5 6 7 8
Accounting index
Ch
ange in N
et carb
on
sin
k/s
ourc
e (
%)
Star
Oval
Trapezium
Oblong
Triangle
Diamond
Circle
Pentagon

Impact of accounting indices, 1990 projection
(1990-2150)
-105-90-75-60-45-30-15
0153045607590
105
0 1 2 3 4 5 6 7 8
Accounting index
Ch
ange in N
et carb
on
sin
k/s
ourc
e (
%)
Star
Oval
Trapezium
Oblong
Triangle
Diamond
Circle
Pentagon

Impact of accounting indices, 1990 projection
(2008-2012)
-105-90-75-60-45-30-15
0153045607590
105
0 1 2 3 4 5 6 7 8
Accounting index
Ch
ange in N
et carb
on
sin
k/s
ourc
e (
%)
Star
Oval
Trapezium
Oblong
Triangle
Diamond
Circle
Pentagon

CONCLUSIONS
• If LULUCF is to be included in the Kyoto Protocol, the
accounting procedures can, indeed must, be kept as
simple as possible, otherwise anomalous results and
perverse incentives will arise.
• Tonne year understates the role of LULUCF.
• Article 3.7 appears to be acceptable.

CONCLUSIONS
•Carbon sequestration in wood products is not
as important at global level, as had been
thought.
•The differences in calculation methods for
HWP is small, apart from Atmospheric Flow
which is pessimistic.
•Need to look at the longer term impacts,
rather than the first accounting period only.

FUTURE WORK
•Explore the forest area constraints.
•Periodically re-set the year for the assigned
amount.
•Examine the impact of changes in land use
policy.
•Include the CDM.