effectiveness of a product quality classifier dr. e. bashkansky, dr. s. dror, dr. r. ravid...
Post on 22-Dec-2015
213 views
TRANSCRIPT

Effectiveness of a Product Quality
Classifier
Dr. E. Bashkansky, Dr. S. Dror, Dr. R. Ravid
Industrial Eng. & Management, ORT Braude College, Karmiel, Israel
Dr. P. Grabov
A.L.D. Ltd., Beit Dagan 50200, Israel

2

3
4
“Effectiveness” - definition
Extent to which planned activities are realized and planned results achieved (ISO 9000:2000)
The state of having produced a decided upon or desired effect (ASQ Glossary, 2006).

5
Presentation Outline
Objective Background Basic definitions Proposed approach to effectiveness evaluation Measures resulting from proposed approach The basic of repeated sorting
Case A – two raters Case B – two raters + supervisor
Illustrative example and conclusions Summary

6
Objective
Developing a new statistical procedure for evaluating the effectiveness of measurement systems applicable to Attribute Quality Data based on the Taguchi approach.

7
Objective (cont.)
When the loss incurred by quality sort misclassifying is large, an improvement of the sorting procedures can be achieved by the help of repeated classifications. The way it influences the classifying effectiveness is also analyzed.

8
Accuracy and Precision.
Accuracy The closeness of agreement between the
result of measurement and the true (reference) value of the product being
sorted.Precision
Estimate of both the variation in repeated measurements obtained under the same
conditions (Repeatability) and the variation of repeated measurements obtained under
different conditions (Reproducibility).

9
The most popular precision metrics
Signal to Noise (S/N) ratio - compares the variations among products to variations in the MS
Precision to Tolerance (P/T) ratio - compares the latter to tolerance.

10
Four types of quality data
The four levels were proposed by Stanley Smith Stevens in his 1946 article. Different mathematical operations on variables are possible, depending on the level at which a variable is measured.

11
Categorical Variables
1. Nominal scale:
Supplier: A,B,C….
Possible operations:
,

12
Categorical Variables(cont.)
2. Ordinal scale :
customer satisfaction grade , quality sort, customer importance (QFD) vendor’s priority, severity of failure or RPN (FMECA), the power of linkage (QFD)
Possible operations:
,,,

13
Numeric data.
3. Interval scale:
Image Quality
Possible operations:
,,,,,

14
Numeric data (cont.)
4. Ratio scale:
Amount of defectives in a batch Deviation from a specification
Possible operations:
/,,,,,,,

15
Two types of data characterizing product/process quality
Variables (results of measurement, Interval or Ratio Scales)
Attributes (results of testing, Nominal or Ordinal
Scales ).

16
Traditional accuracy metrics for binomial situation
Accuracy is characterized by:
1. Type I Errors (non-defective is
reported as defective) – alfa risk
2. Type II Errors (defective is reported as non-defective) – beta risk

17
The sorting probability matrix
for the binary situation
E. Bashkansky, S. Dror, R. Ravid, P. Grabov
ICPR-18, Salerno August, 2, Session 19 6
Factual
Act
ual + -
+-
1-α α
1- ββ

18
Case Study (nectarines sorting)
Type 1- 0.860, Type 2 - 0.098 , Type 3 -0.042
Classification
Type1 Type2 Type3 Total
Actual
Type1 446 91 7 544
Type2 12 307 33 352
Type3 0 11 93 104
Total 458 409 133 1000

19
Introduction
The proposed method takes into account the information available about:
1.Incoming product quality sort distribution,
2. Sorting errors rates,
3. Losses due to misclassification,
4. Additional organizational charges.

20
Basic definitions: 1. Incoming and outgoing quality sort distributions
pi - the probability that an item whose quality is to be classified has a quality level i
qj - the probability that an outgoing item was classified as belonging to quality level j

21
Basic Definitions:2. Sorting Probability Rates
Sorting matrix:
The sorting matrix is an 'm by m' matrix.
Its components Pi,j are the conditional
probabilities that an item will be classified
as quality level j, given its quality level is i.
P̂

22
Sorts Distribution Transformation
ij
m
iij Ppq
1

23
Binary sorting matrix examples
01
10ˆ)3(5.05.0
5.05.0ˆ)2(10
01ˆ)1( PPP

24
Cheating
(4) Absence of any sorting
01
01P

25
Three Interesting Sorting Matrices
(a) The most exact sorting:
(b) The uniform sorting: (designated as MDS: most disordered sorting):
(c) The “worst case” sorting. For example, if m = 4:
ijijP
mP
ij
1
0001
0001
1000
1000
P

26
The Classification Matrix Estimation
894.0106.00
094.0872.0034.0
013.0167.0820.0
10493
10411
1040
35233
352307
35212
5447
54491
544446
ijP

27
Indicator of the classification system inexactness
0)ˆ(
2
)(
2
ˆ 2
1 1
2
DDet
m
P
m
DG
ij
m
i
m
jij

28
Loss Matrix
Let Lij - be the loss incurred by classifying
sort i as sort j.

29
Losses due to misclassification
Loss matrix (in NIS/kg) :
000.742.12
78.0042.5
76.198.00
ijL

30
A - the cost (per product unit) concerned with one additional rating.
B - all expenditures (per product unit) concerned with the supervisor control.
Additional Organizational Charges
31
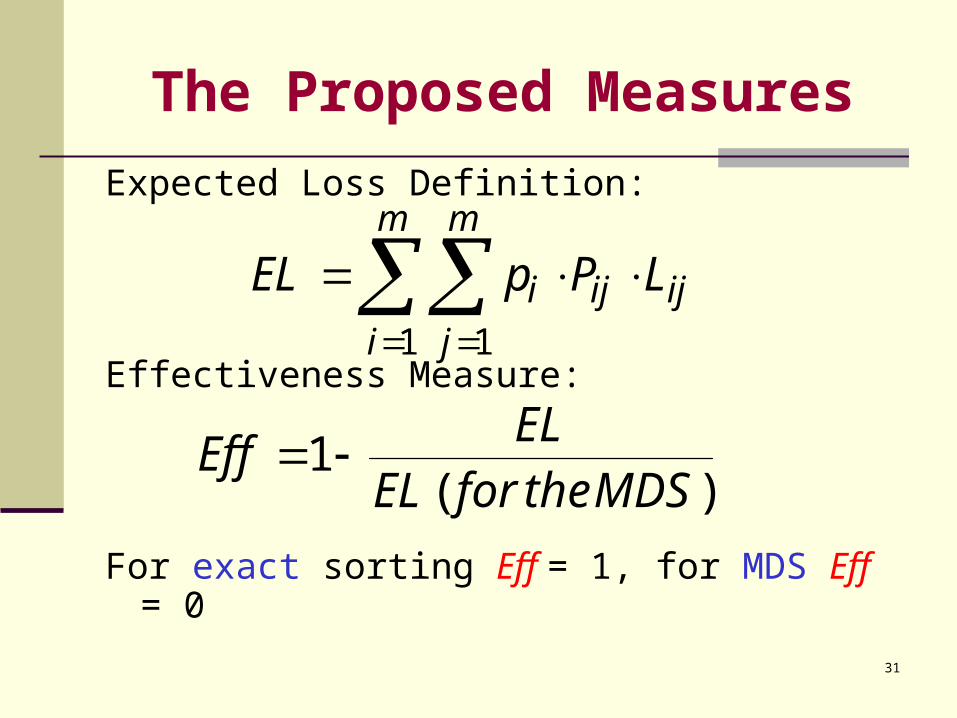
The Proposed Measures
Expected Loss Definition:
Effectiveness Measure:
For exact sorting Eff = 1, for MDS Eff = 0
ijij
m
i
m
j
i LPpEL 1 1
)(1
MDStheforELEL
Eff

32
Measures resulting from proposed approach when:1. Only information about the sorting matrix is
available
1
1)ˆ(
1
11
m
PTrace
m
PHEff
m
iii
• H equals 1 for the exact sorting
• H equals 0 for the random sorting

33
Measures resulting from proposed approach when:
2. Information about the sorting matrix and the incoming quality is available
• U equals 1 for the exact sorting
• U equals 0 for the random sorting
)(1
1
1 12
2log
)log(
j
m
jj
m
i
m
j
ijP
ijP
ip
UEff
2.1 Uncertainty reduction measure
ijij PL 2log

34
Measures resulting from proposed approach:2. Information about the sorting matrix and the
incoming quality is available
• G equals 1 for the most exact sorting
• G equals 0 for the most disordered sorting
2.2 Modified kappa measure
m
PpGEff
m
kkkk
11
11 1
jimjiconstijL ,1
35
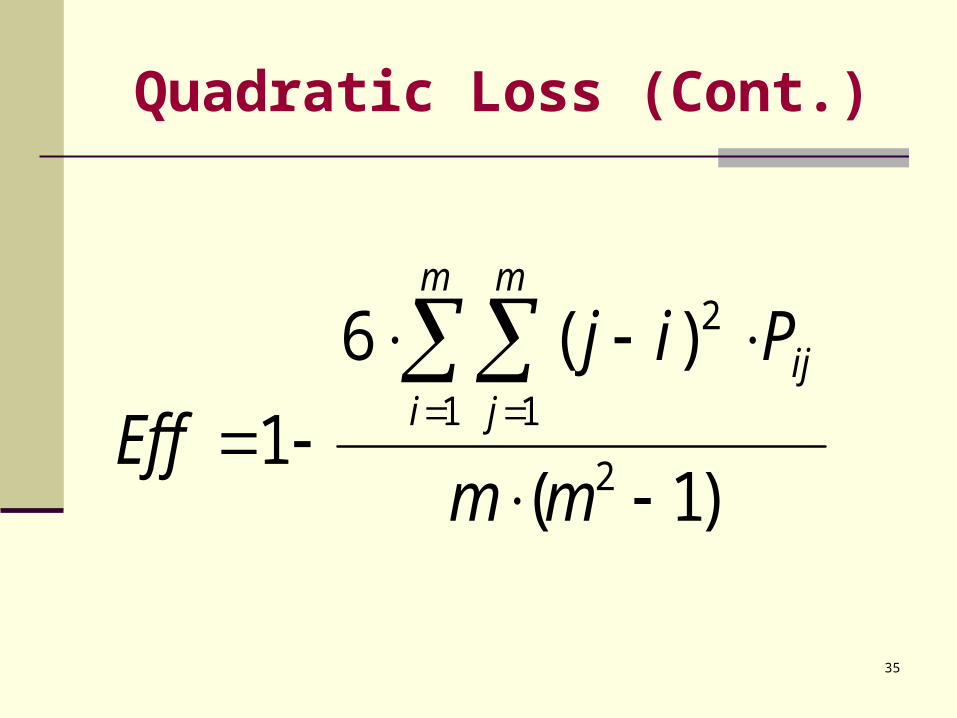
Quadratic Loss (Cont.)
)1(
)(6
12
1 1
2
mm
Pij
Eff
m
i
m
jij

36
REPEATED (REDUNDANT) SORTING Independence vs. Correlation

37
REPEATED (REDUNDANT) SORTING Case A: Two Independent (but correlated)
Repeated Ratings Assumptions:
1. - conditional joint probability of sorting i by the first rater, and j by the second, given the actual sort – k.
2. The same capabilities for both stages/raters,
3. In the case of disagreement, the final decision is made in favor of the inferior sort (one rater can see a defect, which the other has not detected).
)(kij
)()( k
ji
k
ij

38
REPEATED (REDUNDANT) SORTING Case A: Two Independent Repeated Ratings
Results:
1. Redistribution of probabilities:The probability of making a true decision about low quality products increases, while the probability of making a true decision about high quality products decreases.
2. To verify improvement in sorting effectiveness, we need a new expenditure calculation:
( A is the cost (per product unit) concerned with the additional rating ).
ALPpAEL ijij
m
i
m
ji
1 1

39
REPEATED (REDUNDANT) SORTING Case B: Three Repeated Ratings
Assumptions:
1. The same capabilities for the first two stages/raters,
2. A third rater is added only if the first two raters do not agree.
3. His/her decision could be considered as an etalon measurement.

40
REPEATED (REDUNDANT) SORTING Case B: Three Repeated Ratings
Results :
1. The probability of correct decisions,
increases, and the probability of wrong decisions, decreases.
2. The probability of having to carry out the etalon measurement is important.
3. The total expenditure concerning the triple procedure has to be calculated.
DPBAEL

41
ILLUSTRATIVE EXAMPLE
Consider a sorting line that classifies fruits into the three levels of quality:
1. High
2. Medium,
3. Unacceptable.
The proportions of the above types are:
Type 1 - 53 %,
Type 2 - 27 %,
Type 3 - 20 %.

42
Losses due to misclassification
Loss matrix (in NIS/kg) :
000.742.12
78.0042.5
76.198.00
ijL

43
The joint probability matrices for two
repeated ratings k 1 2 3
)(ˆ kij
00.001.002.0
01.004.003.0
02.003.084.0
00.007.001.0
07.076.002.0
01.002.004.0
67.010.003.0
10.002.002.0
03.002.001.0
Kappa coefficient of
agreement
between two raters
0.40 0.25 0.11
- k indicates the quality level of the product- i represent the first rater’s decision and j the second rater’s
decision.
The probability of disagreement equals 0.1776:

44
Results of calculations
Case One rater Two raters Three raters
H 0.77 0.785 0.945
U 0.528 0.523 0.801
0.774 0.757 0.937
G 0.792 0.771 0.943
Expected Loss EL = 0.534 EL' = 0.309 EL'' = 0.132
Effectiveness Eff = 77% Eff ' = 87% Eff '' = 94%

45
Conclusions Concerning Case A
The probability of making a true decision concerning low quality products increases while the probability of making a true decision concerning good quality products decreases.
All measures that do not take into account the real losses of misclassification (H, U, kappa, G ) do not differ significantly.
Applying the two raters method is expedient, if the cost of additional rating does not exceed:
EL - EL' = 0.534 - 0.309 = 0.225 (NIS/kg).

46
Conclusions Concerning Case B
Accuracy of classification is much better, if all items on which there is no agreement are passed to the supervisor. It reflects in improvement of all metrological parameters.
Nevertheless, to decide whether applying this method is expedient or not, the cost of the third additional rating multiplied by the probability that it will be required should not exceed
EL' - EL'' = 0.309 – 0.132 = 0.177 (NIS/kg) or ,in other words, this cost should not exceed one NIS/kg.

47
Summary - 1
The proposed procedure for evaluation of product quality classifiers takes into account some a priori knowledge about the incoming product, errors of sorting and losses due to under/over graduation.

48
Summary - 2
It is shown that when the loss function - the major component of the proposed measure - is chosen appropriately, we arrive at already known measures for quality classification as well as to some new measures.

49
Summary - 3
The appropriate choice of the loss function matrix provides the opportunity to fit quality sorting process model to the real situation.

50
Summary - 4
Repeated sorting procedures could be expedient for cases when the loss incurred by quality sort misclassifying is large.

51
Summary - 5
Nevertheless, to decide whether applying this method is expedient or not, the expected cost of the additional rating/s should be compared to the expected loss resulting from misclassification.

52
Another possible applications
The approach can be extended to other QA processes concerned with classification , for example :
vendor's evaluation, customer satisfaction survey, FMECA analysis quality estimation of multistage or
hierarchical service systems etc…

53
Thank You