effective measures to restrict vehicle turning …
TRANSCRIPT

EFFECTIVE MEASURES TO RESTRICT VEHICLE TURNING MOVEMENTS
Final Report
SPR 766


EFFECTIVE MEASURES TO RESTRICT VEHICLE TURNING MOVEMENTS
Final Report
SPR 766
by Karen Dixon Yizhen Dai
Yanfen Zhou Raul Avelar
Sukrit Narula with
Texas A&M Transportation Institute
for
Oregon Department of Transportation Research Section
555 13th Street NE, Suite 1 Salem OR 97301
and
Federal Highway Administration
400 Seventh Street, SW Washington, DC 20590-0003
December 2015


i
Technical Report Documentation Page
1. Report No.
FHWA-OR-RD-16-07
2. Government Accession No.
3. Recipient’s Catalog No.
4. Title and Subtitle
Effective Measures to Restrict Vehicle Turning Movements
5. Report Date
December 2015
6. Performing Organization Code
7. Author(s)
Karen Dixon, Yizhen Dai, Yanfen Zhou, Raul Avelar, Sukrit Narula
8. Performing Organization Report No.
9. Performing Organization Name and Address Texas A&M Transportation Institute
3135 TAMU College Station, TX 77843-3135
10. Work Unit No. (TRAIS)
11. Contract or Grant No.
SPR 766
12. Sponsoring Agency Name and Address
Oregon Dept. of Transportation Research Section and Federal Highway Admin. 555 13th Street NE, Suite 1 400 Seventh Street, SW Salem, OR 97301 Washington, DC 20590-0003
13. Type of Report and Period Covered
Final Report
14. Sponsoring Agency Code
15. Supplementary Notes 16. Abstract
This study evaluated alternatives to raised/non-traversable medians on driveways and approaches. Raised medians are often considered as an effective technique to limit direct left-turns that may be due to a significant number of conflict points. The raised medians provide an added benefit of improved corridor aesthetics. This research effort specifically reviewed a variety of turn restriction alternatives to determine how effective they may be in addressing the safety and operational needs of the transportation network while still considering contextual sensitivities. The turn restrictions evaluated in this report are broadly separated into three categories: turn restrictions located only at the access point, turn restrictions located only in the roadway (typically some sort of median configuration), and combined turn restriction configurations. The literature review also identified the jug handle and roundabout design that could be considered to restrict turning maneuvers, but this research did not extend to these two infrastructure alternatives. The research team performed field evaluations in Oregon and Texas to determine the effectiveness of various turn restriction configurations. For the Oregon locations, the research team also evaluated recent crash histories to determine if turn restrictions were linked to observed crashes. In addition, the research team performed micro-simulation evaluations to identify the operational impacts of the various turn maneuver restrictions. 17. Key Words
18. Distribution Statement
Copies available from NTIS, and online at http://www.oregon.gov/ODOT/TD/TP_RES/
19. Security Classification (of this report)
Unclassified
20. Security Classification (of this page)
Unclassified
21. No. of Pages
126
22. Price
Technical Report Form DOT F 1700.7 (8-72) Reproduction of completed page authorized Printed on recycled paper

ii

iii

iv
SI* (MODERN METRIC) CONVERSION FACTORS
APPROXIMATE CONVERSIONS TO SI UNITS APPROXIMATE CONVERSIONS FROM SI UNITS
Symbol When You
Know Multiply
By To Find Symbol Symbol
When You Know
Multiply By
To Find Symbol
LENGTH LENGTH
in inches 25.4 millimeters mm mm millimeters 0.039 inches in ft feet 0.305 meters m m meters 3.28 feet ft yd yards 0.914 meters m m meters 1.09 yards yd mi miles 1.61 kilometers km km kilometers 0.621 miles mi
AREA AREA
in2 square inches 645.2 millimeters squared
mm2 mm2 millimeters squared
0.0016 square inches in2
ft2 square feet 0.093 meters squared m2 m2 meters squared 10.764 square feet ft2 yd2 square yards 0.836 meters squared m2 m2 meters squared 1.196 square yards yd2 ac acres 0.405 hectares ha ha hectares 2.47 acres ac
mi2 square miles 2.59 kilometers squared
km2 km2 kilometers squared
0.386 square miles mi2
VOLUME VOLUME
fl oz fluid ounces 29.57 milliliters ml ml milliliters 0.034 fluid ounces fl oz gal gallons 3.785 liters L L liters 0.264 gallons gal ft3 cubic feet 0.028 meters cubed m3 m3 meters cubed 35.315 cubic feet ft3 yd3 cubic yards 0.765 meters cubed m3 m3 meters cubed 1.308 cubic yards yd3
NOTE: Volumes greater than 1000 L shall be shown in m3.
MASS MASS
oz ounces 28.35 grams g g grams 0.035 ounces oz lb pounds 0.454 kilograms kg kg kilograms 2.205 pounds lb
T short tons (2000 lb)
0.907 megagrams Mg Mg megagrams 1.102 short tons (2000 lb) T
TEMPERATURE (exact) TEMPERATURE (exact)
°F Fahrenheit (F-32)/1.8
Celsius °C °C Celsius 1.8C+32
Fahrenheit °F
*SI is the symbol for the International System of Measurement

v

vi
ACKNOWLEDGEMENTS
The research included in this report was sponsored by the Oregon Department of Transportation (ODOT). The project team would like to thank the research staff at ODOT and the members of the Technical Advisory Committee for their oversight and guidance in the performance of this research effort.
DISCLAIMER
This document is disseminated under the sponsorship of the Oregon Department of Transportation and the United States Department of Transportation in the interest of information exchange. The State of Oregon and the United States Government assume no liability of its contents or use thereof.
The contents of this report reflect the view of the authors who are solely responsible for the facts and accuracy of the material presented. The contents do not necessarily reflect the official views of the Oregon Department of Transportation or the United States Department of Transportation.
The State of Oregon and the United States Government do not endorse products of manufacturers. Trademarks or manufacturers’ names appear herein only because they are considered essential to the object of this document.
This report does not constitute a standard, specification, or regulation.

vii

viii
TABLE OF CONTENTS
1.0 INTRODUCTION............................................................................................................. 1
2.0 BACKGROUND ............................................................................................................... 2
2.1 STANDARD ACCESS – NO CONSTRAINTS OR PASSIVE LEFT-TURN CONSTRAINTS ................ 3 2.2 ACCESS WITH PHYSICAL CONSTRAINTS ONLY AT INGRESS/EGRESS LOCATION .................. 3 2.3 ACCESS WITH PHYSICAL CONSTRAINTS IN ROADWAY (MEDIAN TREATMENTS) ............... 13
2.3.1 Literature Review ................................................................................................................................. 16 2.3.2 State of Practice for the Raised (Non-traversable) Median ................................................................. 20
2.4 COMBINATION OR ALTERNATIVE TREATMENTS .............................................................. 28 2.4.1 Literature Review ................................................................................................................................. 28 2.4.2 State of Practice ................................................................................................................................... 29
2.5 SUMMARY ...................................................................................................................... 31
3.0 DATA COLLECTION AND SITE SELECTION ....................................................... 32
3.1 STUDY STIES AND ASSOCIATED DATA VARIABLES .......................................................... 32 3.2 DATA COLLECTION METHODS ......................................................................................... 34 3.3 FINAL STUDY SITES ......................................................................................................... 34 3.4 SUMMARY ...................................................................................................................... 36
4.0 DATA ANALYSIS .......................................................................................................... 37
4.1 FIELD DATA ANALYSIS.................................................................................................... 38 4.1.1 Traffic Volume and Driver Compliance............................................................................................... 38 4.1.2 Safety Assessment ................................................................................................................................ 40
4.2 MICRO-SIMULATION ....................................................................................................... 41 4.3 EXAMPLE EVALUATION OF TURN RESTRICTION OPTIONS ................................................ 47
4.3.1 Example Problem – Four-Lane Light to Moderate Land Development Access ................................... 47 4.3.2 Example Problem – Five-lane Heavy Land Development Access ....................................................... 48
4.4 SUMMARY ...................................................................................................................... 49
5.0 CONCLUSIONS ............................................................................................................. 50
6.0 REFERENCES ................................................................................................................ 52
LIST OF TABLES
Table 2.1: Percent of Total Driveway Crashes Based on Maneuver and Orientation .................................................... 2 Table 2.2: Physically Restricting Left-Turns at Access Point Locations ....................................................................... 6 Table 2.3: Restricting Left-Turns with Medians, Dedicated and One-Way Lanes ...................................................... 10 Table 2.4: Traffic Volume Threshold to Install Non- traversable Median .................................................................. 21 Table 2.5: State of Practice for Median Treatments .................................................................................................... 21 Table 2.6: Design Speed Threshold to Install Non-traversable Median ...................................................................... 25 Table 2.7: State of Practice for Median Opening Treatments ...................................................................................... 26 Table 2.8: Alternative Turn-Restriction Options ......................................................................................................... 30 Table 3.1: Physical Characteristics and Volume Information – Site 1 (OR-1) ............................................................ 33 Table 3.2: Turning Violation Details -- Site 1 (OR-1) ................................................................................................. 34 Table 3.3: Field Data and Corresponding Collection Method ..................................................................................... 34

ix
Table 3.4: Oregon Study Sites ..................................................................................................................................... 35 Table 3.5: Texas Study Sites ....................................................................................................................................... 35 Table 4.1: Turn Restriction Compliance at Field Sites ................................................................................................ 40 Table 4.2: Oregon Sites Four-Year Turn Restriction Violation Crash History............................................................ 41 Table 4.3: Simulation Scenarios and Associate Speed and Travel Time Tables ......................................................... 42 Table 4.4: Expected Performance for 4-Lane Light to Moderate Land Use Access .................................................... 43 Table 4.5: Expected Performance for 4-Lane Heavy Land Use Access ...................................................................... 44 Table 4.6: Expected Performance for 5-Lane Light to Moderate Land Use Access .................................................... 44 Table 4.7: Expected Performance for 5-Lane Heavy Land Use Access ...................................................................... 45 Table 4.8: Expected Performance for 6-Lane Light to Moderate Land Use Access .................................................... 45 Table 4.9: Expected Performance for 6-Lane Heavy Land Use Access ...................................................................... 46
LIST OF APPENDIX TABLES
Table A.1: Four Year Crash Summary for Site OR-1.................................................................................................... 2 Table A. 2: Physical Characteristics and Volume Information – Site OR-1 .................................................................. 3 Table A.3: Turning Violation Details -- Site OR-1 ....................................................................................................... 3 Table A.4: Four Year Crash Summary for Site OR-2.................................................................................................... 4 Table A.5: Physical Characteristics and Volume Information – Site OR-2 ................................................................... 5 Table A.6: Turning Violation Details -- Site OR-2 ....................................................................................................... 5 Table A.7: Four Year Crash Summary for Site OR-3.................................................................................................... 6 Table A.8: Physical Characteristics and Volume Information – Site OR-3 ................................................................... 7 Table A.9: Turning Violation Details -- Site OR-3 ....................................................................................................... 7 Table A.10: Four Year Crash Summary for Site OR-4 .................................................................................................. 9 Table A.11: Physical Characteristics and Volume Information – Site OR-4 ............................................................... 10 Table A.12: Turning Violation Details -- Site OR-4 ................................................................................................... 10 Table A.13: Four Year Crash Summary for Site OR-5 ................................................................................................ 11 Table A.14: Physical Characteristics and Volume Information – Site OR-5 ............................................................... 12 Table A.15: Turning Violation Details -- Site OR-5 ................................................................................................... 12 Table A.16: Four Year Crash Summary for Site OR-6 ................................................................................................ 13 Table A.17: Physical Characteristics and Volume Information – Site OR-6 ............................................................... 14 Table A.18: Turning Violation Details -- Site OR-6 ................................................................................................... 14 Table A.19: Four Year Crash Summary for Site OR-7 ................................................................................................ 15 Table A.20: Physical Characteristics and Volume Information – Site OR-7 ............................................................... 16 Table A.21: Turning Violation Details -- Site OR-7 ................................................................................................... 16 Table A.22: Four Year Crash Summary for Site OR-8 ................................................................................................ 17 Table A.23: Physical Characteristics and Volume Information – Site OR-8 ............................................................... 18 Table A.24: Turning Violation Details -- Site OR-8 ................................................................................................... 18 Table A.25: Four Year Crash Summary for Site OR-9 ................................................................................................ 19 Table A.26: Physical Characteristics and Volume Information – Site OR-9 ............................................................... 20 Table A.27: Turning Violation Details -- Site OR-9 ................................................................................................... 20 Table A.28: Four Year Crash Summary for Site OR-10 .............................................................................................. 21 Table A.29: Physical Characteristics and Volume Information – Site OR-10 ............................................................. 22 Table A.30: Turning Violation Details -- Site OR-10 ................................................................................................. 22 Table A.31: Four Year Crash Summary for Site OR-11 .............................................................................................. 23 Table A.32: Physical Characteristics and Volume Information – Site OR-11 ............................................................. 24 Table A.33: Turning Violation Details -- Site OR-11 ................................................................................................. 24 Table A.34: Four Year Crash Summary for Site OR-12 .............................................................................................. 25 Table A.35: Physical Characteristics and Volume Information – Site OR-12 ............................................................. 26 Table A.36: Turning Violation Details -- Site OR-12 ................................................................................................. 26 Table A.37: Four Year Crash Summary for Site OR-13 .............................................................................................. 27 Table A.38: Physical Characteristics and Volume Information – Site OR-13 ............................................................. 28 Table A.39: Turning Violation Details -- Site OR-13 ................................................................................................. 28 Table A.40: Four Year Crash Summary for Site OR-14 .............................................................................................. 29

x
Table A.41: Physical Characteristics and Volume Information – Site OR-14 ............................................................. 30 Table A.42: Turning Violation Details -- Site OR-14 ................................................................................................. 30 Table A.43: Physical Characteristics and Volume Information – Site TX-15 ............................................................. 32 Table A.44: Turning Violation Details -- Site TX-15 .................................................................................................. 32 Table A.45: Physical Characteristics and Volume Information – Site TX-16 ............................................................. 34 Table A.46: Turning Violation Details -- Site TX-16 .................................................................................................. 34 Table A.47: Physical Characteristics and Volume Information – Site TX-17 ............................................................. 36 Table A.48: Turning Violation Details -- Site TX-17 .................................................................................................. 36 Table A.49: Physical Characteristics and Volume Information – Site TX-18 ............................................................. 38 Table A.50: Turning Violation Details -- Site TX-18 .................................................................................................. 38 Table A.51: Physical Characteristics and Volume Information – Site TX-19 ............................................................. 40 Table A.52: Turning Violation Details -- Site TX-19 .................................................................................................. 40 Table A.53: Physical Characteristics and Volume Information – Site TX-20 ............................................................. 42 Table A.54: Turning Violation Details -- Site TX-20 .................................................................................................. 42 Table A.55: Light to Moderate Land Use at 4-Lane Road -- Speed (mph) Summary ................................................. 43 Table A.56: Light to Moderate Land Use at 4-Lane Road -- Travel Time (sec.) Summary ........................................ 44 Table A.57: Heavy Land Use at 4-Lane Road -- Speed (mph) Summary ................................................................... 44 Table A.58: Heavy Land Use at 4-Lane Road -- Travel Time (sec.) Summary .......................................................... 45 Table A.59: Light to Moderate Land Use at 5-Lane Road -- Speed (mph) Summary ................................................. 45 Table A.60: Light to Moderate Land Use at 5-Lane Road -- Travel Time (sec.) Summary ........................................ 46 Table A.61: Heavy Land Use at 5-Lane Road -- Speed (mph) Summary ................................................................... 46 Table A.62: Heavy Land Use at 5-Lane Road -- Travel Time (sec.) Summary .......................................................... 46 Table A.63: Light to Moderate Land Use at 6-Lane Road -- Speed (mph) Summary ................................................. 47 Table A.64: Light to Moderate Land Use at 6-Lane Road -- Travel Time (sec.) Summary ........................................ 47 Table A.65: Heavy Land Use at 6-Lane Road -- Speed (mph) Summary ................................................................... 48 Table A.66: Heavy Land Use at 6-Lane Road -- Travel Time (sec.) Summary .......................................................... 48
LIST OF FIGURES
Figure 2.1: Access with No Turn Restrictions or Signage Only .................................................................................... 3 Figure 2.2: Access with Island Turn Restrictions .......................................................................................................... 4 Figure 2.3: Access Restricted to One-Way Activity ...................................................................................................... 5 Figure 2.4: Raised Median Right-In, Right-Out Access .............................................................................................. 13 Figure 2.5: Raised Median and Island for Right-In, Right-Out ................................................................................... 14 Figure 2.6: Raised Median with Direction Opening for Left Egress from One Direction Only .................................. 14 Figure 2.7: Raised Median with Direction Opening for Left Ingress from One Direction Only ................................. 15 Figure 2.8: Raised Median with Direction Opening for Left Ingress from Two Directions ........................................ 15 Figure 2.9: The Egress Turning Movements from Driveways/Side-streets ................................................................. 17 Figure 2.10: Delay Comparison Graph for Full and Directional Median Openings .................................................... 19 Figure 2.11: The Jug-handle Design ............................................................................................................................ 28 Figure 3.1: Oregon Study Sites .................................................................................................................................... 32
LIST OF APPENDIX FIGURES
Figure A.1: Driveway Site OR-1 - Aerial and Site Photos ............................................................................................ 2 Figure A.2: Driveway Site OR-2 - Aerial and Site Photos ............................................................................................ 4 Figure A.3: Driveway Site OR-3 - Aerial and Site Photos ............................................................................................ 6 Figure A.4: Driveway Site OR-4 - Aerial and Site Photos ............................................................................................ 9 Figure A.5: Driveway Site OR-5 - Aerial and Site Photos .......................................................................................... 11 Figure A.6: Driveway Site OR-6 - Aerial and Site Photos .......................................................................................... 13 Figure A.7: Driveway Site OR-7 - Aerial and Site Photos .......................................................................................... 15

xi
Figure A.8: Driveway Site OR-8 - Aerial and Site Photos .......................................................................................... 17 Figure A.9: Driveway Site OR-9 - Aerial and Site Photos .......................................................................................... 19 Figure A.10: Driveway Site OR-10 - Aerial and Site Photos ...................................................................................... 21 Figure A.11: Driveway Site OR-11 - Aerial and Site Photos ...................................................................................... 23 Figure A.12: Driveway Site OR-12 - Aerial and Site Photos ...................................................................................... 25 Figure A.13: Minor Road Leg at Site OR-13 - Aerial and Site Photos........................................................................ 27 Figure A.14: Minor Road Leg at Site OR-14 - Aerial and Site Photos........................................................................ 29 Figure A.15: Driveway Site TX-15 - Aerial and Site Photos ...................................................................................... 31 Figure A.16: Driveway Site TX-16 - Aerial and Site Photos ...................................................................................... 33 Figure A.17: Driveway Site TX-17 - Aerial and Site Photos ...................................................................................... 35 Figure A.18: Driveway Site TX-18 - Aerial and Site Photos ...................................................................................... 37 Figure A.19: Driveway Site TX-19 - Aerial and Site Photos ...................................................................................... 39 Figure A.20: Driveway Site TX-20 - Aerial and Site Photos ...................................................................................... 41

xii
EXECUTIVE SUMMARY
This Final Report documents the evaluation of turn restriction configurations at access points for the state of Oregon. The analysis specifically addressed driver compliance and overall turn restriction effectiveness for three general turn restriction categories: turn restrictions located only at the access point location, turn restrictions located in the road, and turn restrictions that combine the access point and road configuration options. The researchers performed a literature review, state of practice review, field observations, companion safety assessments, and micro-simulation to evaluate the various aspects of these turn restriction alternatives.

1
1.0 INTRODUCTION
This study involves the assessment of alternatives to raised/non-traversable medians on driveways and approaches. Raised medians are often considered as an effective technique to limit direct left-turns that may be due to a significant number of conflict points. The raised medians provide an added benefit of improved corridor aesthetics. However, many individual business owners have opposed the installation of raised medians due to fear of business loss. Recent Oregon focus on supporting economic development has raised awareness of the need for other effective ways to restrict vehicle turn movements that have less impact on businesses and freight movement. Consequently this research effort reviewed a wide variety of turn restriction alternatives to determine how effective they may be in addressing the safety and operational needs of the transportation network while still considering contextual sensitivities.
The research summarized in this report reviews candidate turn restriction configurations that are presented in the literature or that are used by other transportation agencies. The turn restrictions are broadly separated into three categories: turn restrictions located only at the access point, turn restrictions located only in the roadway (typically some sort of median configuration), and combined turn restriction configurations. The literature review also identified the jug handle and roundabout design that could be considered to restrict turning maneuvers, but this research did not extend to these two infrastructure alternatives.
The research team performed field evaluations to determine the effectiveness of various turn restriction configurations. For the Oregon locations, the research team also evaluated recent crash histories to determine if turn restrictions were linked to observed crashes. In addition, the research team performed micro-simulation evaluations to identify the benefits of the various turn maneuver restrictions.
Section 2.0 of this report provides background information regarding turning configuration options. This report chapter includes a literature review and a state of practice summary. Section 3.0 then summarizes the data collection and site selection aspects of the research effort. The analysis components of the study are then included in Section 4.0. The report concludes with Section 5.0 (Findings), Section 6.0 (References), and Section 7.0 (Appendix). Located in the appendix is a list of abbreviations and acronyms used in the report, detailed information on the Oregon and Texas study locations, and micro-simulation summary output information.

2
2.0 BACKGROUND
The use of a restrictive (raised) median will help to improve passenger car traffic operations by removing conflicting maneuvers, particularly left-turns, while also helping to reduce the number of crashes that may occur due to turning vehicles; however, there is a need to balance the use of a median with the needs of the roadway user. For example, the operational constraints introduced by a raised median, though enhancing passenger car operations, may also constrict heavy vehicle maneuverability along a corridor. Consequently, this summary reviews the various techniques that may be considered when identifying the optimal configuration for balancing access demands and overall corridor operations and safety.
NHCRP Report 659 titled Guide for the Geometric Design of Driveways (Gattis et al., 2010) identifies benefits of using restrictive medians at access point locations such as fewer conflicts, increased safety, and uniform travel speeds on the arterial. Since pedestrian and bicyclist conflict is a major concern at driveways, a restrictive median can also help to reduce these vulnerable user conflicts by providing pedestrian refuge opportunities. Gattis, et al. cited research by Box (1969) that further demonstrated the disproportionate number of left-turning driveway crash statistics, as shown in Table 2.1. The shaded collision types in this table represent left-turn crashes. Approximately 70 percent of the observed driveway crashes were associated with left-turn entry or exit movements.
Table 2.1: Percent of Total Driveway Crashes Based on Maneuver and Orientation Maneuver Turn Collision Total Driveway Crashes (%) Entering Left Rear-end 26 Leaving Left Right-angle 24 Entering Left Head-on angle 15 Entering Right Rear-end 12 Leaving Right Right-angle 7 Leaving Right All other 8 Leaving Left All other 3 Entering Right All other 3 Entering Left All other 2
Total Left-Turn Crashes 70 Total Right-Turn Crashes 30
Source: Adapted from Box, 1969 and Gattis, et al., 2010, Exhibit 5-29, p. 43.
Though these crash statistics are dated, this disturbing trend of left-turning crashes continues to be problematic today and there is a need to identify effective ways to restrict select turning maneuvers at certain high risk locations.
This section, therefore, reviews the various options commonly used to accommodate turning maneuvers at access point locations. These options include unconstrained access point

3
configurations, channelized access point islands, median constrained access, and combined or alternative access configurations.
2.1 STANDARD ACCESS – NO CONSTRAINTS OR PASSIVE LEFT-TURN CONSTRAINTS
Most access points have two-way operations and allow all ingress and egress movements. In some cases, a small median divider may be constructed to aid with channelization and provide an opportunity for pedestrian refuge; however, this island is not intended to restrict any of the expected maneuvers at the access point location (see Figure 2.1). In 2010, Gattis, et al., developed the National Cooperative Highway Research Plan (NCHRP) Report 659 titled Guide for the Geometric Design of Driveways. This document summarizes the variety of intersection widths and radii or tapers that may be appropriate for specific type of driveway.
Unrestricted Access Access with Median Divider Figure 2.1: Access with No Turn Restrictions or Signage Only
At locations where specific turn maneuvers are not advisable, a sign may be included that prohibits the turn maneuver. In many cases, however, these passive controls can be easily violated and a physical constraint may be more appropriate. This physical constraint may be located locally at the access point, or may be constructed in the roadway as a median. These options are further explored in the following sections.
2.2 ACCESS WITH PHYSICAL CONSTRAINTS ONLY AT INGRESS/EGRESS LOCATION
Turn restrictions may be implemented if the improvements that would be required at an access point that are needed to achieve acceptable levels of service cannot be provided due to site limitations, traffic volumes, or high crash frequencies. Often the most effective solution is to restrict left-turning vehicles. When this need to restrict left-turn maneuvers is identified and passive turn restrictions, such as painted islands and “No Left-Turn” signs are no longer effective, physical constraints may be warranted such as the construction of channelization islands or the restriction of access to only one direction of travel.

4
Raised islands that provide the driver of a motor vehicle positive guidance for the successful execution of a turning maneuver are often used at the specific access point location. Figure 2.2 depicts three common access island configurations. The right-in right-out left-out (RIROLO) configuration shown in “a” may be used at locations where a left-turn onto the public road is acceptable but the left-turn into the access is not recommended. Similarly, the right-in right-out left-in (RIROLI) shown in “b” may be appropriate at some locations. In many cases, any left-turn activity is problematic and so the right-in right-out (RIRO) schematic “c” (also commonly known as a “pork chop” island) may be used.
RIROLO Access RIROLI Access
RIRO Access
Figure 2.2: Access with Island Turn Restrictions
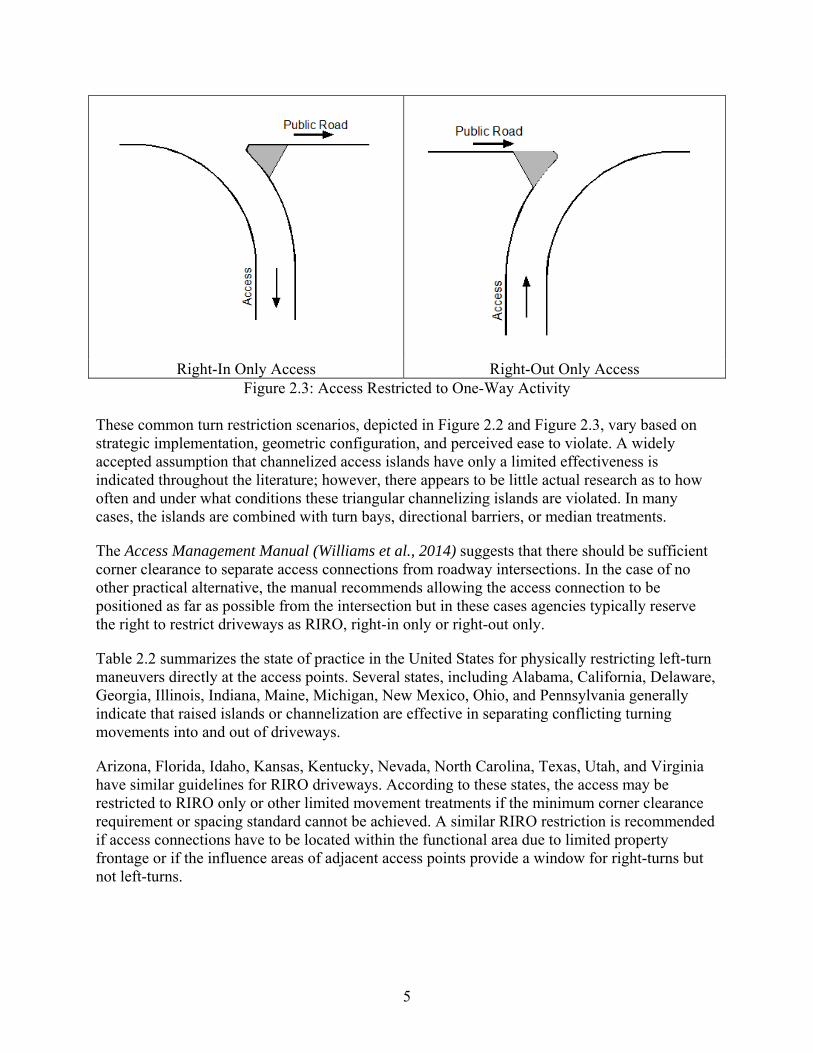
An additional strategy to physically restrict turn-movements at an access point is to limit the operations to one-way activities as depicted in the right-in only and right-out only schematics shown in Figure 2.3.
5
Right-In Only Access Right-Out Only Access Figure 2.3: Access Restricted to One-Way Activity
These common turn restriction scenarios, depicted in Figure 2.2 and Figure 2.3, vary based on strategic implementation, geometric configuration, and perceived ease to violate. A widely accepted assumption that channelized access islands have only a limited effectiveness is indicated throughout the literature; however, there appears to be little actual research as to how often and under what conditions these triangular channelizing islands are violated. In many cases, the islands are combined with turn bays, directional barriers, or median treatments.
The Access Management Manual (Williams et al., 2014) suggests that there should be sufficient corner clearance to separate access connections from roadway intersections. In the case of no other practical alternative, the manual recommends allowing the access connection to be positioned as far as possible from the intersection but in these cases agencies typically reserve the right to restrict driveways as RIRO, right-in only or right-out only.
Table 2.2 summarizes the state of practice in the United States for physically restricting left-turn maneuvers directly at the access points. Several states, including Alabama, California, Delaware, Georgia, Illinois, Indiana, Maine, Michigan, New Mexico, Ohio, and Pennsylvania generally indicate that raised islands or channelization are effective in separating conflicting turning movements into and out of driveways.
Arizona, Florida, Idaho, Kansas, Kentucky, Nevada, North Carolina, Texas, Utah, and Virginia have similar guidelines for RIRO driveways. According to these states, the access may be restricted to RIRO only or other limited movement treatments if the minimum corner clearance requirement or spacing standard cannot be achieved. A similar RIRO restriction is recommended if access connections have to be located within the functional area due to limited property frontage or if the influence areas of adjacent access points provide a window for right-turns but not left-turns.

6
Table 2.2: Physically Restricting Left-Turns at Access Point Locations
State Restrict Left-Turn out of Access
(Including Right--in/right-out only, channelization, driveway island, signage)
Department of Transportation (DOT) Source
Alabama
-Install driveway channelizing island to prevent left-turn maneuvers and driveway encroachment conflicts. -Install channelizing islands to control the merge area of right-turn egress vehicle situations.
Alabama (ALDOT Feb. 2014, ALDOT Jan. 2014)
Arizona
- Channelization encouraged to reduce areas of conflict by separating or regulating traffic movements. -In urban areas with existing development, if minimum access spacing along the crossroad is not feasible, as much distance as practical should be obtained. An absolute minimum of 100 ft should be provided and any access provided within the remaining distance to 660 ft should be accessed only by RIRO traffic.
Arizona (AZDOT 2012)
California -Restrict undesirable moves with traffic islands. California
(CALTRANS 2014)
Colorado
-Channelized driveway islands may be required for turn restricted driveways when the driveway volume is predicted to exceed 100 design hourly volume (DHV), no restrictive center median is in place or programmed to be constructed or it is likely that there will be frequent violations of the turn restrictions.
Colorado (CoDOT 2002)
Delaware
-RIRO only driveways are controlled with proper channelization and pavement markings. -All private direct access permitted shall be for right turns only for certain types of roadway category.
Delaware (DelDOT 2013, 2006)
Florida
-Where minimum corner clearance cannot be met, due to specific site conditions, attempt to achieve 125 to 230 feet of corner clearance. In these cases it is most important to prohibit (or limit) left turns from these driveway locations. Right turn in/out only driveway is provided with "pork-chop channelization" and with appropriate signs like "Do Not Enter" or "Right Lane Must Turn Right" or with flexible posts on main road to discourage left turns. Through use of restrictive medians, almost every driveway along the corridor essentially becomes a RIRO driveway with only two conflict points.
Florida (FDOT 2006)
Georgia
-Raised islands are used to channelize the movements at a driveway where only right turns are allowed. -Raised channelizing islands help control and direct the movement of traffic by reducing excess pavement areas, and channelizing turning movements at intersections.
Georgia (GDOT 2014, 2009)
Idaho -In addition to the minimum corner clearance requirements, an approach to a divided State highway may be restricted to a right-turn in and a right-turn out.
Idaho (IDT 2001)
Illinois - Install driveway channelizing island to prevent outbound left-turn maneuvers.
Illinois (IDOT 2013)
Indiana
-Suggests to install driveway channelizing island to discourage left-turn maneuvers as one of the retrofit techniques to access/driveway location and operation where left-turns are undesirable, and there is a need to restrict driveway movements to RIRO on undivided roadways and where there is a high crash rate or frequency related to left-turn movements.
Indiana (INDOT 2009)

7
Table 2.2: Physically Restricting Left-Turns at Access Point Locations (continued)
State Restrict Left-Turn out of Access
(Including Right--in/right-out only, channelization, driveway island, signage)
DOT Source
Iowa The department reserves the right to close an existing median opening when the department deems it is necessary.
Iowa (IowaDOT 2012)
Kansas
-RIRO access is typically used on highways in developed areas where the influence areas of adjacent access points provide a window for right-turns but not left-turns. -Without a raised median on the main roadway to restrict left-turning movements, the RIRO island designs can have reduced effectiveness. -Including a raised median reduces the number of conflict points at the access point intersection, which should increase safety with proper traffic movement.
Kansas (KSDOT 2013)
Kentucky
-The minimum corner clearance on minor crossroads should not be less than 150 feet. In extreme cases, a RIRO entrance may be considered on the minor roadway within 150 feet from the major street, provided a nontraversable median is constructed to prevent left turns. -For divided roadways, each side can be considered independently in determining the distance between access points on the outside of the roadway. If access points are offset, then RIRO entrances shall be utilized.
Kentucky (KYTC 2006)
Maryland
-Commercial RIRO Entrances shall be used on all divided highways with posted speeds above 40 mph. -Alternatively, in urban street environments where posted speeds are 40 mph or lower and a narrow raised median separates the directional highways, other commercial entrances may be used as long as appropriate signing is provided to discourage errant movements.
Maryland (MdDOT 2004)
Michigan
-In order to separate conflicting turning movements into and out of property, “right-in only”, “right-out only” or “left-turn only” access by channelization islands may be effective. Particularly on corner properties, allowing "right-turn only" in and out can cut down on left-turns near intersections.
Michigan (MiDOT 2011)
Minnesota
-Where an access is needed for a specific movement such as a one-way driveway, the driveway may be limited to right-in-only or right-out-only; -On a divided highway where a lack of gaps prevent entering traffic from safely weaving across multiple lanes to make a left-turn or U-turn, and a reasonably convenient and suitable alternative route is available, right-out movements may be restricted; -When a driveway and an intersection are closely spaced such that a vehicle following a turning vehicle cannot anticipate where the lead vehicle will turn, right-in movements may be restricted;
Minnesota (MnDOT 2001, 2008)
Mississippi
-In all cases, the State Traffic Engineer (or designee) reserves authority to prohibit certain turning movements (e.g., by requiring right in/right out only access or a raised median to prevent left turns) if it is deemed necessary to address a safety concern. -Exceptions may be approved if as a result of Mississippi DOT action the property would become landlocked. If an exception to the minimum corner clearance is requested and approved, the access will be RIRO only, and under no circumstances will any part of a driveway be permitted to connect with either the highway or intersecting side street within 50 feet from the near edge of the adjacent highway/street.
Mississippi (MsDOT 2012)

8
Table 2.2: Physically Restricting Left-Turns at Access Point Locations (continued)
State Restrict Left-Turn out of Access
(Including Right--in/right-out only, channelization, driveway island, signage)
DOT Source
Nevada
-Spacing of at-grade intersections range from one-half mile in urban areas to one mile in rural areas. Closer spacing is allowed only when there is no reasonable alternate access to the general street system and may be restricted to right in and right out turns. -Class III driveways which meet the Manual on Uniform Traffic Control Devices (MUTCD) warrants for signalization, but do not meet the spacing requirements of subsection 4.6 shall be right in and right out driveways, only.
Nevada (NDOT 1999)
New Mexico -New Mexico DOT suggests RIRO only as one of the access channelization alternatives to restrict turning movements.
New Mexico (NMDOT 2001)
North Carolina
-If access connections have to be located within the functional area due to limited property frontage, the North Carolina DOT may restrict access to RIRO or other limited movement treatments.
North Carolina (NCDOT 2003)
Ohio
-Channelizing islands are used to control and direct traffic movements on an intersection approach. A properly designed channelizing island will designate the correct turning path and define the merge area thus reducing conflicting movements. -Channelizing Islands shall be considered on arterials without a median where left turns are being restricted and on one-way streets to discourage wrong way turns. -No direct private access shall be permitted unless the property retains deeded rights and has no other reasonable Ohio Department of Transportation Issued December 2001 State Highway Access Management Manual Version 8-15-03 Page 32 alternative access to the general street system. In such cases, access shall be limited to right-in, right-out only.
Ohio (OHDOT 2008)
Pennsylvania
-Driveway channelization is used where it is found to be necessary to restrict particular turning movements at a driveway. If no other reasonable access to the property is available, and no reasonable alternative is identified, the driveway shall be located the farthest possible distance from the intersecting roadway. In such cases, directional connections (i.e., right in/right out only, right in only or right out only) may be required.
Pennsylvania (PennDOT 2006)
South Carolina
-The Department reserves the right to limit access to right-in, right-out. -Access to adjacent property is provided by right-in and right-out maneuvers in conjunction with U-turn and crossing maneuvers at paved median crossovers. -When a right-in, right-out driveway is implemented on an undivided roadway, the use of a restrictive median in concurrence with the “pork chop” island is preferred; however, adjacent impacts must be evaluated prior to implementing restrictive medians. -In the case of large developments with outparcels, access for outparcels should be provided only internally; however, shared or individual driveways may be permitted provided that twice the normal spacing requirements are met. When direct access is approved, it may be limited to RIRO.
South Carolina (SCDOT 2008)

9
Table 2.2: Physically Restricting Left-Turns at Access Point Locations (continued)
State Restrict Left-Turn out of Access
(Including Right--in/right-out only, channelization, driveway island, signage)
DOT Source
South Dakota
-A channelizing island is used in a driveway throat at its intersection with a roadway to restrict selected left-turn movements and limit the basic crossing conflicts. Where left turns are undesirable and there is a need to restrict driveway movements to RIRO on undivided roadways. Where there is a high accident rate or frequency related to left-turn movements. -Existing driveways providing all movements may develop operational problems as street congestion increases. Operational problems related to left turns may be remedied by restricting movements to right-in and right-out.
South Dakota (SDDOT - not dated)
Utah
-Driveway islands that channel traffic movements may be required for turn-restricted movements when any of the following apply. (A) No restrictive center median is in place or programmed to be constructed. (B) When frequent violations of the turn restrictions are anticipated. -Roadway approaches and driveways that are located too close to an intersection can affect signal operation. In these cases it can be considered to restrict access to "right-in/out" operation only.
Utah (UDOT 2013)
Vermont Not Addressed specifically, but can be assessed from the turning restrictions.
Vermont (VtDOT 2005)
Virginia
The entrance shall be physically restricted to right-in or right-out movements or both or similar restrictions if spacing standards don’t meet. On small corner parcels left turn accessibility may be a problem and access to parcels may be limited to RIRO or similarly restricted movements.Right turn in/outs should accompany reasonable taper, and channelized flow if required
Virginia (VDOT 2013)
Washington
All private direct access shall be for right turns only on multilane facilities, unless special conditions warrant and are demonstrated to the satisfaction of the Department by a traffic analysis, signed and sealed by a qualified professional engineer, and included with the connection permit application and only if left turn channelization is provided.
Washington (WSDOT 2002, 2013)
West Virginia
Channelizing or divisional islands for high-volume driveways may be used to prevent egress traffic from encroaching upon the side of the drive used by ingress traffic. A center channelizing island can be used in a two-way driveway to restrict entries to right turns in and right turns out.
West Virginia (WVDOT 2004, 2006)
Wyoming
-With volumes greater than 30,000 vehicles per day (vpd), a median island should be installed. A median island would prohibit left turn direct access and direct accesses would be RIRO only. Right turn deceleration lanes should be installed at the direct accesses. -If a rural principal arterial is a non-interstate, divided multilane highway that allows at-grade intersections (where all roadways join or cross at the same level), then the field and private residential accesses shall be right-in and right-out only.
Wyoming (WYDOT 2005)
Colorado, West Virginia, and Wyoming recommend restricting access to RIRO only based on traffic volume. Colorado suggests restricting certain turning movements at driveways by channelized islands if the driveway volume is predicted to exceed a design hourly volume of 100 vehicles per hour (vph). In West Virginia, channelizing or divisional islands for high-volume driveways may be used to prevent entering traffic from encroaching upon the side of the drive used by exiting traffic. A center channelizing island can be used in a two-way driveway to

10
restrict entries to right turns in and right turns out. In Wyoming, if the volume is greater than 30,000 vpd, a median island should be installed to prohibit left turn direct access and driveways would then effectively be RIRO only. Right turn deceleration lanes should be installed at these driveway locations.
Table 2.3 summarizes common ways the states determine how and when to restrict left-turns using median techniques, dedicated lanes, or one-way lanes at the access points. In many cases, these techniques are paired with driveway island configurations. A separate state of practice on median implementation strategies is presented later in this chapter.
Table 2.3: Restricting Left-Turns with Medians, Dedicated and One-Way Lanes State Restrict Left-Turn into Driveways DOT Source
Alabama -Install median barrier divider with no direct left-turn access. Alabama (ALDOT Feb. 2014, Jan. 2014)
Colorado
-For non-rural highways, left turns shall be prohibited if a non-traversable median is already established and the proposed opening in the median does not provide the general public any significant benefits to highway traffic operations and safety or would be counter to the purpose of the median. -Rural Highway: Left or right turn movements may be restricted only if, in the determination of the Department or the issuing authority, one or both movements create significant roadway congestion or safety problems or hazards or a restrictive median is already in place. Turning movements shall not be restricted if the access meets sight distance requirements, and auxiliary lane design requirements are met, no restrictive median is present, and if 20-year projections indicate that the intersection volumes would be less than 75 percent of those required for MUTCD traffic signal volume warrants. -When private access is permitted, left turns may be allowed if in the opinion of the department such left turns can be reasonably accomplished and it is not a divided highway.
Colorado (CoDOT 2002)
Delaware
-Left turns are allowed where design meets all safety requirements [undefined]. -Median cross-over and channelization is provided to account for both right and left turns. Storage lanes should be provided by checking the volume warrants for left-turn lane.
Delaware (DelDOT 2013, 2006)
Florida -Left turns exiting the driveway are permitted but for that, separate left turn lane is to be provided in the driveway.
Florida (FDOT 2006)
Georgia
-Left-in/out allowed with appropriate median opening design. If no other design alternatives exist and interior drives are proposed which do not meet minimum spacing, the left turning movement should be restricted with a raised barrier.
Georgia (GDOT 2014, 2009)
Indiana
-Construct or Modify Median to Allow Only Left Turns from a Major Roadway: Where there are safety or operational problems caused by the left-turn egress movement from a development and the rerouting that would occur due to the left-turn restriction could be satisfactorily accommodated.
Indiana (INDOT 2009)

11
Table 2.3: Restricting Left-Turns with Medians, Dedicated and One-Way Lanes (continued) State Restrict Left-Turn into Driveways DOT Source
Kansas
-Access medians are used to separate the ingress and egress movements for very high–intensity access points, such as access type 6. The Kansas DOT provides guidance for when an access median may be recommended with minimum dimensions requirement.
Kansas (KSDOT 2013)
Maine -Minimum safe sight distance must be provided for the vehicles turning left from a major roadway.
Maine (MaineDOT 2001)
Maryland -In one-way commercial entrances, directional control restricting left turns may be provided.
Maryland (MdDOT 2004)
Minnesota -When high traffic volumes result in a lack gaps for entering and exiting traffic to safely cross, left-turn movement and crossing movements may be restricted;
Minnesota (MnDOT 2001, 2008)
Missouri
-There is a shorter guideline for right-in right-out driveways on urban routes with non-traversable medians and speed limits at or below 45 miles per hour. On urban routes with non-traversable medians, Shorter driveway spacing and corner clearance upstream from an intersection is acceptable for right-in, right-out driveways.
Missouri (MoDOT 2009)
Nevada
Private direct access will be permitted, at a minimum, for right turns if the access meets minimum spacing standards for minor arterial. Only one access will be allowed per parcel or for contiguous parcels under one ownership. The access may also have left turns in, if the addition of the left turning movement will improve the operation of an adjacent full-movement intersection and not compromise safety at the access.
Nevada (NDOT 1999)
New Mexico -Restrictions to full left-turn access may be required due to safety or operational deficiencies that would be expected if a full access median were implemented.
New Mexico (NMDOT 2001)
New York
-Roundabouts, U-turns, jug handles, or indirect lefts can help provide access for those who would otherwise make a left turn. Consider other alternatives, before using a two-way left-turn lane (TWLTL), such as prohibiting midblock left-turns and providing for U-turns.
New York (NYSDOT 2011)
Ohio
-Left turn movements shall not be permitted if a median is already established and the opening of the median would not provide, in the determination of the Department, any significant operational or safety benefits to the general public or would be counter to the purpose of the median construction and the continued function of the highway at the category assigned to it. -A left turn movement may be permitted if (1) the left turn movement does not have the potential for signalization, and (2) if the department determines that the left turn movement does not cause congestion or safety problems or lower the level of service, and (3) alternatives to the left turn would cause roadway and intersection operation and safety problems, and (4) does not interfere with operation of the street system or access to adjacent properties.
Ohio (OHDOT 2008)

12
Table 2.3: State of Practice for Restricting Left-Turn Ingress at Access Points (continued) State Restrict Left-Turn into Driveways DOT Source
Pennsylvania
-The restriction of left turns into or out of a driveway reduces interruptions to through traffic on roadways. Turn restrictions are an effective measure for corner lots at intersections, because they eliminate left turning movements within the functional area of the intersection. -Turn restrictions may also be implemented if the improvements that would be required at a driveway to achieve acceptable levels of service cannot be provided due to constraints or there is a history of high crash rates caused by left turning vehicles.
Pennsylvania (PennDOT 2006)
South Dakota
-Construct or modify medians to allow only left turns from a major roadway: Where there are safety or operational problems caused by the left-turn egress movement from a development and the rerouting that would occur due to the left-turn restriction could be satisfactorily accommodated. -Use median openings to provide separate left-turn entrances and exits at major traffic generators. Use median modifications to eliminate left-turn out movements (used where there are safety or operational problems due to left-turn egress)
South Dakota (SDDOT - undated)
Texas -Left Turns are allowed with appropriate median cross over spacing and auxilliary lanes on highway.
Texas (TxDOT 2011)
Utah
The following apply to Utah state highways with category designations of 4, 5, 6, 7 or 8: (A) If a restrictive median exists, left turns at unsignalized intersections shall be restricted unless the restriction of these movements will cause a safety or operations problem or cause an out-of-direction movement of greater than one mile (or one-half mile for state highways with Category 6, 7, or 8 designations). (B) If a flush or traversable median exists, left turns may be permitted unless an operational or safety problem is identified. Left turn movements may not be permitted if a median is already established and the proposed opening of the median does not provide, in the determination of the Department, any significant operational or safety benefits to the general public or will be counter to the purpose of the median construction and the continued function of the highway at the category assigned to it.
Utah (UDOT 2013)
Vermont
-One or both left turn movements at the access may be permitted if the applicant establishes to the Agency's satisfaction that left turn movements would not create unreasonable congestion or safety problems or lower the level of service below Agency Policy.
Vermont (VtDOT 2005)
Washington -Proper channelization should be used to allow Left Turn in/out provided there are special conditions and they are justified to the satisfaction of the department by a traffic analysis.
Washington (WSDOT 2002, 2013)
West Virginia -Left turn in/out are allowed after providing certain design conditions, mentioned in description.
West Virginia (WVDOT 2004, 2006)
Wyoming -With volumes greater than 30,000 vpd, a median island should be installed. A median island would prohibit left turn direct access as previously noted in Table 2.2.
Wyoming (WYDOT 2005)

13
2.3 ACCESS WITH PHYSICAL CONSTRAINTS IN ROADWAY (MEDIAN TREATMENTS)
Median treatments are typically classified as no median, traversable or flush median, and raised or restricted median. Locations without medians typically have a painted centerline. The traversable or flush median, including the common TWLTL, facilitates left-turn activity. Consequently the only median treatment that physically constrains left-turn maneuvers is the raised or restricted median. A variety of median configurations may be considered. Figure 2.4 and Figure 2.5 depict a median configuration that results in a RIRO operation. The raised median as shown in Figure 2.4 appears to be continuous along the full length of the corridor; however, a localized median is also common at locations where direct access needs to be restricted. The combined raised median and RIRO island, as shown in Figure 2.5, may be observed at locations where additional positive guidance is needed to ensure that drivers do not inadvertently turn left into active oncoming traffic.
Figure 2.4: Raised Median Right-In, Right-Out Access

14
Figure 2.5: Raised Median and Island for Right-In, Right-Out
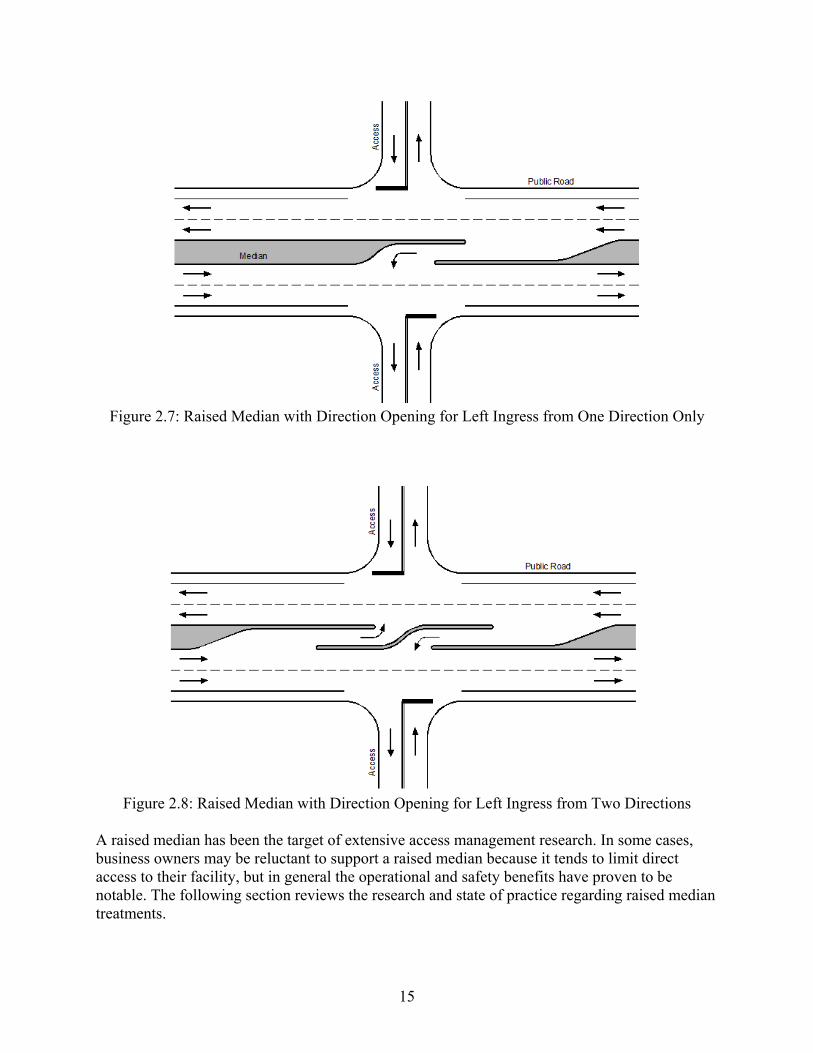
In some cases, medians may have a full, unobstructed median opening at an access point; however, median configurations can also be constructed that will limit the left-turn maneuvers from one or both directions as shown in Figure 2.6, Figure 2.7, and Figure 2.8.
Figure 2.6: Raised Median with Direction Opening for Left Egress from One Direction Only
15
Figure 2.7: Raised Median with Direction Opening for Left Ingress from One Direction Only
Figure 2.8: Raised Median with Direction Opening for Left Ingress from Two Directions
A raised median has been the target of extensive access management research. In some cases, business owners may be reluctant to support a raised median because it tends to limit direct access to their facility, but in general the operational and safety benefits have proven to be notable. The following section reviews the research and state of practice regarding raised median treatments.

16
2.3.1 Literature Review
The Access Management Manual (Williams et al., 2014) indicates that the TWLTL has clear operational benefits but does not have the same safety benefits of the non-traversable median. The raised or non-traversable median does have a greater construction cost and may create snow removal challenges in some regions when compared to the TWLTL. The restrictive median, however, reduces the number of head-on collisions by separating vehicles travelling in opposite directions. Research performed by Bonneson and McCoy (1997) determined that raised medians reduced vehicular crashes, minimized pedestrian conflicts, and improved aesthetics.
Land Development
From a land development perspective, Stover and Koepke (2002) indicated that raised medians with left-turn openings provide space for deceleration and do not affect the queue length in the adjacent through lanes, thereby improving traffic operations. The spacing of access points on opposite sides of the road can also be somewhat relaxed when a raised median is located in the center of the road.
The Florida DOT’s Median Handbook (Sokolow et al., 2006) defines “full median opening” as the median opening that allows all turns and has 18 major conflict points. The Handbook further defines “directional median opening” as the opening that limits turning movements and lowers the number of conflicts. As the intensity of land development increases, the traffic demand to access abutting properties also increases. Thus, left turn traffic at closely spaced full median openings can “interlock.” At the same time, a U-turn median opening can serve several access drives and eliminate the need for direct left-turn exit movements from driveways. When U-turns are provided as an alternative to left-turns, mid-block median opening width may be achieved with less than a width of 30 feet. The Handbook identified deceleration lengths, queue storage, turn radius and perception/reaction distance as key factors that should be considered in determining the spacing of median openings.
Safety
According to NHCRP Report 420 (Gluck et al. 1999), non-traversable medians are generally safer than the TWLTLs. The study reported the mean crash rate for undivided highway to be 5.29 crashes per million vehicle miles traveled (MVMT), while the crash rate for roadways with divided medians was 3.34 crashes per MVMT.
California researchers Moskowitz and Schafer (1960) determined that the relative crash rates on roadways with non-traversable medians compared with undivided roadways had a value of 0.71. Georgia research by Parsonson (Parsonson 1990) found that non-traversable medians are safer than TWLTLs when corridor traffic volumes exceed 24,000 to 28,000 vpd. Long et al. (Long et al. 1993) conducted a study on the safety of selected medians using crash data that extended over several years. Long’s study recommended the use of non-traversable medians at critical locations where the left-turns need to be restricted to improve safety. A 1994 study by Bowman and Vecellio found the relative crash rates on roadways with restrictive medians compared with undivided roadways and TWLTLs as 0.80 and 0.50 respectively.

17
Williams and Forester (Williams and Forester 1996) prescribed limiting the number of conflict points and separating conflict areas as a design practice and policy to improve roadway safety and operations.
Lu et al. (Lu et al. 2001) evaluated the quantitative and qualitative safety of the egress turn movements from driveways/side-streets (see Figure 2.9) and divided the crash data from seven districts in Florida into three groups on the basis of the crash characteristics: (1) total crashes, (2) property-damage only and injury/fatality crashes, and (3) typical crashes. With the installation of the median, the average crash rate (crashes per MVMT) for property-damage only was reduced by approximately six percent and the injury and fatality crashes were reduced by 27 percent.
Direct left turn movements Right turn U-turn movements
Figure 2.9: The Egress Turning Movements from Driveways/Side-streets (Source: Lu et al. 2001)
A thesis performed by Philips (Philips 2004) involved a sample of 62 four-lane median divided roadways and 81 five-lane roads with TWLTLs that were used to calibrate and validate the 1996 Bonneson and McCoy collision model that was based on exposure characteristics and geometry, land use, and safety parameters. Philips determined that the percentage of class A crashes (incapacitating injury) and class B collisions (non-incapacitating injury) were reduced by 0.25 percent and three percent respectively. The pedestrian related crashes, however, increased by three percent and the class C collisions (possible injury) were not affected by the installation of the raised median.
Schlutz et al. (Schlutz et al. 2009) performed a statistical analysis to evaluate the crash rate, collision type, and crash severity score for undivided roadway and raised median roadway. Following installation of a non-traversable median, their findings indicate an expected crash reduction of 1.23 crashes per MVMT.

18
Squires and Parsonson (1989) performed one of the most frequently cited median treatment research efforts. The Georgia research team collected field data for four-lane and six-lane roadway sections and obtained Georgia crash data for the locations so as to compare the number of crashes resulting from raised medians and contrasted to TWLTL median treatments. Due to the variation of average daily traffic at the sites, the researchers used crashes per million vehicle miles and crashes per mile per year as indicators for safety comparisons between non-traversable medians and TWLTLs. The summary data concluded that the total number of crashes per million vehicle miles decreased by approximately 15 percent for four-lane sections and 25 percent for six-lane sections whereas the crashes per mile per year decreased by 29 percent for four-lane sections and 29 percent for six-lane sections. This observation proved to statistically support the hypothesis that raised medians are safer than TWLTLs. The researchers did note, however, that the number of crashes at a single location could not be the sole evaluation criteria since medians tend to shift conflict points to other intersection locations. The researchers also noted that TWLTLs can perform as well as raised medians at some locations depending on the access density, traffic volumes, and traffic signal spacing thresholds.
Operations
NHCRP Report 420 (Gluck et al. 1999) recommended several guidelines to enhance median operations. These include:
A median of at least 25 feet wide is necessary to help ensure that a crossing or left turning vehicle, stopped in the median perpendicular to the through traffic lane, will not extend beyond the median. This criterion is based on the length of a passenger car. At locations with higher volumes of heavy vehicles, a median width that will accommodate these longer design vehicles should be considered.
A narrow full median opening allows only one left-turning vehicle at a time to advance into the median opening.
A wide median opening allows multiple vehicles to stop in the opening. However, this may create a confusing and conflicting pattern of movements, angle stopping by vehicles in the median opening area (which is undesirable), and some drivers’ vision obstructed by other vehicles.
Zhou et al. (Zhou et al. 2002) studied the operational effects of median treatment at eight sites in West Central Florida using 300 hours of field data to analyze travel time, delay, speed, traffic control and geometric data. The researchers developed an operational database and performed a statistical analysis. The project team developed delay models for direct left-turns (DLTs) and right-turns followed by U-turns (RTUTs) using variables including the flow rates of through and turning traffic and the percentages of upstream through-traffic-flow-rate. They ultimately developed a delay comparison graph for full and directional median openings (see Figure 2.10). It was also noted that the signal spacing at the data collection sites was less than two miles, a configuration that induced platoon vehicular flow on the major street and hence affected the DLT and RTUT movements.

19
Figure 2.10: Delay Comparison Graph for Full and Directional Median Openings (Source: Zhou et al. 2002)
NHRCP Report 524 (Potts et al. 2004) provides an overview of conventional and directional (with and without left turn lanes) median opening designs. These midblock median openings provide space for vehicles to make a U-turn and access driveways on the opposite side of the street. The proximity to driveways is one of the factors that influence the operational and safety performance of median openings.
Yang and Zhou (Yang and Zhou 2004) used CORSIM (a micro-simulation software for surface street and freeway simulation) to evaluate RTUT as an alternative to DLT in terms of traffic operations. The researchers used travel time and delay as measures of effectiveness. The team calibrated simulation models for six sites in Tampa, Florida. The sites had six or eight lanes with varying weaving distances and the simulation used twelve random seeds to simulate through traffic volumes ranging from 3000 to 7000 vph with increments of 1000 vph and three driveway volumes of 150, 250 and 350 vph. The researchers plotted travel time and delay curves for all six sites and investigated the breakpoints at the intersection of RTUT and DLT curves. The breakpoint was the point after which RTUT operationally outperformed the DLT. The delay/travel time curves for DLT became steeper as the through volumes increased. The researchers discussed several complications in the study, such as the software’s capability to incorporate median characteristics and driver’s behavior.
Eisele and Frawley (Eisele and Frawley 2005) used the micro-simulation tool VISSIM to simulate traffic operations to investigate the impact on traffic operations with different median treatments (raised median and TWLTLs). Case studies from the Texas cities of Bryan, Temple, and Tyler indicated that the reduction in conflict points when changing from TWLTLs to raised median varied from 50 percent to 60 percent. However, the travel times increased from one up to 44 percent in the scenarios where raised medians were installed. Also, due to turn restrictions

20
along a raised median, the crash rates and crash severities for the Bryan site were reduced with crash rates changing from 4.3 to 1.8 crashes per MVMT. The reduction in speeds due to installation of raised medians was minimal.
Pirinccioglu et al. (Pirinccioglu et al. 2006) collected median characteristics data at 16 sites in Tampa Bay area and Plant City. The data was classified according to the geometric characteristics taking both signalized and median opening sites into consideration. The signalized intersection sites consisted of the sites at which the driver had to complete the U-turn movement of RTUT at a signalized intersection. The researchers used two types of conflict rates (CR1, CR2) to analyze data for nine conflict types. CR1 represents the number of conflicts per hour and CR2 represents the conflicts per 1,000 involved vehicles. Several conflict types for RTUT decreased from 14 to 26 percent during peak hour. With the exception of the DLT3, all DLT conflicts increased significantly during the peak hour. It was concluded that if CR1 was the criterion to compare the safety between RTUT and DLT at signalized intersections, DLT movements were found to be twice as unsafe as the RTUT movements. If CR2 was considered, there was not much increase in the number of observed conflicts (5.4 percent) from DLT to RTUT movements owing to the low RTUT volumes. For median opening sites, the researchers noted that DLT movements generated 10 percent more CR1 type conflict rate and 62 percent more CR2 type conflict rate than RTUT.
Liu et al. (Liu et al. 2007) developed a model to estimate the number of drivers executing a RTUT instead of a DLT under different roadway and traffic conditions. The researchers collected data for 34 selected roadway segments in Central Florida for a period of four years. The research team compared travel time and delays for both treatments and determined the conditions in which the drivers would choose RTUT instead of DLT. With lesser volumes on the major street and the driveway, the vehicle turning right and taking a U-turn experienced one to three seconds lesser delay than the vehicle making a direct left turn. However, when the volumes increased, the delay difference increased to seven to 12 seconds. Liu et al. developed a logit model using the number of drivers selecting RTUT, DLT, flow rates of RTUT and left turn demand from a driveway as variables and found that all independent variables were significant with 95 percent confidence level. The drivers preferred to take a DLT during lower traffic volumes; however the preference changed to RTUT in case of higher traffic volumes. The research concluded that more drivers preferred making a RTUT on a six/eight lane roadway when compared with the four lane roadways, which was intuitive.
2.3.2 State of Practice for the Raised (Non-traversable) Median
Most states recommend installing non-traversable medians to reduce conflict points and prevent vehicles from turning left into and out of driveways. Common factors taken into consideration include traffic volume, speed, crash rate and frequency, number of lanes, access control, and concerns for pedestrians and bicyclists.
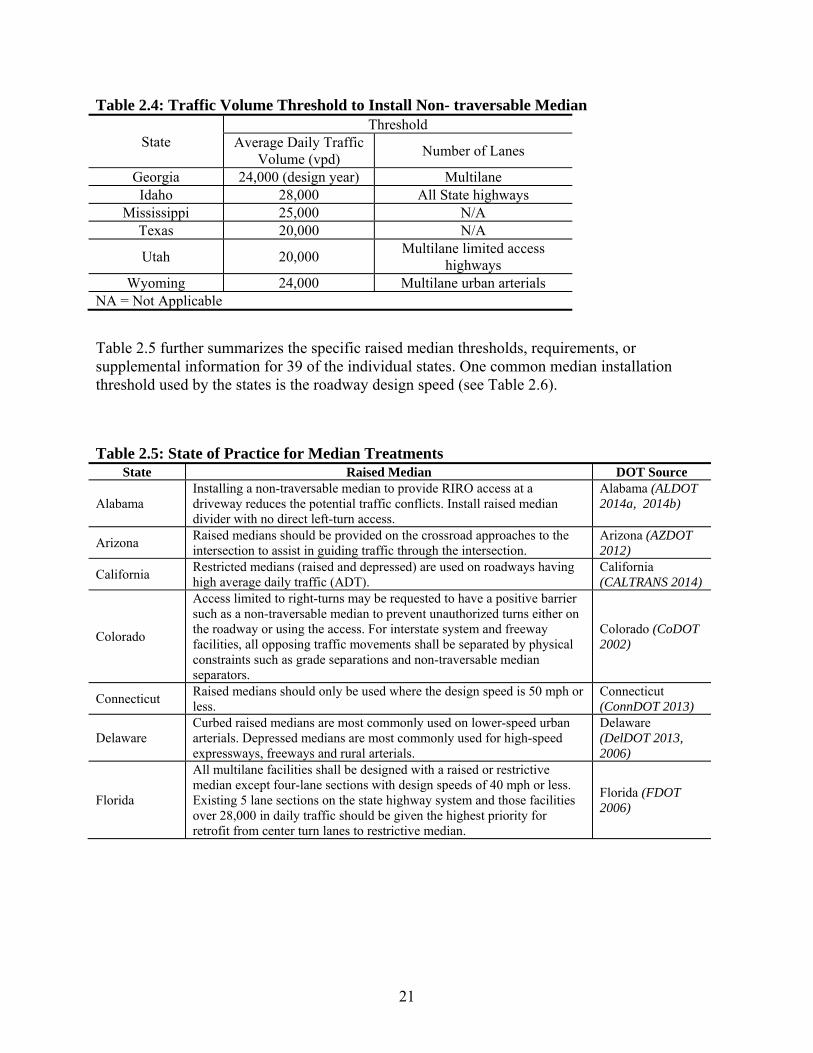
Several states, including Georgia, Idaho, Mississippi, Texas, Utah, and Wyoming have provided guidelines to install non-traversable medians based on traffic volume, though the volume thresholds vary between the states (Table 2.4).
21
Table 2.4: Traffic Volume Threshold to Install Non- traversable Median
State Threshold
Average Daily Traffic Volume (vpd)
Number of Lanes
Georgia 24,000 (design year) Multilane Idaho 28,000 All State highways
Mississippi 25,000 N/A Texas 20,000 N/A
Utah 20,000 Multilane limited access
highways Wyoming 24,000 Multilane urban arterials
NA = Not Applicable
Table 2.5 further summarizes the specific raised median thresholds, requirements, or supplemental information for 39 of the individual states. One common median installation threshold used by the states is the roadway design speed (see Table 2.6).
Table 2.5: State of Practice for Median Treatments State Raised Median DOT Source
Alabama Installing a non-traversable median to provide RIRO access at a driveway reduces the potential traffic conflicts. Install raised median divider with no direct left-turn access.
Alabama (ALDOT 2014a, 2014b)
Arizona Raised medians should be provided on the crossroad approaches to the intersection to assist in guiding traffic through the intersection.
Arizona (AZDOT 2012)
California Restricted medians (raised and depressed) are used on roadways having high average daily traffic (ADT).
California (CALTRANS 2014)
Colorado
Access limited to right-turns may be requested to have a positive barrier such as a non-traversable median to prevent unauthorized turns either on the roadway or using the access. For interstate system and freeway facilities, all opposing traffic movements shall be separated by physical constraints such as grade separations and non-traversable median separators.
Colorado (CoDOT 2002)
Connecticut Raised medians should only be used where the design speed is 50 mph or less.
Connecticut (ConnDOT 2013)
Delaware Curbed raised medians are most commonly used on lower-speed urban arterials. Depressed medians are most commonly used for high-speed expressways, freeways and rural arterials.
Delaware (DelDOT 2013, 2006)
Florida
All multilane facilities shall be designed with a raised or restrictive median except four-lane sections with design speeds of 40 mph or less. Existing 5 lane sections on the state highway system and those facilities over 28,000 in daily traffic should be given the highest priority for retrofit from center turn lanes to restrictive median.
Florida (FDOT 2006)

22
Table 2.5: State of Practice for Median Treatments (continued) State Raised Median DOT Source
Georgia
Multi-lane roadways with design speeds greater than 45mph or with three or more lanes in each direction shall require the positive separation of opposing traffic using a median. Raised medians shall be constructed on multi-lane roadways at intersections that exhibit one of the following characteristics: -High turning volumes relating to 18,000 ADT (base year) and 24,000 ADT (design year); -Crash rate greater than the state average for its classification; and -Excessive queue lengths (as determined by District Traffic Engineer) in conjunction with excessive number of driveways.
Georgia (GDOT 2014, 2009)
Idaho
When medians are selected, non-traversable medians are the preferred median type; however, traversable medians in urban areas may be considered to facilitate emergency vehicles. Implementation of medians should be considered for: • All new multi-lane State highways. • Modernization of all multi-lane State highways where posted speeds are 45 mph or greater. • All undivided State highways where the annual collision rate is greater than the statewide annual average collision rate for similar roadways. • All State highways when the ADT exceeds 28,000 vehicles per day, both directions. • All multi-lane State highways undergoing resurfacing, restoration, and rehabilitation improvements. • State highways, where pedestrians/bicycles are unable to safely cross the entire highway width, as demonstrated by a collision rate that is greater than the statewide annual average collision rate for similar roadways.
Idaho (IDT 2001)
Illinois Raised curb medians are used to prevent direct left turns at all streets and entrances except major ones.
Illinois (IDOT 2013)
Indiana
Raised medians are used on urban highways and streets with design speeds of 45 mph and less to control access and left turns to improve the capacity. Install barrier to prevent uncontrolled access along property frontage as one of the retrofit techniques to “Access/Driveway Location and Operation” on strip commercial developments where the parking areas are not physically separated from the adjacent roadway, and as a result, the driveway openings are not defined
Indiana (INDOT 2009)
Iowa Raised medians are used on roadways to increase access control and prevent midblock left turns; they are also used on transitional facilities to facilitate the changing environment for the drivers.
Iowa (IowaDOT 2012)
Kansas
Raised medians are usually used in developed locations and should only be used when speeds are equal to or less than 45 mph. The Kansas DOT may require the installation of a raised median to restrict an access to RIRO. At these locations, the length of the median needs to extend a sufficient distance beyond the RIRO access to prevent drivers from attempting to make a left-turn out of the access.
Kansas (KSDOT 2013)
Kentucky Non traversable or raised barrier medians are provided to restrict left turn movements across the roadway. Non traversable medians should always supplement a RIRO entrance to prevent left turns.
Kentucky (KYDOT 2006)
Louisiana Raised medians are only used on rural highways and can be used on urban highways in special situations when requested by the municipality.
Louisiana (DOTD 2005)

23
Table 2.5: State of Practice for Median Treatments (continued) State Raised Median DOT Source
Maine Raised medians (usually with sloped curbs) are used to control left turning movements.
Maine (MaineDOT 2001)
Maryland
May require construction of a raised median along an undivided highway, to control turning movements associated with the requested access. This requirement is most typical where access is proposed near existing signalized intersections.
Maryland (MdDOT 2004)
Massachusetts Raised medians are used on arterials, collector and local roads in densely developed areas with design speeds of 45 mph or less.
Massachusetts (MassDOT 2006)
Michigan Raised medians are the most effective practice to reduce conflicts associated with left turns.
Michigan (MiDOT 2011)
Minnesota
The raised medians are used as an alternative to the flush medians due to the several advantages they provide over the flush medians. They can be used even when the vehicle speeds are 45 mph or higher, except that 4 feet offset distance is provided instead of the usual 2 feet distance between the face of the median curb and the edge of travel lane.
Minnesota (MnDOT 2001, 2008)
Mississippi
Continuous two-way left-turn lanes are used at areas with high number of driveways per block, but a raised median is used as an alternative when the TWLTL encourages more strip development (each business has a driveway access to the roadway). A raised median is considered to be more appropriate than TWLTL for traffic volumes greater than 25,000.
Mississippi (MsDOT 2012)
Missouri
Use of raised medians is recommended where current and projected traffic volume is greater than 28,000 average annual daily traffic. Raised medians are especially recommended in corridors where the traffic volume is high, the density of commercial driveways is high (over 20 -30 per mile in both directions), and other access management strategies such as driveway consolidation and corner clearance are not practical. Raised medians are to be used on arterial facilities with three or more through traffic lanes in each direction.
Missouri (MoDOT 2009)
Montana Raised medians are used on urban and suburban highways and streets to control left-turning movements and access. They are avoided for use on high speed lanes with speeds greater than 45 mph.
Montana (MtDOT 2007)
Nebraska Raised medians are used on urban and suburban highways and streets to control access and left-turns.
Nebraska (NeDOT 2006)
Nevada Raised medians are used on arterial streets to regulate left-turn movements.
Nevada (NDOT 1999)
New Jersey Raised medians are used on arterial streets to regulate left-turn movements and used where median is to be planted (narrow widths).
New Jersey (NJDOT 2014)
New Mexico
Raised median islands are only used at unsignalized arterial crossings to allow bicycle passage and for bicycle safety. When driveways are on opposite sides of a highway with a non-traversable median, the driveway centerlines should be centered approximately on the median opening. Where offset driveway locations are expected to result in turning movement conflicts at the median opening, access restrictions should be considered.
New Mexico (NMDOT 2001)

24
Table 2.5: State of Practice for Median Treatments (continued) State Raised Median DOT Source
New York
Raised curb medians with left turn bays can be used to restrict the location of turning movements on highways with speeds less than 50 mph. The installation of raised medians can improve capacity and safety on uncontrolled access facilities by eliminating mid-block left turn maneuvers. Raised median openings with left-turn lanes should be provided only at major cross streets and to serve large traffic generators or emergency vehicles. Pedestrian and bicycle travel patterns are to be considered
New York (NYSDOT2011)
North Carolina Raised medians are used on collector and arterial streets for access control.
North Carolina (NCDOT 2003)
Ohio Raised/barrier medians used mostly in the urban areas with a minimum width of 10 feet (4 feet shoulders on each side) on four lane urban freeways and 22 feet for six lane urban freeways.
Ohio (OHDOT 2008)
Oregon
Raised medians are used where safety and pedestrian crossings are required. To improve the user and traffic safety, a buffer space known as shy distance is provided to introduce the raised curb in the roadway. This distance varies with different design speeds on the highway.
Oregon (ODOT 2012)
Pennsylvania
Medians are designed to physically prevent left turns into a driveway or onto a side street and left and through movements from driveways or side streets. They also reduce angle and rear-end crashes involving left turning vehicles from the inside through lanes. For high and medium volume driveways, channelization islands and medians shall be used to separate conflicting traffic movements into specified lanes to facilitate orderly movements for vehicles and pedestrians.
Pennsylvania (PennDOT 2006)
South Carolina
Raised/curbed medians are used on low speed arterial roads and can also be used in areas where access control is needed. The median of a divided highway provides for safer, more efficient traffic movement by reducing crashes involving left-turn access maneuvers as well as head-on collisions. Crossovers are provided at a planned spacing and at intersections, and additional crossovers are not normally permitted at driveways.
South Carolina (SCDOT 2008)
South Dakota Medians should be used as part of reconstruction in areas with high traffic volumes and high driveway densities.
South Dakota (SDDOT - undated)
Texas
Where ADT exceeds 20,000 vpd and the demand for mid-block turns is high, a raised median should be considered. The use of raised medians is not encouraged only when the cross section of the roadway is too small to allow U-turn movements. Improved driveway spacing and design, alternative access, and installation of nontraversable medians have virtually no adverse impact on business activity.
Texas (TxDOT 2011)

25
Table 2.5: State of Practice for Median Treatments (continued) State Raised Median DOT Source
Utah
Restrictive medians limit left-turns, physically or legally, to defined locations. Nonrestrictive medians allow left-turns at any point along the route. Consider restrictive medians on multilane limited access highways and multilane managed access highways when the design hourly volume is over 2,000 vph.
Utah (UDOT 2013)
Washington A restrictive median shall be provided on multi-lane facilities to separate opposing traffic movements and to prevent unauthorized turning movements.
Washington (WSDOT 2002, 2013)
Wisconsin
Raised medians are used at intersections and driveways experiencing a large left turning volume and at locations where pedestrians and bicyclists require refuge. Sometimes, even if the turning volumes are low, raised medians are provided exclusively for pedestrian refuge. Recommended design of medians are addressed on green book. Medians for urban streets are designated as either curbed or flush.
Wisconsin (WisDOT 2013)
Wyoming A median should be considered on multilane urban arterials with average daily traffic volumes greater than 24,000 vpd.
Wyoming (WYDOT 2005)
Table 2.6: Design Speed Threshold to Install Non-traversable Median
State Threshold
Design Speed (mph)
Roadway
Connecticut 50 Urban highways and streets Florida 40 NA Idaho 45 Multilane State highways Indiana 45 Urban highways and streets Kansas 45 In developed locations
Massachusetts 45 Arterials, collector and local roads in densely developed areas
Minnesota 45 NA Montana 45 Urban and suburban highways and streets New York 50 Highway South Dakota N/A Low speed arterial roads NA = Not Applicable
Much of the focus associated with median construction is the frequency, type, and placement of median openings. Table 2.7 depicts the state of the practice for median opening considerations for 19 of the states.

26
Table 2.7: State of Practice for Median Opening Treatments State Median Openings to Restrict Movement DOT Source
Alabama Channelize median openings to prevent left-turn ingress and/or egress maneuvers.
Alabama (ALDOT 2014a, 2014b)
Florida
Suggest to reconstruct the unsignalized full opening as a more restrictive median opening or close the median opening in the areas where development has occurred and traffic volumes substantially increased, which result in vehicles stopped in excessively wide median opening.
Florida (FDOT 2006)
Georgia
Consider many other factors to allow median openings, in addition to meeting the spacing criteria, such as such as distance to other median openings, adjacent land use, expected traffic volumes, and the resulting volume of U-turns that are likely to occur without the median opening.
Georgia (GDOT 2014, 2009)
Idaho All median openings shall be designed with a left turn lane and sufficient storage for left turning traffic.
Idaho (IDT 2001)
Illinois Suggest channelizing median openings to prevent left-turn ingress and/or egress maneuvers as one of the techniques to reduce conflict.
Illinois (IDOT 2013)
Iowa
New median openings should not be permitted except to accommodate intersecting local public roads or streets or large traffic-generating facilities such as large shopping centers or industrial plants. Median openings may be permitted in these instances if satisfactorily justified and in the public interest. When a divided primary highway has been constructed with a median, crossovers or median breaks shall not be permitted if there are frequent openings for local street intersections or traffic conditions do not make median breaks advisable.
Iowa (IowaDOT 2012)
Kansas
Additional median openings should not to be permitted on existing divided highways where openings for crossroads and preplanned openings are established or spacing is not in the best interest of the traveling public. When existing median openings do not serve a proposed development and additional openings are not justified, access at the proposed development will be limited to RIRO access.
Kansas (KSDOT 2013)
Kentucky
For divided roadways, median openings allowing full access cannot be evaluated independent of direction. Median openings are allowed only when spacing requirements can be met for both sides of the roadway.
Kentucky (KYDOT 2006)
Maryland
Existing median openings on divided highways are evaluated on a case-by-case basis. The state highway agency may require closure of existing median crossovers to address anticipated traffic and safety conditions associated with the proposed highway access point(s). Commercial two-way entrances are acceptable along a divided highway only if there is an approved full movement median opening at the site access, whereas on undivided highway commercial two-way entrances are appropriate where no turning movement restriction is required.
Maryland (MdDOT 2004)

27
Table 2.7: State of Practice for Median Opening Treatments (continued) State Median Openings to Restrict Movement DOT Source
Minnesota
New median openings accommodating all turning movements should be provided only at public street connections. New median openings should not be provided for driveways. Existing, non-conforming median openings at either a public street connection or a driveway may be closed as a part of a construction project if the closure is considered necessary to address a safety or operational concern.
Minnesota (McDOT 2001, 2008)
Mississippi
The normal spacing between full median openings will not be less than 1760 feet in rural areas. The minimum spacing for full medians in urban areas will not be less than 1760 feet. The normal spacing between directional median openings shall not be less than 1760 feet for rural areas. For urban roads with posted speeds equal to or greater than 45 miles per hour the minimum spacing for directional median openings will not be less than 1760 feet and for posted speeds less than 45 miles per hour the minimum spacing is 880 feet.
Mississippi (MsDOT 2012)
Missouri
Openings in raised medians are only to accommodate turning traffic in locations where this can be safely executed. Median openings are not to be allowed at locations that have high crash rates.
Missouri (MoDOT 2009)
Montana Minimum access spacing for each highway classification is provided.
Montana (MtDOT 2007)
Nebraska Closure or relocation of existing access points, or relocating access points to provide better traffic turning movements.
Nebraska (NeDOT 2006)
New Mexico
New median openings on state highways with non-traversable medians should not be allowed unless a traffic engineering evaluation analyzing all related traffic and safety issues is prepared and approved by the Department. Median openings at intersections or full-access driveways should be spaced with a minimum frequency based upon the access category and posted speed of the highway.
New Mexico (NMDOT 2001)
New York Design of median openings should consider the need for traffic to access properties on the other side of the raised median between median openings.
New York (NYSDOT 2011)
North Carolina
Where a divided highway has been constructed with a median, no new crossovers in the median for driveways shall be permitted unless it is in conformance with the latest edition of the North Carolina DOT publication “Median Crossover Guidelines for North Carolina Streets and Highways.” New median openings should not encroach on the functional area of an existing median opening or intersection.
North Carolina (NCDOT 2003)

28
Table 2.7: State of Practice for Median Opening Treatments (continued) State Median Openings to Restrict Movement DOT Source
South Carolina
Divided highways operate at higher levels of safety with a minimum number of median crossovers. Additional crossovers create more conflicts and can lead to higher accident experience and loss of the advantages of the divided highway. They, therefore, are not normally permitted at driveways, and the Department reserves the right to limit access to right-in, right-out.
South Carolina (SCDOT 2008)
South Dakota Median openings may be provided at driveways, where they will have minimum impact on roadway flow.
South Dakota (SDDOT - undated)
2.4 COMBINATION OR ALTERNATIVE TREATMENTS
As the need to restrict vehicle turning movements at access points increases, additional evaluations of median U-turns, jughandles, and roundabouts will be considered. Though this type of treatment continues to evolve, some research and information is available regarding these alternatives to traditional access point designs.
2.4.1 Literature Review
Median U-turn research has been described in the preceding section of this report; however, the use of roundabouts and jughandles is becoming a more common consideration for reducing turning vehicle conflict points.
Chowdhury et al. (Chowdhury et al. 2005) used CORSIM to estimate the impact of alternative left-turn movements on roadway operations and the effectiveness of restricting direct left turn lanes. In addition, the research team evaluated alternatives including the jughandle design. The researchers did not find any significant operational differences between left turn restrictions and U-turn alternative movement. They suggested that the jughandle design alternative (see Figure 2.11) could be implemented for multilane divided and undivided sites, provided the design included adequate signage and driver education. They also evaluated a concentrated left-turn that also proved efficient. This configuration allowed all but one driveway to be restricted using RIRO islands and signs.
Figure 2.11: The Jug-handle Design (Source: Chowdhury et al., 2005)

29
NHCRP Report 659 (Gattis et al. 2010) further provides design alternatives as suggested in the American Association of State Highway and Transportation Officials (AASHTO) publication A Policy on Geometric Design of Highways and Streets (also commonly referred to as the Green Book) for conventional at-grade intersections at expressways. The study recommends the design of J-turns, jughandles, and offset-T intersections to help reduce the number of conflict points and improve safety.
2.4.2 State of Practice
As a result of restricting turning movements at access point locations, several states provide specific recommendations regarding alternative or combined treatments (see Error! Reference source not found.). The following examples summarize some of the common state of practice issues associated with these alternative designs.
Median U-turn, Jughandles and Roundabout
Left-turn movements from driveways onto a roadway may experience delays and safety problems. Many states have recommended several effective measures to accommodate left-turn deterred traffic. In addition to a RIRO island, U-turns, jughandles, and roundabouts can help provide indirect left-turn while reducing conflict points and improve or maintain the operational and safety performance along the corridor. Most states consider implementing these techniques and managing movements on a case-by-case basis. Factors taken into consideration include traffic volume on roadway and driveway, access point density, access spacing, crash history, median opening, concerns of business owners, and right-of-way cost.
U-turns
Florida, Georgia, Indiana, Kentucky, Minnesota, Mississippi, Missouri, New Mexico, New York, North Carolina, Pennsylvania, South Carolina, South Dakota and Wisconsin recommend implementing U-turns to provide indirect left-turn and restrict left-turn movements from driveways. According to Mississippi, U-turn/left turn ingress should normally be given priority over left turn out egress because ingress capacity is higher and produces less conflict than the left turn out movement. There are situations that U-turns will be prohibited. For example, U-turns in Missouri are to be prohibited if they cannot be made safely. In New Mexico, U-turns should be prohibited at all partial-access median openings.
Jughandles
Florida, Kentucky, Missouri, New Mexico, New York and Pennsylvania suggest that jughandles can be used as alternatives to restrict left-turn from driveway and provide indirect left-turn.
Roundabout
Minnesota and New York suggest replacing left-turns from driveways with a right-turn, followed by a U-turn at the next roundabout.

30
Table 2.8: Alternative Turn-Restriction Options State Mid-block U-turns, Jug handles, roundabout Source
Connecticut Median openings are sometimes used to accommodate U-turns on divided non-freeways.
Connecticut (Conn DOT 2013)
Delaware
Median openings designed to accommodate U-turn vehicles (crossovers) are provided on divided highways at intervals that serve adjacent properties without greatly inconveniencing property owners and other users.
Delaware (DelDOT 2013, 2006)
Florida Right turns followed by U-turns are an alternative to direct left turns. A jug handle is one such option.
Florida (FDOT 2006)
Georgia Consider alternatives at intersections with a high percentage of turning movements or that must accommodate a high number of U-turns.
Georgia (GDOT 2014, 2009)
Idaho Median openings allowing U-turns shall be provided only at locations with sufficient roadway width.
Idaho (IDT 2001)
Indiana
Adequate provisions are needed for the U-turns that will be made instead of direct left-turn exits from an abutting property onto the roadway, when using the techniques of “Construct or Modify Median to Allow Only Left Turns from a Major Roadway.”
Indiana (INDOT 2009)
Kentucky
Providing indirect turns reduces conflicts at intersections because vehicles do not cross traffic. Jug handles require a right turn onto a feeder street followed by a left turn onto a cross street. Indirect U-turns require a U-turn beyond an intersection followed by a right turn instead of a left turn.
Kentucky (KYTC 2006)
Minnesota
Adjacent median openings must facilitate U-turns for the design vehicle expected to make U-turns; Left-turn movements from driveways onto a highway that may currently experience long delays and require two-stage left-turn movements could be replaced with a simpler right turn, followed by a U-turn at the next roundabout.
Minnesota (MnDOT2001, 2008)
Mississippi U-turn/left-turn ingress should normally be given priority over left-turn out egress because ingress capacity is higher and produces less conflict than the left turn out movement.
Mississippi (MsDOT 2012)
Missouri
In cases where left-turns are restricted by lack of median openings, safe U-turns must be allowed. U-turns can be safely accommodated through a variety of means, including signal phasing and timing, widening and including physical design features such as turning lanes and “jug handles.” U-turns are to be prohibited if they cannot be made safely. U-turn opportunities are to be designed with an appropriate typical design vehicle.
Missouri (MoDOT 2009)
New Mexico Median U-turn and jug handles (flare out) are one of the access channelization alternatives to restrict turning movements; however, U-turns should be prohibited at all partial-access median openings.
New Mexico (NMDOT 2001)
New York
Where operational or safety concerns preclude left-turns from the median lane, indirect left-turns or jug handles can, if adequate advance signing is provided, provide safe and efficient left-turn access by diverting left-turns to separate turning roadways which cross the mainline or intersect the cross street at a different location.
New York (NYSDOT 2011)
North Carolina
Left-turn access into the property should be by use of entrances along side streets adjacent to the property, from a frontage or service road, or by U-turn at downstream or upstream median openings.
North Carolina (NCDOT 2003)

31
Table 2.8: Alternative Turn-Restriction Options (continued) State Mid-block U-turns, Jug handles, roundabout Source
Pennsylvania
Directional medians contain breaks at key locations to provide access to a particular land use or side street. A separate ingress lane is typically used at a break in the median for left turns into the driveway and for U-turns. An egress lane, sometimes referred to as a median acceleration lane, may be used in some circumstances for exiting movements from a driveway when significant delay would occur because of infrequent simultaneous gaps in both directions of travel on the intersecting roadway. Jughandles may be used at median breaks as an alternative to left turn ingress lanes, because they eliminate left turn movements from the major roadway (intersecting roadway with the higher traffic volumes). As a result, delay is decreased at the intersection and levels of service are improved.
Pennsylvania (PennDOT 2006)
South Carolina
Access to adjacent property is provided by right-in and right-out maneuvers in conjunction with U-turn and crossing maneuvers at paved median crossovers.
South Carolina (SCDOT)2008)
South Dakota
Adequate provisions are needed for the U-turns that will be made instead of direct left-turn exits from an abutting property onto the roadway, when using the techniques of “Construct or Modify Median to Allow Only Left Turns from a Major Roadway.”
South Dakota (SDDOT undated)
Wisconsin On streets with numerous businesses, raised medians can restrict access and force drivers to make U-turns at median openings to reach their destination.
Wisconsin (WisDOT 2013)
2.5 SUMMARY
This section of the report reviewed the common techniques for restricting turn movements at access point locations. The scenarios are presented as unconstrained, access constrained only, median constrained, and alternative or combination treatments. Though the application of these treatments varies, most of the research to date has focused on median treatments. This section also includes a state of practice summary for each candidate turn restriction scenario.

32
3.0 DATA COLLECTION AND SITE SELECTION
The data analysis effort for this project included three key elements: observational field analysis, safety assessment, and operational simulation. First, with the assistance of the ODOT technical advisory committee, the project team identified candidate study sites in Oregon. Through this process, a total of 14 Oregon locations were ultimately included in the field observation activities. In an effort to identify additional turn restriction scenarios that were not included in the Oregon sites and to assess if driver compliance varied geographically, the project team added an additional six Texas locations. Ultimately, there were 20 field locations included for analysis.
The following sections describe the site selection and data collection efforts that occurred as part of this research effort.
3.1 STUDY STIES AND ASSOCIATED DATA VARIABLES
The literature review indicated that turn restrictions are often needed at locations where the traffic volume is moderate to high or where a large number of crashes occur. Consequently, the target study sites for this research effort were generally urban arterial corridors. The resulting locations, therefore, were sites in Oregon cities where turn restrictions at access points have been implemented.
Ultimately, the Oregon study sites were located in Bend, Corvallis, Portland, Redmond, and Salem (see Figure 3.1). The additional six Texas locations were all located in the Bryan / College Station area.
Figure 3.1: Oregon Study Sites

33
For each study site, the project team collected road characteristic data and performed field observations. Table 3.1 shows an example of the data assembled for Site OR-1. The complete summary of site data for all sites is included in the appendix of this report.
Table 3.1: Physical Characteristics and Volume Information – Site 1 (OR-1) Location Information Address 2925 The Dalles-California Hwy City Redmond State OR
Volumes for Roadway in Vicinity of Driveway Through Traffic Volume (vph)1
Afternoon Off-Peak Afternoon Peak Lanes immediately adjacent to driveway (2 lanes) 1078 1128 Lanes for opposing direction of travel (2 lanes) 1175 1421 Total two-directional traffic volume (4 lanes total) 2253 2549
Volumes for Study Driveway Driveway Volume (vph)
Afternoon Off-Peak Afternoon Peak Turns Into Driveway 83 cars, 7 trucks 60 cars, 2 trucks Turns Out of Driveway 46 cars, 3 trucks 33 cars, 1 truck Total Driveway Volume 129 cars, 10 trucks 93 cars, 3 trucks Turning Restriction Information Movement Configuration RIROLI – Median and Driveway Constrained Driveway Island and Traffic Control Raised concrete island, no-left-turn sign Roadway Median Raised concrete median and barricades Corner Clearance at Intersection (ft) 877 Geometric Design Information – Roadway in Vicinity of Driveway Width of Roadway (ft) 75 Number of Lanes 4 + TWLTL Lane Width (ft) 11 Bicycle Lane Yes Sidewalk Yes Geometric Design Information – Driveway Width of Driveway (ft) 36 Number of Lanes 2 Lane Width (ft) 18 1 Through traffic volumes do not include driveway volumes (presented separately) and do include passenger cars as well as trucks.
As shown in Table 3.1, data for each site included a summary of road and access point geometry (such as number of lanes, driveway characteristics, etc.) and traffic volume values for the study period at each site (volumes shown in vehicles per hour). The project team acquired video of vehicle interactions at each site. This activity included an effort to observe operations during peak and non-peak hour activities for approximately two or more hours. In a few cases, peak activity observations were truncated when it became apparent they were not relevant. For example, one driveway location was a bank that appeared to end vehicle generating activities shortly after 5 p.m., and so there was little driveway activity to observe following that time. For each location, the project team also assembled aerial and street view photos of the site. These photographs are also included in the appendix of this report.
Finally, the primary purpose of the field observations was to determine if drivers typically complied with the turn restriction scenario. For each study site, a turning violations table (see
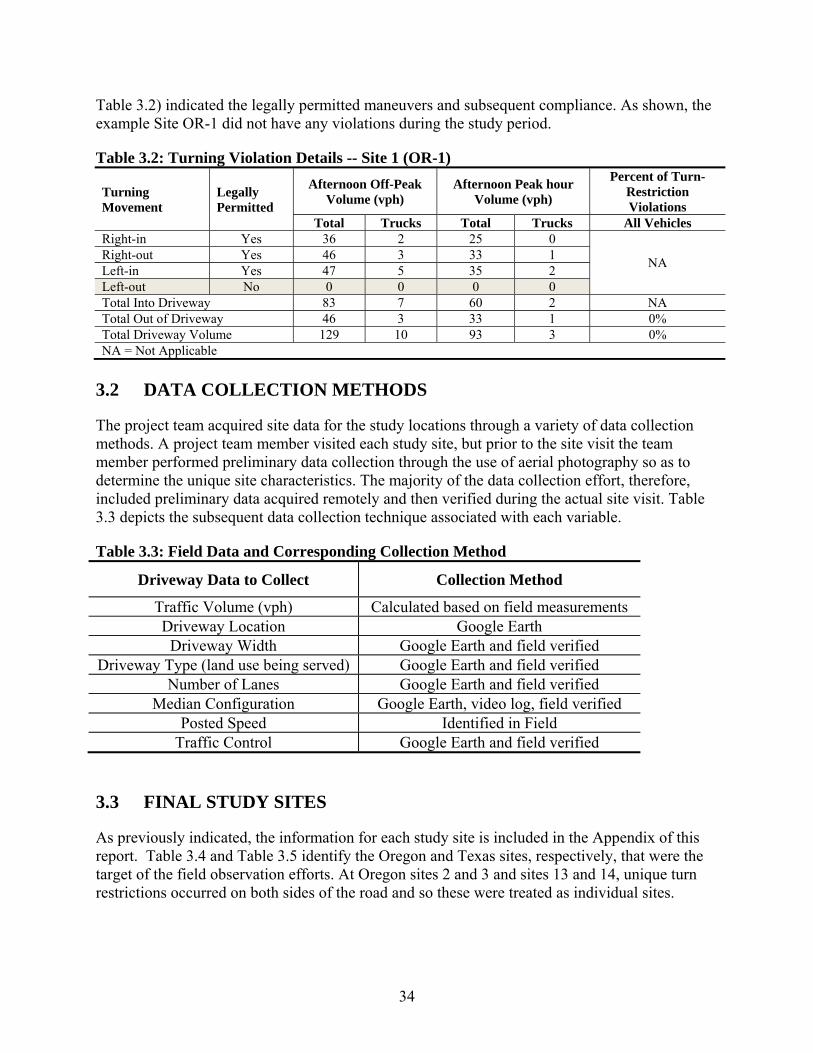
34
Table 3.2) indicated the legally permitted maneuvers and subsequent compliance. As shown, the example Site OR-1 did not have any violations during the study period.
Table 3.2: Turning Violation Details -- Site 1 (OR-1)
Turning Movement
Legally Permitted
Afternoon Off-Peak Volume (vph)
Afternoon Peak hour Volume (vph)
Percent of Turn-Restriction Violations
Total Trucks Total Trucks All Vehicles Right-in Yes 36 2 25 0
NA Right-out Yes 46 3 33 1 Left-in Yes 47 5 35 2 Left-out No 0 0 0 0 Total Into Driveway 83 7 60 2 NA Total Out of Driveway 46 3 33 1 0% Total Driveway Volume 129 10 93 3 0% NA = Not Applicable
3.2 DATA COLLECTION METHODS
The project team acquired site data for the study locations through a variety of data collection methods. A project team member visited each study site, but prior to the site visit the team member performed preliminary data collection through the use of aerial photography so as to determine the unique site characteristics. The majority of the data collection effort, therefore, included preliminary data acquired remotely and then verified during the actual site visit. Table 3.3 depicts the subsequent data collection technique associated with each variable.
Table 3.3: Field Data and Corresponding Collection Method
Driveway Data to Collect Collection Method
Traffic Volume (vph) Calculated based on field measurements Driveway Location Google Earth
Driveway Width Google Earth and field verified Driveway Type (land use being served) Google Earth and field verified
Number of Lanes Google Earth and field verified Median Configuration Google Earth, video log, field verified
Posted Speed Identified in Field Traffic Control Google Earth and field verified
3.3 FINAL STUDY SITES
As previously indicated, the information for each study site is included in the Appendix of this report. Table 3.4 and Table 3.5 identify the Oregon and Texas sites, respectively, that were the target of the field observation efforts. At Oregon sites 2 and 3 and sites 13 and 14, unique turn restrictions occurred on both sides of the road and so these were treated as individual sites.

35
Table 3.4: Oregon Study Sites
Site County Latitude Longitude Site Location Land Use Type Land Use
Designation
OR-1 Deschutes 44.249542 -121.186197 Redmond, OR Retail/commercial businesses
Moderate
OR-2 Deschutes 44.269269 -121.194328 Redmond, OR Retail/commercial/ residential
Moderate
OR-3 Deschutes 44.269269 -121.194328 Redmond, OR Retail/ commercial/ residential
Light
OR-4 Marion 44.968211 -122.983574 Salem, OR Retail/commercial/ residential
Moderate
OR-5 Benton 44.899061 -123.038792 Salem, OR Bank (single business) Light
OR-6 Marion 44.589293 -123.254781 Corvallis, OR Retail/commercial (single business)
Light
OR-7 Marion 44.940674 -122.983067 Salem, OR Retail/commercial businesses
Moderate
OR-8 Deschutes 44.037744 -121.304064 Bend, OR Retail/commercial businesses
Light
OR-9 Multnomah 45.492306 -122.484103 Portland, OR Gas station (single business)
Light
OR-10 Deschutes 44.027031 -121.313989 Bend, OR Retail/commercial businesses
Heavy
OR-11 Deschutes 44.027017 -121.313544 Bend, OR Retail/commercial businesses
Heavy
OR-12 Deschutes 44.060072 -121.301722 Bend, OR Gas station (single business)
Light
OR-13 Deschutes 44.059944 -121.300708 Bend, OR Mixed retail/commercial/residential (light)
Heavy
OR-14 Deschutes 44.059944 -121.300708 Bend, OR Retail/commercial/ residential
Heavy
Table 3.5: Texas Study Sites
Site County Latitude Longitude Site Location Land Use Type Land Use
Designation
TX-15 Brazos 30.644014 -96.353897 Bryan, TX Retail/commercial (single business)
Light
TX-16 Brazos 30.612600 -96.316516 College Station, TX Retail/commercial businesses
Light
TX-17 Brazos 30.643264 -96.352981 Bryan, TX Retail/commercial (single business)
Light
TX-18 Brazos 30.589408 -96.316022 College Station, TX Gas station (single business)
Light
TX-19 Brazos 30.644264 -96.352419 Bryan, TX Retail/commercial businesses
Heavy
TX-20 Brazos 30.557592 -96.260261 College Station, TX Retail/commercial businesses
Heavy

36
The land use type served by the study access point (driveway or minor road) ranges from single retail businesses to major shopping center entrances. For the purposes of this study, these varying land uses are classified as:
Light retail/commercial/residential (access point volume ≤ 60 vph during peak conditions),
Moderate retail/commercial/residential (access point volume ranging from 61 to 139 vph during peak conditions), and
Heavy retail/commercial/residential (access point volume ≥ 140 vph during peak conditions).
The indication of “light”, “moderate”, and “heavy” represents driveway or minor roadway traffic demand. The individual traffic volume information is included in the report appendix summary for each site, but the three general volume categories were selected based on natural divisions in the observed traffic volumes for all sites.
In general, the “light” land use designation represents access to a site with a single or only a few businesses. For this type of access point, the percent of the traffic on the adjacent roadway that turns into the access is approximately two to three percent. The “moderate” description generally applies to mixed use developments with at least one active traffic generator such as a fast food restaurant (Site OR-2) or a gas station (Site OR-4). The moderate access point traffic volume ranges from five to seven percent of the traffic for the adjacent road. A “heavy” description refers to a retail/commercial site that includes a major store that generates considerable traffic. An example of this type of store would be a grocery store. The heavy access point traffic volume ranged from nine up to 11 percent of that of the adjacent road volume. The TX-20 site, however, was an exception. This location is at the edge of a developing region and currently is one of the only fully developed retail complexes along the corridor. Consequently, the access accommodates approximately 35 percent of the total traffic on the adjacent corridor.
In addition, the project team used crash data for the Oregon sites to identify crash trends for the specific turn restriction configurations. Crash data for the six Texas sites was not available.
3.4 SUMMARY
As demonstrated in this chapter, the project team performed a field observational analysis for a total of 20 turn restriction scenarios. Of these locations, 14 were Oregon sites and six were Texas sites. Data collection techniques included a combination of remote data collection methods and on-site field verification. Detailed summaries and companion photos for each site are included in the appendix of this report.

37
4.0 DATA ANALYSIS
In an effort to determine candidate turn restriction scenarios that may be effective in limiting turn maneuvers, the project team evaluated a collection of progressively more restrictive treatments. Each location, however, is unique and the evaluation of field observed violations only addresses how well drivers comply with these restrictions. It is also important to determine if there may be any safety or operational constraints associated with the individual treatments. Consequently, the data analysis for this effort focused on turn treatment compliance, associated crash types and trends, and operational thresholds where an individual scenario may no longer be practical.
Section 2.0 identified the various turn restriction scenarios presented in the published research literature or through state of practice demonstrations. These configurations range from simple passive restrictions, such as a “No Turn” sign and companion pavement marking, up to and including rigid configurations with median constrained configurations. In some cases, an access point may also have a relatively short corner clearance and so queued vehicles may act as a turn restriction during higher volume conditions. The individual turn restriction scenarios summarized in the report appendix (see Section 7.0) include the rate of compliance as observed during the project field studies.
The specific restrictions observed in the field, listed from simplest to most complex are:
Constrained only at access point using passive control (i.e. signs and pavement marking),
Constrained only at access point using a directional island only,
Constrained only at median (localized), and
Constrained at the median (localized) and the access point.
For the observed sites, the passive control approach restricted left-turn out maneuvers using a right-turn only sign and companion pavement marking. This resulted in a passive control RIROLI scenario. The research team observed two of these RIROLI configurations. Both study sites were located at low volume minor public roads rather than at actual driveways. Additional information about these two study locations is located in Sections Error! Reference source not found. and Error! Reference source not found. of the report appendix.
The use of a directional island at the access point location is a very common treatment; however, the effectiveness of the island to restrict left-turn maneuvers is largely based on the physical island configuration. For the sites studied, eight locations used only an island for a RIRO control measure and three locations used the island for RIROLI operations. The locations where members of the research team observed violations for left-turn out maneuvers were typically near major developments to the left and generally occurred at lower volume locations.

38
Three of the study sites occurred at locations where an extended median configuration served as the primary access control strategy. For this application, a directional median opening accommodated select left-turn activity for two of the locations. For site OR-2, a RIROLO configuration facilitated a left-turn maneuver exiting the access point location. For site OR-4, a RIROLI design enables a left-turn into the site. Site OR-3 uses the median to provide an effective RIRO operation (with 100 percent compliance during the field observation).
Though direction islands were not also present at the access points, it is common to observe the median and the access point channelization at the same location. Such a combination design is frequently the result of an initial directional island at an access point that was not effective until a localized median treatment enhanced operations. The study sites with this combined access control configuration included one Oregon site with a RIROLI configuration (site OR-1) and three Texas sites with a RIRO orientation (sites TX-16, TX-17, and TX19).
This section of the report, therefore, reviews the field data analysis compliance findings, identifies the associated safety trends, and then extends the analysis, through the use of micro-simulation, to determine practical limitations for the individual turn restriction strategies. It is important to note that a more extensive safety analysis could not be performed as the research team determined that crash record information did not include adequate driveway-related crash locations in a manner that was precise enough to permit a crash analysis at a specific access point location. The crash analysis did, however, summarize the conditions associated with observed injury crashes based on the information available.
4.1 FIELD DATA ANALYSIS
The field data analysis focused on determining site features, acquiring peak hour (and in some cases non-peak hour) traffic volumes for the road and the access, evaluating driver compliance for turn restrictions, and assessing the corresponding safety where possible.
4.1.1 Traffic Volume and Driver Compliance
Each access turn restriction was characterized by unique site geometry, traffic exposure, and site context (locations with major shopping to the right tended to have more vehicles turn right). The field assessment included a qualitative and a quantitative component.
Qualitative Observations
For each study location, the data collector was instructed to notify the adjacent businesses so that they would be aware that a research study of the access point was underway. This notification served two purposes. First, alerting the businesses during data collection lets the employees know why a vehicle is positioned with a camera pointed at the driveway or street so as to minimize concern or alarm. A second and very useful outcome of notifying businesses is that the people who work at the locations every day will have observed typical usage and be able to identify access characteristics that may occasionally have been issues but that may not be apparent on the day of the data collection effort. This anecdotal information can be combined

39
with field observed conditions to identify expected issues that may occur at a location with turn restrictions implemented. The following short list summarizes this feedback:
Drivers who are not permitted to turn left at locations where the restriction is located only at the access point (i.e. no median present) often turn right and then left into a driveway on the opposing side of the road. They use this driveway to turn around and then ultimately complete a right-turn out of that driveway resulting in replacing a single left-turn maneuver with a right-, left-, and then right-turn. If the road cross section is not compatible with the left-turn, this maneuver effectively introduces a different left-turn in the same vicinity while pairing it with two additional right-turns.
At locations where a turn restriction is present but not apparent (via sight distance or signage) and the unfamiliar driver is not aware of this constraint until he or she approaches the access point to exit and turn left, drivers will often back-up their vehicles and then seek an alternative exit point. The research team observed this phenomenon at multiple locations.
Access configurations with RIRO restrictions but driveway geometry that is not prohibitive will often have vehicles enter through the exit, exit through the entrance, or maneuver around the obstructions to complete the driver’s desired turn. This behavior is particularly noticeably when driveway widths and skew angles are extreme as noted at site TX-18 (see Section Error! Reference source not found.).
Quantitative Observations
The study sites can be divided into three progressively more constraining categories: (1) driveway-only constrained, (2) median-only constrained, and (3) median and driveway constrained. At sites where the turn restrictions are more prohibitive, the traffic volume and crash risk are likely to have been elevated enough to merit the construction of the physical turn restrictions. Table 4.1 summarizes the three general categories and their companion compliance. Included in this table are the roadway and access traffic volumes as well as the percentage of the adjacent road volume that uses the driveway. Note that the corner clearance has also been included in the table to help demonstrate that select locations where the project team did not observe turning violations were also characterized by the neighboring intersection queued vehicles that physically blocked the access.
By inspection of Table 4.1 it is clear that the locations where a median is used to prohibit left-turn maneuvers have a higher level of compliance (ranging from 91 to 100 percent) than locations where the turn constraint is located at the individual access point (observations as low as 50 percent ranging up to and including 100 percent compliance). A short corner clearance, in some cases, appears to discourage illegal maneuvers into the access location (see OR-10 and OR-12) but does not always have the same effect for vehicles exiting the access point (see OR-5 and OR-6).
Sites OR-13 and OR-14 are public street intersections instead of driveway intersections. At these locations, the turn restrictions are primarily passive (signage and pavement marking); however, compliance ranged from 95 to 100 percent, respectively. This observation may be due to the

40
higher level intersection (a public street rather than access intersection) or could be due to systematic enforcement in the region.
In general, the quantitative analysis suggests that progressively more constraining turn restrictions do result in greater driver compliance. It is important to note that at all seven of the median locations, the median channelization was localized (i.e. not continuous along the entire corridor). This observation further suggests that turn restrictions can be successfully accomplished through the use of localized median treatments and do not always require a continuous raised median along the entire corridor.
Table 4.1: Turn Restriction Compliance at Field Sites
Site Available Turning
Maneuvers
Ingress Compliance
(%)
Egress Compliance
(%)
Adjacent Two-Way
Traffic Volume
(vph)
Access Point
Traffic Volume
(vph)
Percent of
Adjacent Volume
(%)
Corner Clearance
(ft)
Driveway-Only Constrained OR-5
RIRO
86 50 2419 9 < 1 65 OR-6 100 85 1299 24 2 89 OR-7 95 100 2218 104 5 256 OR-9 100 100 2582 30 1 84
OR-12 100 100 1424 43 3 118 TX-15 97 95 1739 54 3 152 TX-18 62 92 1407 58 4 230 TX-20 98.5 97.5 854 303 35 703 OR-8
RIROLI
-- 80 1817 55 3 184 OR-10 -- 67 2505 194 8 659 OR-11 -- 98 2505 271 11 659 OR-13 -- 95 1684 146 9 387 OR-14 -- 100 1684 154 9 387
Median-Only Constrained OR-2 RIROLO 100 -- 1962 136 7 646 OR-3 RIRO 100 100 1877 36 2 646 OR-4 RIROLI -- 100 2172 119 6 294
Median and Driveway Constrained OR-1 RIROLI -- 100 2549 96 4 877 TX-16
RIRO 100 100 1127 22 2 380
TX-17 91 100 1484 31 2 267 TX-19 99 97 1423 141 10 383
The access point volume as a percentage of the traffic volume on the adjacent road is generally in the one percent to ten percent range. As previously noted in Table 3.4 and Table 3.5, the lower access point percentage is representative of light to moderate land use development while the higher percentage values represent higher volume mixed use developments.
4.1.2 Safety Assessment
For each Oregon site, the project team assembled crash data for the years extending from 2010 to 2013. Though crashes occurred adjacent to the key access points, the focus of this analysis was

41
to identify crashes that occurred because a user violated the turn restriction in some way. Of the 14 Oregon study locations, six study sites had a combined total of nine crashes that appeared to be due to driver violation of the turn restriction. Table 4.2 identifies the injury level for the turn restriction violation associated with the nine crashes. Three of the crashes occurred at a location where a localized median treatment restricted left-turns (OR-2, OR-3, and OR4). At the OR-5 site, three property damage only (PDO) crashes and one injury crash occurred. This location has a corner clearance distance of 65 feet and a RIRO raised island that can be easily violated. The associated crashes were due to inappropriate left-turns at the access point. At the OR-8 site, a driver attempted to execute a left-turn out of the driveway where a RIROLI island is present. Finally, at the OR-14 site, a driver attempted to execute a left-turn illegally. This location uses passive control (warning sign combined with pavement marking).
Table 4.2: Oregon Sites Four-Year Turn Restriction Violation Crash History
Site Crash Quantity
and Type Description
OR-2 1 injury crash Appears driver navigated around median OR-3 1 injury crash
OR-4 1 PDO crash
OR-5 3 PDO crashes, 1 injury crash
Conflicts between violating vehicles attempting to turn left across the queue region. This location had a very short corner clearance.
OR-8 1 PDO crash Driver attempted to circumvent raised RIROLI island at access point OR-14 1 PDO crash Driver violated the No Left-Turn signage restriction at the access point
In summary, the safety analysis for the Oregon sites highlighted how some drivers will still violate turn restrictions and in many cases attempt to do so when conditions are not safe for the maneuver. The analysis also highlighted that the location with the largest number of violations had a “gentle” positive guidance associated with the raised island combined with a very short corner clearance, thereby pointing out how important it is to restrict access points in the intersection functional area.
4.2 MICRO-SIMULATION
The use of micro-simulation to evaluate operational variations of a roadway network can be a powerful tool. The user can hold all other variables constant, as an example, and modify one value to determine how that specific feature contributes to overall system operation. For the use of turn restrictions at mid-block access points, decision makers would ideally like to consider how these strategies may affect the overall corridor speed.
To demonstrate the effect of turn restrictions and their association with the number of access points, the project team developed a basic CORSIM model with a block length of 1320 feet that was bounded by pre-timed signalized intersections with cycle lengths of 120 seconds. The research team included scenarios with no access points, 20 access points per mile, and 40 access points per mile for varying traffic volumes. The simulations further evaluated road cross-sections of four, five, and six lanes. During the land use analysis, the research team observed that light to moderate land use, as defined in Section 3.3, generally had access point traffic volumes that were five percent or less of those associated with the adjacent road. At locations designated as heavy land use, the percentage increased to approximately ten percent. Consequently, the research team extended the micro-simulation analysis to assess volumes of five and ten percent that of the

42
adjacent road. These thresholds represent the “light to moderate” land development (i.e. five percent) and the “heavy” land development (i.e. ten percent).
For the purposes of simulation, the varying traffic volumes ranged from low volume, free-flow conditions and were incrementally increased by 500 vph thresholds until the facility became congested causing simulated spillback. Ultimately 356 different simulation scenarios (simulated for 10 iterations with different random seed values) resulted in a total of 3560 different simulations. Because the data collection efforts were access point based rather than corridor based, field validation of speed or travel time could not be assessed and so the simulations were designed to be used to make relative comparisons.
The resulting summary statistics for the analysis are included in the appendix. Table 4.3 summarizes the individual test scenarios and companion appendix tables.
Table 4.3: Simulation Scenarios and Associate Speed and Travel Time Tables Road Cross-
Section Tested Turn Restriction
Categories Land Use Speed Table
Travel Time Table
4-Lane Road
All Maneuvers, RIROLI,
RIROLO, and RIRO
Light to Moderate (5% turns)
Table 7.55 Table 7.56
Heavy (10% turns)
Table 7.57 Table 7.58
5-Lane Road All Maneuvers,
RIROLI
Light to Moderate (5% turns)
Table 7.59 Table 7.60
Heavy (10% turns)
Table 7.61 Table 7.62
6-Lane Road
All Maneuvers, RIROLI,
RIROLO, and RIRO
Light to Moderate (5% turns)
Table 7.63 Table 7.64
Heavy (10% turns)
Table 7.65 Table 7.66
All scenarios include 0, 20, and 40 access points per mile with a target corridor speed of 30 mph
The research team next used the simulated speed data to determine the percentage of speed reduction associated with the traffic volume, access density, and turn restriction configuration. Table 4.4 represents the expected speed reduction for light to moderate land development adjacent to a four-lane road. Similarly, Table 4.5 presents a similar speed reduction for heavy land development access point configurations. Because it is not practical to fully evaluate congestion separately from the turn restriction scenario, each of these tables also includes the expected percent of speed reduction based on no access points. This information can then be used to make a relative comparison of the impact that the turn lane scenarios do have on the overall corridor operations. The maximum volume thresholds for each configuration are where the corridor operations began to deteriorate. When volumes exceed the maximum values within the tables, a continuous median is strongly recommended.

43
For the purposes of the simulations, a target speed of approximately 30 mph has been assumed for the overall corridor operations. This results in the following speed reduction categories:
Less than or equal to ten percent,
Speed reductions that are less than or equal to 20 percent but greater than ten percent,
Speed reductions that are less than or equal to 30 percent but greater than 20 percent, and
Speed reductions that are greater than 30 percent.
Table 4.4: Expected Performance for 4-Lane Light to Moderate Land Use Access Test Scenario Description
1500 vph
2000 vph
2500 vph
3000 vph
3500 vph
4000 vph
4500 vph
No Access Points
≤ 10% SR 20% ≤ SR < 10%
20 Access Points per Mile
All
≤ 10% SR
20% ≤ SR < 10% 30% ≤ SR < 20%
> 30% RIROLI
RIROLO 20% ≤ SR < 10%
RIRO
40 Access Points per Mile
All 20% ≤ SR < 10% 30% ≤ SR < 20% > 30%
RIROLI
RIROLO ≤ 10% SR 20% ≤ SR < 10%
RIRO
Legend: SR = Speed Reduction (Simulated Speed Compared to Target Speed)

44
Table 4.5: Expected Performance for 4-Lane Heavy Land Use Access Test Scenario Description
1500 vph
2000 vph
2500 vph
3000 vph
3500 vph
4000 vph
4500 vph
No Access Points
≤ 10% SR 20% ≤ SR < 10%
20 Access Points per Mile
All
20% ≤ SR < 10% 30% ≤ SR < 20% > 30% RIROLI
RIROLO ≤ 10% SR 20% ≤ SR < 10%
RIRO
40 Access Points per Mile
All 20% ≤ SR < 10% 30% ≤ SR < 20% > 30%
RIROLI
RIROLO ≤ 10% SR 20% ≤ SR < 10%
RIRO Legend: SR = Speed Reduction (Simulated Speed Compared to Target Speed) Note: Includes minor rounding adjustments.
In addition to the four-lane simulations, Table 4.6 and Table 4.7 present similar speed reduction summaries for five-lane cross-sections. Table 4.8 and Table 4.9 similarly demonstrate the six-lane values for light and moderate as well as heavy land development, respectively.
Table 4.6: Expected Performance for 5-Lane Light to Moderate Land Use Access Test Scenario Description
2000 vph
2500 vph
3000 vph
3500 vph
4000 vph
4500 vph
5000 vph
5500 vph
6000 vph
No Access Points
≤ 10% SR 20% ≤ SR < 10%
20 Access Points per Mile All ≤ 10%
SR 20% ≤ SR < 10% 30% ≤ SR < 20% > 30% RIROLI
40 Access Points per Mile All
20% ≤ SR < 10% 30% ≤ SR < 20% > 30% RIROLI
Legend: SR = Speed Reduction (Simulated Speed Compared to Target Speed)

45
Table 4.7: Expected Performance for 5-Lane Heavy Land Use Access Test
Scenario Description
2000 vph
2500 vph
3000 vph
3500 vph
4000 vph
4500 vph
5000 vph
5500 vph
6000 vph
No Access Points
≤ 10% SR 20% ≤ SR < 10%
20 Access Points per Mile
All 20% ≤ SR < 10% 30% ≤ SR
< 20% > 30% RIROLI
40 Access Points per Mile
All 20% ≤ SR < 10% 30% ≤ SR < 20% > 30%
RIROLI
Legend: SR = Speed Reduction (Simulated Speed Compared to Target Speed)
Table 4.8: Expected Performance for 6-Lane Light to Moderate Land Use Access Test
Scenario Description
4000 vph
4500 vph
5000 vph
5500 vph
6000 vph
6500 vph
No Access Points
≤ 10% SR 20% ≤ SR < 10%
20 Access Points per Mile
All 20% ≤ SR < 10% 30% ≤ SR < 20% > 30%
RIROLI
RIROLO ≤ 10% SR 20% ≤ SR < 10%
RIRO
40 Access Points per Mile
All 20% ≤ SR < 10% 30% ≤ SR < 20% > 30%
RIROLI
RIROLO ≤ 10% SR 20% ≤ SR < 10%
RIRO
Legend: SR = Speed Reduction (Simulated Speed Compared to Target Speed)

46
Table 4.9: Expected Performance for 6-Lane Heavy Land Use Access Test
Scenario Description
4000 vph
4500 vph
5000 vph
5500 vph
6000 vph
6500 vph
No Access Points
≤ 10% SR 20% ≤ SR < 10%
20 Access Points per Mile
All 30% ≤ SR < 20% > 30%
RIROLI
RIROLO ≤ 10% SR 20% ≤ SR < 10% 30% ≤ SR <
20% RIRO
40 Access Points per Mile
All 30% ≤ SR < 20% > 30%
RIROLI
RIROLO ≤ 10% SR 20% ≤ SR < 10%
30% ≤ SR < 20%
RIRO
Legend: SR = Speed Reduction (Simulated Speed Compared to Target Speed)
These simulation scenarios indicate that the operational benefits for RIROLO and RIRO turn restrictions do provide substantial benefits for the overall system operations and should be considered when the corridor speeds are low and congestion is troublesome. In many low volume configurations, the influence of access points on the overall facility speed is negligible when compared to the expected speed for a similar corridor without any access points. For example, the six-lane “light to moderate” land use configuration with traffic volumes of 5000 vph or less (as shown in Table 4.8) can be expected to have less than or equal to ten percent speed reductions for RIROLO and RIRO turn constraints. For the same traffic volume threshold, a corridor without any access points can be expected to have similar speed reductions simply due to traffic. This means that the use of RIROLO and RIRO configurations for these six-lane light to moderate land use access points will not adversely influence operations. Note, however, that a RIROLI turn restriction or no turn restriction at all can be expected to result in adjacent speed reductions of more than ten percent and less than or equal to 20 percent for locations with 20 access points and traffic volumes of 4000 and 4500 vph. This observation suggests than the driveway configurations alone introduce an approximate ten percent speed reduction (up to twenty percent speed reduction for RIROLI or RIRO and 20 access points contrasted to ten percent or less speed reduction for the same traffic thresholds and no access points.
These observed speed reductions can be used to establish recommended guidance for selecting suitable turn restriction scenarios at a given location. To further demonstrate this application, the following section includes an example calculation.

47
4.3 EXAMPLE EVALUATION OF TURN RESTRICTION OPTIONS
The following examples demonstrate how to determine the most appropriate access point turn restriction based on expected site characteristics.
4.3.1 Example Problem – Four-Lane Light to Moderate Land Development Access
Question: A transportation agency has been asked to permit a new driveway that will be located approximately 1000 feet from the nearest intersection. The traffic volume along the corridor is approximately 4000 vph during the peak period. The number of approximate access points per mile (this includes both sides of the road) is 20. Is it appropriate to permit construction of this driveway and are any supplemental turn restrictions recommended?
Evaluation Questions: The analyst should answer the follow questions:
1. Does the location provide adequate corner clearance?
2. Will any level of driver non-compliance be acceptable if turn restrictions are needed?
3. What additional speed reduction is acceptable if this and similar driveways are constructed along the corridor?
Responses to Questions: The following responses to the questions will be used to determine the recommended driveway turn constraint recommendation:
1. A corner clearance of 1000 feet should be adequate.
2. Safety is very important, but the agency does recognize that minor non-compliance could occur and accepts this potential risk.
3. The corridor is part of a larger network that must maintain good operations during the peak period. The total allowable reduction in speed (due to the increased peak hour traffic as well as friction due to turning maneuvers) is 15 percent.
Solution: Based on the response to the three questions, the agency notes that corner clearance is adequate. If there had not been adequate corner clearance and an alternative driveway site could not be accommodated, then a localized island that would restrict left-turn traffic into and out of the driveway would have been needed. The agency would like to have a location where drivers comply with all requested turn restrictions. This expectation rules out the use of passive turn protection if needed. Finally, the light to moderate land use for a corridor with 4000 vph and 20 access points per mile will be expected to have speed reductions of less than ten percent if no access points are present (see Table 4.4). If a RIROLO or a RIRO turn restriction is constructed, the combined speed reduction would be ten to20 percent – an additional 10 percent speed reduction due to the turn restriction. Finally, if no turn restriction of a RIROLI design is selected, the speed reduction for 4000 vph would be 20 to 30 percent – equivalent to an additional 20 percent speed reduction on average due to the turn constraint.

48
The need to limit speed reductions to 15 percent means that a turn restriction is advisable and that a RIROLO or RIRO option may be suitable. Because some minor non-compliance issues would be acceptable, the use of passive turn control only is not recommended. This means that the initial turn restriction recommendation could be a directional island and that the agency should then monitor compliance to determine if an additional median is needed. The determination between the RIROLO and the RIRO can vary. If there is a destination to the left that should be accommodated, then the RIROLO directional island is acceptable. In all cases, the design of the directional island should maintain geometry that aids in channelization of the traffic and is not easily violated.
4.3.2 Example Problem – Five-lane Heavy Land Development Access
Question: A transportation agency has been asked to approve a new driveway that will be located approximately 480 feet from the nearest intersection. The traffic volume along the corridor is approximately 3000 vph during the peak period. The number of approximate access points per mile (this includes both sides of the road) is 40. Is it appropriate to permit construction of this driveway and are there any supplemental turn restrictions that should be recommended?
Evaluation Questions: The analyst should answer the follow questions:
1. Does the location provide adequate corner clearance?
2. Will any level of driver non-compliance be acceptable if turn restrictions are needed?
3. What additional speed reduction is acceptable if this and similar driveways are constructed along the corridor?
Responses to Questions: The following responses to the questions will be used to determine the recommended driveway turn constraint recommendation:
1. A corner clearance of 480 feet is adequate.
2. The propose five-lane section consists of four general use lanes and one TWLTL. This means that there is an expectation of left turn maneuvers into the adjacent sites (due to the presence of the continuous turn lane). This type of corridor requires flexibility and it is expected that a few drivers may not comply fully with any recommended turn restrictions.
3. One goal of the corridor is to provide easy access to the adjacent businesses. Consequently an allowable reduction in speed up to 25 percent would be acceptable.
Solution: Based on the response to the three questions, the corner clearance is adequate, some non-compliance is acceptable, and speed reductions up to 25 percent would still meet the corridor objectives. Upon review of Table 4.7 the 3000 vph volume for up to 40 access points per mile will result in a ten to 20 percent speed reduction simply due to the increased traffic volume (i.e. no access point option). For the 3000 vph threshold, the total speed reduction would then be greater than 30 percent of which ten to 20 percent of the reduction is due to the driveway placement. Since the 30 percent exceeds the allowable 25 percent speed reduction, it is advisable

49
not to construct a driveway at this location. The construction of a median treatment, however, would effectively convert the road to a four lane facility with a median and then Error! Reference source not found. would be applicable and the expected total speed reduction would be within the acceptable speed reduction levels (with a ten to 20 percent speed reduction for no turn restriction or a RIROLI configuration). The construction of a RIRO or a RIROLO would have a total speed reduction of less than ten percent.
Additional Note: If the corner clearance had a value of 80 feet instead of 480 feet, the turn restrictions would be extended to prohibiting left-turns into or out of an access. This would therefore limit the restriction to a RIRO only.
4.4 SUMMARY
The evaluation of the application of turn restrictions and the variety of configurations that may accomplish these operational affects was the target of this section of the report. First, the research team performed field observations to determine if various geometric designs were useful and if drivers complied with the recommended turn restrictions. A second safety evaluation determined if crashes commonly occurred at these locations and whether any of the crashes may have resulted from drivers violating the turn restrictions. Finally, a micro-simulation analysis served as the basis for demonstrating that operational improvements occur when RIROLO and RIRO turn restriction configurations are applied. The simulation analysis also helped to establish traffic volume and access point thresholds for the various turn restriction scenarios.

50
5.0 CONCLUSIONS
There is a need to determine effective ways for influencing traffic operations at access points. In many locations, the number of access points can be excessive and unrestricted turn movements into and out of these driveways and streets can directly contribute to diminishing corridor operations. This study evaluated a variety of turn restrictions including driveway only applications (physical and passive), median only, and combined effects. The use of a median can provide positive opportunities to facility users as a median is known to enhance corridor safety, improve traffic operations, and provide opportunities for pedestrian refuge. Unfortunately, a raised median can also restrict access to adjacent properties and limit the ability of a large vehicle to maneuver within the corridor.
This research effort, therefore, took a fresh look at the various turn restriction alternative and coupled this perspective with a literature summary, a state of practice evaluation, a field study and analysis, companion safety assessments, and a micro-simulation evaluation to determine the operational influence of the various turn restriction configuration (no turn, RIROLI, RIROLO, and RIRO).
In general, the use of passive turn restrictions through the application of pavement marking and signage does not appear to be effective. In some cases, a driver would observe the restriction and then continue to execute the illegal maneuver. In other cases, the field study observed vehicles with unfamiliar drivers who would pull up to exit a driveway, observe the passive turn restriction, and then reverse their vehicles and seek an alternative driveway. A similar behavior was observed at physically constrained locations. These observations suggest that regardless of the type of turn restriction, advanced warning is appropriate and should be more visible.
The research also determined that crashes do appear to occur at locations where drivers violate the turn restrictions; however, this varied based on location. One location included a RIRO island with very gentle geometry (easy to navigate around) at a driveway with a very short corner clearance to the next intersection. For this location, illegal left-turns into the driveway occurred across an intersection queue. This short corner clearance and companion mild island geometry resulted in several crashes. This finding suggests that more attention should be given the restrictive island geometry so that a driver is not inclined to attempt to navigate illegally around the island.
Finally, the micro-simulation task indicated the “no turn” restrictions and RIROLI restrictions have basically the same influence on corridor operations, particularly speed. The use of RIROLO, however, helps to improve corridor speeds. The operational difference between RIROLI and RIROLO are likely attributed to the exposure of the vehicle as the driver waits to execute the turning maneuver. For a RIROLI configuration, the vehicle is in the actual public road and may be exposed to other vehicles while waiting to turn. The RIROLO driver, on the other hand, is positioned in a lower volume driveway location and does not have the same effect on the overall corridor operations. Finally the RIRO configuration, when executed effectively, mimics the median operations and removes all mid-block left-turn vehicles from the primary

51
roadway. The RIRO operates similarly to the RIROLO and has similar influences on corridor speeds. This turn restriction option optimizes the corridor performance by eliminating cross traffic left-turns as except at designated locations.
This research effort focused on available turn restriction configurations. The research team did supplement the field study with a few additional Texas sites to determine if these candidate scenarios function in Texas well. A common Texas and Oregon application is the use of localized median treatments. This configuration isolates the median to the specific access point location and so does not restrict the entire corridor with a raised median. The performance of these configurations is similar to that of full medians and merits additional consideration.

52
6.0 REFERENCES
AASHTO. A Policy on Geometric Design of Highways and Streets. Washington, D.C., 2011. Alabama Department of Transportation (ALDOT). Access Management Manual. 2014. Available at: http://www.dot.state.al.us/maweb/doc/ALDOT%20Access%20Management%20Manual.pdf. Alabama Department of Transportation (ALDOT). Permit Manual. 2014. Available at: http://www.dot.state.al.us/maweb/doc/PermitManual.pdf.
Arizona Department of Transportation (AZDOT). Roadway Design Guidelines. 2012. Available at: http://www.azdot.gov/docs/business/roadway-design-guidelines.pdf?sfvrsn=0
Bonneson, J.A., and P.T. McCoy. Capacity and Operational Effects of Midblock left-turn Lanes. National Cooperative Highway Research Program Report Number 395, Transportation Research Board, National Research Council, Washington, D.C., 1996.
Bowman, B.L., and R.L. Vecellio. Effect of Urban and Suburban Median Types on Both Vehicular and Pedestrian Safety. Transportation Research Record, No. 1445, Transportation Research Board of the National Academies, Washington, D.C., 1994.
Box, P.C. Driveway Accident and Volume Studies, Part I – General Relationships. Public Safety Systems, May/June 1969, pp. 18-22.
California Department of Transportation (CALTRANS). Highway Design Manual, Chapter 4 Intersection at Grade. 2014. Available at: http://www.dot.ca.gov/hq/oppd/hdm/pdf/english/chp0500.pdf.
Chowdhury, M., N. Derov, P. Tan, and A. Sadek. Prohibiting Left-turn Movements at Mid-block Unsignalized Driveways: Simulation Analysis. Journal of Transportation Engineering, Vol. 131, No. 4, 2005, pp. 279-285.
Colorado Department of Transportation (CoDOT). State Highway Access Code. 1998, Updated March 2002. Available at: http://www.coloradodot.info/business/permits/accesspermits/references/601_1_accesscode_march2002_.pdf/view http://www.coloradodot.info/programs/traffic-safety/access-management. Connecticut Department of Transportation (ConnDOT). Highway Design Manual. Adopted 2003, Revised 2013. Available at: http://www.ct.gov/dot/lib/dot/documents/dpublications/highway/cover.pdf.

53
Delaware Department of Transportation (DelDOT). Standards and Regulations for Subdivision Streets and State Highway Access. Adopted Feb. 2010, Amended April 2013, Effective May 2013. Available at: http://www.deldot.gov/information/pubs_forms/manuals/subdivisions/pdf/Subdivision_Manual_Revision_1_proposed_060110.pdf. Delaware Department of Transportation (DelDOT). Road Design Manual. 2006. Chapter 07Intersections. Available at: http://www.deldot.gov/information/pubs_forms/manuals/road_design/pdf/revisions062811/07_Intersections.pdf?100411.
Eisele, W.L., and W.E. Frawley. Estimating the Safety and Operational Impact of Raised Medians and Driveway Density: Experiences from Texas and Oklahoma Case Studies. Transportation Research Record: Journal of the Transportation Research Board, No. 1931, Transportation Research Board of the National Academies, Washington, D.C., 2005, pp 108-116.
Florida Department of Transportation (FDOT). Median Handbook Interim Version. 2006. Available at: http://www.dot.state.fl.us/planning/systems/programs/sm/accman/pdfs/mhb06b.pdf.
Gattis, J., J. Gluck, J. Barlow, R. Eck, W. Hecker, and H. Levinson. Guide for the Geometric Design of Driveways. National Cooperative Highway Research Program, Report No. 659. Transportation Research Board of the National Academies, Washington, D.C., 2010.
Georgia Department of Transportation (GDOT). Design Policy Manual. 2014. Available at: http://www.dot.ga.gov/doingbusiness/PoliciesManuals/roads/DesignPolicy/GDOT-DPM.pdf. Georgia Department of Transportation (GDOT). Regulations for Driveway and Encroachment Control. 2009. Available at: http://www.dot.ga.gov/doingbusiness/PoliciesManuals/roads/Encroachment/DrivewayFull.pdf.
Gluck, J., H.S. Levinson, and V. Stover. Impacts of Access Management Techniques. National Cooperative Highway Research Program, Report, No. 420, Transportation Research Board of the National Academies, Washington, D.C., 1999.
Idaho Department of Transportation (IDT). Access Management: Standards and Procedures for Highway Right-of-Way Encroachments. 2001. Available at: http://itd.idaho.gov/highways/ops/Traffic/PUBLIC%20FOLDER/Access/Idaho%20AM%20Standards%20and%20Procedures.pdf.

54
Illinois Department of Transportation (IDOT). Bureau of Design and Environment Manual. (Adopted Sept. 2010, Updated Dec. 2013). Chapter Thiry-Five Access Control/Access Management. Available at: http://www.dot.state.il.us/desenv/bde%20manual/bde/pdf/Chapter%2035%20Access%20Control-Access%20Management.pdf.
Indiana Department of Transportation (INDOT). Access Management Guide. (Adopted August 2006, Revised Sept. 2009). Available at: http://www.in.gov/indot/files/guide_total.pdf. Iowa Department of Transportation (IowaDOT). Primary Highway Access Management Policy. 2012. Available at: http://www.iowadot.gov/traffic/pdfs/AccessPolicy.pdf.
Ivey, Harris, and Walls, Inc. District Wide Median Evaluation Technical Memorandum Corridor Land Use, Development and Driver/Business Survey Analysis. Florida Department of Transportation District 5, Winter Park, Florida, 1995.
Kansas Department of Transportation (KSDOT). Access Management Policy. 2013. Available at: http://www.ksdot.org/accessmanagement/Access_Management_Policy_Jan2013.pdf.
Kentucky Department of Transportation (KYTC). Highway Design Guidance Manual. 2006. Section HD-1101 Access Management Policy and Procedures. Available at: http://transportation.ky.gov/Highway-Design/Highway%20Design%20Manual/Access%20Management.pdf.
Liu, P., J.J. Lu, H. Zhou, and G. Sokolow. Operational Effects of U-turns as Alternatives to Direct Left-Turns. Journal of Transportation Engineering, Vol.133, No. 5, 2007, pp. 327-334.
Long, G.D., C.T. Gan, and B.S. Morrison. Safety Impacts of Selected Median and Access Design Features. Florida Department of Transportation, Transportation Research Center, University of Florida, 1993.
Louisiana Department of Transportation and Development (DOTD). Louisiana Administrative Code Title 70, Part 2, §531.C, Permit Rule. 2005. Available at: http://www.doa.la.gov/osr/lac/70v01/70v01.pdf.
Lu, J., S. Dissanayake, L. Xu, and K. Williams. Safety Evaluation of Right-Turns Followed by U-Turns as an Alternative to Direct Left Turns: Crash Data Analysis." Florida Department of Transportation, 2001.
Maine Department of Transportation (MaineDOT). Highway Driveway and Entrance Rules Part A, Driveway Rules, Chapter 299 (2001) Available at: http://www.maine.gov/mdot/ppp/accessmgmt/.
Maryland Department of Transportation (MdDOT). State Highway Access Manual. 2004. Available at: http://roads.maryland.gov/OHD/accesspermits.pdf.

55
Massachusetts Department of Transportation (MassDOT). Project Development & Design Guide Chapter 6 Intersection Design. 2006. Available at: http://www.massdot.state.ma.us/highway/DoingBusinessWithUs/ManualsPublicationsForms/ProjectDevelopmentDesignGuide.aspx.
Michigan Department of Transportation MiDOT). Road Design Manual. Revised 2011. Available at: http://mdotcf.state.mi.us/public/design/englishroadmanual/. Minnesota Department of Transportation (MnDOT). Access Management Manual. 2008. Chapter 3 Guidelines for Public Street and Driveway Connections Available at: http://www.dot.state.mn.us/accessmanagement/pdf/manualchapters/chapter3.pdf. Minnesota Department of Transportation (MnDOT). Road Design Manual. 2001. Available at: http://roaddesign.dot.state.mn.us/roaddesign.aspx. Mississippi Department of Transportation (MsDOT). Access Management Guide, version 2.0. 2012. Available at: http://sp.mdot.ms.gov/RoadwayDesign/Documents/MISSISSIPPI%20Access%20Management%20Guide_v2_Feb2012.pdf. Missouri Department of Transportation (MoDOT). Engineering Policy Guide. 2009. Category_940 Access Management. Available at: http://epg.modot.org/index.php?title=Category:940_Access_Management http://epg.modot.org/index.php?title=940.3_Clearance_of_Functional_Areas_of_Interchanges.
Montana Department of Transportation (MtDOT). Right of Way Operation Manual. 2007. Chapter_8 Access Management Available at: http://www.mdt.mt.gov/other/rw/external/manual/chapter_8.pdf.
Moskowitz, K., and W.E. Schaefer. California Median Study: 1958. Highway Research Board Bulletin 266 , Washington, D.C., 1960.
Nebraska Department of Transportation (NeDOT). Access Control Policy to the State Highway System. 2006. Available at: http://www.transportation.nebraska.gov/roway/pdfs/accesscontrol.pdf. Nevada Department of Transportation (NDOT). Access Management System and Standards. 1999. Available at: https://www.nevadadot.com/uploadedFiles/NDOT/About_NDOT/NDOT_Divisions/Planning/Safety_Engineering/TrafEng_AccesMgtSysStandards.pdf. New Jersey Department of Transportation (NJDOT). State of New Jersey Department of Transportation Roadway Design Manual. Update 2014. Section 6. Available at: http://www.state.nj.us/transportation/eng/documents/RDM/sec6.shtm. New Mexico Department of Transportation (NMDOT). State Access Management Plan, Chapter 3. Revised 2001. Available at:

56
http://dot.state.nm.us/content/dam/nmdot/Infrastructure/Access_management_Manual.pdf. New York Department of Transportation (NYSDOT). Highway Design Manual, Chapter 5 Basic Design. Limited Revision 2011. Available at: https://www.dot.ny.gov/divisions/engineering/design/dqab/hdm/hdm-repository/chapt_5_final.pdf. North Carolina Department of Transportation (NCDOT). Policy on Street And Driveway Access to North Carolina Highways. 2003. Available at: https://connect.ncdot.gov/projects/Roadway/RoadwayDesignAdministrativeDocuments/Policy%20on%20Street%20and%20Driveway%20Access.pdf. North Dakota Department of Transportation (NDDOT). Design Manual SECTION III-16 Driveways and Access Management. Revised 2009. Available at: https://www.dot.nd.gov/manuals/design/designmanual/chapter3/DM-3-16_tag.pdf.
Ohio Department of Transportation (OHDOT). State Highway Access Management Manual. 2008. Available at: http://www.dot.state.oh.us/districts/D01/PlanningPrograms/permits/Documents/State%20Highway%20Access%20Management%20Manual%20March%202008.pdf. Oregon Department of Transportation (ODOT). Highway Design Manual, Chapter 9. 2012 Available at: ftp://ftp.odot.state.or.us/techserv/roadway/web_drawings/HDM/2011%20HDM%20Rewrite/2012%20Chapter%209%20Grade%20Separations%20And%20Interchanges.pdf.
Parsonson, P.S. Development of Policies and Guidelines Governing Median Selection. Final Report. Georgia Institute of Technology, Atlanta, for Gwinnett County Department of Transportation, Lawrenceville, Georgia, 1990.
Pennsylvania Department of Transportation (PennDOT). Access Management Model Ordinances for Pennsylvania Municipalities Handbook. Issued April 2005, Updated February 2006. Available at: ftp://ftp.dot.state.pa.us/public/PubsForms/Publications/PUB%20574.pdf.
Phillips, S.L. Empirical Collision Model for Four-lane Median Divided and Five-lane With TWLTL Segments. 2004.
Pirinccioglu, F., J.J. Lu, P.Liu, and G. Sokolow. Right Turn from Driveways Followed by U-Turn on Four-Lane Arterials: Is It Safer than Direct Left Turn? Transportation Research Record: Journal of the Transportation Research Board, No. 1953, Transportation Research Board of the National Academies, Washington, D.C., 2006, pp. 172-179.
Potts, I.B., D.W. Harwood, D.J. Torbic, K.R. Richard, J.S. Gluck, H.S. Levinson, P.M. Garvey, and R.S. Ghebrial. Safety of U-Turns at Unsignalized Median Openings. National Cooperative Highway Research Program, Report No. 524, Transportation Research Board, National Research Council, Washington, D.C., 2004.

57
Schultz, G.G., K.T. Braley, and T. Boschert. Relationship between Access Management and Other Physical Roadway Characteristics and Safety. Journal of Transportation Engineering, Vol. 136, No. 2, 2009, pp. 141-148.
Sokolow, G., V. Stover, and F. Broen. Median Handbook Interim Version. Florida Department of Transportation, 2006.
South Carolina Department of Transportation (SCDOT). Access and Roadside Management Standards. 2008. Available at: http://www.scdot.org/doing/technicalpdfs/publicationsmanuals/trafficengineering/arms_2008.pdf South Dakota Department of Transportation (SDDOT). Road Design Manual Chapter 17 Access Management. Available at: http://sddot.com/business/design/docs/rd/rdmch17.pdf.
Squires, C.A., and P.S. Parsonson. Accident Comparison of Raised Median and Two-Way Left-Turn Lane Median Treatments. Transportation Research Record: Journal of the Transportation Research Board, No. 1239, Transportation Research Board of the National Academies, Washington, D.C., 1989, pp. 30-40.
Stover, V.G., and F.J. Koepke. Transportation and Land Development, Second Edition, Institute of Transportation Engineers, 2002.
Texas Department of Transportation (TxDOT). Access Management Manual. 2011. Available at: http://onlinemanuals.txdot.gov/txdotmanuals/acm/acm.pdf.
Utah Department of Transportation (UDOT). R930. Transportation Preconstruction. R930-6 Access Management. 2013. Available at: http://www.udot.utah.gov/main/uconowner.gf?n=11066229893635233.
Vermont Department of Transportation (VtDOT). Access Management Program Guidelines Revised 2005. Available at: http://vtransengineering.vermont.gov/sites/aot_program_development/files/documents/rightofway/UandPAccManProgGuidelinesRev072205.pdf. Virginia Department of Transportation (VDOT). Access Management Regulations. 2013. Available at: http://www.virginiadot.org/info/access_management_regulations_and_standards.asp.
Vu, P., V.Shankar, and S. Chayanan. Economic Impacts of Access Management. Washington State Transportation Center, University of Washington, Seattle, WA, 2002.
Washington Department of Transportation (WSDOT). Design Manual. Revised 2013). Available at: http://www.wsdot.wa.gov/Publications/Manuals/M22-01.htm#Individualchapters. Washington Department of Transportation (WSDOT). Highway Access Management Guidebook. 2002. Available at:

58
http://www.wsdot.wa.gov/NR/rdonlyres/F1CB0918-81F7-4127-85D5-0689D08C95CA/0/HAMGFinalMasterWeb.pdf.
West Virginia Department of Transportation (WVDOT). Design Directives Section 20.1.5 Access Control. 2006. Available at: http://www.transportation.wv.gov/highways/engineering/DD/2006%20DD%20Manual%20MASTER%2006112013.pdf. West Virginia Department of Transportation (WVDOT). Manual on Rules and Regulations for Constructing Driveways on State Highway Rights of Way. 2004. Available at: http://www.transportation.wv.gov/highways/traffic/Documents/DrivewayManual.pdf.
Williams, K.M., and J.R. Forester. Land Development Regulations that Promote Access Management. National Cooperative Highway Research Program Synthesis, No. 233, Transportation Research Board, National Research Council, Washington, D.C., 1996.
Williams, K.M., V.G. Stover, K.K. Dixon, and P. Demosthenes. Access Management Manual, 2nd edition. Transportation Research Board, National Research Council, Washington, D.C, 2014.
Wisconsin Department of Transportation (WisDOT). Facilities Development Manual Chapter 7 Access Control. 2013. Available at: http://roadwaystandards.dot.wi.gov/standards/fdm/07-00toc.pdf.
Wyoming Department of Transportation (WYDOT). Access Manual (March 2005). Available at: https://www.dot.state.wy.us/files/live/sites/wydot/files/shared/Traffic%20data/WYDOT%20Access%20Manual.pdf
Yang, X.K., and H.G. Zhou. CORSIM-based Simulation Approach to Evaluation of Direct Left Turn Versus Right Turn plus U-turn from Driveways. Journal of Transportation Engineering, Vol. 130, No. 1, 2004, pp. 68-75.
Zhou, H., J.J. Lu, X.K.Yang, S. Dissanayake, and K.M. Williams. Operational Effects of U-Turns as Alternatives to Direct Left Turns from Driveways. Transportation Research Record: Journal of the Transportation Research Board, No.1796, Transportation Research Board of the National Academies, Washington, D.C., 2002, pp. 72-79.

APPENDIX A


A-1
Acronyms and Abbreviations:
Acronym or Abbreviation
Definition
AASHTO American Association of State Highway and Transportation Officials ADT Average Daily Traffic CR Conflict Rate DHV Design Hourly Volume DLT Direct Left Turn DOT Department of Transportation MUTCD Manual on Uniform Traffic Control Devices MVMT Million Vehicle Miles Travelled NCHRP National Cooperative Highway Research Program ODOT Oregon Department of Transportation RIRO Right-in Right-out RIROLI Right-in Right-out Left-in RIROLO Right-in Right-out Left-out RTUT Right turn U-turn TRB Transportation Research Board TWLTL Two-way left-turn lane vpd Vehicles per day vph Vehicles per hour
Data for Oregon Sites:
This research included 14 Oregon sites including 12 driveway locations and two minor intersection locations characterized by unique turn-restriction characteristics. The detailed site information for each of these Oregon sites is presented in the following sections.
Site OR-1 – RIROLI (Median and Driveway Constrained)

A-2
Source: Google Earth
Figure A.1: Driveway Site OR-1 - Aerial and Site Photos
Table A.1: Four Year Crash Summary for Site OR-1
Year Number of PDO
Crashes Number of
Injury Crashes Comments
2010 0 0 -- 2011 0 0 -- 2012 1 0 Single vehicle crash – no details 2013 0 0 -- Total 1 0 No apparent crashes due to turn restriction violations

A-3
Table A. 2: Physical Characteristics and Volume Information – Site OR-1 Location Information Address 2925 The Dalles-California Hwy City Redmond State OR
Volumes for Roadway in Vicinity of Driveway Through Traffic Volume (vph)1
Afternoon Off-Peak Afternoon Peak Lanes immediately adjacent to driveway (2 lanes) 1078 1128 Lanes for opposing direction of travel (2 lanes) 1175 1421 Total two-directional traffic volume (4 lanes total) 2253 2549
Volumes for Study Driveway Driveway Volume (vph)
Afternoon Off-Peak Afternoon Peak Turns Into Driveway 83 cars, 7 trucks 60 cars, 2 trucks Turns Out of Driveway 46 cars, 3 trucks 33 cars, 1 truck Total Driveway Volume 129 cars, 10 trucks 93 cars, 3 trucks Turning Restriction Information Movement Configuration RIROLI – Median and Driveway Constrained Driveway Island and Traffic Control Raised concrete island, no-left-turn sign Roadway Median Raised concrete median and barricades Corner Clearance at Intersection (ft) 877 Geometric Design Information – Roadway in Vicinity of Driveway Width of Roadway (ft) 75 Number of Lanes 4 + TWLTL Lane Width (ft) 11 Bicycle Lane Yes Sidewalk Yes Geometric Design Information – Driveway Width of Driveway (ft) 36 Number of Lanes 2 Lane Width (ft) 18 1 Through traffic volumes do not include driveway volumes (presented separately) and do include passenger cars as well as trucks.
Table A.3: Turning Violation Details -- Site OR-1
Turning Movement
Legally Permitted
Afternoon Off-Peak Volume (vph)
Afternoon Peak hour Volume (vph)
Percent of Turn-Restriction Violations
Total Trucks Total Trucks All Vehicles Right-in Yes 36 2 25 0
NA Right-out Yes 46 3 33 1 Left-in Yes 47 5 35 2 Left-out No 0 0 0 0 Total Into Driveway 83 7 60 2 NA Total Out of Driveway 46 3 33 1 0% Total Driveway Volume 129 10 93 3 0% NA = Not Applicable

A-4
Site OR-2 – RIROLO (Median-Only Constrained)
Source: Google Earth
Figure A.2: Driveway Site OR-2 - Aerial and Site Photos
Table A.4: Four Year Crash Summary for Site OR-2
Year Number of PDO
Crashes Number of
Injury Crashes Comments
2010 1 2 Both injury crashes were angle and one of the crashes included a median violation
2011 0 0 -- 2012 2 0 Both rear-end crashes 2013 0 0 -- Total 3 2 One apparent turn restriction violation involved in injury crash

A-5
Table A.5: Physical Characteristics and Volume Information – Site OR-2 Location Information Address Redmond OR126 and 23rd (Northbound) City Redmond State OR
Volumes for Roadway in Vicinity of Driveway Through Traffic Volume (vph)1
Morning Off-Peak Mid-Day Peak Lanes immediately adjacent to driveway (2 lanes) 1042 1025 Lanes for opposing direction of travel (2 lanes) 840 937 Total two-directional traffic volume (4 lanes total) 1882 1962
Volumes for Study Driveway Driveway Volume (vph)
Morning Off-Peak Mid-Day Peak Turns Into Driveway 34 cars, 2 trucks 40 cars, 4 trucks Turns Out of Driveway 48 cars, 2 trucks 89 cars, 3 trucks Total Driveway Volume 82 cars, 4 trucks 129 cars, 7 trucks Turning Restriction Information Movement Configuration RIROLO – Median Constrained Driveway Island and Traffic Control Double yellow line Roadway Median Raised concrete median and barricades Corner Clearance at Intersection (ft) 646 Geometric Design Information – Roadway in Vicinity of Driveway Width of Roadway (ft) 48 Number of Lanes 4 Lane Width (ft) 2 Bicycle Lane Yes Sidewalk Yes Geometric Design Information – Driveway Width of Driveway (ft) 34 Number of Lanes 2 Lane Width (ft) 17 1 Through traffic volumes include passenger cars and trucks that are not involved in driveway maneuvers.
Table A.6: Turning Violation Details -- Site OR-2
Turning Movement
Legally Permitted
Morning Off-Peak Volume (vph)
Mid-Day Peak Volume (vph)
Percent of Turn-Restriction Violations
Total Trucks Total Trucks All Vehicles Right-in Yes 34 2 40 4
NA Right-out Yes 32 2 47 1 Left-in No 0 0 0 0 Left-out Yes 16 0 42 2 Total Into Driveway 34 2 40 4 0% Total Out of Driveway 48 2 89 3 NA Total Driveway Volume 82 4 129 7 0% NA = Not Applicable

A-6
Site OR-3 – RIRO (Median-Only Constrained)
Source: Google Earth
Figure A.3: Driveway Site OR-3 - Aerial and Site Photos
Table A.7: Four Year Crash Summary for Site OR-3
Year Number of PDO
Crashes Number of
Injury Crashes Comments
2010 1 0 Angle crash 2011 1 0 Rear-end crash 2012 0 0 -- 2013 2 1 All rear-end crashes, but the injury crash involved 6 vehicles Total 4 1 Only 1 injury crash in vicinity of median treatment

A-7
Table A.8: Physical Characteristics and Volume Information – Site OR-3 Location Information Address Redmond OR126 and 23rd (Southhbound) City Redmond State OR
Volumes for Roadway in Vicinity of Driveway Through Traffic Volume (vph)1
Morning Off-Peak2
Lanes immediately adjacent to driveway (2 lanes) 830 Lanes for opposing direction of travel (2 lanes) 1047 Total two-directional traffic volume (4 lanes total) 1877
Volumes for Study Driveway Driveway Volume (vph)
Morning Off-Peak Turns Into Driveway 31 cars, 1 truck Turns Out of Driveway 5 cars, 0 trucks Total Driveway Volume 36 cars, 1 truck Turning Restriction Information Movement Configuration RIRO – Median constrained Driveway Island and Traffic Control Painted median, no-left-turn sign Roadway Median Raised concrete median and barricades Corner Clearance at Intersection (ft) 646 Geometric Design Information – Roadway in Vicinity of Driveway Width of Roadway (ft) 48 Number of Lanes 4 Lane Width (ft) 2 Bicycle Lane Yes Sidewalk Yes Geometric Design Information – Driveway Width of Driveway (ft) 43 Number of Lanes 2 Lane Width (ft) 15 1 Through traffic volumes include passenger cars and trucks that are not involved in driveway maneuvers. 2 Due to low driveway volume and excellent driver compliance, data collection was not extended into the peak hour.
Table A.9: Turning Violation Details -- Site OR-3
Turning Movement
Legally Permitted
Morning Off-Peak Volume (vph) Percent of Turn-
Restriction Violations
Total Trucks All Vehicles Right-in Yes 31 1
NA Right-out Yes 5 0 Left-in No 0 0 Left-out No 0 0 Total Into Driveway 31 1 0% Total Out of Driveway 5 0 0% Total Driveway Volume 36 0 0% NA = Not Applicable

A-8

A-9
Site OR-4 – RIROLI (Median-Only Constrained)
Source: Google Earth
Figure A.4: Driveway Site OR-4 - Aerial and Site Photos
Table A.10: Four Year Crash Summary for Site OR-4
Year Number of PDO
Crashes Number of
Injury Crashes Comments
2010 1 0 Appears to be a head-on, slow speed crash in driveway
2011 1 0 Turning crash with vehicle attempting to turn and violate median
2012 0 0 -- 2013 0 0 -- Total 2 0 One apparent turn restriction violation involved in PDO crash
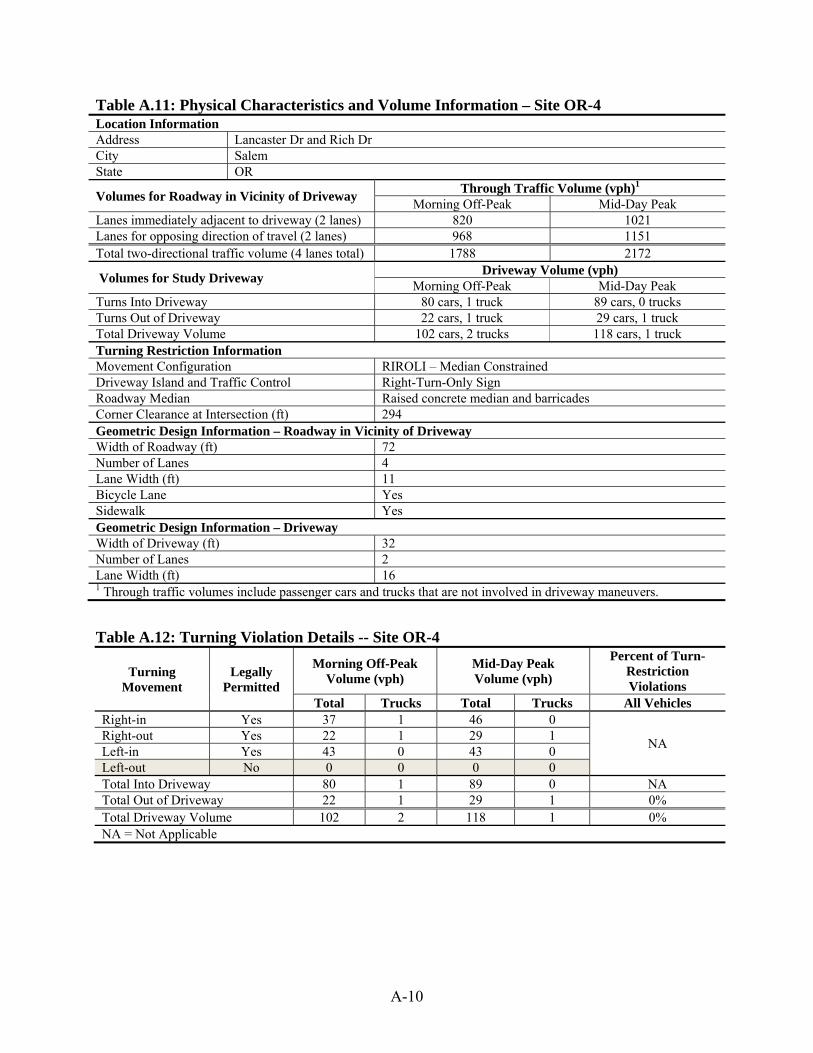
A-10
Table A.11: Physical Characteristics and Volume Information – Site OR-4 Location Information Address Lancaster Dr and Rich Dr City Salem State OR
Volumes for Roadway in Vicinity of Driveway Through Traffic Volume (vph)1
Morning Off-Peak Mid-Day Peak Lanes immediately adjacent to driveway (2 lanes) 820 1021 Lanes for opposing direction of travel (2 lanes) 968 1151 Total two-directional traffic volume (4 lanes total) 1788 2172
Volumes for Study Driveway Driveway Volume (vph)
Morning Off-Peak Mid-Day Peak Turns Into Driveway 80 cars, 1 truck 89 cars, 0 trucks Turns Out of Driveway 22 cars, 1 truck 29 cars, 1 truck Total Driveway Volume 102 cars, 2 trucks 118 cars, 1 truck Turning Restriction Information Movement Configuration RIROLI – Median Constrained Driveway Island and Traffic Control Right-Turn-Only Sign Roadway Median Raised concrete median and barricades Corner Clearance at Intersection (ft) 294 Geometric Design Information – Roadway in Vicinity of Driveway Width of Roadway (ft) 72 Number of Lanes 4 Lane Width (ft) 11 Bicycle Lane Yes Sidewalk Yes Geometric Design Information – Driveway Width of Driveway (ft) 32 Number of Lanes 2 Lane Width (ft) 16 1 Through traffic volumes include passenger cars and trucks that are not involved in driveway maneuvers.
Table A.12: Turning Violation Details -- Site OR-4
Turning Movement
Legally Permitted
Morning Off-Peak Volume (vph)
Mid-Day Peak Volume (vph)
Percent of Turn-Restriction Violations
Total Trucks Total Trucks All Vehicles Right-in Yes 37 1 46 0
NA Right-out Yes 22 1 29 1 Left-in Yes 43 0 43 0 Left-out No 0 0 0 0 Total Into Driveway 80 1 89 0 NA Total Out of Driveway 22 1 29 1 0% Total Driveway Volume 102 2 118 1 0% NA = Not Applicable

A-11
Site OR-5 – RIRO (Driveway-Only Constrained)
Source: Google Earth
Figure A.5: Driveway Site OR-5 - Aerial and Site Photos
Table A.13: Four Year Crash Summary for Site OR-5
Year Number of PDO
Crashes Number of
Injury Crashes Comments
2010 0 0 -- 2011 1 1 Both crashes appeared to involve illegal left-turn into driveway 2012 1 0 Crash appeared to involve illegal left-turn into driveway 2013 1 0 Crash appeared to involve illegal left-turn into driveway Total 3 1 4 crashes affiliated with ineffective RIRO turn constraint

A-12
Table A.14: Physical Characteristics and Volume Information – Site OR-5 Location Information Address 3999 Commercial St SE City Salem State OR
Volumes for Roadway in Vicinity of Driveway Through Traffic Volume (vph)1
Afternoon Off-Peak Lanes immediately adjacent to driveway (2 lanes) 1290 Lanes for opposing direction of travel (2 lanes) 1129 Total two-directional traffic volume (4 lanes total) 2419
Volumes for Study Driveway Driveway Volume (vph)
Afternoon Off-Peak2 Turns Into Driveway 7 cars, 0 trucks Turns Out of Driveway 2 cars, 0 trucks Total Driveway Volume 9 cars, 0 trucks Turning Restriction Information Movement Configuration RIRO – Driveway-Only Constrained Driveway Island and Traffic Control Raised concrete island Roadway Median Double yellow line Corner Clearance at Intersection (ft) 65 Geometric Design Information – Roadway in Vicinity of Driveway Width of Roadway (ft) 85 Number of Lanes 6 (4 standard use lanes, 2 exclusive turn lanes) Lane Width (ft) 11 Bicycle Lane Yes Sidewalk Yes Geometric Design Information – Driveway Width of Driveway (ft) 32 Number of Lanes 2 Lane Width (ft) 11 1 Through traffic volumes include passenger cars and trucks that are not involved in driveway maneuvers. 2 Driveway activity appeared to end around 5 p.m. due to type of business served.
Table A.15: Turning Violation Details -- Site OR-5
Turning Movement
Legally Permitted
Afternoon Off-Peak Volume (vph) Percent of Turn-
Restriction Violations
Total Trucks All Vehicles Right-in Yes 6 0
NA Right-out Yes 1 0 Left-in No 1 0 Left-out No 1 0 Total Into Driveway 7 0 14% Total Out of Driveway 2 0 50% Total Driveway Volume 9 0 22% NA = Not Applicable

A-13
Site OR-6 – RIRO (Driveway-Only Constrained)
Source: Google Earth
Figure A.6: Driveway Site OR-6 - Aerial and Site Photos
Table A.16: Four Year Crash Summary for Site OR-6
Year Number of PDO
Crashes Number of
Injury Crashes Comments
2010 0 0 -- 2011 0 0 -- 2012 0 0 -- 2013 0 0 -- Total 0 0 No recorded crashes at access point of interest
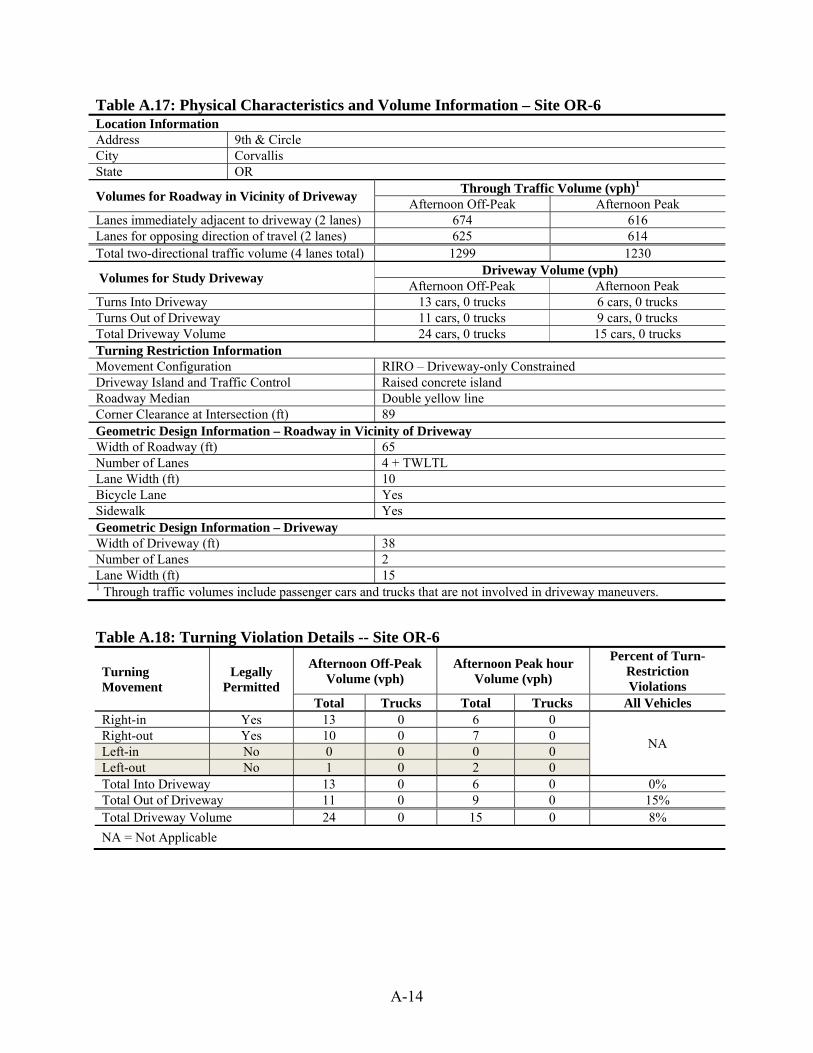
A-14
Table A.17: Physical Characteristics and Volume Information – Site OR-6 Location Information Address 9th & Circle City Corvallis State OR
Volumes for Roadway in Vicinity of Driveway Through Traffic Volume (vph)1
Afternoon Off-Peak Afternoon Peak Lanes immediately adjacent to driveway (2 lanes) 674 616 Lanes for opposing direction of travel (2 lanes) 625 614 Total two-directional traffic volume (4 lanes total) 1299 1230
Volumes for Study Driveway Driveway Volume (vph)
Afternoon Off-Peak Afternoon Peak Turns Into Driveway 13 cars, 0 trucks 6 cars, 0 trucks Turns Out of Driveway 11 cars, 0 trucks 9 cars, 0 trucks Total Driveway Volume 24 cars, 0 trucks 15 cars, 0 trucks Turning Restriction Information Movement Configuration RIRO – Driveway-only Constrained Driveway Island and Traffic Control Raised concrete island Roadway Median Double yellow line Corner Clearance at Intersection (ft) 89 Geometric Design Information – Roadway in Vicinity of Driveway Width of Roadway (ft) 65 Number of Lanes 4 + TWLTL Lane Width (ft) 10 Bicycle Lane Yes Sidewalk Yes Geometric Design Information – Driveway Width of Driveway (ft) 38 Number of Lanes 2 Lane Width (ft) 15 1 Through traffic volumes include passenger cars and trucks that are not involved in driveway maneuvers.
Table A.18: Turning Violation Details -- Site OR-6
Turning Movement
Legally Permitted
Afternoon Off-Peak Volume (vph)
Afternoon Peak hour Volume (vph)
Percent of Turn-Restriction Violations
Total Trucks Total Trucks All Vehicles Right-in Yes 13 0 6 0
NA Right-out Yes 10 0 7 0 Left-in No 0 0 0 0 Left-out No 1 0 2 0 Total Into Driveway 13 0 6 0 0% Total Out of Driveway 11 0 9 0 15% Total Driveway Volume 24 0 15 0 8%
NA = Not Applicable

A-15
Site OR-7 – RIRO (Driveway-Only Constrained)
Source: Google Earth
Figure A.7: Driveway Site OR-7 - Aerial and Site Photos
Table A.19: Four Year Crash Summary for Site OR-7
Year Number of PDO
Crashes Number of
Injury Crashes Comments
2010 0 0 -- 2011 0 0 -- 2012 0 0 -- 2013 0 0 -- Total 0 0 No recorded crashes at access point of interest
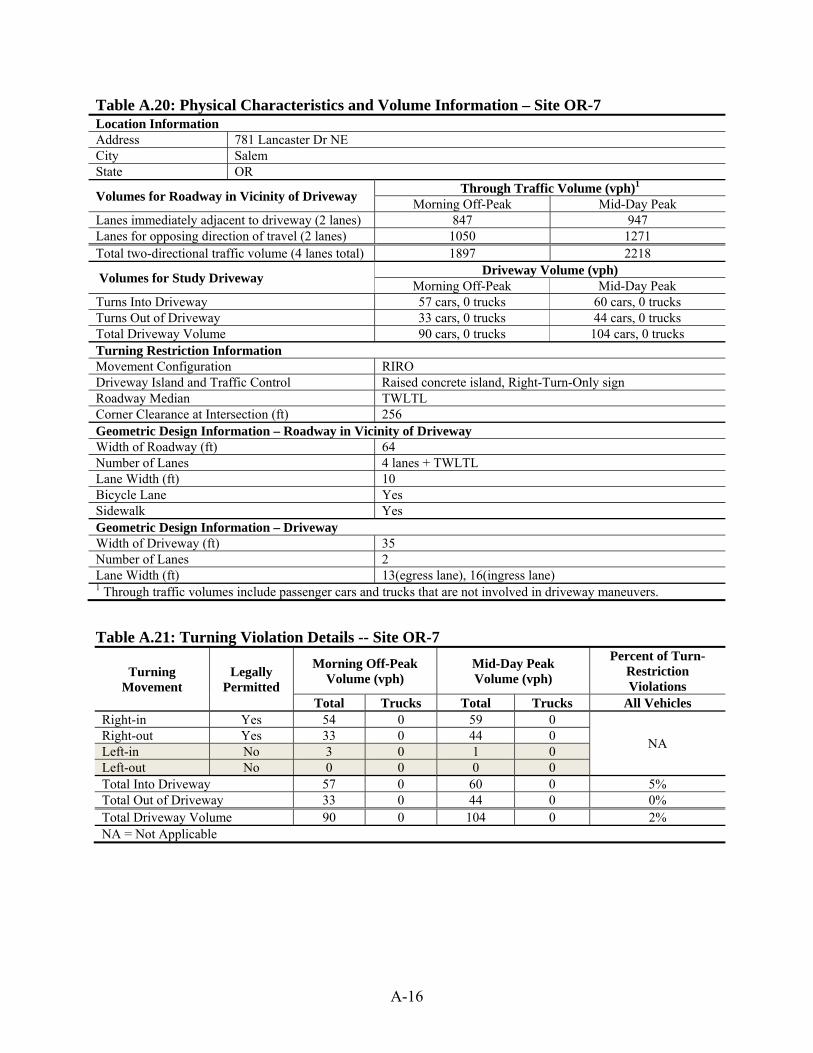
A-16
Table A.20: Physical Characteristics and Volume Information – Site OR-7 Location Information Address 781 Lancaster Dr NE City Salem State OR
Volumes for Roadway in Vicinity of Driveway Through Traffic Volume (vph)1
Morning Off-Peak Mid-Day Peak Lanes immediately adjacent to driveway (2 lanes) 847 947 Lanes for opposing direction of travel (2 lanes) 1050 1271 Total two-directional traffic volume (4 lanes total) 1897 2218
Volumes for Study Driveway Driveway Volume (vph)
Morning Off-Peak Mid-Day Peak Turns Into Driveway 57 cars, 0 trucks 60 cars, 0 trucks Turns Out of Driveway 33 cars, 0 trucks 44 cars, 0 trucks Total Driveway Volume 90 cars, 0 trucks 104 cars, 0 trucks Turning Restriction Information Movement Configuration RIRO Driveway Island and Traffic Control Raised concrete island, Right-Turn-Only sign Roadway Median TWLTL Corner Clearance at Intersection (ft) 256 Geometric Design Information – Roadway in Vicinity of Driveway Width of Roadway (ft) 64 Number of Lanes 4 lanes + TWLTL Lane Width (ft) 10 Bicycle Lane Yes Sidewalk Yes Geometric Design Information – Driveway Width of Driveway (ft) 35 Number of Lanes 2 Lane Width (ft) 13(egress lane), 16(ingress lane) 1 Through traffic volumes include passenger cars and trucks that are not involved in driveway maneuvers.
Table A.21: Turning Violation Details -- Site OR-7
Turning Movement
Legally Permitted
Morning Off-Peak Volume (vph)
Mid-Day Peak Volume (vph)
Percent of Turn-Restriction Violations
Total Trucks Total Trucks All Vehicles Right-in Yes 54 0 59 0
NA Right-out Yes 33 0 44 0 Left-in No 3 0 1 0 Left-out No 0 0 0 0 Total Into Driveway 57 0 60 0 5% Total Out of Driveway 33 0 44 0 0% Total Driveway Volume 90 0 104 0 2% NA = Not Applicable

A-17
Site OR-8 – RIROLI (Driveway-Only Constrained)
Source: Google EarthFigure A.8: Driveway Site OR-8 - Aerial and Site Photos
Table A.22: Four Year Crash Summary for Site OR-8
Year Number of PDO
Crashes Number of
Injury Crashes Comments
2010 0 0 -- 2011 0 0 -- 2012 1 0 Driver turned left out of RIRO driveway 2013 0 0 -- Total 1 0 Crash appears to be due to turn restriction violation

A-18
Table A.23: Physical Characteristics and Volume Information – Site OR-8 Location Information Address 1186 The Dalles-California Hwy City Bend State OR
Volumes for Roadway in Vicinity of Driveway Through Traffic Volume (vph)1
Afternoon Off-Peak Lanes immediately adjacent to driveway (2 lanes) 100 Lanes for opposing direction of travel (2 lanes) 817 Total two-directional traffic volume (4 lanes total) 1817
Volumes for Study Driveway Driveway Volume (vph)
Afternoon Off-Peak Turns Into Driveway 29 cars, 1 truck Turns Out of Driveway 25 cars, 0 trucks Total Driveway Volume 54 cars, 1 truck Turning Restriction Information Movement Configuration RIROLI – Driveway-Only Constrained Driveway Island and Traffic Control Raised concrete island Roadway Median Solid and dashed yellow line Corner Clearance at Intersection (ft) 184 Geometric Design Information – Roadway in Vicinity of Driveway Width of Roadway (ft) 72 Number of Lanes 4 + TWLTL Lane Width (ft) 12 Bicycle Lane Yes Sidewalk Yes Geometric Design Information – Driveway Width of Driveway (ft) 33 Number of Lanes 2 Lane Width (ft) 24 (ingress lane), 12 ( egress lane) 1 Through traffic volumes include passenger cars and trucks that are not involved in driveway maneuvers.
Table A.24: Turning Violation Details -- Site OR-8
Turning Movement
Legally Permitted
Afternoon Off-Peak Volume (vph) Percent of Turn-
Restriction Violations
Total Trucks All Vehicles Right-in Yes 26 1
NA Right-out Yes 20 0 Left-in Yes 3 0 Left-out No 5 0 Total Into Driveway 29 1 NA Total Out of Driveway 25 0 20% Total Driveway Volume 54 1 9% NA = Not Applicable

A-19
Site OR-9 – RIRO (Driveway-Only Constrained)
Source: Google Earth
Figure A.9: Driveway Site OR-9 - Aerial and Site Photos
Table A.25: Four Year Crash Summary for Site OR-9
Year Number of PDO
Crashes Number of
Injury Crashes Comments
2010 0 0 -- 2011 0 0 -- 2012 0 0 -- 2013 0 0 -- Total 0 0 No recorded crashes at access point of interest

A-20
Table A.26: Physical Characteristics and Volume Information – Site OR-9 Location Information Address 4911 SE Powell Blvd City Portland State OR
Volumes for Roadway in Vicinity of Driveway Through Traffic Volume (vph)1
Mid-Day Peak Lanes immediately adjacent to driveway (2 lanes) 1275 Lanes for opposing direction of travel (2 lanes) 1257 Total two-directional traffic volume (4 lanes total) 2582
Volumes for Study Driveway Driveway Volume (vph)
Mid-Day Peak Turns Into Driveway 21 cars, 0 trucks Turns Out of Driveway 9 cars, 0 trucks Total Driveway Volume 30 cars, 0 trucks Turning Restriction Information Movement Configuration RIRO – Driveway-Only Constrained Driveway Island and Traffic Control Raised concrete island Roadway Median Double yellow line Corner Clearance at Intersection (ft) 84 Geometric Design Information – Roadway in Vicinity of Driveway Width of Roadway (ft) 47 Number of Lanes 3 Lane Width (ft) 12 Bicycle Lane Yes Sidewalk Yes Geometric Design Information – Driveway Width of Driveway (ft) 64 Number of Lanes 2 Lane Width (ft) 15(egress lane), 20(ingress lane) 1 Through traffic volumes include passenger cars and trucks that are not involved in driveway maneuvers.
Table A.27: Turning Violation Details -- Site OR-9
Turning Movement
Legally Permitted
Mid-Day Peak Volume (vph) Percent of Turn-
Restriction Violations
Total Trucks All Vehicles Right-in Yes 21 0
NA Right-out Yes 9 0 Left-in No 0 0 Left-out No 0 0 Total Into Driveway 21 0 0% Total Out of Driveway 9 0 0% Total Driveway Volume 30 0 0% NA = Not Applicable
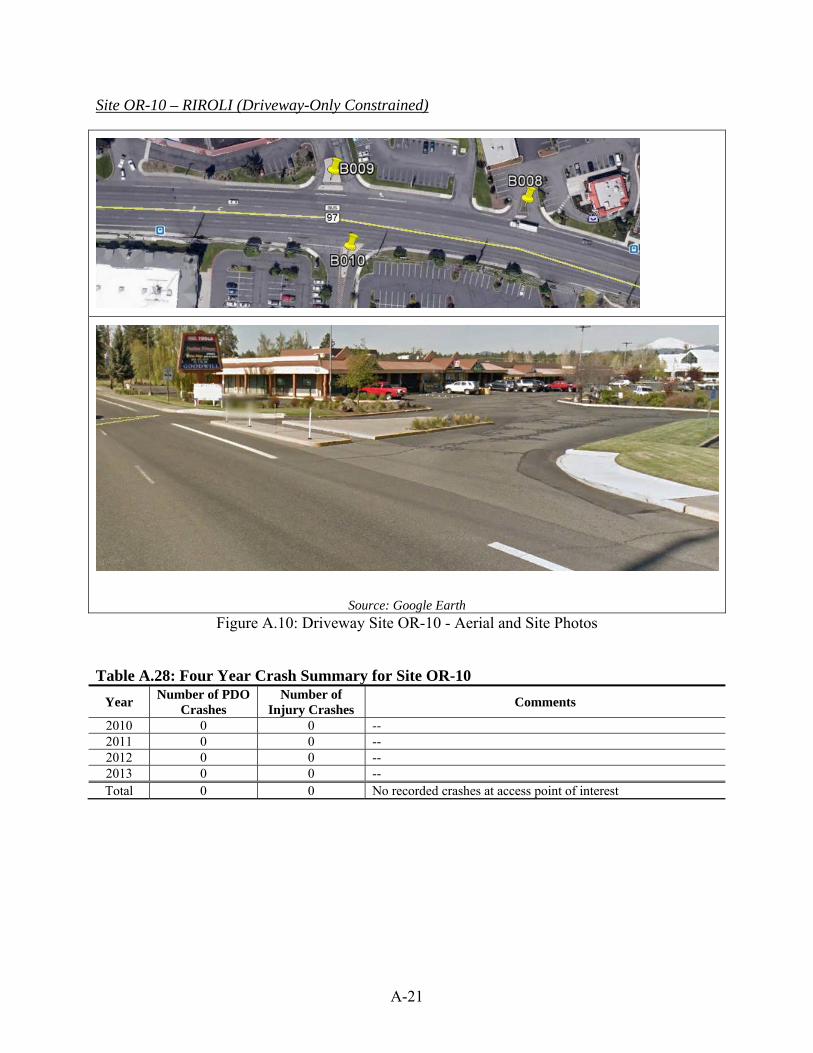
A-21
Site OR-10 – RIROLI (Driveway-Only Constrained)
Source: Google EarthFigure A.10: Driveway Site OR-10 - Aerial and Site Photos
Table A.28: Four Year Crash Summary for Site OR-10
Year Number of PDO
Crashes Number of
Injury Crashes Comments
2010 0 0 -- 2011 0 0 -- 2012 0 0 -- 2013 0 0 -- Total 0 0 No recorded crashes at access point of interest

A-22
Table A.29: Physical Characteristics and Volume Information – Site OR-10 Location Information Address 61332 The Dalles-California Hwy City Bend State OR
Volumes for Roadway in Vicinity of Driveway Through Traffic Volume (vph)1
Afternoon Peak Lanes immediately adjacent to driveway (2 lanes) 1448 Lanes for opposing direction of travel (2 lanes) 1057 Total two-directional traffic volume (4 lanes total) 2505
Volumes for Study Driveway Driveway Volume (vph)
Afternoon Peak Turns Into Driveway 101 cars, 2 trucks Turns Out of Driveway 90 cars, 1 truck Total Driveway Volume 191 cars, 3 trucks Turning Restriction Information Movement Configuration RIROLI – Driveway-Only Constrained Driveway Island and Traffic Control Raised concrete island Roadway Median TWLTL Corner Clearance at Intersection (ft) 659 Geometric Design Information – Roadway in Vicinity of Driveway Width of Roadway (ft) 77 Number of Lanes 4 + TWLTL Lane Width (ft) 12 Bicycle Lane Yes Sidewalk Yes Geometric Design Information – Driveway Width of Driveway (ft) 52 Number of Lanes 2 Lane Width (ft) 11(egress lane), 24(ingress lane) 1 Through traffic volumes include passenger cars and trucks that are not involved in driveway maneuvers.
Table A.30: Turning Violation Details -- Site OR-10
Turning Movement
Legally Permitted
Afternoon Peak Volume (vph) Percent of Turn-
Restriction Violations
Total Trucks All Vehicles Right-in Yes 84 2
NA Right-out Yes 60 1 Left-in Yes 17 0 Left-out No 30 0 Total Into Driveway 101 2 NA Total Out of Driveway 90 1 33% Total Driveway Volume 191 3 15% NA = Not Applicable

A-23
Site OR-11 – RIROLI (Driveway-Only Constrained)
Source: Google EarthFigure A.11: Driveway Site OR-11 - Aerial and Site Photos
Table A.31: Four Year Crash Summary for Site OR-11
Year Number of PDO
Crashes Number of
Injury Crashes Comments
2010 0 0 -- 2011 0 0 -- 2012 0 0 -- 2013 1 0 Rear-end crash adjancent to driveway – no violation Total 1 0 No violations due to turn restrictions

A-24
Table A.32: Physical Characteristics and Volume Information – Site OR-11 Location Information Address 61332 The Dalles-California Hwy City Bend State OR
Volumes for Roadway in Vicinity of Driveway Through Traffic Volume (vph)1
Afternoon Peak Lanes immediately adjacent to driveway (2 lanes) 1057 Lanes for opposing direction of travel (2 lanes) 1448 Total two-directional traffic volume (4 lanes total) 2505
Volumes for Study Driveway Driveway Volume (vph)
Afternoon Peak Turns Into Driveway 142 cars, 0 trucks Turns Out of Driveway 127 cars, 2 trucks Total Driveway Volume 269 cars, 2 trucks Turning Restriction Information Movement Configuration RIROLI – Driveway-Only Constrained Driveway Island and Traffic Control Raised concrete island Roadway Median TWLTL Corner Clearance at Intersection (ft) 659 Geometric Design Information – Roadway in Vicinity of Driveway Width of Roadway (ft) 77 Number of Lanes 4 + TWLTL Lane Width (ft) 12 Bicycle Lane Yes Sidewalk Yes Geometric Design Information – Driveway Width of Driveway (ft) 38 Number of Lanes 2 Lane Width (ft) 15 (ingress lane), 23-12 (egress lane) 1 Through traffic volumes include passenger cars and trucks that are not involved in driveway maneuvers.
Table A.33: Turning Violation Details -- Site OR-11
Turning Movement
Legally Permitted
Afternoon Peak Volume (vph) Percent of Turn-
Restriction Violations
Total Trucks All Vehicles Right-in Yes 18 0
NA Right-out Yes 125 2 Left-in Yes 124 0 Left-out No 2 0 Total Into Driveway 142 0 NA Total Out of Driveway 127 2 2% Total Driveway Volume 269 2 1% NA = Not Applicable

A-25
Site OR-12 – RIRO (Driveway-Only Constrained)
Source: Google EarthFigure A.12: Driveway Site OR-12 - Aerial and Site Photos
Table A.34: Four Year Crash Summary for Site OR-12
Year Number of PDO
Crashes Number of
Injury Crashes Comments
2010 0 0 -- 2011 0 0 -- 2012 0 0 -- 2013 0 0 -- Total 0 0 No recorded crashes at access point of interest

A-26
Table A.35: Physical Characteristics and Volume Information – Site OR-12 Location Information Address 329 NE Greenwood Ave City Bend State OR
Volumes for Roadway in Vicinity of Driveway Through Traffic Volume (vph)1
Morning Off-Peak Lanes immediately adjacent to driveway (2 lanes) 720 Lanes for opposing direction of travel (2 lanes) 704 Total two-directional traffic volume (4 lanes total) 1424
Volumes for Study Driveway Driveway Volume (vph)
Morning Off-Peak Turns Into Driveway 23 cars, 1 truck Turns Out of Driveway 18 cars, 1 truck Total Driveway Volume 41 cars, 2 trucks Turning Restriction Information Movement Configuration RIRO – Driveway-Only Constrained Driveway Island and Traffic Control Raised concrete island Roadway Median Double yellow line Corner Clearance at Intersection (ft) 118 Geometric Design Information – Roadway in Vicinity of Driveway Width of Roadway (ft) 66 Number of Lanes 4 + TWLTL Lane Width (ft) 11 Bicycle Lane Yes Sidewalk Yes Geometric Design Information – Driveway Width of Driveway (ft) 60 Number of Lanes 2 Lane Width (ft) 25 1 Through traffic volumes include passenger cars and trucks that are not involved in driveway maneuvers.
Table A.36: Turning Violation Details -- Site OR-12
Turning Movement
Legally Permitted
Afternoon Off-Peak Volume (vph) Percent of Turn-
Restriction Violations
Total Trucks All Vehicles Right-in Yes 23 1
NA Right-out Yes 18 1 Left-in No 0 0 Left-out No 0 0 Total Into Driveway 23 1 0% Total Out of Driveway 18 1 0% Total Driveway Volume 41 2 0% NA = Not Applicable

A-27
Site OR-13 – RIROLI (Driveway-Only Constrained)
Source: Google EarthFigure A.13: Minor Road Leg at Site OR-13 - Aerial and Site Photos
Table A.37: Four Year Crash Summary for Site OR-13
Year Number of PDO
Crashes Number of
Injury Crashes Comments
2010 0 0 -- 2011 0 0 -- 2012 0 1 -- 2013 0 1 -- Total 0 2 Both crashes were rear-end and do not appear to be violations

A-28
Table A.38: Physical Characteristics and Volume Information – Site OR-13 Location Information Address 395 NE Greenwood Ave (NB) City Bend State OR Volumes for Roadway in Vicinity of Intersection
Through Traffic Volume (vph)1
Afternoon Off-Peak Afternoon Peak Lanes immediately adjacent to driveway (2 lanes) 797 808 Lanes for opposing direction of travel (2 lanes) 821 876 Total two-directional traffic volume (4 lanes total) 1618 1684
Volumes for Study Minor Road Leg Minor Road Leg Volume (vph)
Afternoon Off-Peak Afternoon Peak Turns Into Minor Road 76 cars, 2 trucks 64 cars, 1 truck Turns Out of Minor Road 96 cars, 1 truck 80 cars, 1 truck Total Minor Road Leg Volume 172 cars, 3 trucks 144 cars, 2 trucks Turning Restriction Information Movement Configuration RIROLI – Signage only Driveway Island and Traffic Control Double yellow line, No-left-turn sign Roadway Median --- Corner Clearance at Intersection (ft) 387 Geometric Design Information – Roadway in Vicinity of Minor Road Leg Width of Roadway (ft) 68 Number of Lanes 4 + TWLTL Lane Width (ft) 11 Bicycle Lane Yes Sidewalk Yes Geometric Design Information – Minor Road Leg Width of Minor Road Leg (ft) 38 Number of Lanes 2 Lane Width (ft) 21(egress lane), 17(ingress lane) 1 Through traffic volumes include passenger cars and trucks that are not involved in minor road leg maneuvers.
Table A.39: Turning Violation Details -- Site OR-13
Turning Movement
Legally Permitted
Afternoon Off-Peak Volume (vph)
Afternoon Peak hour Volume (vph)
Percent of Turn-Restriction Violations
Total Trucks Total Trucks All Vehicles Right-in Yes 68 2 54 1
NA Right-out Yes 88 1 76 1 Left-in Yes 8 0 10 0 Left-out No 4 0 4 0 Total Into Minor Road Leg 76 2 64 1 NA Total Out of Minor Road Leg 96 1 80 1 5% Total Minor Road Leg Volume 172 3 144 2 2.5% NA = Not Applicable

A-29
Site OR-14 – RIROLI (Driveway-Only Constrained)
Source: Google EarthFigure A.14: Minor Road Leg at Site OR-14 - Aerial and Site Photos
Table A.40: Four Year Crash Summary for Site OR-14
Year Number of PDO
Crashes Number of
Injury Crashes Comments
2010 0 0 -- 2011 3 0 Angle crashes but do not involve a turn restriction violation 2012 1 0 Angle crash with a violation of turn restrictions 2013 0 1 Angle crash but did not involve a turn restriction violation Total 4 1 No left-turn signage had one PDO associated with a violation

A-30
Table A.41: Physical Characteristics and Volume Information – Site OR-14 Location Information Address 395 NE Greenwood Ave (SB) City Bend State OR Volumes for Roadway in Vicinity of Intersection
Through Traffic Volume (vph)1
Afternoon Peak Lanes immediately adjacent to driveway (2 lanes) 876 Lanes for opposing direction of travel (2 lanes) 808 Total two-directional traffic volume (4 lanes total) 1684
Volumes for Study Minor Road Leg Minor Road Leg Volume (vph)
Afternoon Peak Turns Into Minor Road 65 cars, 2 trucks Turns Out of Minor Road 85 cars, 2 trucks Total Minor Road Leg Volume 150 cars, 4 trucks Turning Restriction Information Movement Configuration RIROLI – Signage only Driveway Island and Traffic Control Double yellow line, No-left-turn sign Roadway Median --- Corner Clearance at Intersection (ft) 387 Geometric Design Information – Roadway in Vicinity of Minor Road Leg Width of Roadway (ft) 68 Number of Lanes 4 + TWLTL Lane Width (ft) 11 Bicycle Lane Yes Sidewalk Yes Geometric Design Information – Minor Road Leg Width of Minor Road Leg (ft) 26 Number of Lanes 2 Lane Width (ft) 16 1 Through traffic volumes include passenger cars and trucks that are not involved in minor road leg maneuvers.
Table A.42: Turning Violation Details -- Site OR-14
Turning Movement
Legally Permitted
Afternoon Peak Volume (vph) Percent of Turn-
Restriction Violations
Total Trucks All Vehicles Right-in Yes 16 0
NA Right-out Yes 85 2 Left-in Yes 49 2 Left-out No 0 0 Total Into Minor Road Leg 65 2 NA Total Out of Minor Road Leg 85 2 0% Total Minor Road Leg Volume 150 4 0% NA = Not Applicable

A-31
Data for Texas Sites:
This research included a total of six Texas driveway locations characterized by driveway turn-restrictions. The supplemental Texas sites are included to determine (1) if drivers from different geographic locations react similarly to a turn-restriction configuration, and (2) how drivers respond to alternative configurations other than those studied in Oregon.
Site TX-15 – RIRO (Driveway-Only Constrained)
Source: Google Earth Figure A.15: Driveway Site TX-15 - Aerial and Site Photos

A-32
Table A.43: Physical Characteristics and Volume Information – Site TX-15 Location Information Address 2927 S Texas Ave City Bryan State TX
Volumes for Roadway in Vicinity of Driveway Through Traffic Volume (vph)1
Afternoon Peak Lanes immediately adjacent to driveway (2 lanes) 852 Lanes for opposing direction of travel (2 lanes) 887 Total two-directional traffic volume (4 lanes total) 1739
Volumes for Study Driveway Driveway Volume (vph)
Afternoon Peak Turns Into Driveway 32 cars, 0 trucks Turns Out of Driveway 22 cars, 0 trucks Total Driveway Volume 54 cars, 0 trucks Turning Restriction Information Movement Configuration RIRO – Driveway-Only Constrained Driveway Island and Traffic Control Raised concrete driveway island with barricades Roadway Median Double yellow line Corner Clearance at Intersection (ft) 152 Geometric Design Information – Roadway in Vicinity of Driveway Width of Roadway (ft) 66 Number of Lanes 4 lanes + 2 left turning lanes Lane Width (ft) 10 Bicycle Lane No Sidewalk Yes Geometric Design Information – Driveway Width of Driveway (ft) 29 Number of Lanes 2 lanes Lane Width (ft) 14 1 Through traffic volumes include passenger cars and trucks that are not involved in driveway maneuvers.
Table A.44: Turning Violation Details -- Site TX-15
Turning Movement
Legally Permitted
Afternoon Peak Volume (vph) Percent of Turn-
Restriction Violations
Total Trucks All Vehicles Right-in Yes 31 0
NA Right-out Yes 21 0 Left-in No 1 0 Left-out No 1 0 Total Into Driveway 32 0 3% Total Out of Driveway 22 0 5% Total Driveway Volume 54 0 4% NA = Not Applicable

A-33
Site TX-16 – RIRO (Median and Driveway Constrained)
Source: Google Earth Figure A.16: Driveway Site TX-16 - Aerial and Site Photos
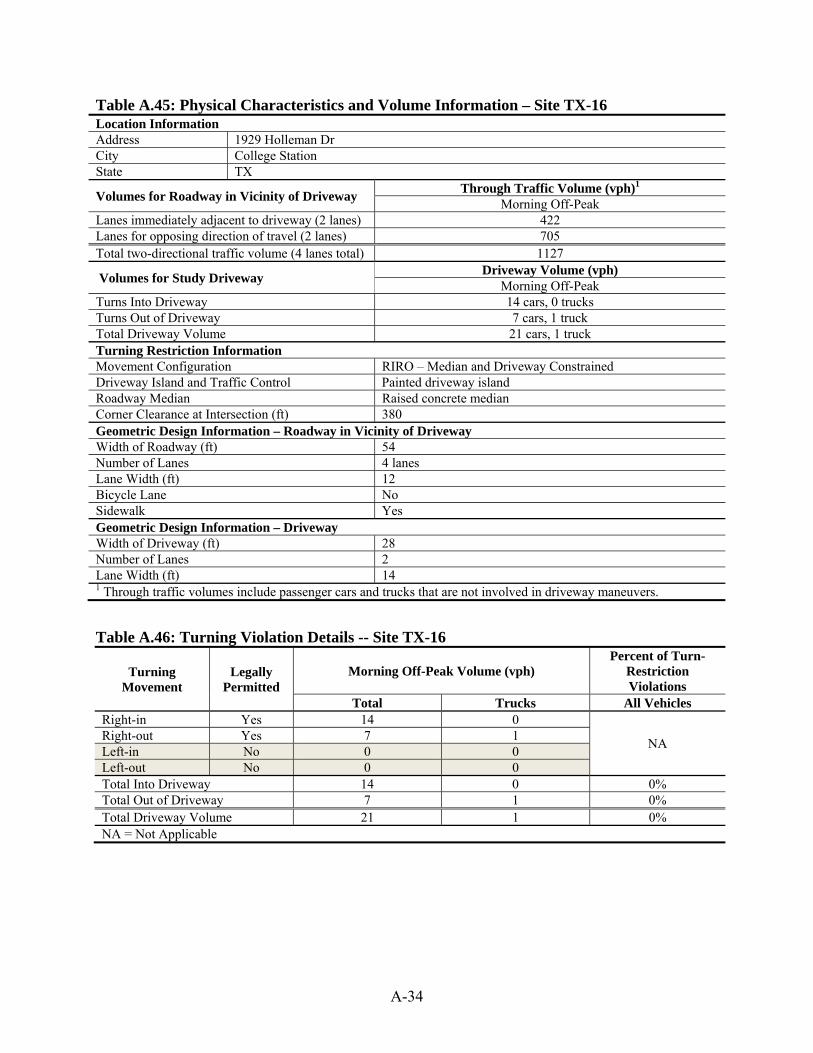
A-34
Table A.45: Physical Characteristics and Volume Information – Site TX-16 Location Information Address 1929 Holleman Dr City College Station State TX
Volumes for Roadway in Vicinity of Driveway Through Traffic Volume (vph)1
Morning Off-Peak Lanes immediately adjacent to driveway (2 lanes) 422 Lanes for opposing direction of travel (2 lanes) 705 Total two-directional traffic volume (4 lanes total) 1127
Volumes for Study Driveway Driveway Volume (vph)
Morning Off-Peak Turns Into Driveway 14 cars, 0 trucks Turns Out of Driveway 7 cars, 1 truck Total Driveway Volume 21 cars, 1 truck Turning Restriction Information Movement Configuration RIRO – Median and Driveway Constrained Driveway Island and Traffic Control Painted driveway island Roadway Median Raised concrete median Corner Clearance at Intersection (ft) 380 Geometric Design Information – Roadway in Vicinity of Driveway Width of Roadway (ft) 54 Number of Lanes 4 lanes Lane Width (ft) 12 Bicycle Lane No Sidewalk Yes Geometric Design Information – Driveway Width of Driveway (ft) 28 Number of Lanes 2 Lane Width (ft) 14 1 Through traffic volumes include passenger cars and trucks that are not involved in driveway maneuvers.
Table A.46: Turning Violation Details -- Site TX-16
Turning Movement
Legally Permitted
Morning Off-Peak Volume (vph) Percent of Turn-
Restriction Violations
Total Trucks All Vehicles Right-in Yes 14 0
NA Right-out Yes 7 1 Left-in No 0 0 Left-out No 0 0 Total Into Driveway 14 0 0% Total Out of Driveway 7 1 0% Total Driveway Volume 21 1 0% NA = Not Applicable

A-35
Site TX-17 – RIRO (Median and Driveway Constrained)
Source: Google Earth Figure A.17: Driveway Site TX-17 - Aerial and Site Photos

A-36
Table A.47: Physical Characteristics and Volume Information – Site TX-17 Location Information Address 3110 S Texas Ave City Bryan State TX
Volumes for Roadway in Vicinity of Driveway Through Traffic Volume (vph)1
Afternoon Peak Lanes immediately adjacent to driveway (2 lanes) 681 Lanes for opposing direction of travel (2 lanes) 803 Total two-directional traffic volume (4 lanes total) 1484
Volumes for Study Driveway Driveway Volume (vph)
Afternoon Peak Turns Into Driveway 11 cars, 0 trucks Turns Out of Driveway 20 cars, 0 trucks Total Driveway Volume 31 cars, 0 trucks Turning Restriction Information Movement Configuration RIRO – Constrained at median and driveway Driveway Island and Traffic Control Concrete driveway island Roadway Median Raised median with barricades Corner Clearance at Intersection (ft) 267 Geometric Design Information – Roadway in Vicinity of Driveway Width of Roadway (ft) 62 Number of Lanes 4 lanes + TWLTL Lane Width (ft) 12 Bicycle Lane No Sidewalk Yes Geometric Design Information – Driveway Width of Driveway (ft) 38 Number of Lanes 2 Lane Width (ft) 16 1 Through traffic volumes include passenger cars and trucks that are not involved in driveway maneuvers.
Table A.48: Turning Violation Details -- Site TX-17
Turning Movement
Legally Permitted
Afternoon Peak Volume (vph) Percent of Turn-
Restriction Violations
Total Trucks All Vehicles Right-in Yes 10 0
NA Right-out Yes 20 0 Left-in No 1 0 Left-out No 0 0 Total Into Driveway 11 0 9% Total Out of Driveway 20 0 0% Total Driveway Volume 31 0 3% NA = Not Applicable

A-37
Site TX-18 – RIRO (Driveway-Only Constrained)
Source: Google Earth Figure A.18: Driveway Site TX-18 - Aerial and Site Photos

A-38
Table A.49: Physical Characteristics and Volume Information – Site TX-18 Location Information Address 2210 Welsh Ave City College Station State TX
Volumes for Roadway in Vicinity of Driveway Through Traffic Volume (vph)1
Afternoon Peak Lanes immediately adjacent to driveway (2 lanes) 598 Lanes for opposing direction of travel (2 lanes) 809 Total two-directional traffic volume (4 lanes total) 1407
Volumes for Study Driveway Driveway Volume (vph)
Afternoon Peak Turns Into Driveway 32 cars, 0 trucks Turns Out of Driveway 25 cars, 1 truck Total Driveway Volume 57 cars, 1 truck Turning Restriction Information Movement Configuration RIRO – Driveway-Only Constrained Driveway Island and Traffic Control Concrete driveway island Roadway Median Painted median – Double yellow line Corner Clearance at Intersection (ft) 230 Geometric Design Information – Roadway in Vicinity of Driveway Width of Roadway (ft) 47-56 Number of Lanes 2 lanes – 5 lanes (transitions but 4 lanes immediately adjacent) Lane Width (ft) 12 - 10 Bicycle Lane No Sidewalk Yes Geometric Design Information – Driveway Width of Driveway (ft) 40 Number of Lanes 2 Lane Width (ft) 12 1 Through traffic volumes include passenger cars and trucks that are not involved in driveway maneuvers.
Table A.50: Turning Violation Details -- Site TX-18
Turning Movement
Legally Permitted
Afternoon Peak Volume (vph) Percent of Turn-
Restriction Violations
Total Trucks All Vehicles Right-in Yes 20 0
NA Right-out Yes 23 1 Left-in No 12 0 Left-out No 2 0 Total Into Driveway 32 0 38% Total Out of Driveway 25 1 8% Total Driveway Volume 57 1 24% NA = Not Applicable

A-39
Site TX-19 – RIRO (Median and Driveway Constrained)
Source: Google Earth Figure A.19: Driveway Site TX-19 - Aerial and Site Photos

A-40
Table A.51: Physical Characteristics and Volume Information – Site TX-19 Location Information Address 671 E Villa Maria Rd City Bryan State TX
Volumes for Roadway in Vicinity of Driveway Through Traffic Volume (vph)1
Afternoon Peak Lanes immediately adjacent to driveway (2 lanes) 727 Lanes for opposing direction of travel (2 lanes) 696 Total two-directional traffic volume (4 lanes total) 1423
Volumes for Study Driveway Driveway Volume (vph)
Afternoon Peak Turns Into Driveway 108 cars, 0 trucks Turns Out of Driveway 32 cars, 1 truck Total Driveway Volume 140 cars, 1 truck Turning Restriction Information Movement Configuration RIRO – Constrained at Median and Driveway Driveway Island and Traffic Control Concrete driveway island, No-Left-Turn sign Roadway Median Raised median with barricades Corner Clearance at Intersection (ft) 383 Geometric Design Information – Roadway in Vicinity of Driveway Width of Roadway (ft) 61 Number of Lanes 4 lanes + TWLTL Lane Width (ft) 12 Bicycle Lane No Sidewalk Yes Geometric Design Information – Driveway Width of Driveway (ft) 36 Number of Lanes 2 Lane Width (ft) 13 1 Through traffic volumes include passenger cars and trucks that are not involved in driveway maneuvers.
Table A.52: Turning Violation Details -- Site TX-19
Turning Movement
Legally Permitted
Afternoon Peak Volume (vph) Percent of Turn-
Restriction Violations
Total Trucks All Vehicles Right-in Yes 107 0
NA Right-out Yes 31 1 Left-in No 1 0 Left-out No 1 0 Total Into Driveway 108 0 1% Total Out of Driveway 32 1 3% Total Driveway Volume 140 1 1.5% NA = Not Applicable

A-41
Site TX-20 – RIRO (Driveway-Only Constrained)
Source: Google Earth Figure A.20: Driveway Site TX-20 - Aerial and Site Photos

A-42
Table A.53: Physical Characteristics and Volume Information – Site TX-20 Location Information Address 1727 William D. Fitch Pkwy City College Station State TX
Volumes for Roadway in Vicinity of Driveway Through Traffic Volume (vph)1
Afternoon Peak Lanes immediately adjacent to driveway (2 lanes) 424 Lanes for opposing direction of travel (2 lanes) 430 Total two-directional traffic volume (4 lanes total) 854
Volumes for Study Driveway Driveway Volume (vph)
Afternoon Peak Turns Into Driveway 143 cars, 1 truck Turns Out of Driveway 158 cars, 1 truck Total Driveway Volume 301 cars, 2 trucks Turning Restriction Information Movement Configuration RIRO – Driveway-only Constrained Driveway Island and Traffic Control Painted island with a No-Left-Turn sign Roadway Median Marked median Corner Clearance at Intersection (ft) 703 Geometric Design Information – Roadway in Vicinity of Driveway Width of Roadway (ft) 63 - 77 Number of Lanes 4 lanes Lane Width (ft) 12 Bicycle Lane No Sidewalk No Geometric Design Information – Driveway Width of Driveway (ft) 33 Number of Lanes 2 Lane Width (ft) 24 1 Through traffic volumes include passenger cars and trucks that are not involved in driveway maneuvers.
Table A.54: Turning Violation Details -- Site TX-20
Turning Movement
Legally Permitted
Afternoon Peak Volume (vph) Percent of Turn-
Restriction Violations
Total Trucks All Vehicles Right-in Yes 141 1
NA Right-out Yes 154 1 Left-in No 2 0 Left-out No 4 0 Total Into Driveway 143 1 1.5% Total Out of Driveway 158 1 2.5% Total Driveway Volume 301 2 2% NA = Not Applicable

A-43
CORSIM Analysis Summary Results
The CORSIM analysis included scenarios with no access points, 20 access points per mile and 40 access points per mile. The traffic volume ranges were from lower volume values up to higher volumes. When the volumes exceed stable conditions and the simulated corridors began to experience congestion, this spillback scenario defined the upper limits. To capture the expected randomness of traffic conditions, a variety of random seed numbers were used to simulate vehicle behavior and each configuration included ten simulation runs.
Four-lane Simulation Summary Tables
The following summary results represent the various tested access density, access turn restriction, land use demand, and volume thresholds. The four-lane speed summaries are presented in Table A.55 and Table A.57. The companion four-lane travel time summaries are shown in Table A.56 and Table A.58.
Table A.55: Light to Moderate Land Use at 4-Lane Road -- Speed (mph) Summary Test
Scenario Description
1500 vph
2000 vph
2500 vph
3000 vph
3500 vph
4000 vph
4500 vph
5000 vph
No Access Points
31 30 29 29 28 27 26 24
20 Access Points per Mile
All 28 27 26 25 24 22 19 18
RIROLI 28 27 26 25 24 22 20 18
RIROLO 29 28 28 27 26 26 24 23
RIRO 29 28 28 27 26 26 25 23
40 Access Points per Mile
All 26 26 25 24 22 20 19 18
RIROLI 26 26 25 24 22 21 19 18
RIROLO 28 27 27 27 26 25 24 23
RIRO 27 27 27 27 26 26 25 23

A-44
Table A.56: Light to Moderate Land Use at 4-Lane Road -- Travel Time (sec.) Summary Test Scenario Description
1500 vph
2000 vph
2500 vph
3000 vph
3500 vph
4000 vph
4500 vph
5000 vph
No Access Points
6.5 7.4 8.3 9.1 10.0 11.0 12.6 15.7
20 Access Points per Mile
All 9.7 10.9 12.3 13.9 16.2 19.8 24.5 27.7
RIROLI 9.8 10.9 12.3 13.8 15.9 19.4 24.0 27.3
RIROLO 8.7 9.3 10.1 11.0 11.8 12.8 14.5 17.1
RIRO 8.6 9.4 10.1 11.0 11.8 12.7 14.4 17.4
40 Access Points per Mile
All 11.6 12.5 13.9 15.6 18.5 22.2 26.5 28.1
RIROLI 11.6 12.5 13.7 15.6 18.3 22.1 26.1 28.1
RIROLO 9.8 10.2 10.7 11.3 12.2 13.1 14.8 17.0
RIRO 9.7 10.1 10.6 11.3 11.9 12.9 14.5 16.8
Table A.57: Heavy Land Use at 4-Lane Road -- Speed (mph) Summary Test Scenario Description
1500 vph
2000 vph
2500 vph
3000 vph
3500 vph
4000 vph
4500 vph
5000 vph
No Access Points
31 30 29 29 28 27 26 24
20 Access Points per Mile
All 27 26 25 24 23 21 19 18
RIROLI 27 26 25 24 22 20 19 17
RIROLO 28 28 28 27 26 26 25 23
RIRO 29 28 27 27 26 25 24 23
40 Access Points per Mile
All 26 25 25 24 22 21 19 18
RIROLI 26 25 25 24 22 21 19 18
RIROLO 27 28 27 27 27 26 25 24
RIRO 27 27 27 27 27 26 25 24

A-45
Table A.58: Heavy Land Use at 4-Lane Road -- Travel Time (sec.) Summary Test Scenario Description
1500 vph
2000 vph
2500 vph
3000 vph
3500 vph
4000 vph
4500 vph
5000 vph
No Access Points
6.5 7.4 8.3 9.1 10.0 11.0 12.6 15.7
20 Access Points per Mile
All 11.1 12.3 13.8 15.4 18.1 21.9 25.7 30.0
RIROLI 11.1 12.4 14.1 15.7 18.8 22.8 26.9 31.2
RIROLO 9.2 9.7 10.5 11.2 12.1 13.0 14.5 17.1
RIRO 9.2 9.8 10.6 11.5 12.3 13.4 15.0 17.7
40 Access Points per Mile
All 13.3 14.1 15.3 16.8 19.2 22.3 27.4 28.9
RIROLI 13.2 14.0 15.3 16.7 19.1 22.1 25.4 28.6
RIROLO 10.4 10.5 11.0 11.5 12.1 12.8 14.0 15.7
RIRO 10.4 10.5 10.9 11.3 12.0 12.7 13.8 15.5
Five-lane Simulation Summary Tables
The five-lane speed summaries are presented in Table A.59 and Table A.61. The companion five-lane travel time summaries are shown in Table A.60 and Table A.62.
Table A.59: Light to Moderate Land Use at 5-Lane Road -- Speed (mph) Summary Test Scenario Description
2000 vph
2500 vph
3000 vph
3500 vph
4000 vph
4500 vph
5000 vph
5500 vph
6000 vph
No Access Points
29 28 27 27 26 24 24 24 24
20 Access Points per Mile All 27 26 25 24 22 21 19 19 19
RIROLI 27 26 25 24 23 21 19 19 19
40 Access Points per Mile All 26 25 24 23 21 19 18 19 19
RIROLI 26 25 24 23 21 20 18 19 19

A-46
Table A.60: Light to Moderate Land Use at 5-Lane Road -- Travel Time (sec.) Summary Test
Scenario Description
2000 vph
2500 vph
3000 vph
3500 vph
4000 vph
4500 vph
5000 vph
5500 vph
6000 vph
No Access Points
8.3 9.4 10.5 11.3 12.6 14.9 15.3 15.2 15.2
20 Access Points per Mile All 10.6 12.0 13.3 15.1 18.2 21.8 25.4 24.7 24.8
RIROLI 10.5 11.8 13.2 15.0 18.0 21.7 25.3 25.1 24.7
40 Access Points per Mile All 12.2 13.5 15.2 17.5 21.0 24.8 27.1 26.8 26.7
RIROLI 12.2 13.6 15.1 17.4 20.6 24.4 27.0 26.8 26.6
Table A.61: Heavy Land Use at 5-Lane Road -- Speed (mph) Summary Test
Scenario Description
2000 vph
2500 vph
3000 vph
3500 vph
4000 vph
4500 vph
5000 vph
5500 vph
6000 vph
No Access Points
29 28 27 27 26 24 24 24 24
20 Access Points per Mile
All 26 25 24 22 20 19 18 18 19
RIROLI 26 25 24 22 20 19 19 19 18
40 Access Points per Mile
All 25 24 23 22 20 19 18 18 18
RIROLI 25 24 23 22 20 19 18 18 18
Table A.62: Heavy Land Use at 5-Lane Road -- Travel Time (sec.) Summary Test
Scenario Description
2000 vph
2500 vph
3000 vph
3500 vph
4000 vph
4500 vph
5000 vph
5500 vph
6000 vph
No Access Points
8.3 9.4 10.5 11.3 12.6 14.9 15.3 15.2 15.2
20 Access Points per Mile
All 12.7 14.4 16.4 19.4 23.4 27.2 28.1 27.7 27.5
RIROLI 12.6 14.3 16.3 19.2 23.1 27.1 27.6 27.6 27.9
40 Access Points per Mile
All 14.5 15.9 17.9 20.6 23.9 27.5 28.3 28.5 28.6
RIROLI 14.5 15.9 17.8 20.6 23.9 27.3 28.2 28.3 28.4

A-47
Six-lane Simulation Summary Tables
The six-lane speed summaries are presented in Table A.63 and Table A.65. The companion five-lane travel time summaries are shown in Table A.64 and Table A.66.
Table A.63: Light to Moderate Land Use at 6-Lane Road -- Speed (mph) Summary Test
Scenario Description
4000 vph
4500 vph
5000 vph
5500 vph
6000 vph
6500 vph
No Access Points
29 27 27 27 27 26
20 Access Points per Mile
All 25 24 23 22 20 19
RIROLI 25 24 23 22 20 19
RIROLO 28 27 27 26 26 25
RIRO 28 27 27 26 26 25
40 Access Points per Mile
All 24 23 22 21 19 18
RIROLI 24 23 22 21 19 18
RIROLO 28 27 27 26 26 25
RIRO 28 27 27 26 26 25
Table A.64: Light to Moderate Land Use at 6-Lane Road -- Travel Time (sec.) Summary Test
Scenario Description
4000 vph
4500 vph
5000 vph
5500 vph
6000 vph
6500 vph
No Access Points
9.0 9.6 10.1 10.8 11.5 12.7
20 Access Points per Mile
All 13.3 14.9 16.8 19.1 22.4 26.0
RIROLI 13.3 14.9 16.7 19.0 22.3 25.9
RIROLO 10.0 10.8 11.2 12.1 13.0 14.2
RIRO 10.1 10.8 11.3 12.1 13.0 14.2
40 Access Points per Mile
All 14.9 16.5 18.7 21.4 24.7 28.4
RIROLI 15.0 16.8 18.8 21.6 24.8 28.6
RIROLO 10.2 10.7 11.2 11.8 12.7 13.7
RIRO 10.2 10.7 11.2 11.9 12.6 13.6
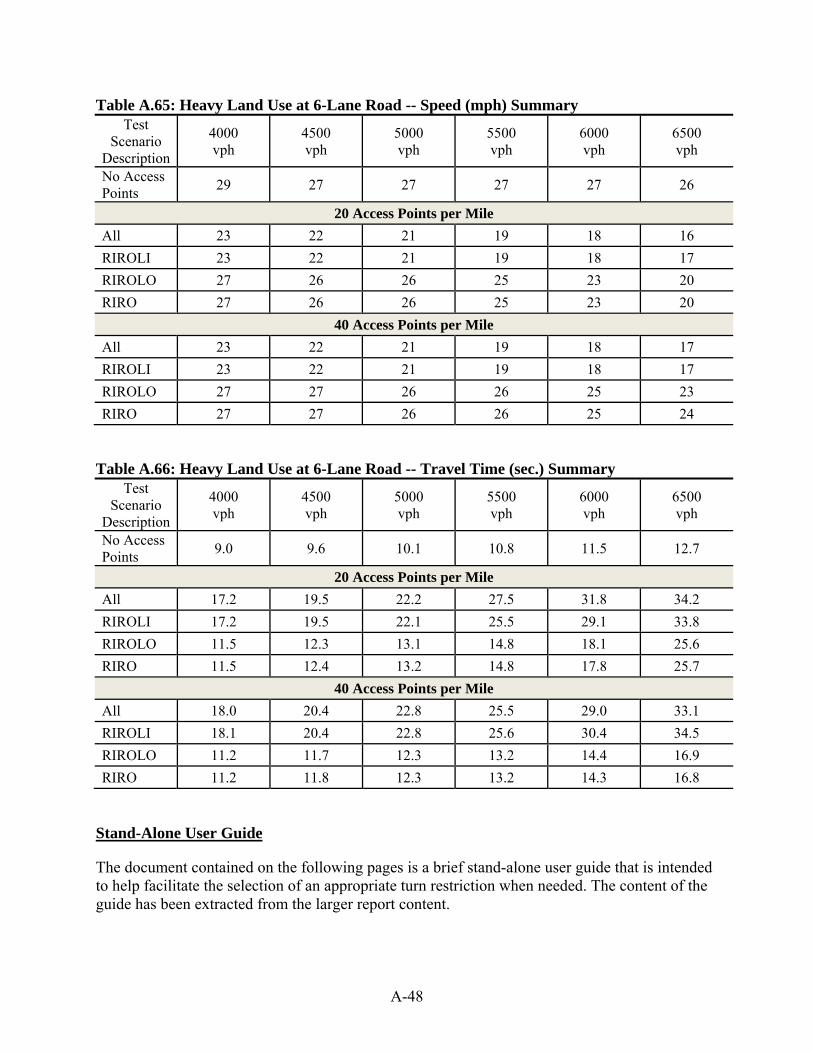
A-48
Table A.65: Heavy Land Use at 6-Lane Road -- Speed (mph) Summary Test
Scenario Description
4000 vph
4500 vph
5000 vph
5500 vph
6000 vph
6500 vph
No Access Points
29 27 27 27 27 26
20 Access Points per Mile
All 23 22 21 19 18 16
RIROLI 23 22 21 19 18 17
RIROLO 27 26 26 25 23 20
RIRO 27 26 26 25 23 20
40 Access Points per Mile
All 23 22 21 19 18 17
RIROLI 23 22 21 19 18 17
RIROLO 27 27 26 26 25 23
RIRO 27 27 26 26 25 24
Table A.66: Heavy Land Use at 6-Lane Road -- Travel Time (sec.) Summary Test
Scenario Description
4000 vph
4500 vph
5000 vph
5500 vph
6000 vph
6500 vph
No Access Points
9.0 9.6 10.1 10.8 11.5 12.7
20 Access Points per Mile
All 17.2 19.5 22.2 27.5 31.8 34.2
RIROLI 17.2 19.5 22.1 25.5 29.1 33.8
RIROLO 11.5 12.3 13.1 14.8 18.1 25.6
RIRO 11.5 12.4 13.2 14.8 17.8 25.7
40 Access Points per Mile
All 18.0 20.4 22.8 25.5 29.0 33.1
RIROLI 18.1 20.4 22.8 25.6 30.4 34.5
RIROLO 11.2 11.7 12.3 13.2 14.4 16.9
RIRO 11.2 11.8 12.3 13.2 14.3 16.8
Stand-Alone User Guide
The document contained on the following pages is a brief stand-alone user guide that is intended to help facilitate the selection of an appropriate turn restriction when needed. The content of the guide has been extracted from the larger report content.

A-49