effective marginal tax rates for low- and moderate-income workers
TRANSCRIPT

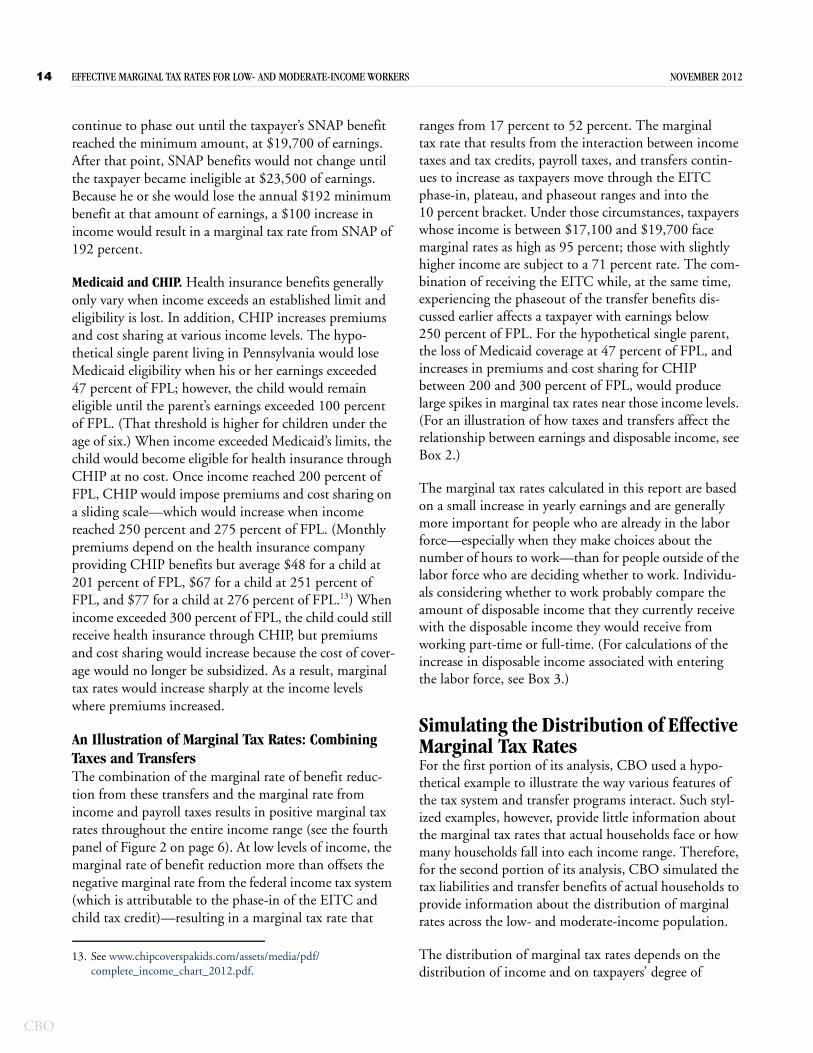
Share of Returns Filed by Low- and Moderate-Income Workers, by Marginal Tax Rate, Under 2012 Law
Percentage of Tax Returns
50
30
10
40
20
0
Below 0 0–9 10–19 20–29 30–39 40–49 50–59 60–69 70–79 80 or Above
Marginal Tax Rate (Percent)
Effects of Federal Income Taxes Only
Combined Effects of Federal and State Income Taxes, Federal Payroll Taxes, and Benefits from the Supplemental Nutrition Assistance Program
CONGRESS OF THE UNITED STATESCONGRESSIONAL BUDGET OFFICE
CBOEffective Marginal
Tax Rates for Low- and
Moderate-Income Workers
NOVEMBER 2012

CBO
Notes
Unless otherwise specified, all years referred to in this report are calendar years.
Numbers in the text and tables may not add up to totals because of rounding.
Pub. No. 4149

Contents
Summary iv
Introduction 1
Tax Credits and Transfers 1
Effective Marginal Tax Rates and Labor Market Decisions 2
Policy Implications 3
CBO’s Analytical Approaches 3
Factors That Contribute to Marginal Tax Rates: A Hypothetical Example 3
Federal Individual Income Taxes and Tax Credits 4
Federal Payroll Taxes 8
State Individual Income Taxes 8
Means-Tested Transfer Programs 9
BOX: ESTIMATED PROGRAM PARTICIPATION RATES USING SURVEY DATA 12
An Illustration of Marginal Tax Rates: Combining Taxes and Transfers 14
Simulating the Distribution of Effective Marginal Tax Rates 14
BOX: INCOME AFTER TAXES AND TRANSFERS 15
BOX: EFFECTIVE MARGINAL TAX RATES ASSOCIATED WITH LABOR FORCE ENTRY IN 2012 16
Effective Marginal Tax Rates Under 2012 Law 19
Overall Distribution 19
Distribution by Earnings Group 21
Distribution by Family Type 22
Effective Marginal Tax Rates Under 2013 and 2014 Law 23
Example of Effective Marginal Tax Rates in 2013 23
Example of Effective Marginal Tax Rates in 2014 27
Overall Distribution 27
Appendix A: Tax Provisions and Benefit Programs Affecting Effective Marginal Tax Rates 33
Appendix B: Distribution of Marginal Tax Rates by Earnings 39
List of Tables and Figures 43
About This Document 45
CBO


Summary
The effective marginal tax rate is the percentage of an additional dollar of earnings that is unavailable to a worker because it is paid in taxes or offset by reductions in benefits from government programs. In part, such rates are determined by income and payroll tax rates and other features of the tax system, such as tax credits and deductions, that depend on earnings. However, effective marginal tax rates are also determined by programs pro-viding cash and in-kind benefits, referred to as transfers, that target assistance to people of reduced means. When lawmakers target assistance to people of limited means, that assistance declines as income rises. Because increases in earnings for low- and moderate-income workers can cause relatively large reductions in such assistance, this analysis of effective marginal tax rates (hereafter referred to as marginal tax rates) focuses on those workers.
The Congressional Budget Office (CBO) finds that working taxpayers with income below 450 percent of federal poverty guidelines (commonly known as the fed-eral poverty level, so abbreviated as FPL) face a marginal tax rate of 30 percent, on average, under the provisions of law in effect in 2012. That estimate takes into account federal and state individual income taxes, federal payroll taxes, and the reductions in benefits from the Supplemental Nutrition Assistance Program (SNAP, formerly known as the Food Stamp program) that occur when earnings increase. (Poverty guidelines vary by household size; in 2012, the guideline for a household of four is $23,050.) Over the next two years, CBO estimates, various provisions of current law will cause marginal tax rates among this population to rise, on aver-age, to 32 percent in 2013 and to 35 percent in 2014. CBO also finds that under provisions of law in effect between 2012 and 2014, marginal tax rates vary greatly across earnings ranges and among individuals within the same earnings range.
The increase in marginal tax rates that results from income and payroll taxes and from the phaseout of such means-tested transfers affects people’s decisions about work. In particular, when marginal tax rates are high, individuals tend to respond to the smaller financial gain from working by cutting the number of hours they work or by otherwise altering their participation in the workforce.
Illustration of Changes in Taxes and Transfers as Earnings IncreaseBecause refundable tax credits and transfers increase the resources available to taxpayers, disposable income (that is, income after accounting for taxes and transfers) gener-ally exceeds earnings from employment for low-income families. To illustrate the relationship between disposable income and earnings, CBO examined the disposable income of a hypothetical family—consisting of a single parent and one child—at different levels of potential earnings (see Summary Figure 1). CBO assumed that, when eligible on the basis of earnings, the family would receive transfers from Temporary Assistance for Needy Families, the Housing Choice Voucher Program, SNAP, and either Medicaid or the Children’s Health Insurance Program (CHIP). CBO also assumed that the family would have no other forms of income. In this illustration, disposable income grows more slowly than earnings because marginal tax rates are positive.
The marginal tax rates in CBO’s illustration vary greatly as earnings increase. In some situations, marginal tax rates peak at high levels, but those high levels typically occur over relatively narrow spans of earnings before falling sub-stantially. In addition, when a taxpayer’s income rises above the eligibility limits set for Medicaid or CHIP, the loss of health insurance benefits sharply increases marginal tax rates.
CBO

V EFFECTIVE MARGINAL TAX RATES FOR LOW- AND MODERATE-INCOME WORKERS NOVEMBER 2012
CBO
Summary Figure 1.
Disposable Income for a Hypothetical Single Parent with One Child, by Earnings, in 2012(Disposable income in dollars) (Percentage of FPL)
Source: Congressional Budget Office.
Notes: Disposable income is that which remains after accounting for taxes and transfers. The taxes considered in this illustration are federal and state individual income taxes and federal payroll taxes. The transfer programs considered in this illustration are TANF, Medicaid, SNAP, CHIP, and the Housing Choice Voucher Program.
In 2012, the federal poverty guideline (abbreviated as FPL) for a household of two is $15,130.
TANF = Temporary Assistance for Needy Families; SNAP = Supplemental Nutrition Assistance Program (formerly known as the Food Stamp program); CHIP = Children’s Health Insurance Program.
0
10,000
20,000
30,000
40,000
50,000
60,000
0
50
100
150
200
250
300
350
400
450
Earnings (Dollars)
10,000 20,000 30,000 40,000 50,000 60,000
TANF:Income
Limit
Medicaid:
Income Limitfor Parent
CHIP:Income
Limit forFree
Coverage
CHIP: Income Limit for
Reduced-Cost Coverage
0 50 100 150 200 250 300 350 400 450
Disposable Income
Earnings
Distribution of Marginal Tax RatesMarginal tax rates depend on taxpayers’ financial characteristics (such as income), their nonfinancial char-acteristics (such as the presence of children in the family), and whether they participate in means-tested programs. Survey data show that the majority of lower-income fam-ilies do not receive means-tested transfers, either because they do not meet additional, nonfinancial eligibility requirements or because they are eligible but do not apply for benefits. Of those who receive transfers, the majority participate in only one program.
To examine the distribution of marginal tax rates across households, CBO simulated tax liabilities and SNAP benefits using a sample of tax returns from 2006 supple-mented with information from household surveys. The sample was restricted to nondisabled, working-age tax filers with earnings, and tax liability was simulated on the basis of the provisions of law in effect in 2012 and those
scheduled to go into effect in 2013 and 2014. To capture the interaction of tax provisions and SNAP benefits, the analysis focused on taxpayers whose income was below 450 percent of FPL. Benefits from SNAP were included in the analysis because it is a widely used program with cash-like benefits that can be calculated using informa-tion from household surveys; including additional programs would generally increase estimates of marginal tax rates.
Marginal Tax Rates Under 2012 LawSome provisions of taxes and transfers, such as statutory income tax rates and federal payroll taxes, affect most workers. (Statutory income tax rates are specified in law and apply to the last dollar of earnings.) Other provisions, such as reductions in tax credits and SNAP benefits, affect fewer people but result in relatively high marginal tax rates for those affected.

SUMMARY EFFECTIVE MARGINAL TAX RATES FOR LOW- AND MODERATE-INCOME WORKERS VI
Summary Table 1.
Contributions of Tax Provisions and SNAP Benefits to the Marginal Tax Rates of Low- and Moderate-Income Workers Under Provisions of Law in Effect in 2012, 2013, and 2014(Percentage points)
Source: Congressional Budget Office based on a public-use sample of tax returns from the Internal Revenue Service and survey data from the Census Bureau.
Notes: CBO’s simulations of tax liabilities and SNAP benefits were based on information from a public-use sample of income tax returns filed in 2006 supplemented with information from the 2007 Annual Social and Economic Supplement of the Current Population Survey and the 2006 American Community Survey. The sample was restricted to taxpayers under the age of 65 who were not disabled, who had earnings in 2006, and whose adjusted gross income was below 450 percent of FPL. It was weighted to be representative of the population of taxpayers.
The simulated marginal tax rates were based on taxpayers’ total compensation before their employers’ share of payroll taxes was deducted.
CBO assumes that states expand Medicaid in 2014 as originally specified in the Affordable Care Act (ACA). The ACA comprises the Patient Protection and Affordable Care Act (Public Law 111-148) and the health care provisions of the Health Care and Education Reconciliation Act of 2010 (P.L. 111-152).
SNAP = Supplemental Nutrition Assistance Program (formerly known as the Food Stamp program); FPL = federal poverty guidelines.
a. Accounts for the deductibility of state income taxes on federal income tax returns for people who itemize and, in 2014, cost-sharing subsidies implemented in the ACA.
10.8 11.7 13.412.1 13.7 13.8
2.6 2.6 2.64.6 4.5 4.2
-0.2 -0.2 0.8
30.0 32.4 34.8
Federal Individual Income Taxes2012 2013 2014
Federal Payroll TaxesState Individual Income TaxesSNAP Benefits
Among Tax Provisionsa
Average Marginal Tax Rate (Percent)
Cost-Sharing Subsidies and Interactions
Federal Individual Income Taxes. Under the federal income tax system, workers with income below 450 percent of FPL face, on average, a marginal tax rate of 11 percent.
Federal Payroll and State Individual Income Taxes. For most low- and moderate-income workers, payroll taxes cause marginal rates to rise by about 12 percent-age points. State income taxes contribute a modest amount to marginal rates, on average.
Reduction of SNAP Benefits. For recipients, the reduc-tion in benefits that occurs as income rises adds an average of 25 percentage points to their marginal tax rates. However, CBO estimates that under 2012 law, only about 18 percent of taxpayers in the sample receive SNAP benefits. As a result, SNAP increases marginal tax rates for the group as a whole by only 5 percentage points.
The combined effect of federal and state individual income taxes, federal payroll taxes, and the reduction of SNAP benefits results in an average marginal tax rate of 30 percent among working taxpayers with income below 450 percent of FPL (see Summary Table 1). Among tax-payers in this sample, about one-fifth face marginal rates below 20 percent and about half face rates of 30 percent or higher.
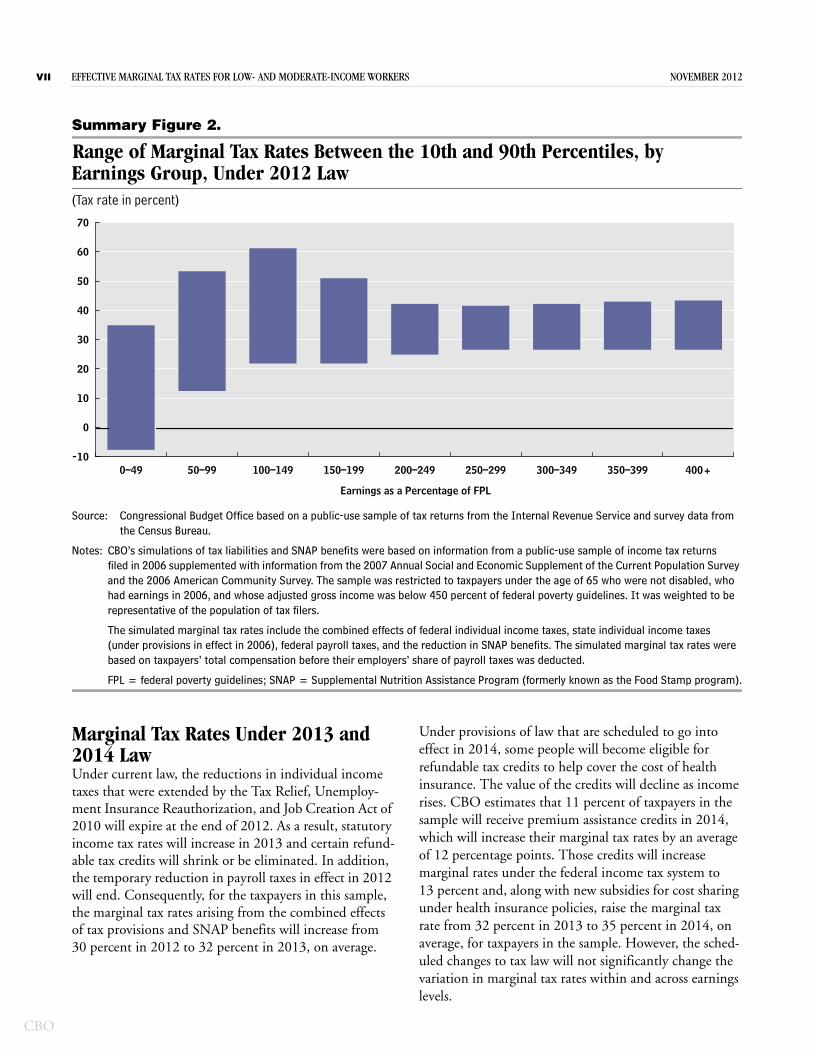
Marginal tax rates vary across earnings levels, with the differences driven largely by provisions in the federal income tax system, particularly the earned income tax credit. Marginal tax rates also vary substantially for tax-payers with comparable earnings because of many other factors, such as their marital status or the presence of chil-dren. For taxpayers with earnings below 50 percent of FPL in 2012, 43 percentage points separate the 10th per-centile and 90th percentile of marginal tax rates (see Summary Figure 2).
CBO
VII EFFECTIVE MARGINAL TAX RATES FOR LOW- AND MODERATE-INCOME WORKERS NOVEMBER 2012
CBO
Summary Figure 2.
Range of Marginal Tax Rates Between the 10th and 90th Percentiles, by Earnings Group, Under 2012 Law(Tax rate in percent)
Source: Congressional Budget Office based on a public-use sample of tax returns from the Internal Revenue Service and survey data from the Census Bureau.
Notes: CBO’s simulations of tax liabilities and SNAP benefits were based on information from a public-use sample of income tax returns filed in 2006 supplemented with information from the 2007 Annual Social and Economic Supplement of the Current Population Survey and the 2006 American Community Survey. The sample was restricted to taxpayers under the age of 65 who were not disabled, who had earnings in 2006, and whose adjusted gross income was below 450 percent of federal poverty guidelines. It was weighted to be representative of the population of tax filers.
The simulated marginal tax rates include the combined effects of federal individual income taxes, state individual income taxes (under provisions in effect in 2006), federal payroll taxes, and the reduction in SNAP benefits. The simulated marginal tax rates were based on taxpayers’ total compensation before their employers’ share of payroll taxes was deducted.
FPL = federal poverty guidelines; SNAP = Supplemental Nutrition Assistance Program (formerly known as the Food Stamp program).
0–49 50–99 100–149 150–199 200–249 250–299 300–349 350–399 400+-10
0
10
20
30
40
50
60
70
Earnings as a Percentage of FPL
Marginal Tax Rates Under 2013 and 2014 LawUnder current law, the reductions in individual income taxes that were extended by the Tax Relief, Unemploy-ment Insurance Reauthorization, and Job Creation Act of 2010 will expire at the end of 2012. As a result, statutory income tax rates will increase in 2013 and certain refund-able tax credits will shrink or be eliminated. In addition, the temporary reduction in payroll taxes in effect in 2012 will end. Consequently, for the taxpayers in this sample, the marginal tax rates arising from the combined effects of tax provisions and SNAP benefits will increase from 30 percent in 2012 to 32 percent in 2013, on average.
Under provisions of law that are scheduled to go into effect in 2014, some people will become eligible for refundable tax credits to help cover the cost of health insurance. The value of the credits will decline as income rises. CBO estimates that 11 percent of taxpayers in the sample will receive premium assistance credits in 2014, which will increase their marginal tax rates by an average of 12 percentage points. Those credits will increase marginal rates under the federal income tax system to 13 percent and, along with new subsidies for cost sharing under health insurance policies, raise the marginal tax rate from 32 percent in 2013 to 35 percent in 2014, on average, for taxpayers in the sample. However, the sched-uled changes to tax law will not significantly change the variation in marginal tax rates within and across earnings levels.

Effective Marginal Tax Rates for Low- and Moderate-Income Workers
IntroductionUnder the current system of taxes and government bene-fit programs, as workers’ earnings increase, the amount of taxes they owe typically rises and the amount of cash and other benefits they receive typically falls. The combina-tion of increased taxes on earnings and reduced benefits determines effective marginal tax rates—specifically, the portion of an additional dollar of earnings that is paid in taxes or that is offset by a reduction in benefits. Those effective marginal tax rates affect people’s incentives to work. In particular, and all else being equal, people tend to work fewer hours when effective marginal tax rates are high. Such behavioral responses, in turn, affect the overall supply of labor in the economy.
In this report, the Congressional Budget Office (CBO) explores the numerous factors that contribute to effective marginal tax rates (hereafter referred to as marginal tax rates). The agency simulates the distribution of marginal tax rates among low- and moderate-income workers—a group for whom changes in earnings can cause relatively large changes in assistance provided through the tax system and government programs. The analysis covers marginal tax rates under provisions of law in effect in 2012 as well as marginal tax rates that incorporate provi-sions of current law that are scheduled to go into effect in 2013 and 2014.
Tax Credits and TransfersFactors within both the tax system and the transfer sys-tem affect marginal tax rates. Because the receipt of various types of assistance depends on many different considerations, individuals with similar income can have very different marginal tax rates.
Statutory individual income and payroll tax rates (the rates specified in law that apply to the last dollar of earn-ings) initially determine the portion of additional income that workers owe in income and payroll taxes, but other features of the tax system alter those portions. In particu-lar, assistance provided to low- and moderate-income workers through refundable tax credits, especially the earned income tax credit (EITC) and the child tax credit, also contribute to marginal tax rates because the amount of those credits depends on recipients’ income. These tax credits offset other tax liability, and eligible individuals receive money back from the government if the value of the credit is greater than the amount of other tax they owe.
Likewise, assistance provided to low- and moderate-income families through transfer programs such as the Supplemental Nutrition Assistance Program (SNAP, formerly known as the Food Stamp program), which provides benefits for purchasing food, and Temporary Assistance to Needy Families (TANF), which provides cash and in-kind assistance such as child care, also contributes to marginal tax rates. To ensure that such assistance targets individuals and families of low and moderate income, transfer benefits are usually means-tested—they phase out as income approaches a certain threshold or cease entirely once that threshold is reached. The rate at which benefits are reduced—the marginal rate of benefit reduction—is an implicit tax on income that adds to the marginal tax rate. Programs that cut off assis-tance when income exceeds a threshold produce a spike in marginal tax rates at income levels near the threshold when the loss in benefits is large relative to the increment of income.
Receipt of assistance is determined by eligibility for trans-fer programs and by participation in them. Eligibility
CBO

2 EFFECTIVE MARGINAL TAX RATES FOR LOW- AND MODERATE-INCOME WORKERS NOVEMBER 2012
CBO
depends on financial characteristics (such as income and assets) as well as nonfinancial characteristics (such as the presence of children in the family). Specifically, transfer programs vary in the way they account for income from different sources, the way they set the maximum amount of income a household can have and still be eligible, and the level of income at which benefits are no longer avail-able. Participation depends on the amounts involved, the complexity of the application process, and other factors.
Effective Marginal Tax Rates and Labor Market DecisionsA person’s marginal tax rate influences many different decisions about working: whether to increase or decrease the number of hours worked, bargain for wages or non-taxable fringe benefits, get or quit a second job, or enter or leave the labor force. For people who are already working, an increase in marginal tax rates on additional earnings lowers the financial gain from working addi-tional hours, which in turn has two effects:
Hours worked tend to fall from their initial level because other uses of time become relatively more attractive; and
Hours worked tend to increase from their initial level because the amount of additional disposable income (income after accounting for taxes and transfers) available to reach consumption and saving goals is lower.
Because those two effects work in opposite directions, the net effect depends on which one dominates.
On balance, in CBO’s judgment, increases in marginal tax rates on earnings tend to decrease the supply of labor by inducing people already in the workforce to put in fewer hours or to be less productive.1 The responsiveness of labor supply to tax changes varies across groups. On average, working-age men are not very responsive to changes in marginal tax rates. Married women, who tended in the past to be the lower earner in the house-hold, typically decreased their hours of work—on average—when marginal tax rates rose. In recent decades,
1. See Congressional Budget Office, How the Supply of Labor Responds to Changes in Fiscal Policy, Background Paper (October 2012); and Robert McClelland and Shannon Mok, A Review of Recent Research on Labor Supply Elasticities, Congressional Budget Office Working Paper 2012-12 (October 2012).
their decisions about decreasing or increasing the number of hours worked have become more similar to those made by men.2
Marginal tax rates that result from a relatively large increase in income are relevant to the decision to enter the workforce. For instance, because the earned income tax credit increases disposable income for all eligible workers, the ability to qualify for the credit makes work more appealing. Studies have found that expansions of the EITC between 1986 and 1996 significantly increased the movement of single mothers into the workforce but had little effect on the number of hours they worked.3
If taxpayers misperceive their marginal tax rate, however, changes in their actual marginal tax rate may not have much effect on their decisions about how much to work. The income tax system does not make marginal tax rates readily apparent, and complex rules and interactions between the tax and transfer systems tend to further obscure those rates. Moreover, the average taxpayer may not fully understand how benefits are linked to income because of various exemptions and deductions and because of nonfinancial criteria for qualifying for a pro-gram. Some researchers posit that taxpayers use their average tax rate (their total taxes divided by their total income), which is typically lower than their marginal tax rate, when making decisions about their level of partici-pation in the workforce.4 Alternatively, taxpayers may rely on a rule of thumb to approximate the relationship between earnings and disposable income. In light of the difficulty people face when determining their marginal tax rate, the disincentives to work caused by high mar-ginal tax rates may be partially mitigated.
2. See Michael P. Keane, “Labor Supply and Taxes: A Survey,” Journal of Economic Literature, vol. 49, no. 4 (2011), pp. 961–1075; Francine D. Blau and Lawrence M. Kahn, “Changes in the Labor Supply Behavior of Married Women: 1980–2000,” Journal of Labor Economics, vol. 25 (2007), pp. 393–438.
3. See Nada Eissa and Hilary W. Hoynes, “Behavioral Responses to Taxes: Lessons from the EITC and Labor Supply,” in James M. Poterba, ed., Tax Policy and the Economy, vol. 20 (Cambridge, Mass.: National Bureau of Economic Research, 2006), pp. 73–110; and Bruce D. Meyer and Dan T. Rosenbaum, “Welfare, the Earned Income Tax Credit, and the Labor Supply of Single Mothers,” Quarterly Journal of Economics, vol. 116, no. 3 (2001), pp. 1063–1114.
4. See Jeffrey B. Liebman and Richard J. Zeckhauser, Schmeduling (draft, Harvard University, October 2004), www.hks.harvard.edu/jeffreyliebman/schmeduling.pdf.

NOVEMBER 2012 EFFECTIVE MARGINAL TAX RATES FOR LOW- AND MODERATE-INCOME WORKERS 3
Policy ImplicationsBecause tax credits and benefits from transfer programs increase taxpayers’ resources, both forms of income assis-tance make individuals and families better off. However, the phasing out of that assistance adversely affects incen-tives to work.5 As a result, lawmakers face difficult choices when targeting benefits to low- and moderate-income families. One choice relates to phaseout rates—specifi-cally, whether benefits should be phased out gradually over a broad income range or more quickly over a nar-rower income range. The former approach would affect more families but allow for lower marginal rates of benefit reduction. The latter approach would increase marginal tax rates more significantly for a smaller number of families in a narrower income range. Another choice concerns the maximum amount of the assistance, which also influences marginal tax rates. Over the same income range, phasing out a larger benefit leads to a higher mar-ginal tax rate than does phasing out a smaller benefit.
CBO’s Analytical ApproachesCBO used two methods to analyze the marginal tax rates that low- and moderate-income workers face. First, to provide context for its main analysis, CBO illustrated how interactions between several widely applicable tax provisions and the phaseout of transfer benefits would affect the marginal tax rate of a hypothetical taxpayer. The illustrative example describes the marginal tax rate faced by a taxpayer with a specific set of characteristics—emphasizing, in particular, the marginal rates of a tax-payer who participates in multiple transfer programs. However, stylized examples provide little information about the marginal tax rates that actual households face or how many households fall into each income range. In addition, many households do not participate in transfer programs for which they are eligible; households that do not receive transfers will face lower marginal tax rates because they are unaffected by phaseouts in benefits.
5. CBO accounts for the effect of marginal tax rates on the nation’s labor supply in its analyses. See Congressional Budget Office, The Economic Impact of the President’s 2013 Budget (April 2012), for a discussion of the effects of health insurance subsidies on the labor supply; and Congressional Budget Office, The Effect of Tax Changes on Labor Supply in CBO’s Microsimulation Tax Model, Background Paper (April 2007).
To provide information about the distribution of marginal tax rates across the population of low- and moderate-income workers—the main portion of CBO’s analysis—the agency simulated tax liabilities using a sam-ple of returns. Unlike the stylized example, the results presented in this part of the report were based on benefits from only one transfer program—SNAP—along with most of the tax provisions that affect people’s marginal federal and state income tax rates. The restriction to SNAP benefits was necessary because of data limitations regarding other benefit programs. Although the majority of low- and moderate-income workers do not participate in multiple means-tested transfer programs, workers who participate in multiple programs would tend to have higher marginal tax rates than shown in this part of the analysis.
Factors That Contribute to Marginal Tax Rates: A Hypothetical ExampleMany factors determine marginal tax rates and a taxpayer’s resulting disposable income, including:
Federal individual income taxes and tax credits,
Federal payroll taxes,
State individual income taxes, and
Means-tested transfer programs.
This section illustrates how these various factors, in combination, would affect a hypothetical single parent with one child under the provisions of law in effect in 2012. Families headed by single parents are used in this stylized example because they are more likely than other families to participate in means-tested transfer programs. (Examples of the marginal tax rates that would apply to a hypothetical family consisting of a married couple with two children or a single person with no children are provided in supplemental material accompanying this report.6)
6. See Congressional Budget Office, “Illustrative Effective Marginal Income Tax Rates for Married and Single Taxpayers,” supplemental material for Effective Marginal Tax Rates for Low- and Moderate-Income Workers (November 2012).
CBO
4 EFFECTIVE MARGINAL TAX RATES FOR LOW- AND MODERATE-INCOME WORKERS NOVEMBER 2012
CBO
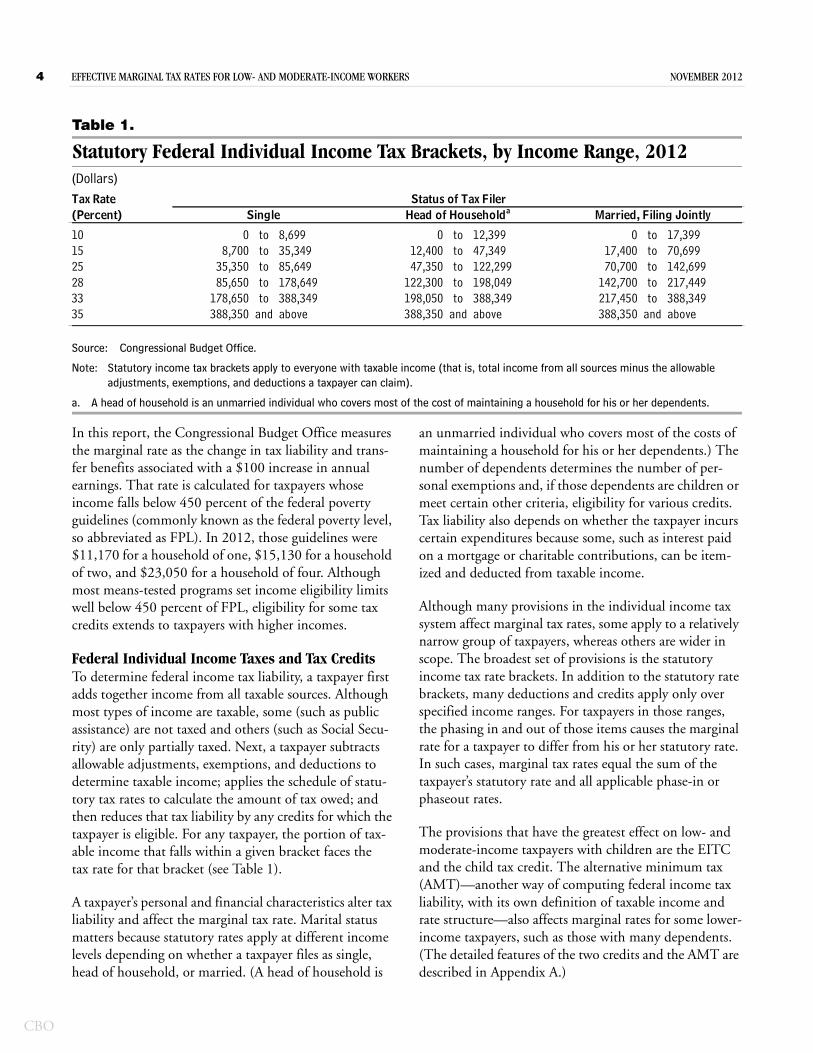
Table 1.
Statutory Federal Individual Income Tax Brackets, by Income Range, 2012(Dollars)
Source: Congressional Budget Office.
Note: Statutory income tax brackets apply to everyone with taxable income (that is, total income from all sources minus the allowable adjustments, exemptions, and deductions a taxpayer can claim).
a. A head of household is an unmarried individual who covers most of the cost of maintaining a household for his or her dependents.
Tax Rate(Percent)
10 0 to 8,699 0 to 12,399 0 to 17,39915 8,700 to 35,349 12,400 to 47,349 17,400 to 70,69925 35,350 to 85,649 47,350 to 122,299 70,700 to 142,69928 85,650 to 178,649 122,300 to 198,049 142,700 to 217,44933 178,650 to 388,349 198,050 to 388,349 217,450 to 388,34935 388,350 and above 388,350 and above 388,350 and above
Single Head of Householda Married, Filing JointlyStatus of Tax Filer
In this report, the Congressional Budget Office measures the marginal rate as the change in tax liability and trans-fer benefits associated with a $100 increase in annual earnings. That rate is calculated for taxpayers whose income falls below 450 percent of the federal poverty guidelines (commonly known as the federal poverty level, so abbreviated as FPL). In 2012, those guidelines were $11,170 for a household of one, $15,130 for a household of two, and $23,050 for a household of four. Although most means-tested programs set income eligibility limits well below 450 percent of FPL, eligibility for some tax credits extends to taxpayers with higher incomes.
Federal Individual Income Taxes and Tax CreditsTo determine federal income tax liability, a taxpayer first adds together income from all taxable sources. Although most types of income are taxable, some (such as public assistance) are not taxed and others (such as Social Secu-rity) are only partially taxed. Next, a taxpayer subtracts allowable adjustments, exemptions, and deductions to determine taxable income; applies the schedule of statu-tory tax rates to calculate the amount of tax owed; and then reduces that tax liability by any credits for which the taxpayer is eligible. For any taxpayer, the portion of tax-able income that falls within a given bracket faces the tax rate for that bracket (see Table 1).
A taxpayer’s personal and financial characteristics alter tax liability and affect the marginal tax rate. Marital status matters because statutory rates apply at different income levels depending on whether a taxpayer files as single, head of household, or married. (A head of household is
an unmarried individual who covers most of the costs of maintaining a household for his or her dependents.) The number of dependents determines the number of per-sonal exemptions and, if those dependents are children or meet certain other criteria, eligibility for various credits. Tax liability also depends on whether the taxpayer incurs certain expenditures because some, such as interest paid on a mortgage or charitable contributions, can be item-ized and deducted from taxable income.
Although many provisions in the individual income tax system affect marginal tax rates, some apply to a relatively narrow group of taxpayers, whereas others are wider in scope. The broadest set of provisions is the statutory income tax rate brackets. In addition to the statutory rate brackets, many deductions and credits apply only over specified income ranges. For taxpayers in those ranges, the phasing in and out of those items causes the marginal rate for a taxpayer to differ from his or her statutory rate. In such cases, marginal tax rates equal the sum of the taxpayer’s statutory rate and all applicable phase-in or phaseout rates.
The provisions that have the greatest effect on low- and moderate-income taxpayers with children are the EITC and the child tax credit. The alternative minimum tax (AMT)—another way of computing federal income tax liability, with its own definition of taxable income and rate structure—also affects marginal rates for some lower-income taxpayers, such as those with many dependents. (The detailed features of the two credits and the AMT are described in Appendix A.)

NOVEMBER 2012 EFFECTIVE MARGINAL TAX RATES FOR LOW- AND MODERATE-INCOME WORKERS 5
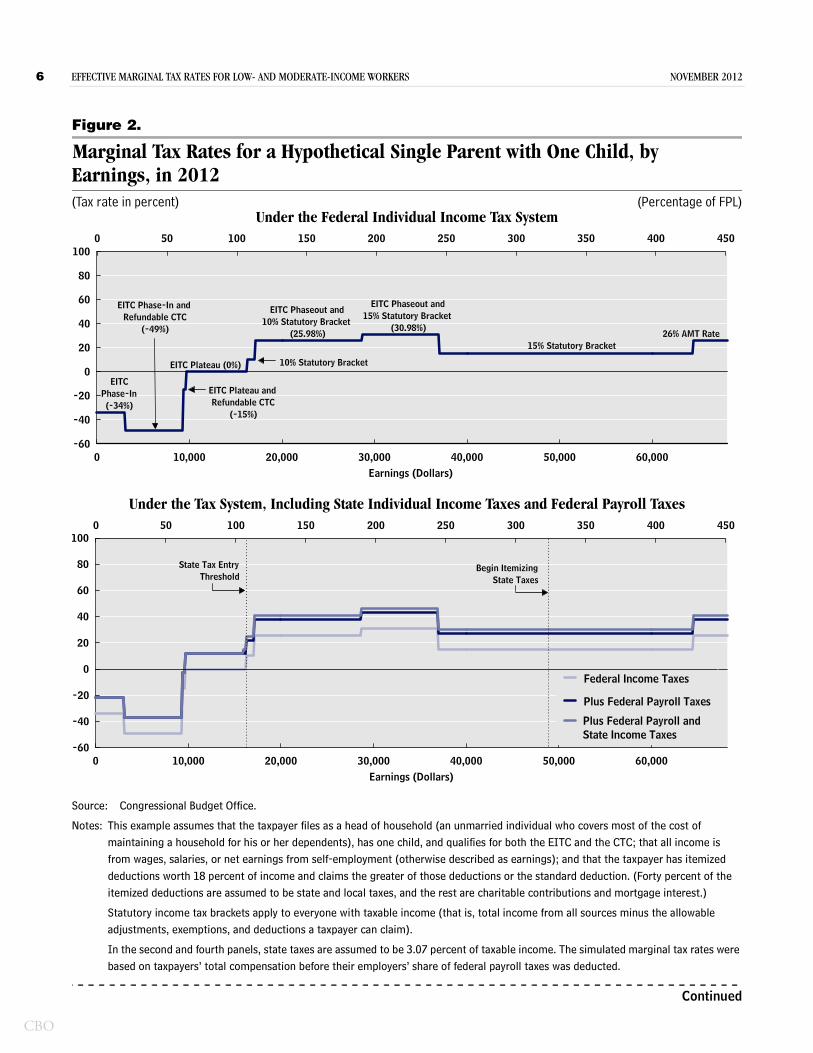
Figure 1.
Dollar Amount of Child-Related Tax Credits for a Hypothetical Single Parent with One Child, by Earnings, in 2012 (Credit in dollars)
Source: Congressional Budget Office.
Notes: This figure illustrates the effects of two tax credits—the earned income tax credit and the child tax credit—on the resources of a taxpayer who has one qualifying child and who files as a head of household in 2012. (A head of house-hold is an unmarried individual who covers most of the cost of maintaining a household for his or her dependents.)
EITC = earned income tax credit.
For simplicity, CBO assumed in this illustration that all taxable income comes from wages and that the taxpayer has itemized deductions equal to 18 percent of his or her earnings.7 Forty percent of those deductions are assumed to be state and local taxes (which are not deductible under the AMT), and the other 60 percent are attributed to charitable contributions and mortgage interest (which are deductible under the AMT). CBO chose to include only some of the most common features of the tax code in the illustrative example; making assumptions about
7. Taking into account all taxpayers who itemized in 2010 (the most recent year for which data are available), itemized deductions averaged 21 percent of their earnings that year; however, CBO assumed a slightly lower ratio for taxpayers whose income was below 450 percent of FPL. CBO also assumed that the additional $100 in earnings would not increase a taxpayer’s expenditures on goods or services that could be itemized.
10,000 20,000 30,000 40,000 50,0000
500
1,000
1,500
2,000
2,500
3,000
3,500
4,000
4,500
Earnings (Dollars)
EITC and Child Tax Credit
EITC
retirement savings or tuition payments for a student in college could lead to much more complex examples.
For a single parent with one child who files as a head of household and is eligible for the EITC and the child tax credit, those credits increase after-tax income because the amount that the credits exceed his or her tax liability is refunded. However, the phase-in and phaseout of the EITC and child tax credit lower and raise marginal tax rates substantially. At low levels of income, each addi-tional $100 of earnings increases the EITC by $34 (see Figure 1). As the taxpayer’s income increases, he or she can claim the child tax credit as well, and each additional $100 of earnings increases total refundable credits by $49. At higher levels of income, the taxpayer receives the full amount of both credits. Once the taxpayer’s income exceeds $17,090, each additional $100 of income reduces the EITC by about $16; he or she receives the maximum child tax credit until income exceeds $75,000, at which point the credit phases out.
As a result of these credits, taxpayers with children face considerable variation in their marginal tax rates, particu-larly at lower income levels (see the first panel of Figure 2). At low levels of income, a single parent with one child faces negative marginal tax rates as the EITC and child tax credit phase in; that is, an additional dollar of earnings adds more than one dollar to income after accounting for taxes. As the taxpayer’s income increases, he or she enters the EITC plateau—the income range between the two thresholds, where the taxpayer receives the maximum benefit—and the marginal tax rate rises. Once the taxpayer begins receiving the maximum benefit available through the child tax credit—at $9,700 of income—the credit no longer adds to his or her marginal tax rate. The marginal tax rate remains at zero until he or she reaches the “income tax threshold”—the level at which the filer incurs a positive income tax liability before claiming tax credits. For a single parent, this occurs once his or her income exceeds $16,300—the total of the standard deduction, personal exemption, and dependent exemption. However, the taxpayer’s EITC and child tax credit exceed his or her tax liability, so the taxpayer still does not owe taxes. But because the tax-payer’s refund is reduced by his or her tax liability, the marginal tax rate is 10 percent (the statutory rate at that income level).
When the taxpayer’s income enters the EITC phaseout range, each additional $100 of earnings reduces the credit
CBO
6 EFFECTIVE MARGINAL TAX RATES FOR LOW- AND MODERATE-INCOME WORKERS NOVEMBER 2012
CBO
Figure 2.
Marginal Tax Rates for a Hypothetical Single Parent with One Child, by Earnings, in 2012(Tax rate in percent) (Percentage of FPL)
Under the Federal Individual Income Tax System
Under the Tax System, Including State Individual Income Taxes and Federal Payroll Taxes
0 10,000 20,000 30,000 40,000 50,000 60,000-60
-40
-20
0
20
40
60
80
100
Earnings (Dollars)
0 50 100 150 200 250 300 350 400 450
EITCPhase-In(-34%)
EITC Phase-In andRefundable CTC
(-49%)
EITC Plateau andRefundable CTC
(-15%)
EITC Plateau (0%) 10% Statutory Bracket
EITC Phaseout and10% Statutory Bracket
(25.98%)
EITC Phaseout and15% Statutory Bracket
(30.98%)
15% Statutory Bracket26% AMT Rate
0 10,000 20,000 30,000 40,000 50,000 60,000-60
-40
-20
0
20
40
60
80
100
Earnings (Dollars)
0 50 100 150 200 250 300 350 400 450
State Tax EntryThreshold
Begin ItemizingState Taxes
Federal Income Taxes
Plus Federal Payroll Taxes
Plus Federal Payroll andState Income Taxes
Source: Congressional Budget Office.
Notes: This example assumes that the taxpayer files as a head of household (an unmarried individual who covers most of the cost of maintaining a household for his or her dependents), has one child, and qualifies for both the EITC and the CTC; that all income is from wages, salaries, or net earnings from self-employment (otherwise described as earnings); and that the taxpayer has itemized deductions worth 18 percent of income and claims the greater of those deductions or the standard deduction. (Forty percent of the itemized deductions are assumed to be state and local taxes, and the rest are charitable contributions and mortgage interest.)
Statutory income tax brackets apply to everyone with taxable income (that is, total income from all sources minus the allowable adjustments, exemptions, and deductions a taxpayer can claim).
In the second and fourth panels, state taxes are assumed to be 3.07 percent of taxable income. The simulated marginal tax rates were based on taxpayers’ total compensation before their employers’ share of federal payroll taxes was deducted.
Continued

NOVEMBER 2012 EFFECTIVE MARGINAL TAX RATES FOR LOW- AND MODERATE-INCOME WORKERS 7
Figure 2. Continued
Marginal Tax Rates for a Hypothetical Single Parent with One Child, by Earnings, in 2012(Tax rate in percent) (Percentage of FPL)
Under the System of Transfers
Under the System of Taxes and Transfers
Notes (continued):In the third and fourth panels, transfer benefits are computed using stylized program rules based on those in effect in the Common-wealth of Pennsylvania. SNAP gross income limits are 160 percent of the federal poverty guidelines, and the taxpayer can claim the standard deduction as well as deductions for earnings and housing costs. (Pennsylvania does not apply a net income test to SNAP.) Monthly housing costs are assumed to be $559. Median family income and fair-market rents for housing vouchers are set to $27,563 and $559, respectively. The TANF benefit is the difference between $316 and net income (income minus 50 percent of earnings). Pennsylvania disregards $120 of earnings and 50 percent of the remainder to calculate Medicaid eligibility. The dotted lines indicate income limits for Medicaid and CHIP where taxpayers face “cliffs.” Similar spikes in marginal tax rates when the taxpayer loses eligibility for TANF and SNAP are not illustrated.
FPL= federal poverty guidelines; EITC = earned income tax credit; CTC = child tax credit; AMT= alternative minimum tax; SNAP = Supplemental Nutrition Assistance Program (formerly known as the Food Stamp program); TANF = Temporary Assistance for Needy Families; CHIP= Children’s Health Insurance Program.
10,000 20,000 30,000 40,000 50,000 60,0000
20
40
60
80
10050 100 150 200 250 300 350 400 450
Earnings (Dollars)
Medicaid: IncomeLimit for Parent
CHIP: Income Limitfor Free Coverage
CHIP: Limit forIncreases in
Cost SharingCHIP: Income Limit for Reduced-Cost Coverage
SNAP
Housing Vouchers
TANFCombined Effects
0 10,000 20,000 30,000 40,000 50,000 60,000-60
-40
-20
0
20
40
60
80
100
Earnings (Dollars)
0 50 100 150 200 250 300 350 400 450
Medicaid: IncomeLimit for Parent
CHIP: Income Limit forFree Coverage
CHIP: Income Limit forReduced-Cost Coverage
Plus Transfer Programs
Federal Income, Payroll,and State Income Taxes
CBO

8 EFFECTIVE MARGINAL TAX RATES FOR LOW- AND MODERATE-INCOME WORKERS NOVEMBER 2012
CBO
by $15.98, thus adding 15.98 percentage points to marginal tax rates. Initially, the taxpayer faces a 25.98 percent marginal rate from the combination of the 10 percent statutory rate and the phaseout of the EITC. When income reaches $28,700, the taxpayer enters the 15 percent tax bracket and faces a 30.98 percent marginal rate.
After the EITC phases out completely, marginal rates under the individual income tax system drop to the statu-tory rate—15 percent. Under current law in 2012, when income exceeds $64,500 (at 426 percent of FPL), the tax-payer is subject to the AMT and faces a marginal tax rate of 26 percent. If the higher AMT exemption in existence in 2011 (it expired at the end of that year) applied in 2012, the taxpayer would not become subject to the AMT until his or her income rose above 450 percent of FPL.
Federal Payroll TaxesMost income from wages and self-employment is subject to payroll taxes that help fund Social Security’s Old-Age, Survivors, and Disability Insurance (OASDI) program and Medicare’s Hospital Insurance (HI) program. Employers and employees each pay a portion of the OASDI tax on earnings up to a certain amount ($110,100 in 2012) and a 1.45 percent HI tax on all earnings. For 2012, the employee’s share of the OASDI tax has been temporarily reduced to 4.2 percent; it is scheduled to return to 6.2 percent starting in 2013. The employer’s share of the OASDI tax is 6.2 percent of wages. Economists generally agree that the employer’s share of payroll taxes is passed on to workers in the form of lower compensation. CBO followed that assumption and treated payroll taxes as if employees paid both shares.
Because Social Security taxes are linked to benefits, including them in a calculation of marginal tax rates is problematic. Payroll taxes reduce returns from working just as income taxes do; as such, they should affect peo-ple’s decisions about how much to work. However, earning more and paying more in Social Security taxes (up to the taxable maximum) would entitle workers to higher Social Security benefits. (In some cases, benefits are only loosely based on one’s work record—for instance, married or widowed beneficiaries can receive benefits based on their spouses’ work history.) The net effect—the true “tax”—is the portion of the OASDI tax not offset in the future by increased benefits. However, CBO did not attempt to divide the tax into its gross and net components; instead, for simplicity, this report
presents marginal tax rates with and without payroll taxes. Marginal tax rates that include payroll taxes are based on an additional dollar of compensation measured before the payment of an employer’s share of payroll taxes.
The proper treatment of the HI tax is less ambiguous. Under the Medicare program, once workers have earned credit for 40 quarters of contributions, they are eligible to start receiving benefits at age 65. In 2012, workers receive a credit for each $1,130 in earnings and can accumulate up to four credits per year. Because workers receive no benefits for earning above $4,520 per year, any amount beyond that is a tax. Once workers have accumulated 40 quarters, any additional HI tax paid over their lifetime does not affect benefits. Thus, the HI portion of payroll taxes is much closer to a pure tax than is the OASDI portion.
For a single parent whose income is less than 450 percent of FPL, the assumption that the worker pays both shares of payroll taxes requires calculating the marginal payroll tax rate on an additional dollar of compensation mea-sured before the payment of the employer’s payroll taxes.8 As a result, payroll taxes increase the marginal rate by 12.4 percentage points throughout the income range (see the second panel of Figure 2). Because the phase-in of the EITC more than offsets the payroll tax and subsidizes each additional dollar of earnings, the marginal rate does not jump to 12.4 percent until the taxpayer enters the EITC plateau.
State Individual Income TaxesMost states (and some localities) levy income taxes. And most conform, to varying degrees, to federal definitions of income and deductions but apply their own rate sched-ule. State income tax rates tend to be much lower and less varied than federal rates, with top statutory rates rarely exceeding 10 percent. Twenty-five states and the District of Columbia also have a version of the EITC, typically structured as a percentage of the federal EITC. In 2010, total collections of state income taxes were about one-third the size of federal income tax collections.
State taxes interact with the federal marginal tax rate if the taxpayer itemizes deductions: When a taxpayer earns more, deductible state income taxes increase, so federal taxable income rises less than earnings, reducing the
8. For details, see Congressional Budget Office, Effective Marginal Tax Rates on Labor Income (November 2005).

NOVEMBER 2012 EFFECTIVE MARGINAL TAX RATES FOR LOW- AND MODERATE-INCOME WORKERS 9
federal marginal rate. Because of that interaction, the incremental effect of including state income taxes shrinks for taxpayers who itemize deductions.
For this illustrative example, CBO used the income tax rates in effect in the Commonwealth of Pennsylvania. (Pennsylvania was chosen because its statutory income tax rate and phaseout rules for transfer benefits, discussed below, are similar to those found in many other states. Pennsylvania, however, does not have a state version of the EITC.) State income taxes add a fixed amount to the marginal tax rate once the taxpayer’s income exceeds the tax entry threshold (see the second panel of Figure 2). (In Pennsylvania, the state income tax rate is 3.07 percent once a head of household’s income exceeds $16,000.9) These results would differ if another state’s tax laws had been used in the analysis.
Means-Tested Transfer ProgramsThe contribution of means-tested benefit programs to marginal tax rates is complex. Eligibility for benefits depends on financial characteristics such as income and assets as well as nonfinancial characteristics such as the presence of children in the family. Programs vary in what sources of income are counted, the maximum level of income a household can have and still be eligible, and the rate at which benefits phase out. Programs also interact with each other because some programs count benefits from another program as income.
This hypothetical example focuses primarily on the ways that three widely used means-tested programs influence marginal tax rates. Those programs are:
Temporary Assistance for Needy Families,
The Housing Choice Voucher Program (housing vouchers; also known as Section 8), and
The Supplemental Nutrition Assistance Program.
The marginal tax rates arising from these three pro-grams—which are among the largest means-tested programs in terms of federal spending—illustrate the interactions between transfer programs and between the tax rates arising from the tax and transfer systems.
9. In Pennsylvania, taxpayers with income below an established threshold are eligible for a credit that eliminates their state income tax liability. When the taxpayer’s income exceeds the threshold, the credit phases out over a $2,250 range of income. These examples do not include that phaseout.
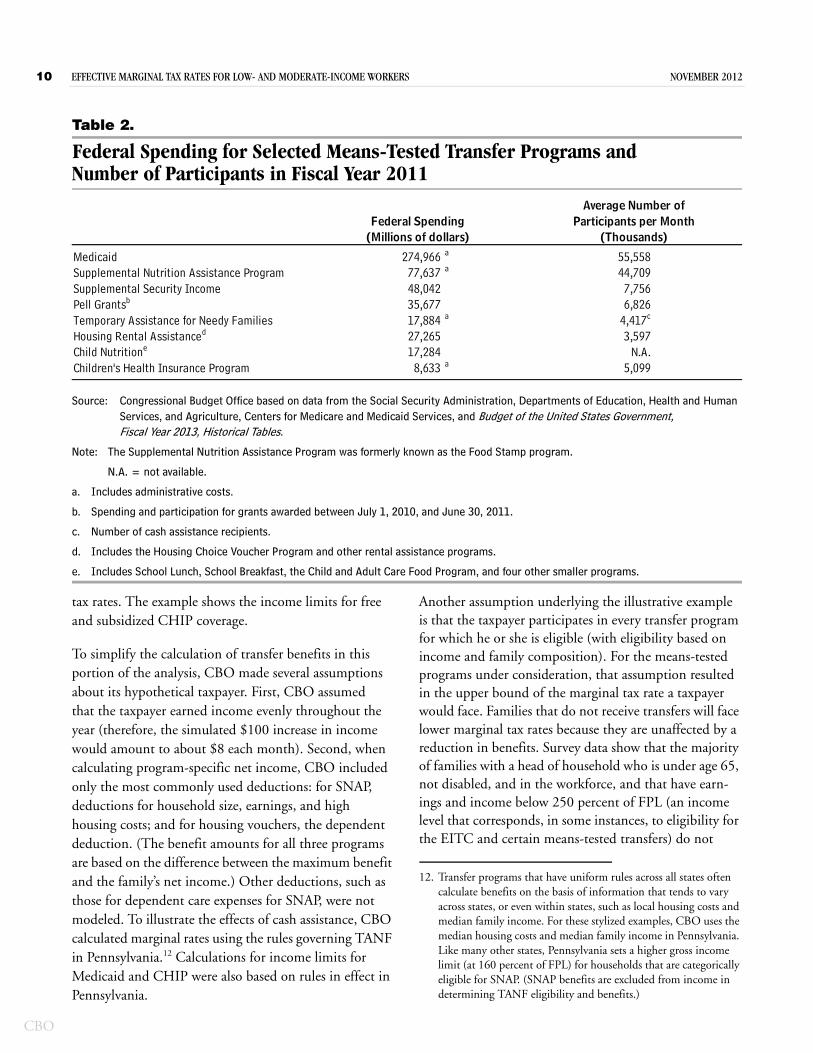
(See Table 2 for federal spending on selected means-tested programs in 2011.) Two other large programs, Supplemental Security Income and Pell Grants, are avail-able only to people who are disabled or over age 65 or to students and not to low- and moderate-income people in general. However, the inclusion of other means-tested benefits would increase estimated marginal tax rates somewhat.10
Among means-tested programs serving low-income families, total federal expenditures are highest for Medic-aid. Including insurance benefits from Medicaid or the related Children’s Health Insurance Program (CHIP) in marginal tax rates is difficult. First, the cash value of those benefits to recipients is not clear because different people place different values on the insurance provided through Medicaid or CHIP.11 Second, Medicaid benefits typically do not vary by income until income exceeds a threshold and benefits cease. For individuals whose income is far from the thresholds, small increases in income would not change their Medicaid benefits and therefore would have no effect on marginal tax rates. However, for taxpayers near the threshold, an incremental increase in income that resulted in the complete loss of Medicaid coverage would push marginal tax rates above 100 percent. Such “cliffs” occur when the taxpayer’s income reaches an established threshold and benefits stop immediately rather than phasing out gradually over a range of income. Because the value of these benefits substantially increases a taxpayer’s resources, maintaining eligibility for Medic-aid would affect labor supply decisions even though that program does not contribute to marginal tax rates over most income ranges. This example shows the income levels at which a taxpayer would lose Medicaid eligibility (that is, reach the cliff ). In addition, the majority of states require premiums and cost sharing for higher-income children participating in CHIP, which increase marginal
10. See statement of C. Eugene Steuerle, Urban Institute, Marginal Tax Rates, Work, and the Nation’s Real Tax System, before the Subcommittee on Human Resources and the Subcommittee on Select Revenue Measures, House Committee on Ways and Means (June 27, 2012), www.urban.org/UploadedPDF/901508-Marginal-Tax-Rates-Work-and-the-Nations-Real-Tax-System.pdf.
11. In its analyses of average tax rates, CBO incorporates the value of Medicaid when estimating a household’s total income using the Census Bureau’s calculation of the program’s average cost to the federal government per recipient. See Congressional Budget Office, The Distribution of Household Income and Federal Taxes, 2008 and 2009 (July 2012).
CBO
10 EFFECTIVE MARGINAL TAX RATES FOR LOW- AND MODERATE-INCOME WORKERS NOVEMBER 2012
CBO
Table 2.
Federal Spending for Selected Means-Tested Transfer Programs and Number of Participants in Fiscal Year 2011
Source: Congressional Budget Office based on data from the Social Security Administration, Departments of Education, Health and Human Services, and Agriculture, Centers for Medicare and Medicaid Services, and Budget of the United States Government, Fiscal Year 2013, Historical Tables.
Note: The Supplemental Nutrition Assistance Program was formerly known as the Food Stamp program.
N.A. = not available.
a. Includes administrative costs.
b. Spending and participation for grants awarded between July 1, 2010, and June 30, 2011.
c. Number of cash assistance recipients.
d. Includes the Housing Choice Voucher Program and other rental assistance programs.
e. Includes School Lunch, School Breakfast, the Child and Adult Care Food Program, and four other smaller programs.
Medicaid 274,966 a 55,558Supplemental Nutrition Assistance Program 77,637 a 44,709Supplemental Security Income 48,042 7,756Pell Grantsb 35,677 6,826Temporary Assistance for Needy Families 17,884 a 4,417c
Housing Rental Assistanced 27,265 3,597Child Nutritione 17,284 N.A.Children's Health Insurance Program 8,633 a 5,099
(Millions of dollars) (Thousands)
Average Number ofFederal Spending Participants per Month
tax rates. The example shows the income limits for free and subsidized CHIP coverage.
To simplify the calculation of transfer benefits in this portion of the analysis, CBO made several assumptions about its hypothetical taxpayer. First, CBO assumed that the taxpayer earned income evenly throughout the year (therefore, the simulated $100 increase in income would amount to about $8 each month). Second, when calculating program-specific net income, CBO included only the most commonly used deductions: for SNAP, deductions for household size, earnings, and high housing costs; and for housing vouchers, the dependent deduction. (The benefit amounts for all three programs are based on the difference between the maximum benefit and the family’s net income.) Other deductions, such as those for dependent care expenses for SNAP, were not modeled. To illustrate the effects of cash assistance, CBO calculated marginal rates using the rules governing TANF in Pennsylvania.12 Calculations for income limits for Medicaid and CHIP were also based on rules in effect in Pennsylvania.
Another assumption underlying the illustrative example is that the taxpayer participates in every transfer program for which he or she is eligible (with eligibility based on income and family composition). For the means-tested programs under consideration, that assumption resulted in the upper bound of the marginal tax rate a taxpayer would face. Families that do not receive transfers will face lower marginal tax rates because they are unaffected by a reduction in benefits. Survey data show that the majority of families with a head of household who is under age 65, not disabled, and in the workforce, and that have earn-ings and income below 250 percent of FPL (an income level that corresponds, in some instances, to eligibility for the EITC and certain means-tested transfers) do not
12. Transfer programs that have uniform rules across all states often calculate benefits on the basis of information that tends to vary across states, or even within states, such as local housing costs and median family income. For these stylized examples, CBO uses the median housing costs and median family income in Pennsylvania. Like many other states, Pennsylvania sets a higher gross income limit (at 160 percent of FPL) for households that are categorically eligible for SNAP. (SNAP benefits are excluded from income in determining TANF eligibility and benefits.)

NOVEMBER 2012 EFFECTIVE MARGINAL TAX RATES FOR LOW- AND MODERATE-INCOME WORKERS 11
receive TANF, housing assistance, SNAP, or Medicaid (see Box 1). Medicaid coverage for a family member was the most commonly used program, followed by SNAP benefits. As a result, the marginal tax rates illustrated in this example are higher than those that apply to most low-income taxpayers with this family structure.
Because benefit amounts from some transfer programs affect the amounts received from other programs, the marginal rate resulting from the cumulative phaseout of transfers differs from the sum of the marginal rates for each program in isolation. CBO calculated benefits in an order consistent with the way these programs count income in Pennsylvania. First, CBO calculated cash TANF benefits. Next, CBO calculated housing assis-tance, which includes TANF in its measure of income. Finally, CBO calculated SNAP benefits, which includes TANF benefits and the household’s housing costs, net of the value of any housing voucher, in its calculation of net income. CBO first examined the marginal rate under the transfer system and then added it to the marginal tax rate under the tax system.
TANF. At the lowest levels of income, a single parent with one child is eligible for TANF (see the third panel of Figure 2). Because the first $90 of monthly earnings is disregarded under TANF, a marginal rate of zero applies until the taxpayer’s annual income exceeds $1,080. Then, TANF benefits begin phasing out at a rate of 50 cents for each additional dollar of earnings until the taxpayer’s income exceeds the limit for receiving TANF benefits—$4,900. At that point, the hypothetical taxpayer would face a “cliff,” wherein a $100 increase in earnings would result in a loss of $1,900 in TANF benefits.
Housing Choice Voucher Program. The income measure used to determine the value of housing vouchers takes into account earnings and TANF benefits. As a result, in this illustrative example, increases in earnings that result in the reduction of TANF benefits have a different effect on income, and on housing benefits, than an increase in earnings that does not change TANF benefits. Beginning with the hypothetical taxpayer’s first dollar of earnings, each additional dollar would reduce the housing voucher by 30 cents. Once the taxpayer reached the TANF phase-out range, each additional dollar of earnings would reduce TANF benefits by 50 cents, causing net income—before housing vouchers—to increase by 50 cents. For each 50 cent increase, housing benefits would be reduced by 30 percent, or by 15 cents, causing the marginal tax
rate attributable to both programs to increase to 65 per-cent (50 percent from TANF plus 15 percent from the housing voucher). The loss of TANF benefits at $4,900 of income would result in an increase in the annual hous-ing voucher—from $4,836 to $5,388—which would partially offset the loss in TANF. After TANF benefits stopped, each additional dollar of earnings would reduce the housing voucher by 30 cents until it completely phased out at $22,900 of earnings (151 percent of FPL).
SNAP. Similarly, because SNAP benefits depend on TANF benefits and housing vouchers, an increase in earnings affects SNAP benefits directly and indirectly through reductions in TANF benefits and the housing benefits. Starting with the hypothetical taxpayer’s first dollar of earnings, each additional dollar would reduce the SNAP benefit by 24 cents. That would increase the marginal rate arising from these three transfers by 24 percentage points to 54 percent. However, because SNAP includes TANF benefits as income, once the taxpayer reached the phaseout range for TANF benefits, an additional dollar of earnings would reduce SNAP benefits by just 9 cents. (A $1 increase in earnings would be offset by a 50 cent reduction in TANF benefits as well as by a 20 cent earn-ings deduction when determining SNAP net income.) Between $1,100 and $4,800 of income, the marginal rate under the transfer system would reach 74 percent for this hypothetical taxpayer who participates in all three pro-grams. Between $4,800 and $4,900 of income, when a $100 increase would result in the loss of TANF benefits, annual SNAP benefits would increase from $3,202 to $3,832.
After TANF benefits ceased, increases in earnings would be partially offset by reductions in housing assistance. Without TANF benefits, housing costs—net of the housing voucher benefit—would become high relative to income and enable the household to qualify for the “excess shelter cost” deduction. After accounting for the interactions between the housing voucher and SNAP, an additional dollar of earnings would reduce the SNAP benefit by 27 cents. Between $4,900 and $7,300 of income, the marginal rate from the two transfers would be 57 percent. Once earnings exceeded $7,300, the tax-payer’s housing costs would no longer be high relative to his or her income and he or she would not be able to claim the shelter deduction. In that range, SNAP would add 24 percentage points to the marginal rate and the combined marginal rate from SNAP and housing assistance would be 54 percent. SNAP benefits would
CBO

12 EFFECTIVE MARGINAL TAX RATES FOR LOW- AND MODERATE-INCOME WORKERS NOVEMBER 2012
CBO
ContinuedBox 1.
Estimated Program Participation Rates Using Survey DataMarginal tax rates are especially high for low- and moderate-income workers who participate in multi-ple means-tested transfer programs. The cumulative loss of benefits across multiple programs can approach or even exceed an increase in earnings. However, the degree to which reductions in benefits result in high marginal tax rates appears to be limited because the share of families facing phaseouts from multiple programs is small. That small share reflects the following: not all families are eligible for every program, not all eligible families participate, and not all participating families have income that reaches the various programs’ phaseout ranges.1
To understand how the phaseout of transfer benefits affects marginal tax rates, CBO examined the extent to which low- and moderate-income workers partici-pate in transfer programs. That analysis was based on information from the 2011 Annual Social and Eco-nomic Supplement of the Current Population Survey (CPS), a nationally representative survey of house-holds that is conducted annually by the Census Bureau. The survey contains information on partici-pation in the labor force and in transfer programs in 2010, as well as certain household characteristics reported when the survey was conducted in March 2011. CBO assessed the level of self-reported partici-pation in the following programs: the Supplemental Nutrition Assistance Program (SNAP, formerly known as the Food Stamp program), Temporary Assistance for Needy Families (TANF), housing assistance programs, and Medicaid or the Children’s Health Insurance Program.
For comparability to the main analysis, CBO limited the CPS sample to families headed by an individual under the age of 65 who did not receive disability income and whose family income included earnings. To focus on families most likely to qualify for means-tested programs, CBO further restricted the
sample to families with income below 250 percent of federal poverty guidelines (abbreviated as FPL), a lower income threshold than that considered in the main analysis. Programs typically also have additional eligibility criteria based on nonfinancial characteris-tics, such as family composition and time limits on assistance. CBO classified families into four types—those consisting of a single taxpayer with no children under the age of 19, a single parent with children, a married couple with no children, and a married couple with children.
CBO estimated that 38 percent of families with income under 250 percent of FPL participated in one or more of those programs (see the table to the right). The majority of families who received transfer bene-fits participated in only one program—typically, Medicaid. Because Medicaid coverage does not grad-ually phase out but, rather, ceases once income exceeds an established threshold, it would not affect marginal tax rates unless the family’s income crossed the threshold. Further restricting the sample to those who could claim the earned income tax credit (EITC) or child tax credit would exclude higher-income fam-ilies without children (because the EITC for childless workers has much lower income thresholds). Such an adjustment would result in higher rates of program participation, and higher rates of participation in multiple programs, among the remaining families without children.
The presence of children affects a family’s eligibility for means-tested programs; for instance, eligibility for TANF is typically restricted to families with children and Medicaid’s income thresholds for children are generally much higher than those for adults. Families with children are most likely to participate in at least one transfer program—65 percent of families headed by single parents and 52 percent of families headed by a married couple received transfers. In addition, families headed by single parents were most likely to participate in multiple programs.
A disadvantage of using survey data for this analysis is that participation in transfer programs and the value
1. See Janet Currie, The Take Up of Social Benefits, Working Paper 10488 (Cambridge, Mass.: National Bureau of Eco-nomic Research, May 2004), www.nber.org/papers/w10488.

NOVEMBER 2012 EFFECTIVE MARGINAL TAX RATES FOR LOW- AND MODERATE-INCOME WORKERS 13
Box 1. Continued
Estimated Program Participation Rates Using Survey Data
Share of Families Participating in Selected Means-Tested Transfer Programs in 2010
Source: Congressional Budget Office based on survey data from the Census Bureau.
Notes: CBO’s estimates are based on information from the 2011 Current Population Survey. The survey contains information on participation in transfer programs in 2010 as well as certain household characteristics (including the receipt of housing assistance) reported when the survey was conducted in March 2011. The sample was restricted to taxpayers under the age of 65 who were not disabled, who had earnings in 2010, and whose family income was below 250 percent of federal poverty guidelines.
Children are defined as family members under the age of 19. Housing assistance includes the Housing Choice Voucher Program, other rental assistance programs, and public housing.
SNAP = Supplemental Nutrition Assistance Program (formerly known as the Food Stamp program); CHIP = Children’s Health Insurance Program; TANF = Temporary Assistance for Needy Families.
of benefits received tend to be underreported.2 Researchers have estimated that survey data capture between 50 percent and 80 percent of beneficiaries of SNAP and TANF. Some respondents forget about benefits they received briefly or are hesitant to report them to the interviewer because of privacy concerns. One study has estimated participation rates using
administrative data from means-tested programs, which are less likely to be compromised by survey respondents’ recall errors. Estimates using adminis-trative data show that most workers do not receive means-tested transfers, and of those who do, most participate in only one program.3 Participation in multiple programs is more common among single parents than among the general population. CBO’s survey-based results are consistent with those findings.
Number of Programs
None 48 82 35 79 62One 29 14 28 16 22
SNAP only 3 6 5 10 6Medicaid or CHIP only 25 7 22 4 13TANF or housing assistance only 1 1 1 2 2
Two 19 4 26 4 13SNAP and Medicaid 17 3 22 2 10Any other combination of two programs 2 1 4 2 2
Three 3 0 9 1 3Four 0 0 2 0 1
Memorandum:Total Participation, by Program
SNAP 21Medicaid or CHIP 29TANF 2Housing assistance 6
With Children With No Children With Children With No Children TypesMarried Couple Single Parent
Taxpayer CharacteristicsSingle TaxpayerMarried Couple All Family
2. See Laura Wheaton, Underreporting of Means-Tested Transfer Programs in the CPS and SIPP (Washington, D.C.: Urban Institute, January 1, 2007), www.urban.org/publications/411613.html; and Bruce D. Meyer, Wallace K. C. Mok, and James X. Sullivan, The Under-Reporting of Transfers in House-hold Surveys: Its Nature and Consequences, Working Paper 15181 (Cambridge, Mass.: National Bureau of Economic Research, July 2009), www.nber.org/papers/w15181.
3. See Stephen D. Holt and Jennifer L. Romich, “Marginal Tax Rates Facing Low- and Moderate-Income Workers Who Participate in Means-Tested Transfer Programs,” National Tax Journal, vol. 60, no. 2 (June 2007), pp. 253–276, http://ntj.tax.org/.
CBO
14 EFFECTIVE MARGINAL TAX RATES FOR LOW- AND MODERATE-INCOME WORKERS NOVEMBER 2012
CBO
continue to phase out until the taxpayer’s SNAP benefit reached the minimum amount, at $19,700 of earnings. After that point, SNAP benefits would not change until the taxpayer became ineligible at $23,500 of earnings. Because he or she would lose the annual $192 minimum benefit at that amount of earnings, a $100 increase in income would result in a marginal tax rate from SNAP of 192 percent.
Medicaid and CHIP. Health insurance benefits generally only vary when income exceeds an established limit and eligibility is lost. In addition, CHIP increases premiums and cost sharing at various income levels. The hypo-thetical single parent living in Pennsylvania would lose Medicaid eligibility when his or her earnings exceeded 47 percent of FPL; however, the child would remain eligible until the parent’s earnings exceeded 100 percent of FPL. (That threshold is higher for children under the age of six.) When income exceeded Medicaid’s limits, the child would become eligible for health insurance through CHIP at no cost. Once income reached 200 percent of FPL, CHIP would impose premiums and cost sharing on a sliding scale—which would increase when income reached 250 percent and 275 percent of FPL. (Monthly premiums depend on the health insurance company providing CHIP benefits but average $48 for a child at 201 percent of FPL, $67 for a child at 251 percent of FPL, and $77 for a child at 276 percent of FPL.13) When income exceeded 300 percent of FPL, the child could still receive health insurance through CHIP, but premiums and cost sharing would increase because the cost of cover-age would no longer be subsidized. As a result, marginal tax rates would increase sharply at the income levels where premiums increased.
An Illustration of Marginal Tax Rates: Combining Taxes and TransfersThe combination of the marginal rate of benefit reduc-tion from these transfers and the marginal rate from income and payroll taxes results in positive marginal tax rates throughout the entire income range (see the fourth panel of Figure 2 on page 6). At low levels of income, the marginal rate of benefit reduction more than offsets the negative marginal rate from the federal income tax system (which is attributable to the phase-in of the EITC and child tax credit)—resulting in a marginal tax rate that
13. See www.chipcoverspakids.com/assets/media/pdf/complete_income_chart_2012.pdf.
ranges from 17 percent to 52 percent. The marginal tax rate that results from the interaction between income taxes and tax credits, payroll taxes, and transfers contin-ues to increase as taxpayers move through the EITC phase-in, plateau, and phaseout ranges and into the 10 percent bracket. Under those circumstances, taxpayers whose income is between $17,100 and $19,700 face marginal rates as high as 95 percent; those with slightly higher income are subject to a 71 percent rate. The com-bination of receiving the EITC while, at the same time, experiencing the phaseout of the transfer benefits dis-cussed earlier affects a taxpayer with earnings below 250 percent of FPL. For the hypothetical single parent, the loss of Medicaid coverage at 47 percent of FPL, and increases in premiums and cost sharing for CHIP between 200 and 300 percent of FPL, would produce large spikes in marginal tax rates near those income levels. (For an illustration of how taxes and transfers affect the relationship between earnings and disposable income, see Box 2.)
The marginal tax rates calculated in this report are based on a small increase in yearly earnings and are generally more important for people who are already in the labor force—especially when they make choices about the number of hours to work—than for people outside of the labor force who are deciding whether to work. Individu-als considering whether to work probably compare the amount of disposable income that they currently receive with the disposable income they would receive from working part-time or full-time. (For calculations of the increase in disposable income associated with entering the labor force, see Box 3.)
Simulating the Distribution of Effective Marginal Tax RatesFor the first portion of its analysis, CBO used a hypo-thetical example to illustrate the way various features of the tax system and transfer programs interact. Such styl-ized examples, however, provide little information about the marginal tax rates that actual households face or how many households fall into each income range. Therefore, for the second portion of its analysis, CBO simulated the tax liabilities and transfer benefits of actual households to provide information about the distribution of marginal rates across the low- and moderate-income population.
The distribution of marginal tax rates depends on the distribution of income and on taxpayers’ degree of

NOVEMBER 2012 EFFECTIVE MARGINAL TAX RATES FOR LOW- AND MODERATE-INCOME WORKERS 15
CBO
Box 2.
Income After Taxes and Transfers
Relationship Between Earnings and Disposable Income for a Hypothetical Single Parent with One Child in 2012
(Disposable income in dollars) (Percentage of FPL)
Source: Congressional Budget Office based on survey data from the Census Bureau.
Notes: This example assumes that the taxpayer files as a head of household (an unmarried individual who covers most of the cost of maintaining a household for his or her dependents), has one child, and qualifies for both the EITC and the CTC; that all income is from wages, salaries, or net earnings from self-employment (otherwise described as earnings); and that the taxpayer has itemized deductions worth 18 percent of income and claims the greater of those deductions or the standard deduction. (Forty percent of the itemized deductions are assumed to be state and local taxes, and the rest are charitable contributions and mortgage interest.)
Disposable income was calculated as the sum of earnings and transfers (TANF, SNAP, and the Housing Choice Voucher Program) minus tax liability (from federal individual income taxes, state individual income taxes, and federal payroll taxes). The market value of Medicaid is taken from the 2011 Annual Social and Economic Supplement of the Census Bureau’s Current Population Survey; those values were based on the average cost of providing benefits to a nondisabled child and nondisabled adult residing in the Commonwealth of Pennsylvania.
FPL = federal poverty guidelines; CHIP = Children’s Health Insurance Program; EITC = earned income tax credit; CTC = child tax credit; TANF = Temporary Assistance for Needy Families; SNAP = Supplemental Nutrition Assistance Program (formerly known as the Food Stamp program).
An analysis of disposable income—the amount of income available to an individual after accounting for earnings, taxes, and transfers—provides another way to view the interactions between provisions in the tax code and transfer programs. (For this illustration, the Congressional Budget Office assumes that the tax-payer’s only source of income apart from the govern-ment is from earnings.) A taxpayer’s disposable income differs from his or her earnings because of tax liability and transfers. At low levels of earnings, the value of refundable tax credits and transfer bene-fits boosts the taxpayer’s disposable income above earnings (see the figure above). Because marginal tax rates are positive when benefit reductions are included, disposable income does not increase as
quickly as earnings—each additional dollar of earnings results in less than a dollar of additional dis-posable income. As earnings rise above 175 percent of federal poverty guidelines, disposable income falls below earnings because income and payroll tax lia-bility (before accounting for credits) exceeds the sum of transfer payments, the earned income tax credit, and the child tax credit. The amount of disposable income people have after including benefits from Medicaid and the Children’s Health Insurance Program relies heavily on the valuation of health insurance coverage. (This calculation of disposable income does not include the value of employment-based health insurance, which tends to be substantial for people who have such insurance.)
0 10,000 20,000 30,000 40,000 50,000 60,0000
10,000
20,000
30,000
40,000
50,000
60,000
0
50
100
150
200
250
300
350
400
450
Earnings (Dollars)
Earnings
After-TaxIncome
Disposable Income ExcludingCHIP and Medicaid
Disposable Income IncludingCHIP and Medicaid
0 50 100 150 200 250 300 350 400 450
16 EFFECTIVE MARGINAL TAX RATES FOR LOW- AND MODERATE-INCOME WORKERS NOVEMBER 2012
CBO
Continued
Box 3.
Effective Marginal Tax Rates Associated with Labor Force Entry in 2012In the analysis presented in the main sections of this report, the Congressional Budget Office (CBO) examined how a relatively small increase in earnings would affect people’s disposable income, which accounts for taxes and for transfer benefits. That type of analysis is especially relevant when evaluating how features of the tax system and transfer programs affect the decisions of people who are already employed and considering whether to increase or reduce the num-ber of hours they work. However, evaluating people’s decisions about whether to enter or leave the work-force requires a different approach because their decisions probably reflect how working part-time or full-time or not working at all would alter their disposable income.
To assess how benefits provided through the tax sys-tem and transfer programs would affect the marginal tax rates of individuals considering whether to enter the labor force, CBO calculated the marginal tax rate as 1 minus the ratio of the change in disposable income to the change in earnings under two scenarios:
Scenario 1: A single parent with one child moves from being jobless to working part-time (20 hours per week for the entire year).
Scenario 2: A single parent with one child moves from working part-time to working full-time (40 hours per week for the entire year).
CBO assumed that under both scenarios, the pro-spective job would pay the minimum wage (currently $7.25 an hour).1 CBO estimated that the annual earnings from the part-time job would correspond to $7,540, about 50 percent of the federal poverty guideline for a household of two in 2012. (In 2012, the guideline was $15,130 for a household that size.) Earnings from the full-time job would amount to $15,080, almost 100 percent of the federal poverty guidelines for the same household. (The supplemen-tal material accompanying this report illustrates how labor force entry would affect the marginal tax rates of workers in families of different configurations.)
1. Eighteen states and the District of Columbia have a higher minimum wage than that established by the federal govern-ment. Those minimum amounts range from $7.40 to $9.04 per hour. Pennsylvania’s minimum wage is set at the federal level.
participation in transfer programs. As discussed in the following sections, CBO simulated tax liabilities and benefits from one transfer program—SNAP—under provisions of law in effect in 2012 and under those sched-uled to be in effect in 2013 and 2014. CBO focused on SNAP because it is the second most widely used means-tested program, after Medicaid. However, the phaseout of SNAP benefits represents only a portion of the marginal tax rates from the transfer system; taxpayers who partici-pate in additional means-tested programs typically face higher marginal tax rates.
The analysis was based on information from a public-use sample of income tax returns filed in 2006 (the most recent public-use data available at the time the analysis was undertaken).14 The sample was designed to be representative of the population that filed tax returns in
that year.15 CBO augmented the tax return data in vari-ous ways, such as by using information from the Census Bureau’s Annual Social and Economic Supplement of
14. The analysis simulated taxes after adjusting for inflation and real income growth by deflating unindexed parameters by the nominal rate of per capita income growth and deflating indexed parameters by the real rate of per capita income growth, both outputs of CBO’s tax model. Applying those adjusted tax parameters to fixed 2006 income yields the same marginal tax rates that taxpayers would face, under current law, if nominal income grew 9.97 per-cent between 2006 and 2012 and prices grew by 10.57 percent (resulting in a 0.6 percentage-point decline in real income over that period).
15. To protect the identity of taxpayers in the public-use file, the Internal Revenue Service modifies information in various fields so that the resulting records do not contain complete information from any individual tax return.
NOVEMBER 2012 EFFECTIVE MARGINAL TAX RATES FOR LOW- AND MODERATE-INCOME WORKERS 17
Box 3. Continued
Effective Marginal Tax Rates Associated with Labor Force Entry in 2012Under the first scenario, the single parent who moved from not working to working part-time would face a marginal tax rate of 36 percent because even a modest level of earnings would result in the reduction or loss of several transfer benefits. Earnings from part-time work would result in a loss of eligibility for assistance through the Temporary Assistance for Needy Families program, some reduction in the housing voucher, and a decrease in benefits available through the Sup-plemental Nutrition Assistance Program. However, by entering the workforce, the single parent would become eligible for two refundable tax credits: the earned income tax credit (EITC) and the child tax credit. Those two tax credits would partially offset the reduction in transfer benefits.
The marginal tax rate associated with moving from part-time to full-time employment, illustrated in CBO’s second scenario, would be higher—47 per-cent. Earnings from full-time work would place the single parent in the EITC’s plateau range and would allow him or her to claim the maximum EITC
amount ($3,169 in 2012). However, because moving from part-time work to full-time work does not increase the EITC as much as does moving from not working to working part-time, marginal tax rates in this scenario would be higher than in the first scenario.
Although the marginal rates in this report do not include the value of Medicaid, eligibility for Medic-aid can be a factor for people deciding to enter the labor force. In both scenarios, earnings from employ-ment would result in the loss of the parent’s eligibility for Medicaid (if the parent had been eligible previ-ously). The child, though, would still be eligible for Medicaid or for the Children’s Health Insurance Program. A potentially compensating factor for the parent is that an individual working full-time would probably qualify for employment-based health insur-ance at employers that offer such insurance. Substi-tuting Medicaid with employment-based insurance would eliminate the “cliff ” that results when people’s income exceeds the cut-offs for Medicaid eligibility.
the 2007 Current Population Survey (CPS) to create records for households that did not file tax returns. The tax simulation model that CBO used to perform those calculations accounts for most, but not all, of the provi-sions that affect people’s marginal federal income tax rate. CBO calculated marginal tax rates in this distributional analysis as the change in tax liability and SNAP benefits that would result from a $100 increase in earnings.
CBO restricted the sample to focus on taxpayers whose labor decisions are most likely to be affected by marginal tax rates. First, it considered only individuals who filed tax returns and reported earnings. Ideally, the analysis would also have included potential workers (those who might join the labor force), but such people cannot be easily identified. One possibility would be to include all households in the analysis in order to capture potential workers. However, that approach would also include many people who have chosen not to enter the workforce for reasons unrelated to disposable income or who have
permanently left the workforce, such as those who have retired. Second, the analysis is limited to tax returns filed by taxpayers under age 65 who are not disabled, a group for whom marginal tax rates on labor income are more relevant to labor supply decisions.16 Third, only tax returns with adjusted gross income (AGI) under 450 per-cent of FPL are included to focus on taxpayers who are potentially eligible for both means-tested transfers and refundable tax credits, including the premium assistance tax credits that will take effect in 2014. (AGI includes all taxable sources of income net of certain expenses and is closely related to the measure of income used to deter-mine eligibility for some refundable tax credits. In 2012, the federal poverty guidelines are $11,170 for a household of one; $15,130 for a household of two; and $23,050 for a household of four.)
16. For this purpose, the disabled are identified through the receipt of disability benefits (which includes workers’ compensation) or Supplemental Security Income.
CBO

18 EFFECTIVE MARGINAL TAX RATES FOR LOW- AND MODERATE-INCOME WORKERS NOVEMBER 2012
CBO
The resulting sample includes 54 percent of all actual and potential tax-filing units and 42 percent of earnings in 2006. Reasons for being excluded from the sample varied: 10 percent of all tax-filing units had zero earnings; another 10 percent (representing 7 percent of earnings) consisted of elderly or disabled taxpayers; 17 percent (representing 51 percent of earnings) had income above 450 percent of FPL; and the remaining 8 percent (with only a negligible share of earnings) did not file a federal income tax return.
To illustrate marginal rates arising from the phaseout of transfer benefits, CBO modeled SNAP benefits using information from the 2007 CPS and the 2006 American Community Survey, both of which are weighted to be representative of the U.S. population in 2006.17 Income limits for eligibility vary by state, and those variations are incorporated into the model. Many households do not report the benefits they receive; to account for that out-come, CBO simulated participation among eligible households to match its projections of participants between 2012 and 2014. Simulated SNAP benefits for households were then statistically matched to the sample of income tax returns on the basis of taxpayers’ income and demographic characteristics.
As in its illustrative example, CBO included payroll taxes in its simulation, again assuming that the employer’s share of those taxes would be passed on to employees. Most workers are in jobs covered by Social Security and Medicare and thus face OASDI and HI taxes, but about 6 percent of employees are exempt from those taxes.18
Because payroll taxes are levied on the worker, not on the tax-filing unit, each worker in a married couple filing jointly can face a different payroll tax rate—if, for exam-ple, one spouse is above the OASDI taxable maximum and the other is not.19 CBO assumed that for a married couple filing jointly, the $100 in additional earnings would be divided between spouses in proportion to their actual earnings. The calculated marginal payroll tax rate for the couple is the average of the rate that each spouse faces, weighted by his or her earnings. Therefore, the
17. The Annual Social and Economic Supplement of the Current Population Survey does not contain the information necessary to compute the housing cost deduction available through SNAP. As a result, housing costs are imputed using data from the American Community Survey—specifically, the median housing cost for households, living in the same state, in households of the same size, and having similar income.
couple’s combined payroll tax rate is closer to that faced by the person with the highest earnings.
CBO also included state income taxes in the distribu-tional analysis. Those tax rates were estimated by applying a set of state income tax calculators to the sample of federal tax returns, using state tax laws in place in 2006.20 That method provides a fairly reliable estimate of state income tax rates but is more approximate than CBO’s estimates of federal income tax rates because of limitations in the public-use income tax data.21
For the distributional analysis, marginal tax rates for households in the sample were weighted by the number of returns filed to reflect the total population. Therefore, the distribution of marginal tax rates reflects the share of returns filed by people in the sample facing that mar-ginal tax rate. CBO used returns-weighted measures of marginal tax rates because individuals and families of low and moderate income, the focus of the agency’s main analysis, account for only about 40 percent of earnings in the economy. (For an earnings-weighted distribution that
18. Certain government employees are the main class of workers exempt from OASDI, HI, or both. Unlike nearly all private-sector workers, about 28 percent of workers employed by state and local governments are not covered by Social Security. Although all fed-eral employees hired after December 31, 1983, are covered by Social Security and pay the associated payroll taxes, many workers who were hired earlier and who have remained with the federal government are not covered by OASDI. Furthermore, state and local government employees hired before April 1, 1986, are not covered by Medicare and do not pay HI taxes. For more details about groups exempt from payroll taxes, see Congressional Budget Office, Differences in Wage and Salary Income Included in Various Tax Bases, Background Paper (June 2005).
19. Two and a half percent of the tax units in the sample had earnings exceeding the OASDI maximum ($110,100 in 2012) and thus did not pay OASDI taxes for income in excess of that amount. Most families with income less than 450 percent of FPL had income well below the OASDI maximum. However, the poverty guidelines increase with family size. As a result, it was possible for families consisting of five or more people to have income below 450 percent of FPL and also have earnings above the OASDI maximum. In addition, some taxpayers reported losses, which meant that their AGI was less than earnings—another reason some taxpayers would have had income below 450 percent of FPL and still faced a zero marginal tax rate from OASDI taxes.
20. Jon Bakija of Williams College created the state tax calculator used by CBO. For more details, see Jon Bakija, “Documentation for a Comprehensive Historical U.S. Federal and State Income Tax Calculator Program” (working paper, Williams College, August 2009).

NOVEMBER 2012 EFFECTIVE MARGINAL TAX RATES FOR LOW- AND MODERATE-INCOME WORKERS 19
reflects the share of reported earnings facing a given marginal tax rate, see Appendix B.)
Effective Marginal Tax Rates Under 2012 LawUnder current law, working taxpayers with income below 450 percent of FPL face, on average, a marginal tax rate from taxes and SNAP benefits of 30 percent in 2012. That average masks the fact that taxpayers with similar earnings face widely varying marginal rates, depending on their personal circumstances. Marginal rates vary sys-tematically by income group and by family type.
Overall DistributionThe major contributors to the overall marginal tax rate are federal individual income taxes (especially, the statu-tory rate brackets) and payroll taxes. The contribution of various tax provisions and SNAP to the marginal rate depends both on the share of taxpayers affected by the provisions and the effect on the marginal rate for those who are affected (see Table 3). Because the sample is restricted to taxpayers with earnings, almost all filers faced the payroll tax, which contributed an average of 12 percentage points to their marginal tax rate. Statutory rates under the regular income tax affected 90 percent of working taxpayers with income below 450 percent of FPL; and among taxpayers facing the regular income tax, the statutory rate increased the average marginal rate by 9 percentage points. The 15 percent bracket contained the largest proportion of taxpayers (36 percent) in the
21. Several factors limit the accuracy of the state tax estimates. First, a federal income tax return lacks all of the information necessary to calculate state income taxes. For example, many states exempt state employees’ pension income from taxation. Because federal tax law offers no such exemption, federal tax returns do not contain any information about the source of pension income, which makes it difficult to model state law. Nor do federal returns contain information regarding the state in which income is earned or taxable. For its analysis, CBO assumed that all income was earned in one state, even though many taxpayers have to appor-tion their income among states. A second problem results from the disclosure rules that protect taxpayers’ privacy. To ensure that individual taxpayers cannot be identified from their tax returns, the public-use tax data set masks states for taxpayers with AGI above $200,000. For those tax units, CBO imputes the state from the CPS. Third, the sample of federal tax returns that CBO used is probably not representative of every state. Nevertheless, on balance, the benefit of having a more complete measure of marginal tax rates outweighs the fact that the state estimates are approximations.
sample (see Table 4). Twenty-six percent of the taxpayers in the sample did not have any taxable income and thus faced a statutory rate of zero.
Notably, 10 percent of taxpayers in the sample, typically those who were married and had child dependents, were subject to the AMT because of the expiration of the higher AMT exemption at the end of 2011. (If the 2011 exemption levels were extended through 2012, very few taxpayers in this group would face the AMT.) Although the AMT primarily affects high-income taxpayers, low- and moderate-income taxpayers whose liability under the regular income tax was lower than their AMT liability were subject to the AMT. That occurred when taxpayers claimed various exemptions and deductions not allowed under the AMT, such as the dependent exemptions. In addition, the lack of a higher standard deduction or wider brackets for heads of households under the AMT can result in a higher minimum tax liability than would be the case under the regular income tax.
Other provisions that result in relatively high marginal tax rates applied to fewer taxpayers. In the sample, 26 percent of working taxpayers with income below 450 percent of FPL claimed the EITC. Most of those tax-payers were in the EITC phaseout range, which increased their marginal rate by an average of 15 percentage points. Because only 14 percent of taxpayers in the sample were affected by the EITC phaseout, its contribution to the average marginal tax rate was just 2 percentage points. Similarly, the phaseout of SNAP added 25 percentage points for affected taxpayers, but because it affected only 18 percent of taxpayers in the sample, its overall impact was much lower (5 percentage points).22 About 20 per-cent of tax units in this sample received Medicaid for one or more family members.23 For tax-filing units with income near the established threshold, reaching the Medicaid cliff would result in high marginal tax rates.
22. The estimate of the share of the sample enrolled in SNAP differs from that in Congressional Budget Office, The Supplemental Nutrition Assistance Program (April 2012), because of differences in the samples used, the unit of analysis, and the methods used to estimate benefits.
23. CBO adjusts for the underreporting of Medicaid receipt in the CPS using the method described in Michael Davern and others, “A Partially Corrected Estimate of Medicaid Enrollment and Uninsurance: Results from an Imputational Model Developed Off Linked Survey and Administrative Data,” Journal of Economic and Social Measurement, vol. 34 (2009), pp. 219–240.
CBO

20 EFFECTIVE MARGINAL TAX RATES FOR LOW- AND MODERATE-INCOME WORKERS NOVEMBER 2012
CBO
Table 3.
Contributions of Tax Provisions and SNAP Benefits to the Marginal Tax Rates of Low- and Moderate-Income Workers Under Provisions of Law in Effect in 2012
Source: Congressional Budget Office based on a public-use sample of tax returns from the Internal Revenue Service and survey data from the Census Bureau.
Notes: CBO’s simulations of tax liabilities and SNAP benefits were based on information from a public-use sample of income tax returns filed in 2006 supplemented with information from the 2007 Annual Social and Economic Supplement of the Current Population Survey and the 2006 American Community Survey. The sample was restricted to taxpayers under the age of 65 who were not disabled, who had earnings in 2006, and whose adjusted gross income was below 450 percent of federal poverty guidelines. It was weighted to be representative of the population of tax filers.
The simulated marginal tax rates were based on taxpayers’ total compensation before their employers’ share of payroll taxes was deducted.
EITC = earned income tax credit; SNAP = Supplemental Nutrition Assistance Program (formerly known as the Food Stamp program); n.a. = not applicable.
a. Provisions of the federal individual income tax do not add up to the marginal federal individual income tax rate because not all provisions of the tax code are shown.
b. Accounts for the deductibility of state income taxes on federal income tax returns for people who itemize.
c. Includes adjustments to correct for the underreporting of Medicaid in the Current Population Survey.
Federal Individual Income Taxesa 100.0 10.8 10.8
(Regular income tax) 90.0 9.0 8.1EITC 26.3 1.8 0.5
Phase-in 7.1 -24.2 -1.7Plateau 5.1 0 0Phaseout 14.1 15.4 2.2
Child tax credit 32.7 -7.3 -2.4Alternative minimum tax 10.0 25.5 2.6
Federal Payroll Taxes 98.9 12.2 12.1State Individual Income Taxes 60.8 4.3 2.6SNAP Benefits 18.1 25.4 4.6Interactions Among Tax Provisionsb 24.5 -0.7 -0.2
Average Marginal Tax Rate (Percent) n.a. n.a. 30.0
Memorandum:Share of Tax Filers Receiving Medicaid in 2006c 20.3 n.a. n.a.
Marginal statutory tax rate
Contribution to
(Percent)Returns Affected
(Percent)Those Affected
(Percentage points)Aggregate Marginal Rate
Share of Marginal Rate Effect for
Among nonelderly, nondisabled taxpayers with earnings, about 21 percent faced marginal rates below 20 percent, and 51 percent faced marginal rates of 30 percent or higher (see Figure 3). About 8 percent of taxpayers in this group faced marginal tax rates greater than 50 percent. If those marginal tax rates had included only federal income taxes, a larger share of taxpayers would have been subject to marginal tax rates below 20 percent. In particular, almost half of working taxpayers with income below
450 percent of FPL faced marginal federal income tax rates ranging from 10 percent to 19 percent.
To provide context for the marginal tax rates faced by this sample under 2012 law, CBO compared the distribution of marginal rates among the low- and moderate-income population to the distribution faced by higher-income taxpayers who met the other sample restrictions. About 90 percent of nonelderly, nondisabled taxpayers whose income was above 450 percent of FPL faced marginal tax

NOVEMBER 2012 EFFECTIVE MARGINAL TAX RATES FOR LOW- AND MODERATE-INCOME WORKERS 21
Table 4.
Distribution of Individual Income Tax Returns Filed by Low- and Moderate-Income Workers, by Statutory Marginal Tax Rate, Under 2012 Law(Percent)
Source: Congressional Budget Office.
Note: CBO’s simulations of tax liabilities were based on information from a public-use sample of federal individual income tax returns filed in 2006. The sample was restricted to taxpayers under the age of 65 who were not disabled, who had earnings in 2006, and whose adjusted gross income was below 450 percent of federal poverty guidelines. It was weighted to be representative of the population of tax filers.
rates of 30 percent to 49 percent (see Figure 4). Com-pared with higher-income taxpayers, a significantly larger share of taxpayers with income below 450 percent of FPL faced marginal tax rates below 30 percent. However, they were also slightly more likely to face high marginal tax rates: About 8 percent of taxpayers with income below 450 percent of FPL faced marginal tax rates exceeding 50 percent, compared with about 5 percent of higher-income taxpayers.
Distribution by Earnings Group Marginal rates vary across earnings groups for several rea-sons. First, statutory rates increase with income. Second, some provisions of the tax code apply only over certain income ranges. Third, marginal rates vary with earnings when other tax-related characteristics are correlated with earnings. For example, taxpayers with higher earnings tend to have more income from investments (which, by increasing AGI, generally increases the marginal rates on earnings) and more itemized deductions (which generally decrease marginal rates). Those higher-income taxpayers are also less likely to receive SNAP benefits. Marginal
Tax Rate
0 262536
3000
Alternative Minimum Tax 10____Total 100
Facing That Rate
Share of Federal
101525283335
Income Tax ReturnsStatutory Marginal
rates also vary within earnings groups because of differ-ences in eligibility for tax credits and SNAP benefits.
To examine how marginal tax rates on earnings vary among and within earnings groups, CBO grouped tax-payers in the sample on the basis of their family size and earnings relative to the federal poverty guidelines and analyzed the range of marginal rates within each group (less than 50 percent of FPL, 50 to 99 percent of FPL, 100 to 149 percent of FPL, and so on). Because the poverty guidelines increase with family size, two families with the same earnings could be in different groups.
Marginal tax rates generally increase as earnings relative to FPL increase (see Figure 5 on page 24). In the catego-ries below 150 percent of FPL, the median marginal rate increased sharply from 12 percent to 32 percent as earn-ings increased. The median marginal rate then stayed roughly constant in each category until earnings reached 350 percent of FPL, when it ticked up to 35 percent. That pattern is largely a reflection of the progressive nature of the federal income tax system.
Marginal rates varied widely among taxpayers in the sample who had similar earnings relative to the federal poverty guidelines, particularly among taxpayers with earnings under 200 percent of FPL. For example, among taxpayers with earnings below 50 percent of FPL, 43 percentage points separated the 10th percentile and the 90th percentile of marginal tax rates. However, among taxpayers with earnings above 200 percent of FPL, only about 16 percentage points separated the 10th and 90th percentiles.
Much of that variation was driven by the marginal rates found in the federal income tax system, particularly those arising from the phase-in and phaseout of the EITC. Taxpayers with large families faced marginal rates as low as -44 percent (the sum of the -45 percent EITC phase-in rate, the -15 percent refundable child tax credit rate, and 13.3 percent payroll tax rate, all adjusted as a share of total compensation). By contrast, single tax-payers without children who had comparable earnings relative to FPL faced rates as high as 53 percent (the sum of the 7.65 percent EITC phaseout rate, the 13.3 percent payroll tax rate, and the 36 percent reduction in SNAP, all adjusted as a share of total compensation). Taxpayers with higher earnings relative to FPL were ineligible for the EITC and SNAP, so there was less variation in mar-ginal rates after earnings exceeded 200 percent of FPL.
CBO

22 EFFECTIVE MARGINAL TAX RATES FOR LOW- AND MODERATE-INCOME WORKERS NOVEMBER 2012
CBO
Figure 3.
Share of Returns Filed by Low- and Moderate-Income Taxpayers, by Marginal Tax Rate, Under 2012 Law(Percentage of tax returns)
Source: Congressional Budget Office based on a public-use sample of tax returns from the Internal Revenue Service and survey data from the Census Bureau.
Notes: CBO’s simulations of tax liabilities and SNAP benefits were based on information from a public-use sample of income tax returns filed in 2006 supplemented with information from the 2007 Annual Social and Economic Supplement of the Current Population Survey and the 2006 American Community Survey. The sample was restricted to taxpayers under the age of 65 who were not disabled, who had earnings in 2006, and whose adjusted gross income was below 450 percent of federal poverty guidelines. It was weighted to be representative of the population of tax filers.
The simulated marginal tax rates include the combined effects of federal individual income taxes, state individual income taxes (under provisions in effect in 2006), federal payroll taxes, and the reduction in SNAP benefits. The simulated marginal tax rates were based on taxpayers’ total compensation before their employers’ share of payroll taxes was deducted.
SNAP = Supplemental Nutrition Assistance Program (formerly known as the Food Stamp program).
Below 0 0–9 10–19 20–29 30–39 40–49 50–59 60–69 70–79 80 or Above0
10
20
30
40
50
Marginal Tax Rate (Percent)
Effects of Federal Income Taxes Only
Combined Effects of Federal and StateIncome Taxes, Federal Payroll Taxes, and SNAP Benefits
Distribution by Family TypeMarginal tax rates vary on the basis of marital status and the presence of children in the family. Family composi-tion determines the taxpayer’s filing status: The number of children determines the amount of the EITC and its phase-in and phaseout rates, as well as the amount of the child tax credit and its phase-in rate. Although SNAP does not have any explicit provisions for children, the income tests for eligibility and the maximum benefit amount are based on family size. To see how marginal rates vary by family type, CBO categorized its sample of taxpayers into four groups on the basis of marital status and the presence of children in the household: married with children, married without children, single parent with children, and single taxpayer without children.24 Within each group, CBO then ranked each taxpayer by
the marginal tax rate incurred as a result of taxes and the phaseout of SNAP benefits.
The presence of children had a large effect on the varia-tion in marginal tax rates among single taxpayers (see Figure 6 on page 25), largely because of the EITC and child tax credit. (Among working taxpayers with children and income below 450 percent of FPL, almost all claimed at least one of the credits, and about one-third claimed both.) Among single parents with children in the sample,
24. For this analysis, taxpayers were considered to have children if they claimed a child dependent at home or a child for the EITC, or if they filed as a head of household but did not claim a depen-dent. (Under rules in effect in 2006, a single parent could claim head-of-household filing status when the taxpayer’s child lived with the taxpayer for over half the year but was claimed as a dependent by the noncustodial parent.)

NOVEMBER 2012 EFFECTIVE MARGINAL TAX RATES FOR LOW- AND MODERATE-INCOME WORKERS 23
Figure 4.
Share of Returns Filed by All Taxpayers, by Marginal Tax Rate, Under 2012 Law(Percentage of tax returns)
Source: Congressional Budget Office based on a public-use sample of tax returns from the Internal Revenue Service and survey data from the Census Bureau.
Notes: CBO’s simulations of tax liabilities and SNAP benefits were based on information from a public-use sample of income tax returns filed in 2006 supplemented with information from the 2007 Annual Social and Economic Supplement of the Current Population Survey and the 2006 American Community Survey. The sample was restricted to taxpayers under the age of 65 who were not disabled and who had earnings in 2006. It was weighted to be representative of the population of tax filers.
The simulated marginal tax rates include the combined effects of federal individual income taxes, state individual income taxes (under provisions in effect in 2006), federal payroll taxes, and the reduction in SNAP benefits. The simulated marginal tax rates were based on taxpayers’ total compensation before their employers’ share of payroll taxes was deducted.
FPL = federal poverty guidelines; SNAP = Supplemental Nutrition Assistance Program (formerly known as the Food Stamp program).
Below 0 0–9 10–19 20–29 30–39 40–49 50–59 60–69 70–79 80 or Above0
10
20
30
40
50
Marginal Tax Rate (Percent)
AGI Below 450 Percent of FPL
AGI Above 450 Percent of FPL
69 percentage points separated the 10th and 90th percen-tiles of marginal rates. In contrast, only about 31 percent-age points separated the 10th and 90th percentiles among single taxpayers without children in the sample. In com-parison with taxpayers with children, taxpayers without children faced less variation in their marginal tax rates because they could not claim the child tax credit and because the EITC phase-in and phaseout rates were lower for childless taxpayers (and applied over a narrower range of income). In addition, single parents with children were also more likely to receive SNAP, which increased their marginal tax rates and tended to increase variation in those rates.
Effective Marginal Tax Rates Under 2013 and 2014 LawTo illustrate the effects of legislative changes on marginal tax rates, CBO compared the marginal tax rates that a hypothetical single parent with one child would face under provisions of law in effect in 2012 with the rates he or she would face under provisions of law that are scheduled to go into effect in 2013 and 2014. (See the supplemental material accompanying this report for the marginal rates that would apply to other family types in 2013 and 2014.) CBO also simulated the distribution of marginal rates under provisions of 2013 and 2014 tax law using the same sample of 2006 tax returns that were used in the second portion of its analysis for 2012.
Example of Effective Marginal Tax Rates in 2013 Various provisions of the Tax Relief, Unemployment Insurance Reauthorization, and Job Creation Act of 2010
CBO

24 EFFECTIVE MARGINAL TAX RATES FOR LOW- AND MODERATE-INCOME WORKERS NOVEMBER 2012
CBO
Figure 5.
Distribution of Marginal Tax Rates, by Earnings Relative to Federal Poverty Guidelines, Under 2012 Law(Tax rate in percent)
Source: Congressional Budget Office based on a public-use sample of tax returns from the Internal Revenue Service and survey data from the Census Bureau.
Notes: CBO’s simulations of tax liabilities and SNAP benefits were based on information from a public-use sample of income tax returns filed in 2006 supplemented with information from the 2007 Annual Social and Economic Supplement of the Current Population Survey and the 2006 American Community Survey. The sample was restricted to taxpayers under the age of 65 who were not disabled, who had earnings in 2006, and whose adjusted gross income was below 450 percent of FPL. It was weighted to be representative of the population of tax filers.
The simulated marginal tax rates include the combined effects of federal individual income taxes, state individual income taxes (under provisions in effect in 2006), federal payroll taxes, and the reduction in SNAP benefits. The marginal tax rates were based on taxpayers’ total compensation before their employers’ share of payroll taxes was deducted.
The bold line in the center (the 50th percentile) represents the median marginal tax rate for a given earnings group. The area between the 25th and 75th percentiles is the range of tax rates that the middle half of tax returns in each group faces. The area between the 10th and 90th percentiles is the range of tax rates that the middle 80 percent of tax returns in each group faces.
FPL = federal poverty guidelines; SNAP = Supplemental Nutrition Assistance Program (formerly known as the Food Stamp program).
0–49 50–99 100–149 150–199 200–249 250–299 300–349 350–399 400+-10
0
10
20
30
40
50
60
70
Earnings as a Percentage of FPL
10th Percentile25th Percentile
Median75th Percentile
90th Percentile
(referred to in this report as the 2010 tax act) are sched-uled to expire at the end of 2012. The 2010 tax act temporarily extended several tax provisions that reduced individual income tax rates and increased certain tax credits and deductions that had originally been enacted in the Economic Growth and Tax Relief Reconciliation Act of 2001 (EGTRRA), the Jobs and Growth Tax Relief Reconciliation Act of 2003 (JGTRRA), and the Ameri-can Recovery and Reinvestment Act of 2009 (ARRA). In 2013, the affected provisions will revert to those in effect before 2001. As a result:
The 10 percent bracket will be repealed, and other statutory income tax rates will be 15, 28, 31, 36, and 39.6 percent.
The standard deduction for married couples filing jointly will be reduced—declining from 200 percent to 167 percent of the deduction for single filers. The range of incomes included in the 15 percent bracket will also be narrowed for joint filers.
The child tax credit will be reduced from $1,000 to $500 for each child, and eligibility for the refundable

NOVEMBER 2012 EFFECTIVE MARGINAL TAX RATES FOR LOW- AND MODERATE-INCOME WORKERS 25
Figure 6.
Distribution of Marginal Tax Rates, by Taxpayer Characteristics, Under 2012 Law(Tax rate in percent)
Source: Congressional Budget Office based on a public-use sample of tax returns from the Internal Revenue Service and survey data from the Census Bureau.
Notes: CBO’s simulations of tax liabilities and SNAP benefits were based on information from a public-use sample of income tax returns filed in 2006 supplemented with information from the 2007 Annual Social and Economic Supplement of the Current Population Survey and the 2006 American Community Survey. The sample was restricted to taxpayers under the age of 65 who were not disabled, who had earnings in 2006, and whose adjusted gross income was below 450 percent of federal poverty guidelines. It was weighted to be representative of the population of tax filers.
The simulated marginal tax rates include the combined effects of federal individual income taxes, state individual income taxes (under provisions in effect in 2006), federal payroll taxes, and the reduction in SNAP benefits. The simulated marginal tax rates were based on taxpayers’ total compensation before their employers’ share of payroll taxes was deducted.
SNAP = Supplemental Nutrition Assistance Program (formerly known as the Food Stamp program).
ÿÿ
ÿÿ
Married CoupleWith Children
Married CoupleWith No Children
Single ParentWith Children
Single Taxpayer With No Children
-10
0
10
20
30
40
50
60
70
75thPercentile
Median25th
Percentile
10th to 90thPercentile
portion of the credit will be limited to taxpayers with three or more children.
The value of the EITC will no longer be higher for married couples than it is for unmarried filers with the same number of children and level of earnings. The credit amount will be the same for families with two children and for those with three or more children.
Refundable tax credits—including the EITC and the refundable portion of the child tax credit—will be reduced by the taxpayer’s AMT liability.
Because of those changes, marginal tax rates will generally rise at the end of 2012.
The 2010 tax act also reduced the employee’s share of the OASDI tax to 4.2 percent through 2011. That reduced rate was extended until the end of 2012 by the Middle Class Tax Relief and Job Creation Act of 2012. Beginning in 2013, the employee’s share will return to 6.2 percent.
For a single parent with income below 450 percent of FPL and one child, marginal tax rates in some income ranges will be higher in 2013 than they are in 2012 because the refundable child tax credit will be restricted to filers with three or more children and the 10 percent statutory bracket will expire (see the top panel of Figure 7). The restricted eligibility for the refundable child tax credit will increase the marginal tax rate for filers with income between $3,100 and $9,400, from -49 percent to -34 percent (corresponding to their EITC
CBO

26 EFFECTIVE MARGINAL TAX RATES FOR LOW- AND MODERATE-INCOME WORKERS NOVEMBER 2012
CBO
Figure 7.
Marginal Tax Rates for a Hypothetical Single Parent with One Child, by Earnings, Between 2012 and 2014(Tax rate in percent)
Under the Federal Individual Income Tax System
Under the System of Taxes and Transfers
Source: Congressional Budget Office.
Notes: This example assumes that the taxpayer files as a head of household (an unmarried individual who covers most of the cost of maintaining a household for his or her dependents), has one child, and qualifies for both the EITC and the CTC; that all income is from wages, salaries, or net earnings from self-employment (otherwise described as earnings); and that the taxpayer has itemized deductions worth 18 percent of income and claims the greater of those deductions or the standard deduction. (Forty percent of the itemized deductions are assumed to be state and local taxes, and the rest are charitable contributions and mortgage interest.) It also assumes that the state expands Medicaid in 2014 as originally specified in the Affordable Care Act (ACA) to cover individuals with income up to 138 percent of FPL. The ACA comprises the Patient Protection and Affordable Care Act (Public Law 111-148) and the health care provisions of the Health Care and Education Reconciliation Act of 2010 (P.L. 111-152).
The simulated marginal tax rates were based on taxpayers’ total compensation before their employers’ share of payroll taxes was deducted. The marginal rate increase associated with the “cliff” in premium assistance credits, which occurs at 400 percent of FPL, is not shown. Cost-sharing subsidies are not illustrated in the second panel.Marginal rates including transfer programs calculated using stylized program rules under 2012 law (see the notes to Figure 2). Dotted lines indicate income limits for Medicaid (under 2012 and 2014 law) and CHIP (under 2012 law) where taxpayers face cliffs. Similar spikes in marginal tax rates when the taxpayer loses eligibility for TANF and SNAP are not illustrated.EITC = earned income tax credit; AMT = alternative minimum tax; CTC = child tax credit; FPL = federal poverty guidelines; SNAP = Supplemental Nutrition Assistance Program (formerly known as the Food Stamp program); TANF = Temporary Assistance for Needy Families; CHIP = Children’s Health Insurance Program.
0 10,000 20,000 30,000 40,000 50,000 60,000 70,000-60
-40
-20
0
20
40
60
80
100
Earnings (Dollars)
0 50 100 150 200 250 300 350 400 450
2012
2013
2014
EITCPhase-In(-34%)
EITC Plateau (0%)EITC
Phaseout(-15.98%)
Premium Assistance Credits
15% Statutory Bracket
26% AMT
EITC Phaseout and15% Statutory Bracket
(30.98%)
0 10,000 20,000 30,000 40,000 50,000 60,000 70,000-60
-40
-20
0
20
40
60
80
100
Earnings (Dollars)
0 50 100 150 200 250 300 350 400 450
Medicaid:Income Limitfor Parentin 2012
CHIP:Income Limit
for FreeCoverage
in 2012
2012
2013
2014
Medicaid:Income Limit
for Parentin 2014
CHIP:Income Limit
for Reduced-CostCoverage in 2012

NOVEMBER 2012 EFFECTIVE MARGINAL TAX RATES FOR LOW- AND MODERATE-INCOME WORKERS 27
phase-in rate). The expiration of the 10 percent statutory bracket will increase marginal tax rates for taxpayers with income between $20,000 and $28,700 by 5 percentage points, to 30.98 percent in 2013. After accounting for state income taxes, federal payroll taxes, and means-tested transfers, a hypothetical single parent with income below 450 percent of FPL and one child will face marginal tax rates between 29 percent and 84 percent (see the lower panel of Figure 7).
Example of Effective Marginal Tax Rates in 2014Starting in 2014, some low- and moderate-income fami-lies will become eligible for additional assistance with health insurance costs when certain provisions of the Affordable Care Act (ACA) are implemented.25 States will have the option of expanding Medicaid eligibility to individuals with income below 138 percent of FPL.26 In addition, taxpayers who do not have other health insur-ance and whose income is between 100 percent and 400 percent of FPL will be eligible for refundable tax credits to assist with the purchase of health insurance through newly created exchanges. The amount of that credit will equal the difference between the premium for a qualifying plan and the required family contribution; that required contribution will rise as the taxpayer’s income increases, causing the dollar value of the credit to fall. Also, some of those taxpayers will qualify for cost-sharing subsidies, which also decrease as income rises, to reduce out-of-pocket expenditures.27 (For more details about the provisions of the ACA, see Appendix A.)
That expansion of subsidized health insurance will reduce marginal tax rates for some people and increase them for others. In states that choose to expand Medicaid benefits,
25. The Affordable Care Act comprises the Patient Protection and Affordable Care Act and the health care provisions of the Health Care and Education Reconciliation Act of 2010.
26. Much uncertainty surrounds the expansion of Medicaid, which is scheduled to go into effect in 2014 under the ACA. See Congressional Budget Office, Estimates for the Insurance Coverage Provisions of the Affordable Care Act Updated for the Recent Supreme Court Decision (July 2012).
27. Unlike the premium assistance credits, the cost-sharing subsidies are not provided through the individual income tax code. Although cost-sharing subsidies affect marginal tax rates, they are not included in the marginal federal income tax rate.
families with very low income will no longer face the Medicaid cliff until the taxpayer’s income exceeds a higher threshold than applies today, up to 138 percent of FPL. Families who lose eligibility for Medicaid and whose income is above 100 percent of FPL will be able to shift to the premium assistance credits—protecting them from the cliff as health benefits phase out more gradually. For other individuals, however, the exchange subsidies (both premium assistance credits and cost-sharing subsi-dies) will increase their marginal tax rates—because of the gradual phaseouts of the exchange subsidies as income rises above 100 percent and as a result of the cliffs that will occur when people are no longer eligible for assis-tance with the cost of health insurance. (Eligibility for cost-sharing subsidies ceases at 250 percent of FPL and for premium assistance credits at 400 percent of FPL.)
In states that expand Medicaid fully to 138 percent of FPL, the introduction of premium assistance credits in 2014 will increase marginal tax rates for single parents with one child whose income is between $21,500 and $62,300, which corresponds to 138 percent and 400 per-cent of FPL for a household of two (see the top panel of Figure 7). Over that income range, marginal tax rates will increase by 9.5 to 18.2 percentage points. Because the premium assistance credits will start in the EITC phaseout range, marginal federal income tax rates can be expected to increase from 31 percent to as much as 47 percent (the premium assistance credits add 17 per-centage points) when the taxpayer’s income is between $21,500 and $38,300. (In the upper panel of Figure 7, the inclusion of premium assistance credits creates a jagged appearance in the marginal rates because the family’s required contribution increases throughout the income range; within each bracket of the credit schedule, the percentage contributed by the taxpayer grows at a different rate.) For taxpayers claiming TANF, housing, and SNAP benefits, marginal tax rates under the tax and transfer systems will range between 29 percent and 88 percent (see lower panel of Figure 7).
Overall DistributionIncorporating the effects of all applicable taxes and SNAP benefits, the marginal tax rate for filers in the sample could be expected to increase, on average, from
CBO

28 EFFECTIVE MARGINAL TAX RATES FOR LOW- AND MODERATE-INCOME WORKERS NOVEMBER 2012
CBO
30 percent under 2012 law to 32 percent under 2013 law. That rate would increase to 35 percent under 2014 law.28
As a result of higher tax liabilities under the regular income tax system, a slightly larger share of filers in the sample with income below 450 percent of FPL would be subject to the regular income tax under 2013 law instead
28. The distributional analysis of marginal tax rates under 2014 law was undertaken before the Supreme Court ruled on the constitutionality of the ACA. As a result, the analysis reflects the assumption that all states expand Medicaid as specified originally in the ACA. The analysis also reflects the assumption that the share of the population receiving exchange subsidies under 2014 law will be the same as the projected share of the population receiving subsidies in 2017 if all states expand Medicaid as specified originally in the ACA (see Congressional Budget Office, Updated Estimates for the Insurance Coverage Provisions of the Affordable Care Act, March 2012). Following the recent Supreme Court decision giving states the option to expand Medicaid, some individuals whose income is between 100 percent and 138 percent of FPL would probably be eligible for exchange subsidies instead of Medicaid (see Congressional Budget Office, Estimates for the Insurance Coverage Provisions of the Affordable Care Act Updated for the Recent Supreme Court Decision, July 2012). Because those individuals represent a small share of the total population receiving the subsidies in 2017 and most of them would face only a 2 percentage-point increase in their marginal tax rates from the premium assistance credits, including those additional subsidies would not significantly change the estimated distribution of marginal tax rates.
of the AMT. Statutory rates contribute 10 percentage points to marginal tax rates under 2013 law, an increase from 8 percentage points under 2012 law (see Table 5). Combined with other provisions, federal individual income taxes would add 12 percentage points to marginal tax rates, on average. Marginal tax rates vary substantially across the range of income and for taxpayers with similar earnings relative to FPL.
Under 2014 law, federal income taxes would contribute 13 percentage points to the average marginal tax rate (see Table 6). CBO estimates that about 11 percent of nonelderly, nondisabled working taxpayers with income below 450 percent of FPL would receive the premium assistance credits; the rest either would not meet the income requirements or would receive health insurance through Medicaid or another plan. The premium assis-tance credits will increase recipients’ marginal tax rates by an average of 12 percentage points and the overall marginal rate by 1 percentage point. As under 2012 law, taxpayers with lower earnings relative to FPL would experience greater variation in marginal tax rates than taxpayers with higher earnings relative to FPL (see Figure 8). However, the range between marginal tax rates in the 10th to 90th percentiles under 2014 law would be slightly higher than the range under 2012 law because of the increases in marginal tax rates that will result when the higher payroll tax rate is reinstated, the 2010 tax act expires, and premium assistance credits are implemented.

NOVEMBER 2012 EFFECTIVE MARGINAL TAX RATES FOR LOW- AND MODERATE-INCOME WORKERS 29
Table 5.
Contributions of Tax Provisions and SNAP Benefits to the Marginal Tax Rates of Low- and Moderate-Income Workers Under Provisions of Law in Effect in 2013
Source: Congressional Budget Office based on a public-use sample of tax returns from the Internal Revenue Service and survey data from the Census Bureau.
Notes: CBO’s simulations of tax liabilities and SNAP benefits were based on information from a public-use sample of income tax returns filed in 2006 supplemented with information from the 2007 Annual Social and Economic Supplement of the Current Population Survey and the 2006 American Community Survey. The sample was restricted to taxpayers under the age of 65 who were not disabled, who had earnings in 2006, and whose adjusted gross income was below 450 percent of federal poverty guidelines. It was weighted to be representative of the population of tax filers.
The simulated marginal tax rates were based on taxpayers’ total compensation before their employers’ share of payroll taxes was deducted.
EITC = earned income tax credit; SNAP = Supplemental Nutrition Assistance Program (formerly known as the Food Stamp program); n.a. = not applicable.
a. Provisions of the federal individual income tax do not add up to the marginal federal individual income tax rate because not all provisions of the tax code are shown.
b. Accounts for the deductibility of state individual income taxes on federal individual income tax returns for people who itemize.
Federal Individual Income Taxesa 100.0 11.7 11.7
(Regular income tax) 93.6 10.5 9.9EITC 25.8 1.8 0.5
Phase-in 7.3 -23.8 -1.7Plateau 4.1 0 0Phaseout 14.4 15.3 2.2
Child tax credit 21.2 -0.9 -0.2Alternative minimum tax 6.4 25.6 1.6
Federal Payroll Taxes 98.9 13.9 13.7State Individual Income Taxes 60.8 4.3 2.6SNAP Benefits 17.7 25.2 4.5Interactions Among Tax Provisionsb 23.3 -0.7 -0.2
Average Marginal Tax Rate (Percent) n.a. n.a. 32.4
Returns Affected Those Affected Aggregate Marginal Rate(Percent) (Percent) (Percentage points)
Marginal statutory tax rate
Contribution toShare of Marginal Rate Effect for
CBO

30 EFFECTIVE MARGINAL TAX RATES FOR LOW- AND MODERATE-INCOME WORKERS NOVEMBER 2012
CBO
Table 6.
Contributions of Tax Provisions and SNAP Benefits to the Marginal Tax Rates of Low- and Moderate-Income Workers Under Provisions of Law in Effect in 2014
Source: Congressional Budget Office based on a public-use sample of tax returns from the Internal Revenue Service and survey data from the Census Bureau.
Notes: CBO’s simulations of tax liabilities and SNAP benefits were based on information from a public-use sample of income tax returns filed in 2006 supplemented with information from the 2007 Annual Social and Economic Supplement of the Current Population Survey and the 2006 American Community Survey. The sample was restricted to taxpayers under the age of 65 who were not disabled, who had earnings in 2006, and whose adjusted gross income was below 450 percent of FPL. It was weighted to be representative of the population of tax filers.
The simulated marginal tax rates were based on taxpayers’ total compensation before their employers' share of payroll taxes was deducted.
CBO assumes that states expand Medicaid as originally specified in the Affordable Care Act (ACA) to cover individuals with income up to 138 percent of FPL. The ACA comprises the Patient Protection and Affordable Care Act (Public Law 111-148) and the health care provisions of the Health Care and Education Reconciliation Act of 2010 (P.L. 111-152).
EITC = earned income tax credit; SNAP = Supplemental Nutrition Assistance Program (formerly known as the Food Stamp program); FPL = federal poverty guidelines; n.a. = not applicable.
a. Provisions of the federal individual income tax do not add up to the marginal federal individual income tax rate because not all provisions of the tax code are shown.
b. Accounts for the deductibility of state income taxes on federal income tax returns for people who itemize.
Federal Individual Income Taxesa 100.0 13.0 13.4
(Regular income tax) 92.7 10.6 9.9EITC 25.6 2.4 0.6
Phase-in 6.9 -23.4 -1.6Plateau 4.1 0 0Phaseout 14.5 15.4 2.2
Child tax credit 20.9 -0.8 -0.2Premium assistance credits 10.7 12.4 1.3Alternative minimum tax 7.3 25.6 1.9
Federal Payroll Taxes 98.9 13.9 13.8State Individual Income Taxes 60.6 4.3 2.6SNAP Benefits 17.3 24.3 4.2Cost-Sharing Subsidy 7.4 13.0 1.0Interactions Among Tax Provisionsb 24.6 -0.7 -0.2
Average Marginal Tax Rate (Percent) n.a. n.a. 34.8
Share ofThose Affected Aggregate Marginal Rate
(Percent) (Percent) (Percentage points)
Marginal statutory tax rate
Returns AffectedMarginal Rate Effect for Contribution to

NOVEMBER 2012 EFFECTIVE MARGINAL TAX RATES FOR LOW- AND MODERATE-INCOME WORKERS 31
Figure 8.
Distribution of Marginal Tax Rates, by Earnings Relative to Federal Poverty Guidelines, Under 2014 Law(Tax rate in percent)
Source: Congressional Budget Office based on a public-use sample of tax returns from the Internal Revenue Service and survey data from the Census Bureau.
Notes: CBO’s simulations of tax liabilities and SNAP benefits were based on information from a public-use sample of income tax returns filed in 2006 supplemented with information from the 2007 Annual Social and Economic Supplement of the Current Population Survey and the 2006 American Community Survey. The sample was restricted to taxpayers under the age of 65 who were not disabled, who had earnings in 2006, and whose adjusted gross income was below 450 percent of FPL. It was weighted to be representative of the population of tax filers.
The simulated marginal tax rates include the combined effects of federal individual income taxes (under provisions scheduled to go into effect in 2014), state individual income taxes (under provisions in effect in 2006), federal payroll taxes, and the reduction in benefits provided through SNAP and cost-sharing subsidies. CBO assumes states expand Medicaid as originally specified in the Affordable Care Act to cover individuals with income up to 138 percent of FPL. The simulated marginal tax rates were based on tax-payers’ total compensation before their employers’ share of payroll taxes was deducted.
The bold line in the center (the 50th percentile) represents the median marginal tax rate for a given earnings group, weighted by returns. The area between the 25th and 75th percentiles is the range of tax rates that the middle half of tax returns in each group faces. The area between the 10th and 90th percentiles is the range of tax rates that the middle 80 percent of tax returns in each group faces.
FPL = federal poverty guidelines; SNAP = Supplemental Nutrition Assistance Program (formerly known as the Food Stamp program).
0–49 50–99 100–149 150–199 200–249 250–299 300–349 350–399 400+-10
0
10
20
30
40
50
60
70
10th Percentile
25th Percentile
Median
75th Percentile
90th Percentile
10th to 90thPercentileUnder2012 Law
Earnings as a Percentage of FPL
CBO


Appendix A: Tax Provisions and Benefit Programs Affecting Effective Marginal Tax Rates
In this appendix, the Congressional Budget Office (CBO) provides additional details about some provisions of the federal income tax system and features of means-tested transfer programs that contribute to marginal tax rates on earnings. Benefits available through the tax system include the earned income tax credit (EITC) and the child tax credit, both of which help reduce the tax burden of low- and moderate-income families. As earn-ings increase, those benefits phase out or cease, and individuals face greater tax liability. At higher levels of earnings, those individuals can even become subject to the alternative minimum tax (AMT), which is another way of computing federal tax liability, with its own definition of taxable income and rate structure. Outside of the tax system, assistance is available to families of low and moderate income through various transfer programs, including Temporary Assistance for Needy Families (TANF), the Housing Choice Voucher Program, and the Supplemental Nutrition Assistance Program (SNAP, formerly known as the Food Stamp program). This appendix also discusses health insurance benefits provided through Medicaid and the Children’s Health Insurance Program (CHIP) as well as the health insur-ance cost-sharing subsidies and premium assistance credits that will be implemented in 2014 under the Affordable Care Act.1
Earned Income Tax CreditEligibility for the earned income tax credit is based on several factors, including the taxpayer’s earnings (or, if it is larger, his or her adjusted gross income) and the
1. The Affordable Care Act comprises the Patient Protection and Affordable Care Act and the health care provisions of the Health Care and Education Reconciliation Act of 2010.
number of qualifying children the taxpayer claims. Earnings include wages, salaries, and net earnings from self-employment. Adjusted gross income (AGI) includes earnings and other income from taxable sources (such as investment income) net of certain deductions. For purposes of the EITC, qualifying children must meet requirements related to age, relationship to taxpayer, residency, and tax filing.
The credit is refundable; in other words, if the amount of the credit exceeds the taxpayer’s other income tax liability, the excess is paid as a refund. The main features of the EITC—the rate at which it phases in and out, the maxi-mum amount of the credit, and the income thresholds that define the phase-in and phaseout ranges—depend on whether the taxpayer has no children, one child, two chil-dren, or three or more children (see Table A-1). Those features are generally the same for taxpayers who file sin-gly, jointly, or as head of household (with the exception that the income level at which the EITC begins to phase out is currently higher for married couples filing jointly).
The EITC dramatically alters marginal tax rates for some taxpayers who claim it, especially those with children. For individuals with income in the credit’s phase-in range, marginal rates fall below statutory rates, usually to nega-tive levels. (Statutory income tax rates are specified in law and apply to the last dollar of earnings.) In such instances, for each additional dollar earned, taxpayers receive additional money back from the government. Throughout the plateau—the income range between the two thresholds wherein taxpayers receive the maximum credit—the EITC has no effect on marginal tax rates. In the phaseout range, taxpayers’ marginal rate exceeds their statutory rate by the phaseout rate.
CBO

34 EFFECTIVE MARGINAL TAX RATES FOR LOW- AND MODERATE-INCOME WORKERS NOVEMBER 2012
CBO
Table A-1.
Schedule for the Earned Income Tax Credit, by the Taxpayer’s Number of Qualifying Children, 2012
Source: Internal Revenue Service.
Note: For the purposes of the earned income tax credit, qualifying children must meet requirements related to age, relationship to the taxpayer, residency, and tax filing.
a. Thresholds for married couples who file joint returns are $5,210 higher than the amounts indicated here.
Number ofChildren
0 7.65 6,210 475 7,770 7.65 13,9801 34 9,320 3,169 17,090 15.98 36,9202 40 13,090 5,236 17,090 21.06 41,9523 or More 45 13,090 5,891 17,090 21.06 45,060
Phaseout RangeaRate Phase-In Range Credit Phaseout Rangea Rate(Percent) (Percent)(Dollars) (Dollars) (Dollars) (Dollars)
End of Maximum Phase-In Start of Phaseout End of
Child Tax CreditTaxpayers can claim a partially refundable credit of up to $1,000 for each child under the age of 17. In 2012, individuals whose tax liability before applying some tax credits is less than the value of the child tax credit can receive a refundable credit equal to 15 percent of their earnings above $3,000. Between that threshold and the income level at which other income tax liability exceeds the value of the child tax credit, an additional dollar of income increases the credit by 15 cents, lowering the marginal tax rate by 15 percentage points. Alternatively, taxpayers who have three or more children can calculate the refundable portion of their credit as the amount by which their share of payroll taxes (for Social Security and Medicare) exceeds the EITC and take the higher of the two refundable amounts. For taxpayers who take the refundable portion calculated in this manner, their marginal rate decreases by the difference between their payroll tax rate and the marginal rate from the EITC.
The child tax credit phases out at a rate of 5 percent for taxpayers whose income exceeds a certain threshold. (In 2012, the thresholds are $75,000 for unmarried tax-payers and $110,000 for married taxpayers filing jointly.) For taxpayers in those income ranges, the phaseout of the child tax credit increases their marginal rate by 5 percentage points.
Alternative Minimum TaxThe individual alternative minimum tax is another method of computing federal income tax liability. To
determine whether a taxpayer is subject to the AMT or to the regular income tax, the individual must recalculate his or her taxable income without subtracting certain items that are typically allowed under the regular income tax. Those items include the deduction for state and local taxes, personal exemptions, and the standard deduction. Instead, a taxpayer subtracts an AMT exemption. He or she then pays the higher of their AMT liability or liability under the regular individual income tax.
Income calculated under the AMT is taxed at two rates: 26 percent on the first $175,000; and 28 percent on any-thing above that amount. At higher levels of income, the AMT exemption phases out at a rate of 25 percent, which increases marginal rates under the AMT to 32.5 percent and 35 percent.
Under current law, the AMT’s reach will expand rapidly over time as rising incomes push more taxpayers onto its rolls. A temporary increase in the AMT exemption expired at the end of 2011. As a result, beginning in 2012, the AMT exemption levels decreased from $48,450 to $33,750 for unmarried tax filers and from $74,450 to $45,000 for married couples filing jointly.
Another provision of law that went into effect at the beginning of 2012 meant that taxpayers could no longer benefit from most personal nonrefundable credits if those credits made individual income tax liability less than it would be under the AMT. However, they could still use the EITC and the child tax credit to reduce their AMT liability through the end of 2012.

APPENDIX A EFFECTIVE MARGINAL TAX RATES FOR LOW- AND MODERATE-INCOME WORKERS 35
Temporary Assistance for Needy FamiliesThe Temporary Assistance for Needy Families program provides cash assistance and in-kind benefits (including child care, transportation to work, and job training) to low-income families with children. (In its analysis, when examining the effects of TANF benefits on marginal tax rates, CBO focused on cash assistance only.) Because states administer TANF funds, the rules governing eligi-bility and benefit amounts vary widely. Childless adults are generally ineligible for TANF benefits, as are families whose income or assets are above given thresholds. Each state determines which types of assets and which sources of income are counted and where to set the thresholds for each. For participants, benefits change as income changes. Eligibility often depends on nonfinancial char-acteristics as well; for example, the TANF program limits the length of time a family can receive assistance.
In fiscal year 2011, federal spending on TANF was about $18 billion (including both cash assistance and in-kind benefits). In an average month, 1.9 million families, con-sisting of 4.4 million people, received cash assistance. The contribution of TANF to marginal tax rates among low- and moderate-income workers is likely to be limited. The Department of Health and Human Services estimates that in 2005, roughly half of TANF recipients did not have any family member who was employed. Estimating how many families are actually eligible for TANF is more difficult than determining how many families participate in the program and receive benefits. According to one estimate, though, approximately 40 percent of the families who were eligible for TANF benefits in 2005 received them.2
Housing Choice Voucher Program The Department of Housing and Urban Development funds the Housing Choice Voucher Program, which is also known as Section 8 because of its location in the legislation authorizing it. The Housing Choice Voucher Program provides subsidies to low- and moderate-income families who rent housing in the private market. For a family to qualify, the household’s annual gross income—
2. For complete details, see Department of Health and Human Services, Office of the Assistant Secretary for Planning and Evaluation, Indicators of Welfare Dependence, Annual Report to Congress (2008), http://aspe.hhs.gov/hsp/indicators08/index.shtml.
consisting of income (including TANF benefits) received by all members of the household, with some excep-tions—must be less than 50 percent of the median family income in the area where the family lives. Priority is given to households with income under 30 percent of the area’s median family income.
The monthly subsidy is equal to the difference between a “reference rent,” known as the fair-market rent (typically the 40th percentile of rent in the area), and the family’s required contribution. The reference rent is adjusted for the size of the housing unit considered appropriate for the household. The family’s required contribution is whichever amount is greater: 30 percent of the house-hold’s monthly net income; 10 percent of the household’s monthly gross income; or the minimum rent set by the public housing agency. (Net income is equal to gross income minus deductions for household members who are dependents, elderly or disabled, or for certain expenses, such as medical or child care.) Recipients of housing vouchers who claim the deduction for depen-dents face a marginal tax rate of 10 percent at the lowest levels of income and 30 percent at higher income levels.
In fiscal year 2011, 2.2 million households received benefits through the Housing Choice Voucher Program. Federal spending on housing vouchers totaled about $19 billion. Demand for housing vouchers often exceeds the available funding, and public housing agencies com-monly maintain waiting lists. One-third of participating households had earnings; the others either did not have any income or only had unearned income.
Supplemental Nutrition Assistance ProgramThe Supplemental Nutrition Assistance Program provides benefits to households for purchasing food. Eligibility is determined on the basis of participation in other federal or state programs (known as categorical eligibility) or a household’s financial circumstances. To determine eligibility on the basis of financial circum-stances, the income of all household members is combined to obtain monthly gross income. Various deductions are subtracted from that total to calculate monthly net income. SNAP allows a standard deduction that is based on household size, as well as deductions for 20 percent of earnings, dependent care expenses, medical expenses, and high housing costs. The housing cost deduction (known as the excess shelter cost deduction) is
CBO

36 EFFECTIVE MARGINAL TAX RATES FOR LOW- AND MODERATE-INCOME WORKERS NOVEMBER 2012
CBO
equal, at most, to housing costs exceeding 50 percent of income after claiming other deductions. Housing costs include only what the individual pays and not the amount paid by a third party or through housing assistance (such as a housing voucher).
Typically, the household must meet an asset test and two income tests. Households without elderly or disabled members can have $2,000 in countable resources, and some assets (such as the value of the home and, in most states, the value of vehicles) are not included. On a monthly basis, gross income cannot exceed 130 percent of federal poverty guidelines (commonly known as the federal poverty level, so abbreviated as FPL), and net income cannot exceed 100 percent of FPL. Able-bodied adults who do not work and have no dependents face time limits on assistance. In recent years, most states have expanded the classification of households deemed cate-gorically eligible; those households are subject to higher gross income limits or are exempt from asset and one or both income tests.
A household’s monthly SNAP benefit is the difference between the maximum benefit on the basis of household size and 30 percent of the household’s net income. (A minimum benefit exists for households with fewer than three members; in fiscal year 2012, it is $16.) In calculat-ing a household’s SNAP benefit, program administrators include TANF and Supplemental Security Income bene-fits in income. The income range over which SNAP ben-efits phase out depends on the household’s characteristics, such as its size, whether there is an elderly or disabled member, whether the household is categorically eligible, and whether it incurs expenses that can be deducted. (Benefits for categorically eligible households are based on their net income, as is the case with other households.) At very low levels of income, an additional dollar of earn-ings will not reduce benefits because the deductions exempt a certain amount of income from the benefit cal-culation. At higher levels of income, an additional dollar of earnings reduces benefits by 36 cents (if the household can claim the housing cost deduction) or 24 cents (if there is no change in the housing cost deduction). About 70 percent of households receiving SNAP benefits claim the excess shelter deduction. SNAP benefits increase gross monthly income, on average, by 39 percent for all participants.3
In fiscal year 2011, an average of 45 million individuals received SNAP benefits each month. Federal expendi-tures totaled $78 billion, including administrative expenses. Both participation and spending were the high-est they have ever been. About 30 percent of households receiving SNAP had earnings; the rest had no income or unearned income only. About 72 percent of individuals eligible for SNAP and 60 percent of eligible individuals in households with earnings received SNAP benefits.4
Medicaid and CHIPSome low-income individuals receive health insurance coverage through Medicaid or the Children’s Health Insurance Program, which are funded at both the federal and the state level.5 (CHIP provides health insurance to children whose families have income that exceeds Medicaid’s income thresholds but is below CHIP’s income thresholds.) States administer their Medicaid and CHIP programs under federal guidelines that specify a minimum set of services that must be provided to certain categories of low-income individuals. To be eligible for Medicaid, a person must have a low income and generally only minimal assets—although the financial limits vary, depending on the basis for an enrollee’s eligibility. Groups that must be eligible include children and families who would have qualified for the former Aid to Families with Dependent Children program, certain other low-income children and pregnant women, and most elderly and dis-abled individuals who qualify for Supplemental Security Income. States have flexibility to provide additional benefits and extend eligibility to additional categories of people. Most children in families with income under 200 percent of FPL are eligible for Medicaid or CHIP, but their parents are generally not eligible unless their income is well below that level. (States typically disregard some portion of earnings, so income limits are effectively higher for employed parents than for unemployed parents.) Childless adults are generally ineligible for Medicaid unless they are disabled, pregnant, or elderly.
3. See Congressional Budget Office, The Supplemental Nutrition Assistance Program (April 2012).
4. See Joshua Leftin, Esa Eslami, and Mark Strayer, Trends in Supplemental Nutrition Assistance Program Participation Rates: 2002 to 2009 (reported submitted by Mathematica Policy Research, Inc., to the Department of Agriculture, August 2011).
5. See Congressional Budget Office, The 2012 Long-Term Budget Outlook (June 2012), for more information about Medicaid and CHIP.

APPENDIX A EFFECTIVE MARGINAL TAX RATES FOR LOW- AND MODERATE-INCOME WORKERS 37
In fiscal year 2011, CBO estimates, an average of 56 mil-lion individuals received Medicaid benefits each month. Federal expenditures on Medicaid and CHIP totaled about $275 billion and $9 billion, respectively. The largest share of Medicaid spending reimbursed care for recipients who were elderly, blind, or disabled.
Expanded Medicaid Eligibility and New Health Insurance Subsidies in 2014Certain provisions of the Affordable Care Act will affect marginal tax rates starting in 2014. That legislation will expand eligibility for Medicaid and provide some low- and moderate-income individuals and families with subsidies for purchasing health insurance in the form of refundable premium assistance tax credits and cost-sharing subsidies.
Taxpayers whose modified adjusted gross income (MAGI)—AGI plus tax-exempt interest and income earned abroad—is under 138 percent of the federal poverty guidelines will be eligible for health insurance through Medicaid in states that choose to expand their Medicaid program.6 Taxpayers with MAGI between 100 percent and 400 percent of FPL will potentially be eligible for premium assistance credits to help with the costs of insurance purchased through the newly created exchanges in each state that will link people with insur-ance plans. Generally, individuals eligible for other health insurance coverage (through Medicare, Medicaid, or an employment-based plan) will not be able to receive these credits. Individuals who are eligible for an employment-based plan that is deemed unaffordable, however, can receive the premium assistance credits.
The premium assistance credit equals the difference between the reference premium in the locality and the household’s contribution, which is a percentage of the taxpayer’s income.7 In 2014, the percentages will be as follows:
6. The Patient Protection and Affordable Care Act expands Medicaid eligibility to taxpayers with income up to 133 percent of FPL, and the health care provisions of the Health Care and Education Reconciliation Act of 2010 disregard income up to 5 percent of FPL in determining eligibility. Consequently, taxpayers with income up to 138 percent of FPL will be eligible for Medicaid in states that choose to expand their Medicaid program.
2 percent for households with income between 100 percent and 133 percent of FPL;
3 percent to 4 percent for households with income between 133 percent and 150 percent of FPL;
4 percent to 6.3 percent for households with income between 150 percent and 200 percent of FPL;
6.3 percent to 8.05 percent for households with income between 200 percent and 250 percent of FPL;
8.05 percent to 9.5 percent for households with income between 250 percent and 300 percent of FPL; and
9.5 percent for households with income between 300 percent and 400 percent of FPL.
Within each bracket, a household’s contribution toward premiums is based on the household’s income relative to the bracket’s start and end points. For example, a house-hold with income that is 175 percent of FPL (placing it at the midpoint of the 150 percent to 200 percent bracket) will contribute 5.15 percent (the midpoint of 4 percent and 6.3 percent) of its income toward the cost of premiums.
As income increases, the amount of the premium assis-tance credit decreases in two ways. First, as income increases, the taxpayer contributes a higher percentage of his or her income. Second, the percentage is applied to a higher income level. For example, if the income of a single taxpayer at 175 percent of FPL ($19,900) increases by $100, his or her contribution toward premiums rises from $1,025 (5.15 percent of $19,900) to $1,038 (5.19 percent of $20,000). The subsidy, then, decreases by $13, resulting in a marginal tax rate of 13 percent. Based on a calculation of that sort, premium assistance credits increase marginal rates by:
2 percentage points for taxpayers with income between 100 percent and 133 percent of FPL;
7. The exchanges will group health plans into four tiers. Plans in each tier, labeled “bronze,” “silver,” “gold,” and “platinum,” will cover a specified set of benefits, paying (on average) 60 percent, 70 percent, 80 percent, and 90 percent, respectively, of a beneficiary’s claims. The reference premium is the cost of the second-lowest-cost silver plan in the locality.
CBO

38 EFFECTIVE MARGINAL TAX RATES FOR LOW- AND MODERATE-INCOME WORKERS NOVEMBER 2012
CBO
12 to 13 percentage points for taxpayers with income between 133 percent and 150 percent of FPL;
11 to 15 percentage points for taxpayers with income between 150 percent and 200 percent of FPL;
13 to 17 percentage points for taxpayers with income between 200 percent and 250 percent of FPL;
15 to18 percentage points for taxpayers with income between 250 percent and 300 percent of FPL; and
9.5 percentage points for taxpayers with income between 300 percent and 400 percent of FPL.
Because the federal poverty guidelines adjust for house-hold size, different brackets of the credit schedule apply to taxpayers with the same MAGI but different-sized households. The subsidy amount depends on whether the taxpayer is buying individual or family insurance cover-age, but the subsidy phases out at the same rate.
In addition, households with income between 100 per-cent and 250 percent of FPL who purchase insurance
through the exchanges will be eligible for cost-sharing assistance to reduce their out-of-pocket costs. House-holds with income below 150 percent of FPL will be eligible for plans with an actuarial value of 94 percent (that value is the average share of costs for covered bene-fits that will be paid by the plan), households with income between 150 percent and 200 percent of FPL will be eligible for plans with 87 percent actuarial value, and those with income between 200 percent and 250 percent will be eligible for plans with 73 percent actuarial value. As income crosses each threshold (150 percent, 200 per-cent, and 250 percent of FPL), marginal rates will be sharply higher—largely because a small increase in income that moves the household into a new bracket results in a relatively large change in benefits as the indi-vidual or family loses eligibility for subsidies for plans with higher actuarial values. Because those subsidies are not provided through the individual income tax system, they will not affect the marginal rate under the federal income tax code; however, they contribute to the effective marginal rate, which accounts for both taxes and transfers.
Appendix B:Distribution of Marginal Tax Rates by Earnings
In its main analysis, the Congressional Budget Office (CBO) simulated the tax liabilities of tax filers to illus-trate the distribution of marginal tax rates for low- and moderate-income workers. Those simulations were based on income tax returns that were weighted to be represen-tative of the population. CBO used returns-weighted measures of marginal tax rates because individuals and families of low and moderate income, the focus of the agency’s main analysis, account for only about 40 percent of earnings in the economy. For this appendix, the agency took a different approach, weighting each return by the amount of earnings reported.1 That approach places more emphasis on the marginal tax rates faced by higher-income workers and better reflects the marginal tax rates that affect labor market decisions of those workers.
Evaluating the distribution of marginal rates on the basis of taxpayers’ earnings yields different results than a distri-butional analysis that examines the share of taxpayers facing a given statutory marginal rate (the rates specified in law that apply to the last dollar of earnings) or effective marginal rate (the increase in taxes or the reduction in government benefits from an additional dollar of income). For instance, the share of taxpayers in the sam-ple who faced a statutory marginal tax rate of zero—26 percent—accounted for only 8 percent of the total labor income earned by people in that sample. At the same time, the share of taxpayers in the sample who paid
1. As with the main analysis, the analysis presented here is based on information from a public-use sample of income tax returns filed in 2006 (the most recent public-use data available at the time the analysis was undertaken). The sample was restricted to taxpayers who had earnings, who were under age 65 and not disabled, and whose adjusted gross income was under 450 percent of the federal poverty guidelines.
the alternative minimum tax (AMT)—10 percent—accounted for 28 percent of earnings within the sample (see Table B-1). On average, the earnings-weighted statutory tax rate (the rate that would apply, on average, if each taxpaying unit increased its earnings by an equal percentage) was 13 percent for this sample under the regular income tax, higher than the returns-weighted statutory tax rate of 10 percent.
Earnings-weighted measures of effective marginal tax rates are also higher than returns-weighted measures. Under the federal individual income tax system, about half of the income earned by low- and moderate-income workers faces an effective marginal tax rate of between 10 percent and 19 percent, and 37 percent of earnings incurs marginal tax rates of between 20 percent and 29 percent (see Figure B-1)—which means a total of about 87 percent of earnings faces a marginal tax rate of between 10 and 29 percent. In contrast, slightly over two-thirds of tax returns in this group faced marginal rates of between 10 percent and 29 percent. Including the effects of state income taxes, federal payroll taxes, and reductions in benefits obtained through the Supplemental Nutrition Assistance Program (SNAP) shifts the distribution of marginal tax rates higher. For this sample, about 37 per-cent of earnings is subject to marginal tax rates of between 30 percent and 39 percent, and 23 percent faces marginal tax rates of between 40 percent and 49 percent.
On average, the earnings-weighted marginal tax rate for low- and moderate-income workers under 2012 law is 35 percent, compared to 30 percent using a returns-weighted measure (see Table B-2). Under an earnings-weighted measure, provisions of the federal individual income tax, particularly the AMT, and state income taxes have a greater impact on the overall
CBO

40 EFFECTIVE MARGINAL TAX RATES FOR LOW- AND MODERATE-INCOME WORKERS NOVEMBER 2012
CBO
Table B-1.
Distribution of Earnings of Low- and Moderate-Income Workers, by Statutory Marginal Tax Rate, Under 2012 Law(Percent)
Source: Congressional Budget Office.
Notes: CBO’s simulations were based on information from a public-use sample of federal individual income tax returns filed in 2006. The sample was restricted to taxpayers under the age of 65 who were not disabled, who had earnings in 2006, and whose adjusted gross income was below 450 percent of federal poverty guidelines.
Unlike the simulations in the main analysis, simulations were weighted on the basis of taxpayers’ earnings.
Statutory Marginal Tax Rate
81743
4000
Alternative Minimum Tax 28____Total 100
Share of Earnings Facing That Rate
0101525283335
marginal tax rate than is the case under a returns-weighted measure. About 28 percent of earnings in the sample are subject to the AMT, which contributes 7 per-centage points, on average, to the marginal tax rate. Because taxpayers who receive the earned income tax credit or SNAP benefits generally have lower earnings than do other taxpayers, the share of earnings affected by
those provisions is smaller than the share of returns affected. According to CBO’s estimates, earnings-weighted marginal tax rates for low- and moderate-income workers will rise, on average, to 37 percent under the provisions of 2013 law and to 39 percent under 2014 law because of the increases in marginal tax rates that will result from changes in various provisions of law.
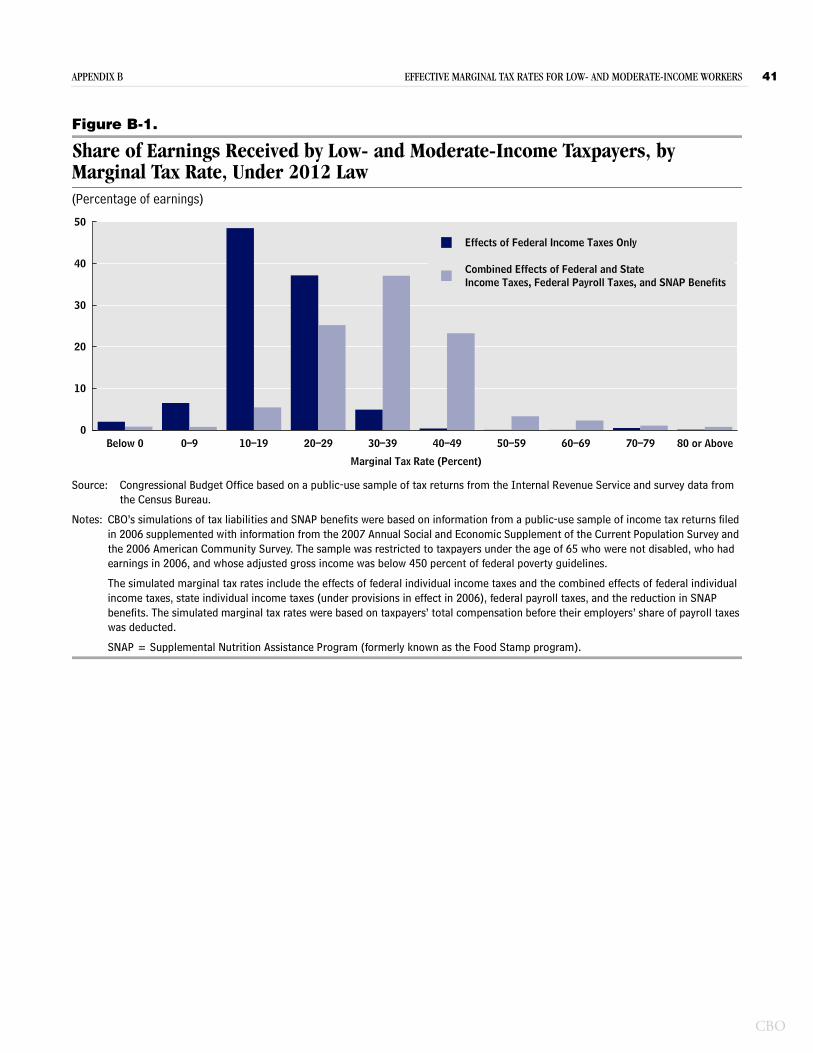
APPENDIX B EFFECTIVE MARGINAL TAX RATES FOR LOW- AND MODERATE-INCOME WORKERS 41
Figure B-1.
Share of Earnings Received by Low- and Moderate-Income Taxpayers, by Marginal Tax Rate, Under 2012 Law(Percentage of earnings)
Source: Congressional Budget Office based on a public-use sample of tax returns from the Internal Revenue Service and survey data from the Census Bureau.
Notes: CBO’s simulations of tax liabilities and SNAP benefits were based on information from a public-use sample of income tax returns filed in 2006 supplemented with information from the 2007 Annual Social and Economic Supplement of the Current Population Survey and the 2006 American Community Survey. The sample was restricted to taxpayers under the age of 65 who were not disabled, who had earnings in 2006, and whose adjusted gross income was below 450 percent of federal poverty guidelines.
The simulated marginal tax rates include the effects of federal individual income taxes and the combined effects of federal individual income taxes, state individual income taxes (under provisions in effect in 2006), federal payroll taxes, and the reduction in SNAP benefits. The simulated marginal tax rates were based on taxpayers’ total compensation before their employers’ share of payroll taxes was deducted.
SNAP = Supplemental Nutrition Assistance Program (formerly known as the Food Stamp program).
Below 0 0–9 10–19 20–29 30–39 40–49 50–59 60–69 70–79 80 or Above0
10
20
30
40
50
Marginal Tax Rate (Percent)
Effects of Federal Income Taxes Only
Combined Effects of Federal and StateIncome Taxes, Federal Payroll Taxes, and SNAP Benefits
CBO

42 EFFECTIVE MARGINAL TAX RATES FOR LOW- AND MODERATE-INCOME WORKERS NOVEMBER 2012
CBO
Table B-2.
Earnings-Weighted Contributions of Tax Provisions and SNAP Benefits to the Marginal Tax Rates of Low- and Moderate-Income Workers Under Provisions of Law in Effect in 2012, 2013, and 2014(Percent)
Source: Congressional Budget Office based on a public-use sample of tax returns from the Internal Revenue Service and survey data from the Census Bureau.
Notes: CBO’s simulations of tax liabilities and SNAP benefits were based on information from a public-use sample of income tax returns filed in 2006 supplemented with information from the 2007 Annual Social and Economic Supplement of the Current Population Survey and the 2006 American Community Survey. The sample was restricted to taxpayers under the age of 65 who were not disabled, who had earnings in 2006, and whose adjusted gross income was below 450 percent of FPL.
Unlike the simulations in the main analysis (which were weighted to be representative of the population of tax filers and did not take earnings into account), these were weighted on the basis of taxpayers’ earnings.
The simulated marginal tax rates were based on taxpayers’ total compensation before their employers’ share of payroll taxes was deducted.
CBO assumes states expand Medicaid in 2014 as originally specified in the Affordable Care Act (ACA) to cover individuals with income up to 138 percent of FPL. The ACA comprises the Patient Protection and Affordable Care Act (Public Law 111-148) and the health care provisions of the Health Care and Education Reconciliation Act of 2010 (P.L. 111-152).
FPL = federal poverty guidelines; SNAP = Supplemental Nutrition Assistance Program (formerly known as the Food Stamp program); EITC = earned income tax credit; n.a. = not applicable.
a. Provisions of the federal individual income tax do not add up to the marginal federal individual income tax rate because not all provisions of the tax code are shown.
b. Accounts for the deductibility of state income taxes on federal income tax returns for people who itemize.
Federal Individual Income Taxa 100.0 100.0 100.0 17.2 17.4 18.8 17.2 17.4 18.8Marginal statutory tax rate
(Regular income tax) 72.3 81.0 78.8 11.9 13.4 13.5 8.6 10.9 10.7EITC 13.9 13.6 13.5 10.3 10.0 10.4 1.4 1.4 1.4
Phase-in 1.2 1.5 1.4 -29.1 -27.2 -26.5 -0.4 -0.4 -0.4Plateau 2.1 1.6 1.6 0 0 0 0 0 0Phaseout 10.6 10.5 10.6 16.9 16.8 16.8 1.8 1.8 1.8
Child tax credit 52.5 32.7 31.1 -3.8 -0.5 -0.5 -2.0 -0.2 -0.2Premium assistance credits n.a. n.a. 7.9 n.a. n.a. 13 n.a. n.a. 1Alternative minimum tax 27.7 19.0 21.2 25.7 25.6 25.5 7.1 4.9 5.4
Federal Payroll Taxes 99.0 99.0 99.0 12.0 13.6 13.6 11.8 13.5 13.5State Individual Income Taxes 72.5 72.6 72.3 4.9 4.8 4.8 3.5 3.5 3.5SNAP Benefits 10.1 10.1 9.8 25.6 25.7 24.5 2.6 2.6 2.4Cost-Sharing Subsidy n.a. n.a. 4.3 n.a. n.a. 20.2 n.a. n.a. 0.9
42.5 40.5 43.4 -0.9 -0.8 -0.9 -0.4 -0.3 -0.4
n.a. n.a. n.a. n.a. n.a. n.a. 34.8 36.6 38.6
(Percent)Affected by Provision
2012 2013 2014(Percent)
Those Affected
2012 2013
Contribution to
Interactions Among
Average Marginal Tax Rate(Percent)
2014(Percentage points)
Aggregate Marginal Rate
2012 2013 2014
Share of Dollars Marginal Rate Effect for
Tax Provisionsb

NOVEMBER 2012 EFFECTIVE MARGINAL TAX RATES FOR LOW- AND MODERATE-INCOME WORKERS 43
List of Tables and Figures
Tables
S-1.
Contributions of Tax Provisions and SNAP Benefits to the Marginal Tax Rates of Low- and Moderate-Income Workers Under Provisions of Law in Effect in 2012, 2013, and 2014 vi1.
Statutory Federal Individual Income Tax Brackets, by Income Range, 2012 42.
Federal Spending for Selected Means-Tested Transfer Programs and Number of Participants in Fiscal Year 2011 103.
Contributions of Tax Provisions and SNAP Benefits to the Marginal Tax Rates of Low- and Moderate-Income Workers Under Provisions of Law in Effect in 2012 204.
Distribution of Individual Income Tax Returns Filed by Low- and Moderate-Income Workers, by Statutory Marginal Tax Rate, Under 2012 Law 215.
Contributions of Tax Provisions and SNAP Benefits to the Marginal Tax Rates of Low- and Moderate-Income Workers Under Provisions of Law in Effect in 2013 296.
Contributions of Tax Provisions and SNAP Benefits to the Marginal Tax Rates of Low- and Moderate-Income Workers Under Provisions of Law in Effect in 2014 30A-1.
Schedule for the Earned Income Tax Credit, by the Taxpayer’s Number of Qualifying Children, 2012 34B-1.
Distribution of Earnings of Low- and Moderate-Income Workers, by Statutory Marginal Tax Rate, Under 2012 Law 40B-2.
Earnings-Weighted Contributions of Tax Provisions and SNAP Benefits to the Marginal Tax Rates of Low- and Moderate-Income Workers Under Provisions of Law in Effect in 2012, 2013, and 2014 42Figures
S-1.
Disposable Income for a Hypothetical Single Parent with One Child, by Earnings, in 2012 vS-2.
Range of Marginal Tax Rates Between the 10th and 90th Percentiles, by Earnings Group, Under 2012 Law vii1.
Dollar Amount of Child-Related Tax Credits for a Hypothetical Single Parent with One Child, by Earnings, in 2012 52.
Marginal Tax Rates for a Hypothetical Single Parent with One Child, by Earnings, in 2012 6CBO

44 EFFECTIVE MARGINAL TAX RATES FOR LOW- AND MODERATE-INCOME WORKERS NOVEMBER 2012
CBO
3.
Share of Returns Filed by Low- and Moderate-Income Taxpayers, by Marginal Tax Rate, Under 2012 Law 224.
Share of Returns Filed by All Taxpayers, by Marginal Tax Rate, Under 2012 Law 235.
Distribution of Marginal Tax Rates, by Earnings Relative to Federal Poverty Guidelines, Under 2012 Law 246.
Distribution of Marginal Tax Rates, by Taxpayer Characteristics, Under 2012 Law 257.
Marginal Tax Rates for a Hypothetical Single Parent with One Child, by Earnings, Between 2012 and 2014 268.
Distribution of Marginal Tax Rates, by Earnings Relative to Federal Poverty Guidelines, Under 2014 Law 31B-1.
Share of Earnings Received by Low- and Moderate-Income Taxpayers, by Marginal Tax Rate, Under 2012 Law 41Figures (Continued)

NOVEMBER 2012 EFFECTIVE MARGINAL TAX RATES FOR LOW- AND MODERATE-INCOME WORKERS 45
About This Document
This Congressional Budget Office (CBO) report was prepared at the request of the Chairman of the Senate Committee on Finance. In keeping with CBO’s mandate to provide objective, impartial analysis, the report makes no recommendations.
Shannon Mok of CBO’s Tax Analysis Division prepared the study under the direction of Janet Holtzblatt and Frank Sammartino. Ed Harris and Jonathan Schwabish of CBO provided helpful comments on the report. Stacy Dickert-Conlin of Michigan State University, Ron Haskins of the Brookings Institution, and Elaine Maag, Caleb Quakenbush, and Eugene Steuerle of the Urban Institute also reviewed the report. The assistance of external reviewers implies no responsibility for the final product, which rests solely with CBO.
Loretta Lettner edited the study. Jeanine Rees and Maureen Costantino prepared the report for publication. An electronic version is available on CBO’s Web site www.cbo.gov.
Douglas W. Elmendorf Director
November 2012
CBO