effective management for biodiversity conservation in sri ... footprint of shrimp farming in...
TRANSCRIPT

Effective Management for Biodiversity Conservation inSri Lankan Coastal Wetlands
Fieldwork Report 2.3a:
A MEASUREMENT OF THE ECOLOGICAL FOOTPRINT OF SHRIMP
FARMING IN THE CHILAW LAGOON AREA
April 2002
Nikola Cattermoul
Aruna Devendra
Effective Management for Biodiversity Conservation in Sri Lankan Coastal Wetlands:The Ecological Footprint of Shrimp Farming in Chilaw
2
TABLE OF CONTENTS
PREFACE ............................................................................................................................................... 3
ACKNOWLEDGEMENTS ................................................................................................................... 3
1. INTRODUCTION .......................................................................................................................... 4
2. BACKGROUND TO SHRIMP FARMING IN SRI LANKA .................................................... 5
2.1 AN OVERVIEW OF THE DEVELOPMENT OF SHRIMP FARMING IN SRI LANKA ....................................52.2 THE STUDY SITE .........................................................................................................................72.3 SHRIMP FARMING PRACTICES AND INPUTS IN CHILAW .................................................................82.4 POND SITING ............................................................................................................................102.5 ESTABLISHING A SHRIMP FARM ..................................................................................................11
3. METHODOLOGY ....................................................................................................................... 12
4. FIELDWORK FINDINGS .......................................................................................................... 14
4.1 GROWTH OF SHRIMP FARMING IN CHILAW ................................................................................144.2 FARMING INPUTS AND OUTPUTS ...............................................................................................164.3 EMPLOYMENT...........................................................................................................................164.4 FARM COSTS AND REVENUES .....................................................................................................174.5 THE ECOLOGICAL FOOTPRINT ..................................................................................................194.6 MANGROVES AS BIOFILTERS......................................................................................................24
5. TENTATIVE CONCLUSIONS .................................................................................................. 26
6. REFERENCES ............................................................................................................................. 27
ANNEX 1: VALUE OF MAJOR NATURAL RESOURCE EXPORTS OF SRI LANKA ............ 29
ANNEX 2: SHRIMP FARM LEGAL PROCESS ............................................................................ 30
ANNEX 3: CAPITAL COSTS OF SHRIMP FARMING IN CHILAW AREA ............................. 33
Effective Management for Biodiversity Conservation in Sri Lankan Coastal Wetlands:The Ecological Footprint of Shrimp Farming in Chilaw
3
Preface
This report presents findings from the DEFRA Darwin Initiative funded research
project ‘Effective Management for Biodiversity Conservation in Sri Lankan Coastal
Wetlands’. The project was a collaborative study by the Centre for the Economics and
Management of Aquatic Resources (CEMARE) University of Portsmouth, UK, the
Department of Town and Country Planning, University of Moratuwa, Sri Lanka and
the Department of Forestry and Environmental Sciences, University of Sri
Jayewardenapura, Sri Lanka.
This report presents the findings of fieldwork carried out by Ms. Nikola Cattermoul
and Mr. Aruna Devendra measuring the Ecological Footprint of Shrimp Farms in the
Chilaw Lagoon area. The opinions expressed and conclusions drawn are solely the
responsibility of the authors.
The research came as a response to the growing number of shrimp farms in Sri
Lanka’s west coast, which are believed to have adverse effects on the local lagoon
ecosystems.
This fieldwork and data collection was carried out in January and February 2002.
Chilaw Lagoon was selected as there is a high density of shrimp farms in the area, and
many of the associated problems manifest themselves here.
Acknowledgements
Many thanks to the Chilaw Divisional Secretary’s office for their assistance and for
sharing their information and knowledge with this research team. We are also grateful
to Mr. N. Orlina of CP Aquaculture (India) PVT Ltd for his assistance with shrimp
farm data. Thank you also to Mr. Christy of the Consortium for Aquaculture
Development, Chilaw, for providing the researchers with his time and information.
Effective Management for Biodiversity Conservation in Sri Lankan Coastal Wetlands:The Ecological Footprint of Shrimp Farming in Chilaw
4
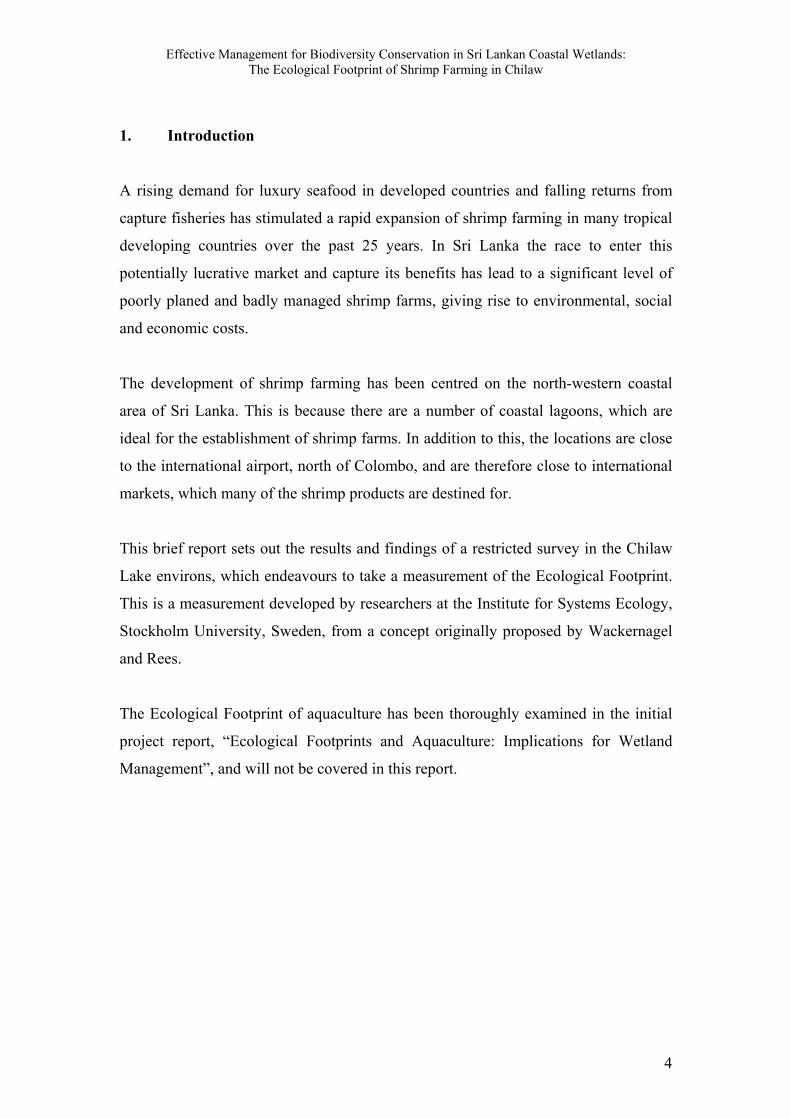
1. Introduction
A rising demand for luxury seafood in developed countries and falling returns from
capture fisheries has stimulated a rapid expansion of shrimp farming in many tropical
developing countries over the past 25 years. In Sri Lanka the race to enter this
potentially lucrative market and capture its benefits has lead to a significant level of
poorly planed and badly managed shrimp farms, giving rise to environmental, social
and economic costs.
The development of shrimp farming has been centred on the north-western coastal
area of Sri Lanka. This is because there are a number of coastal lagoons, which are
ideal for the establishment of shrimp farms. In addition to this, the locations are close
to the international airport, north of Colombo, and are therefore close to international
markets, which many of the shrimp products are destined for.
This brief report sets out the results and findings of a restricted survey in the Chilaw
Lake environs, which endeavours to take a measurement of the Ecological Footprint.
This is a measurement developed by researchers at the Institute for Systems Ecology,
Stockholm University, Sweden, from a concept originally proposed by Wackernagel
and Rees.
The Ecological Footprint of aquaculture has been thoroughly examined in the initial
project report, “Ecological Footprints and Aquaculture: Implications for Wetland
Management”, and will not be covered in this report.
Effective Management for Biodiversity Conservation in Sri Lankan Coastal Wetlands:The Ecological Footprint of Shrimp Farming in Chilaw
5
2. Background to Shrimp Farming in Sri Lanka
2.1 An overview of the development of Shrimp Farming in Sri Lanka
The global boom in shrimp farming began in the 1980s and was lead by countries
such as Thailand, Ecuador, Indonesia and China. However, in Sri Lanka where there
has not been a tradition of aquaculture, shrimp farming was slower to take hold.
Despite this, the first farms were established in the early 1980’s by a small number of
entrepreneurs and multi-national companies encouraged by the Sri Lankan
Government’s (SLG) attractive package of benefit’s and taxation incentives
(Siriwardena, unpublished).
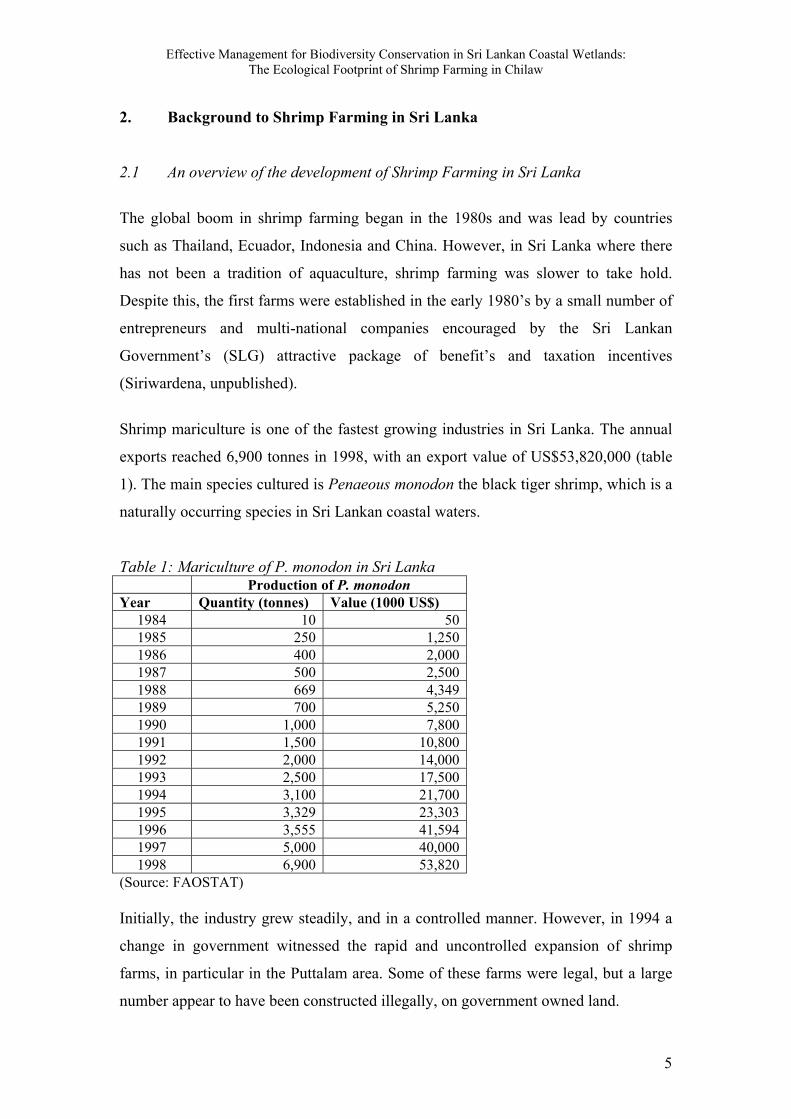
Shrimp mariculture is one of the fastest growing industries in Sri Lanka. The annual
exports reached 6,900 tonnes in 1998, with an export value of US$53,820,000 (table
1). The main species cultured is Penaeous monodon the black tiger shrimp, which is a
naturally occurring species in Sri Lankan coastal waters.
Table 1: Mariculture of P. monodon in Sri LankaProduction of P. monodon
Year Quantity (tonnes) Value (1000 US$)1984 10 501985 250 1,2501986 400 2,0001987 500 2,5001988 669 4,3491989 700 5,2501990 1,000 7,8001991 1,500 10,8001992 2,000 14,0001993 2,500 17,5001994 3,100 21,7001995 3,329 23,3031996 3,555 41,5941997 5,000 40,0001998 6,900 53,820
(Source: FAOSTAT)
Initially, the industry grew steadily, and in a controlled manner. However, in 1994 a
change in government witnessed the rapid and uncontrolled expansion of shrimp
farms, in particular in the Puttalam area. Some of these farms were legal, but a large
number appear to have been constructed illegally, on government owned land.
Effective Management for Biodiversity Conservation in Sri Lankan Coastal Wetlands:The Ecological Footprint of Shrimp Farming in Chilaw
6
One of the main reasons for an expansion in farming in the Puttalam District is that it
is easily accessible by road, it is not in the conflict zone1, there are a number of
coastal lagoons and the land is generally not agricultural. This differs to further south
along the coast where land is less accessible due to a variety of housing and industrial
developments. This rapid expansion in farming has meant that Penaeus monodon has
become one of the fastest growing export-led industries in Sri Lanka (Corea et al.,
1998). Shrimps now account for a significant portion of export revenue, in the
agricultural and fisheries sector only second to tea in 1998. (See annex 1.)
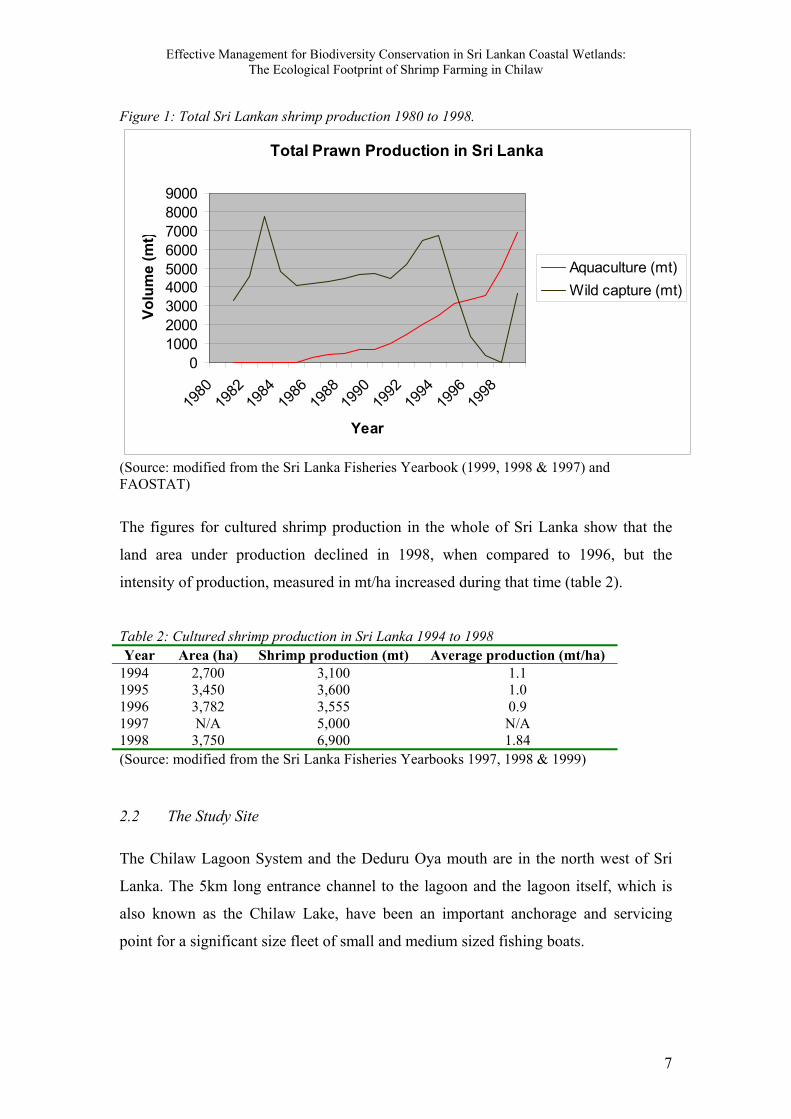
As illustrated by figure one, it can be seen that in 1994 farmed shrimp production
increased notably, and the figures for wild caught shrimp begin their rapid annual
decline. No studies have so far been identified that have examined this issue, and
because of this it is not known if either the expansion of shrimp farms in the coastal
areas have contributed to the decline in wild shrimp catch, or whether this has simply
lead to a shift in the overall fishing industry effort.
Generally the data show a massive decline in wild caught shrimps between 1995 and
1998. It is not known what the reason for this is. However, the data does show as
aquaculture output increases, wild caught output decreases. This could be a result of a
number of factors. The seed shrimp for farming originate from wild caught adults that
are bred from in the hatcheries. The juvenile shrimps are raised in the shrimp ponds.
This differs to where they normally spend their lifecycle, in the coastal waters and
lagoons, where fishermen catch them. By removing them from the ecosystem, the
fishery population is reduced, so catches are reduced accordingly. An alternative
reason for the decline in wild caught shrimps is pollution of the lagoons by shrimp
farming increases the stress on the wild populations and contributes to large-scale
mortality.
1 The north and east of Sri Lanka has been the geographical area of the Tamil Tiger and Sri LankanGovernment conflict since the 1980’s
Effective Management for Biodiversity Conservation in Sri Lankan Coastal Wetlands:The Ecological Footprint of Shrimp Farming in Chilaw
7
Figure 1: Total Sri Lankan shrimp production 1980 to 1998.
Total Prawn Production in Sri Lanka
0100020003000400050006000700080009000
1980
1982
1984
1986
1988
1990
1992
1994
1996
1998
Year
Volu
me
(mt)
Aquaculture (mt)Wild capture (mt)
(Source: modified from the Sri Lanka Fisheries Yearbook (1999, 1998 & 1997) andFAOSTAT)
The figures for cultured shrimp production in the whole of Sri Lanka show that the
land area under production declined in 1998, when compared to 1996, but the
intensity of production, measured in mt/ha increased during that time (table 2).
Table 2: Cultured shrimp production in Sri Lanka 1994 to 1998Year Area (ha) Shrimp production (mt) Average production (mt/ha)
1994 2,700 3,100 1.11995 3,450 3,600 1.01996 3,782 3,555 0.91997 N/A 5,000 N/A1998 3,750 6,900 1.84(Source: modified from the Sri Lanka Fisheries Yearbooks 1997, 1998 & 1999)
The Chilaw Lagoon System and the Deduru Oya mouth are in the north west of Sri
Lanka. The 5km long entrance channel to the lagoon and the lagoon itself, which is
also known as the Chilaw Lake, have been an important anchorage and servicing
point for a significant size fleet of small and medium sized fishing boats.
2.2 The Study Site
Effective Management for Biodiversity Conservation in Sri Lankan Coastal Wetlands:The Ecological Footprint of Shrimp Farming in Chilaw
8
At present the formation of a sand bar opposite the lagoon inlet restricts the access of
larger boats for part of the year. The southern entrance to the lagoon through the inlet
at Thoduwawa is completely closed for a part of the year despite construction carried
out in the early 1960s to prevent sand bar formation across the inlet. The river mouth
is highly changeable with seasonal formation and movement of sandbars. The Deduru
Oya is a sinuous river whose catchment straddles the dry zone and the northernmost
edge of the wet zone. The main (direct) river mouth which is closed by a sandbar
during the months immediately following the South West Monsoon would open
automatically with or without some preparatory excavation of the sand bar when the
river stages rise at the beginning of the North East Monsoon. The coastline south of
the river mouth is fixed along a long sandstone ledge, which runs north to south. The
southern opening in the sand bar barely allows the passage of shallow draft vessels
during a part of the year into the entrance channel of the Lagoon, which serves as a
very important harbour for fisheries. The development of aquaculture in the area has
increased the effluent loading on the Chilaw Lagoon, which cannot be fully flushed
away when the river mouth is obstructed.
The majority of shrimp farms in the Sri Lankan coastal area are semi-intensive in their
production methods.2 That is, ponds are constructed of mud banks, shrimps are fed
formulated feeds and some aeration takes place. In addition to this shrimp farmers
also rely on the surrounding lagoon, or canal water, to wash wastewater through the
ponds out into the lagoon or canal and to provide clean pond water. This is in contrast
to intensive systems, which are characterised by concrete ponds and closed production
systems, and extensive systems, which cover vast areas and are more harmonised with
the local environment in which they occur.
The types of shrimp farming found on the west coast of Sri Lanka have been
categorised into three levels of operation (de Silva & Jayasinghe, 1993). The first,
consists of farmers who operate ‘small-scale’ farms no larger that one-hectare in area.
2.3 Shrimp Farming Practices and Inputs in Chilaw
Effective Management for Biodiversity Conservation in Sri Lankan Coastal Wetlands:The Ecological Footprint of Shrimp Farming in Chilaw
9
These farms were reported by de Silva and Jayasinghe in 1993 to have no method of
aeration, however, observational evidence suggests that this is possibly no longer the
case. A number of small ponds have aeration methods, such as a paddle-machine, and
produce 2 harvest cycles per year.
The second group are farms that primarily depend on local technology with large
investments. Mechanical aeration is generally used in medium and large-scale sized
operations. This aeration of the pond water helps to keep oxygen levels at a constant
in the ponds, a necessity for the survival of the shrimps.
The third category is farms involved in ‘large-scale’ operation with more intensive
inputs, such as formulated3 feed, higher stocking densities and are often part funded
by joint ventures with foreign personnel and companies. There is observational
evidence to suggest that there has been rapid growth of this third category of shrimp
farming (Siriwardena, unpublished.).
Post-larvae are generally obtained from wild caught adults sold to the hatcheries by
local fishermen. These are then induced to spawn in the hatcheries. The larvae are
grown on in tanks until they are 18 days old, when they are ready to go to the ponds
and are sold.
Shrimp feed is imported and subsidised by locally caught shellfish, including a lagoon
mussel. In addition to this some farmers use feeding trays to monitor the feed intake
of the larvae. However, the majority scatter feed by hand over the entirety of the
pond.
At least half of the pond water is changed once a week in the Chilaw area, where it is
pumped out into the lagoon and canal systems. New water is then pumped into the
pond from the same source as the old water was discharged into (Zetterstrőm, 1998).
2 A small number of intensive, closed-system farms are in operation, but in general these are theexception and not the rule.

Effective Management for Biodiversity Conservation in Sri Lankan Coastal Wetlands:The Ecological Footprint of Shrimp Farming in Chilaw
10
Table 3: Sources of inputs for shrimp farming in Chilaw, Sri Lanka.
Input SourceAeration Mechanical (petrol/diesel motor)Feed Imported fish meal, subsidised with locally caught shellfishWater Chilaw Lagoon/ Dutch CanalPost larvae Hatcheries (wild caught gravid females, wild caught males and
females)Land Mangrove/wetland, rice paddy or coconut plantations(Source: EMBioC fieldwork 2001)
The majority of shrimp farms in the Puttalam District are situated on coastal and
lagoon fringes and have been constructed on a number of sites whose land use has
changed as a result of pond construction. The land use prior to pond construction
varies between mangrove habitat, coconut land and rice paddy fields. In the case of
private paddy and coconut land, the use has changed as a result of land sales, leasing
or a change in policy by the landowner. However in the case of mangrove areas, the
public property nature of the land has seen the illegal mass clearance of mangroves by
private individuals, often with the consent of local politicians. Normally, if public
land is to be used in this manner it must first be released by the Divisional Secretary,
before an application to construct a shrimp pond can be made.4 This is not completed
in the case of the majority of these farms. The results of this type of action have been
reported in the EMBioC field report “The impacts of shrimp farming on communities
in the Chilaw area”.
The close proximity to a water source is paramount to choosing a site for the
construction of a pond; this is because fresh lagoon water is required in the farming
methods being employed in most farms. Less capital inputs are required in the form of
water pumps and pipes for irrigation. In the Chilaw area the lagoon and Dutch Canal5
are crowded with shrimp farms as a result of this.
4 See annex 2 for the legal prawn farm approval process5 Dutch Canal was originally constructed by the Dutch colonial rulers in order to provide a transportlink between the lagoons on the west coast and Colombo
2.4 Pond siting
Effective Management for Biodiversity Conservation in Sri Lankan Coastal Wetlands:The Ecological Footprint of Shrimp Farming in Chilaw
11
Ponds in the Chilaw environs are generally less than one hectare in area; this is more
likely due to the limited area of land available in the narrow coastal and lagoon belts.
If a potential farmer wishes to establish a shrimp farm less than 4 hectares in area, he
can do so without requiring the permission of any government agency. All that is
required is that he owns, or leases, the land he wishes to develop. For a farm greater
than 4 hectares in area, in order to prevent adverse impacts on the environment and
deterioration of environmental quality, the applicant must obtain a management
license, which costs 2,500 SLR (£20) per acre per year. This comes under the
National Environmental Act, No. 47 of 1980. Section 232 was amended by Act No.
56 of 1988 which incorporated the land-use limit (Siriwardena, unpublished).
According to these regulations all shrimp farms exceeding 4 ha, but less that 20 ha
should submit an Initial Environmental Examination report and those exceeding 20
hectares submit an Environmental Impact Assessment (EIA) to an approving body.
As a result of this legislation there has been an enormous growth in farms that are less
than 4 hectares to avoid the constraints of the lengthy approval process. The resulting
overcrowding of the coastal and lagoon areas has bought about increased lagoon and
canal water pollution, the source for clean water and the waste-disposal method for
used shrimp farm water. This has resulted in self-pollution of water resources and
increased disease prevalence due to the sharing of contaminated water (Corea et al,
1998).
In order to develop the industry in a more sustainable manner a number of
organisations including NARA, the Consortium for Aquaculture Development,
NAQDA, Ministry of Fisheries, have begun to reinforce recommendations made for
shrimp farming development in the past.
These include:
• Enforce existing legislation on shrimp farming including 20% of the pond area
to be utilised as sedimentation and treatment tanks.
2.5 Establishing a shrimp farm
Effective Management for Biodiversity Conservation in Sri Lankan Coastal Wetlands:The Ecological Footprint of Shrimp Farming in Chilaw
12
• Legalise all existing shrimp farms, which meet the environmental regulations.
Illegal farms that do not meet environmental regulations should be closed.
• Review, gazette and enforce the proposed aquaculture effluent standards in
view of the poor water quality parameters observed in Dutch Canal.
• Continue experiments in which seaweeds, seagrasses and molluscs are used to
treat effluents, so the efficiency of such biological clean-up systems can be
improved.
(Source: Siriwardena, unpublished)
3. Methodology
The methodology and theoretical background were covered in the original literature
review, dated October 2000.
The results presented here are a product of primary and secondary data collection.
Data was collected from NGO’s, from interviews and from private companies. This
data was then compared to the results that had been generated by Larsson et al in a
study on the ecological footprint of shrimp farming in Columbia (1994).
The following is a brief overview of the findings of the study undertaken in
Columbia:
• Marine upwelling ecosystem: calculated that the mean marine fish yield is 6.71
tonnes C/km2, estimated that 2.44 t of fish with carbon content was used per year
in the study area. The marine area was calculated at 14.5ha/ha of shrimp farm.
Data for the marine upwelling calculation will be based on data collected on feed
quantities from the Chilaw site and the data from the original footprint study of
shrimp farming in Colombia. The same calculation will be used to obtain Chilaw
results.
Little is made of the contribution of shrimp farming waste to the lagoon and coastal
ecosystems in the work completed by Larsson et al, which it may be necessary to take

Effective Management for Biodiversity Conservation in Sri Lankan Coastal Wetlands:The Ecological Footprint of Shrimp Farming in Chilaw
13
into consideration (see section 4.5 for details). The flushing of lagoon water into the
coastal ecosystems may well increase the productivity of the coastal fisheries (Roth et
al, 2000). However, this is beyond the scope of this research and will not be addressed
here.
• Agricultural ecosystem: calculated that the mean yield is 3.5 tonnes/ha (dry
weight), estimated that 1.5 t was used per year in the study area. The agricultural
area was calculated at 0.5 ha/ha of shrimp farm.
This will be taken as the amount of crop based feed used per hectare, per year in
Chilaw farming practices.
• Postlarval mangrove nursery: calculated that the mean postlarval density in
mangroves is 0.3 – 1 individual/m2, assuming a pre-stocking mortality of 50% and
the proportion of post-larvae derived from wild fry (as opposed to hatchery-raised)
assumed to be between 10 and 50%. The postlarval area was estimated to be
anywhere between 9.6 and 160 ha/ha of shrimp farm.
Postlarval calculations are not required for the study in Chilaw as all fry are raised in
hatcheries from wild caught adults. However, adult wild-caught shrimp do rely on the
mangroves for nursery grounds when they are juvenile. Larsson et al suggest using a
figure of 10 times the area of the shrimp and as a footprint indicator for post-larval
mangroves.
• Mangrove support area: calculated that the mean area required to yield
sufficient leaf litter to provide 30% of shrimp feed estimated on the basis of
productivity measures with an average mangrove litterfall of 5 t/ha and a 10%
trophic efficiency in converting mangrove carbon into detrital organic matter
available to the shrimp. The mangrove support area in Colombia was estimated to
be 4.2 ha/ha of shrimp farm.
Instead, perhaps as Larsson et al have done in measuring the amount of mangroves
needed to support the farms in the form of shrimp feed, it would be more useful in the
Effective Management for Biodiversity Conservation in Sri Lankan Coastal Wetlands:The Ecological Footprint of Shrimp Farming in Chilaw
14
case of Chilaw to measure the amount of mangroves needed to remove the high levels
of nutrients in the form of waste products flushed form the ponds on a weekly basis.
Again, this is beyond the scope of this study and will not be undertaken here.
• Lagoon support area: calculated as the area of the pumped yearly volume (10%
daily, ponds 1.2 m deep, 300 days per year) assuming the source lagoon is on
average 5 metres deep. The lagoon support area in Colombia was estimated to be
7.2ha/ha of shrimp farm.
The same method will be used for calculating the lagoon support area required for
Chilaw.
• CO2 sequestering area: calculated as area required to absorb CO2 from direct
energy use (fuel) 6085 litres/ha; the total CO2 released by the study area
aquaculture activities was estimated to be between 14.9 and 45.1 tonnes of
CO2/ha. In order to estimate the surface area needed for carbon sequestration a
carbon assimilation capacity of 5 t/ha or 18.3 CO2/ha was assumed. The CO2
sequestering area was estimated to be between 0.8 and 2.5 ha/ha of shrimp farm.
4. Fieldwork findings
Initial results show the total number of farms in the Chilaw area has grown to 183
since 1993, when the CEA/Euroconsult survey estimated there to be approximately 18
farms in operation. This is a ten-fold increase on the numbers estimated in 1994. The
area under cultivation in 1994 was approximately 52 hectares. In the 2001 survey it
was estimated to be 247.8 hectares, nearly a 5-fold increase in a seven-year time-span.
This reflects the rapid growth that has been reported through discussions with various
individuals and organisations.6
4.1 Growth of Shrimp Farming in Chilaw
Effective Management for Biodiversity Conservation in Sri Lankan Coastal Wetlands:The Ecological Footprint of Shrimp Farming in Chilaw
15
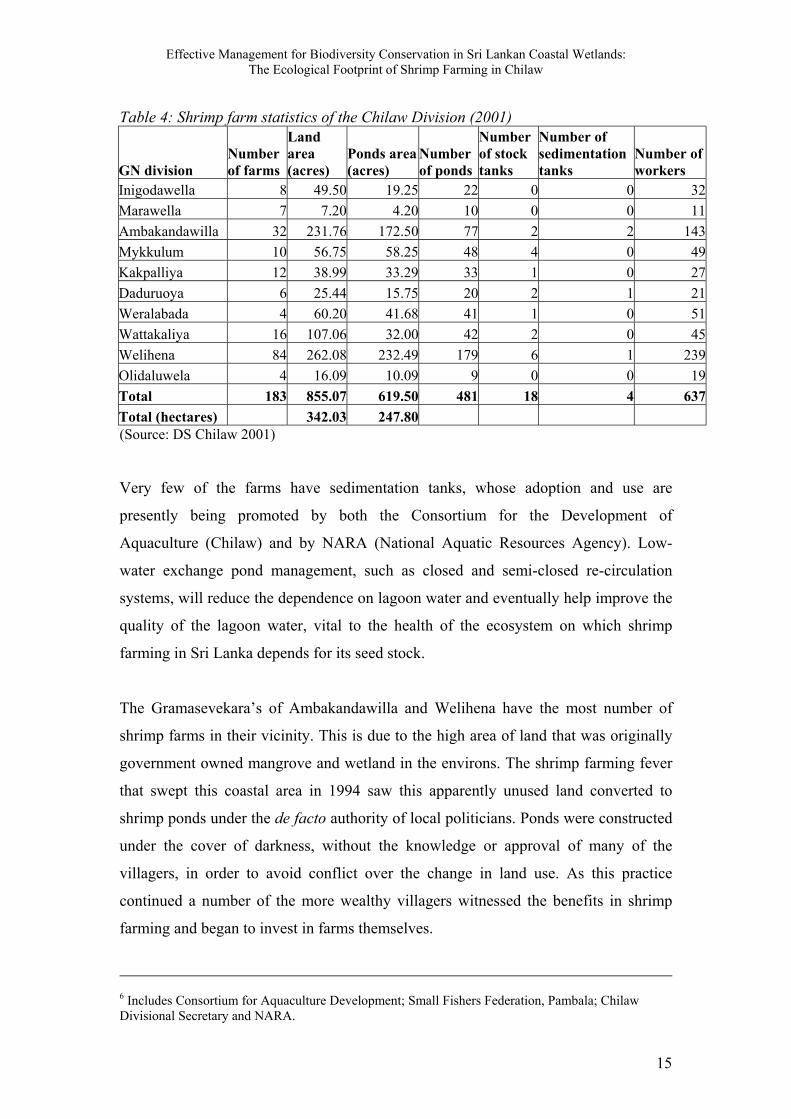
Table 4: Shrimp farm statistics of the Chilaw Division (2001)
GN divisionNumberof farms
Landarea(acres)
Ponds area(acres)
Numberof ponds
Numberof stocktanks
Number ofsedimentationtanks
Number ofworkers
Inigodawella 8 49.50 19.25 22 0 0 32Marawella 7 7.20 4.20 10 0 0 11Ambakandawilla 32 231.76 172.50 77 2 2 143Mykkulum 10 56.75 58.25 48 4 0 49Kakpalliya 12 38.99 33.29 33 1 0 27Daduruoya 6 25.44 15.75 20 2 1 21Weralabada 4 60.20 41.68 41 1 0 51Wattakaliya 16 107.06 32.00 42 2 0 45Welihena 84 262.08 232.49 179 6 1 239Olidaluwela 4 16.09 10.09 9 0 0 19Total 183 855.07 619.50 481 18 4 637Total (hectares) 342.03 247.80 (Source: DS Chilaw 2001)
Very few of the farms have sedimentation tanks, whose adoption and use are
presently being promoted by both the Consortium for the Development of
Aquaculture (Chilaw) and by NARA (National Aquatic Resources Agency). Low-
water exchange pond management, such as closed and semi-closed re-circulation
systems, will reduce the dependence on lagoon water and eventually help improve the
quality of the lagoon water, vital to the health of the ecosystem on which shrimp
farming in Sri Lanka depends for its seed stock.
The Gramasevekara’s of Ambakandawilla and Welihena have the most number of
shrimp farms in their vicinity. This is due to the high area of land that was originally
government owned mangrove and wetland in the environs. The shrimp farming fever
that swept this coastal area in 1994 saw this apparently unused land converted to
shrimp ponds under the de facto authority of local politicians. Ponds were constructed
under the cover of darkness, without the knowledge or approval of many of the
villagers, in order to avoid conflict over the change in land use. As this practice
continued a number of the more wealthy villagers witnessed the benefits in shrimp
farming and began to invest in farms themselves.
6 Includes Consortium for Aquaculture Development; Small Fishers Federation, Pambala; ChilawDivisional Secretary and NARA.
Effective Management for Biodiversity Conservation in Sri Lankan Coastal Wetlands:The Ecological Footprint of Shrimp Farming in Chilaw
16
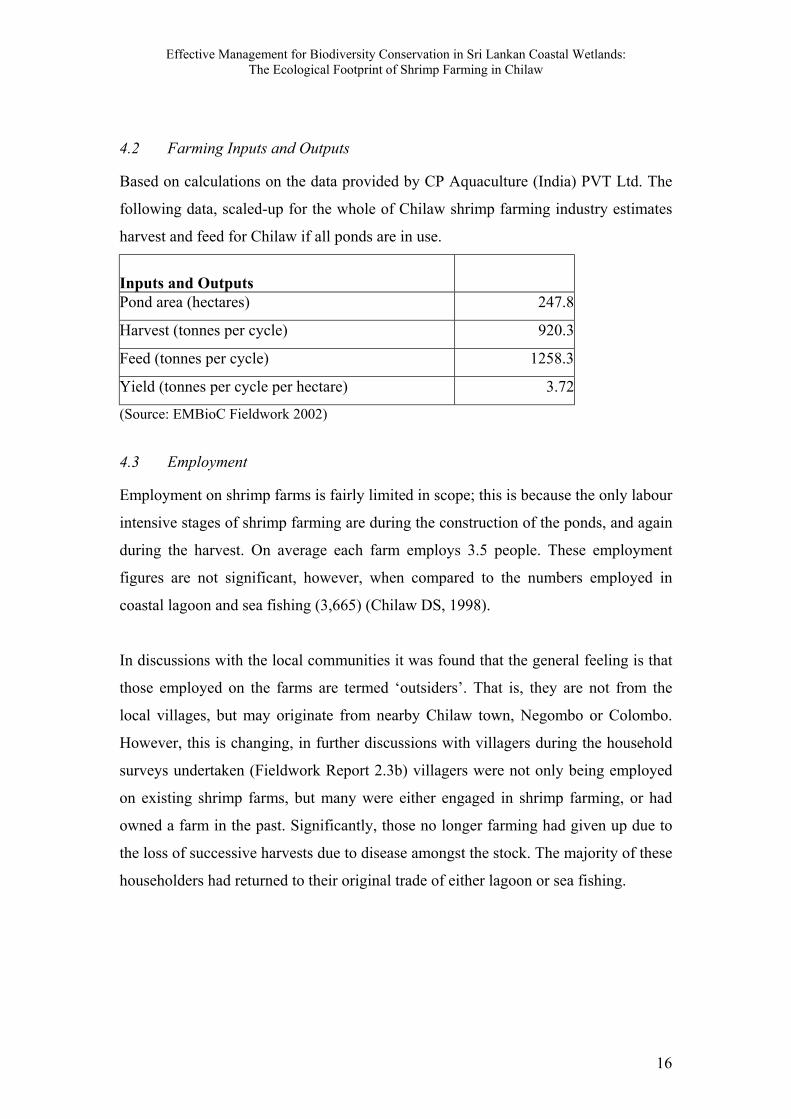
Based on calculations on the data provided by CP Aquaculture (India) PVT Ltd. The
following data, scaled-up for the whole of Chilaw shrimp farming industry estimates
harvest and feed for Chilaw if all ponds are in use.
Inputs and OutputsPond area (hectares) 247.8
Harvest (tonnes per cycle) 920.3
Feed (tonnes per cycle) 1258.3
Yield (tonnes per cycle per hectare) 3.72
(Source: EMBioC Fieldwork 2002)
Employment on shrimp farms is fairly limited in scope; this is because the only labour
intensive stages of shrimp farming are during the construction of the ponds, and again
during the harvest. On average each farm employs 3.5 people. These employment
figures are not significant, however, when compared to the numbers employed in
coastal lagoon and sea fishing (3,665) (Chilaw DS, 1998).
In discussions with the local communities it was found that the general feeling is that
those employed on the farms are termed ‘outsiders’. That is, they are not from the
local villages, but may originate from nearby Chilaw town, Negombo or Colombo.
However, this is changing, in further discussions with villagers during the household
surveys undertaken (Fieldwork Report 2.3b) villagers were not only being employed
on existing shrimp farms, but many were either engaged in shrimp farming, or had
owned a farm in the past. Significantly, those no longer farming had given up due to
the loss of successive harvests due to disease amongst the stock. The majority of these
householders had returned to their original trade of either lagoon or sea fishing.
4.2 Farming Inputs and Outputs
4.3 Employment
Effective Management for Biodiversity Conservation in Sri Lankan Coastal Wetlands:The Ecological Footprint of Shrimp Farming in Chilaw
17
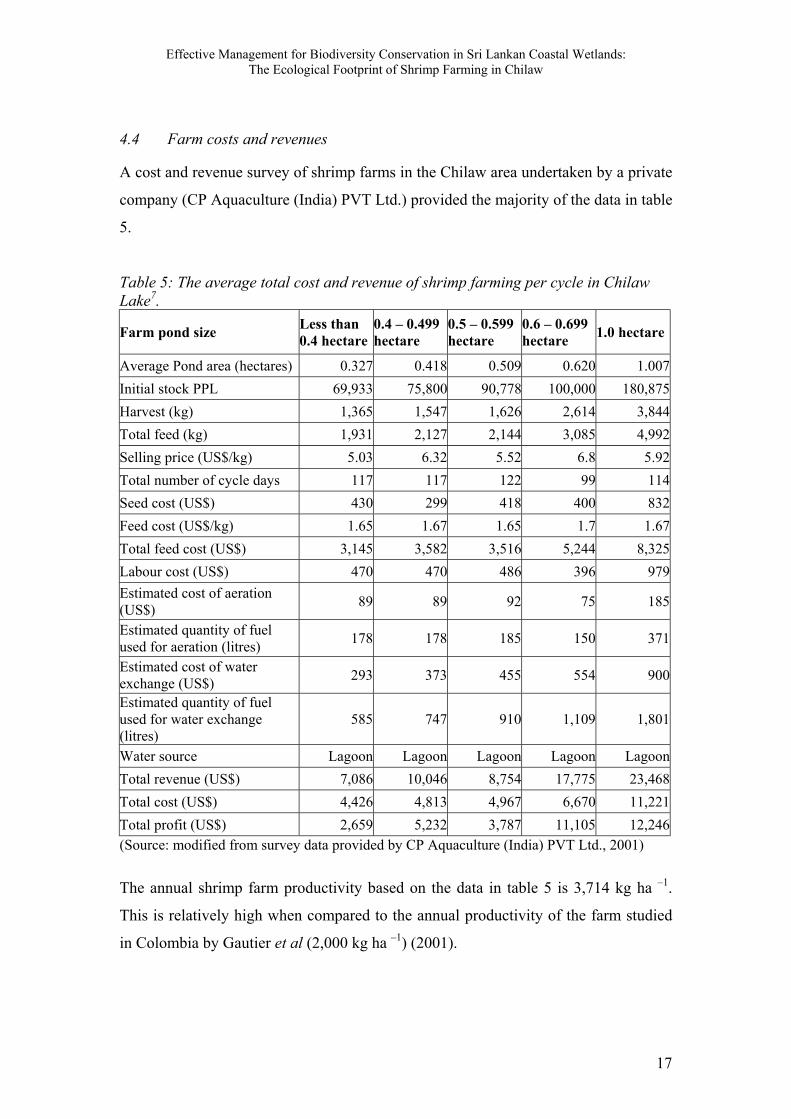
A cost and revenue survey of shrimp farms in the Chilaw area undertaken by a private
company (CP Aquaculture (India) PVT Ltd.) provided the majority of the data in table
5.
Table 5: The average total cost and revenue of shrimp farming per cycle in ChilawLake7.
Farm pond size Less than0.4 hectare
0.4 – 0.499hectare
0.5 – 0.599hectare
0.6 – 0.699hectare 1.0 hectare
Average Pond area (hectares) 0.327 0.418 0.509 0.620 1.007Initial stock PPL 69,933 75,800 90,778 100,000 180,875Harvest (kg) 1,365 1,547 1,626 2,614 3,844Total feed (kg) 1,931 2,127 2,144 3,085 4,992Selling price (US$/kg) 5.03 6.32 5.52 6.8 5.92Total number of cycle days 117 117 122 99 114Seed cost (US$) 430 299 418 400 832Feed cost (US$/kg) 1.65 1.67 1.65 1.7 1.67Total feed cost (US$) 3,145 3,582 3,516 5,244 8,325Labour cost (US$) 470 470 486 396 979Estimated cost of aeration(US$) 89 89 92 75 185
Estimated quantity of fuelused for aeration (litres) 178 178 185 150 371
Estimated cost of waterexchange (US$) 293 373 455 554 900
Estimated quantity of fuelused for water exchange(litres)
585 747 910 1,109 1,801
Water source Lagoon Lagoon Lagoon Lagoon LagoonTotal revenue (US$) 7,086 10,046 8,754 17,775 23,468Total cost (US$) 4,426 4,813 4,967 6,670 11,221Total profit (US$) 2,659 5,232 3,787 11,105 12,246(Source: modified from survey data provided by CP Aquaculture (India) PVT Ltd., 2001)
The annual shrimp farm productivity based on the data in table 5 is 3,714 kg ha –1.
This is relatively high when compared to the annual productivity of the farm studied
in Colombia by Gautier et al (2,000 kg ha –1) (2001).
4.4 Farm costs and revenues
Effective Management for Biodiversity Conservation in Sri Lankan Coastal Wetlands:The Ecological Footprint of Shrimp Farming in Chilaw
18
Production costs at Chilaw average at US$3.24 per kg and as is evident from table 5
the total profits made are significant. In fact, profits are considerably more than can be
made from fishing during the same amount of time. The incomes from sea fishing are
reportedly more likely to be between Rs. 100-2000 (US$1.4 – 28) per day, per boat.
The largest catch one boat achieved during fieldwork by Stirrat (1988) in a single day
was Rs. 20,000 (US$ 285, the equivalent of four to five months wages for a shrimp
farm labourer). Hence, the incentive for those fishermen who can afford it to invest in
shrimp farming is immense, as the profits are far greater than can consistently be
made from fishing.
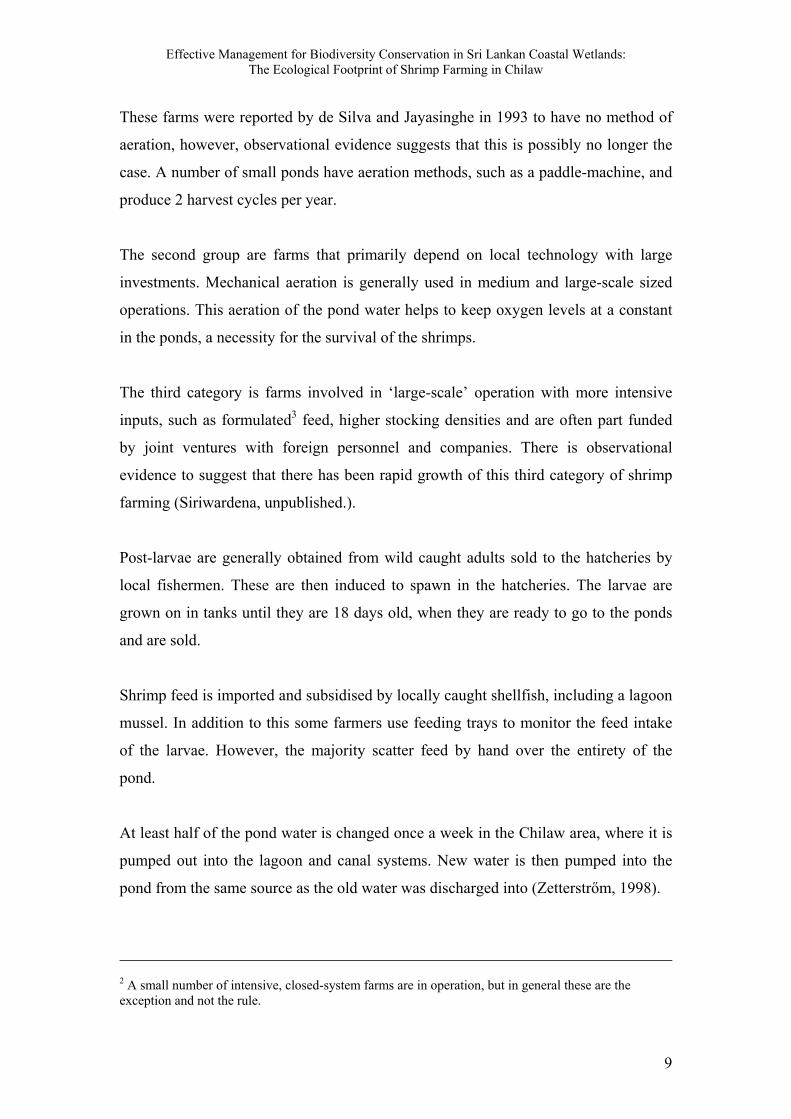
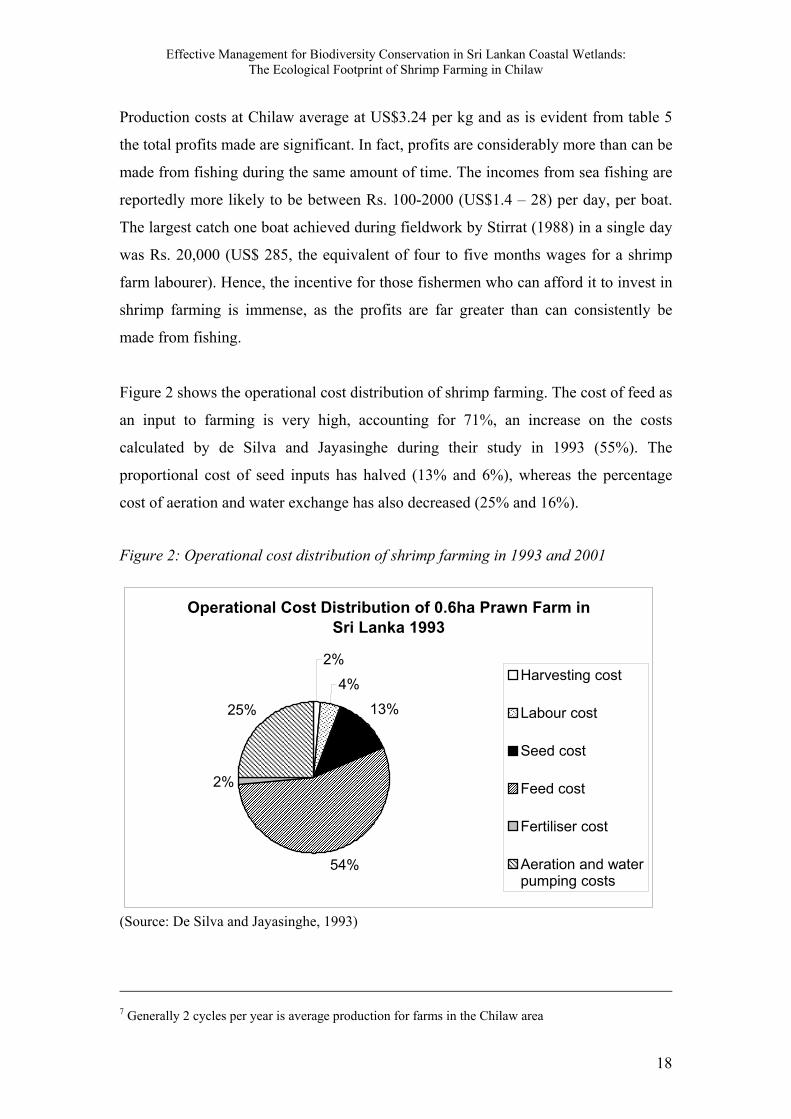
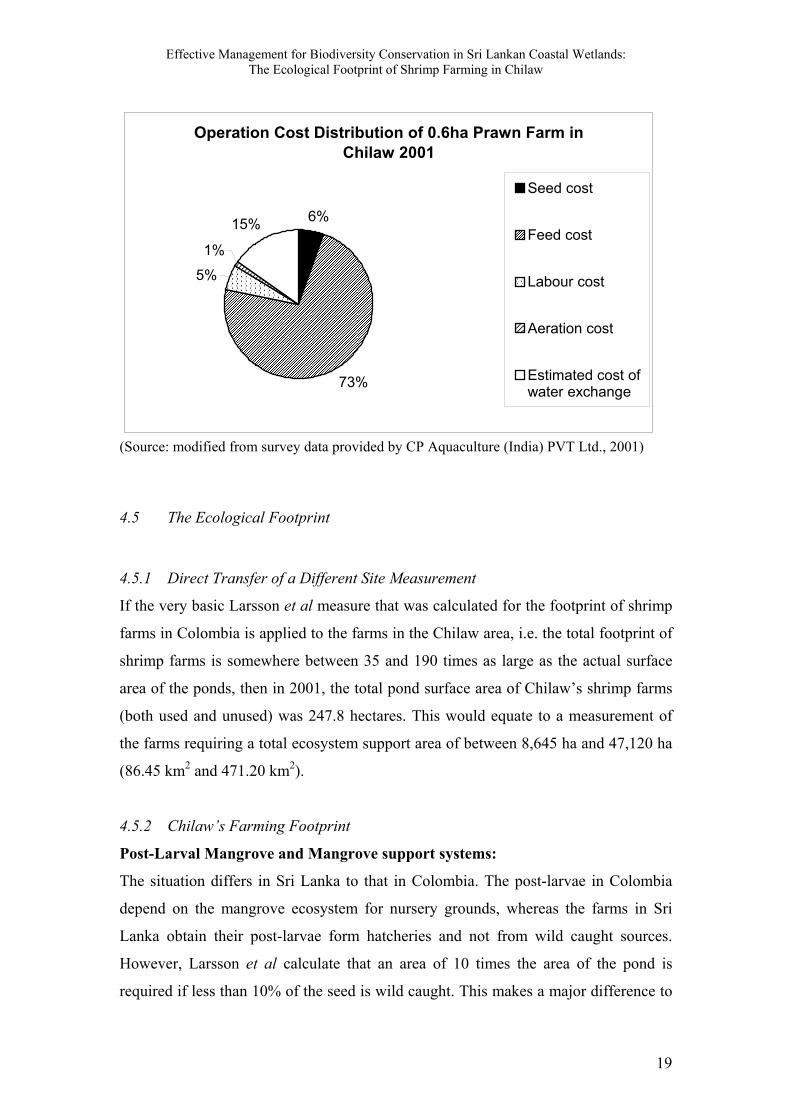
Figure 2 shows the operational cost distribution of shrimp farming. The cost of feed as
an input to farming is very high, accounting for 71%, an increase on the costs
calculated by de Silva and Jayasinghe during their study in 1993 (55%). The
proportional cost of seed inputs has halved (13% and 6%), whereas the percentage
cost of aeration and water exchange has also decreased (25% and 16%).
Figure 2: Operational cost distribution of shrimp farming in 1993 and 2001
������������������������������������������������������������������������
������������������������������������������������������������������������������������������������������������������������������������������������������������������������������������������������������������������������������������������������������������������������������������������������������������������������������������������������������������������������������������������������������������������������������������������������������������������������������������������������
������������������������������������������������������������������������������������������������������������������������������������������������������������������������������������
Operational Cost Distribution of 0.6ha Prawn Farm in Sri Lanka 1993
2%4%
13%
54%
2%
25%
Harvesting cost
�����Labour cost
Seed cost
�����Feed cost
Fertiliser cost
�����Aeration and waterpumping costs
(Source: De Silva and Jayasinghe, 1993)
7 Generally 2 cycles per year is average production for farms in the Chilaw area
Effective Management for Biodiversity Conservation in Sri Lankan Coastal Wetlands:The Ecological Footprint of Shrimp Farming in Chilaw
19
������������������������������������������������������������������������������������������������������������������������������������������������������������������������������������������������������������������������������������������������������������������������������������������������������������������������������������������������������������������������������������������������������������������������������������������������������������������������������������������������������������������������������������������������������������������������������������������������������������������������
���������������������������������������������������������������������������������������
���������������������������������������������������������������������������
Operation Cost Distribution of 0.6ha Prawn Farm in Chilaw 2001
6%
73%
5%1%
15%
Seed cost����������Feed cost
�����Labour cost
�����Aeration cost
Estimated cost ofwater exchange
(Source: modified from survey data provided by CP Aquaculture (India) PVT Ltd., 2001)
4.5.1 Direct Transfer of a Different Site Measurement
If the very basic Larsson et al measure that was calculated for the footprint of shrimp
farms in Colombia is applied to the farms in the Chilaw area, i.e. the total footprint of
shrimp farms is somewhere between 35 and 190 times as large as the actual surface
area of the ponds, then in 2001, the total pond surface area of Chilaw’s shrimp farms
(both used and unused) was 247.8 hectares. This would equate to a measurement of
the farms requiring a total ecosystem support area of between 8,645 ha and 47,120 ha
(86.45 km2 and 471.20 km2).
4.5.2 Chilaw’s Farming Footprint
Post-Larval Mangrove and Mangrove support systems:
The situation differs in Sri Lanka to that in Colombia. The post-larvae in Colombia
depend on the mangrove ecosystem for nursery grounds, whereas the farms in Sri
Lanka obtain their post-larvae form hatcheries and not from wild caught sources.
However, Larsson et al calculate that an area of 10 times the area of the pond is
required if less than 10% of the seed is wild caught. This makes a major difference to
4.5 The Ecological Footprint
Effective Management for Biodiversity Conservation in Sri Lankan Coastal Wetlands:The Ecological Footprint of Shrimp Farming in Chilaw
20
the possible outcome of a ‘footprint’ measurement and for the purposes of this study;
the latter mangrove post-larvae support system will be used. Mangrove detrital matter
is not directly incorporated into the farming systems found in Chilaw, and as a result
the measurement will not be taken. However, consideration should be taken of the
waste assimilation capacity of the mangroves in reducing the footprint. The Larsson
study does not consider the ‘cleaning’ function that the mangroves and fish within the
lagoon may perform on the effluent water and the possible reduction of the ‘footprint’
as a result of this.
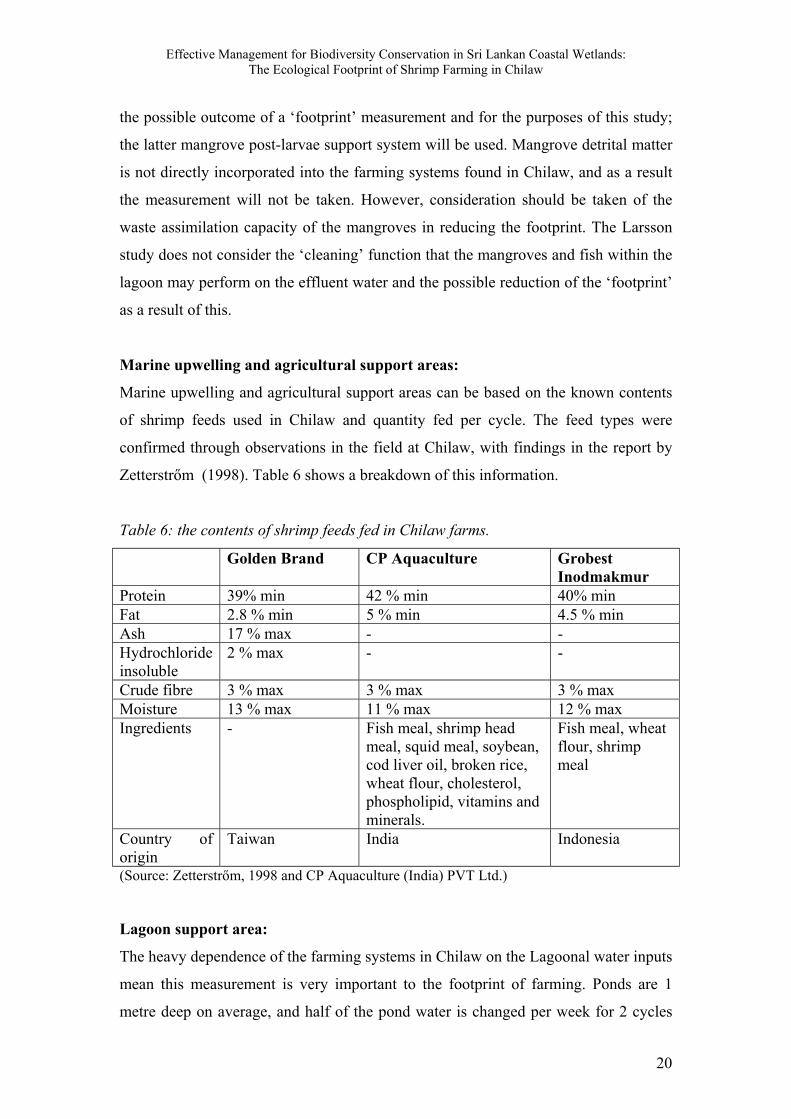
Marine upwelling and agricultural support areas:
Marine upwelling and agricultural support areas can be based on the known contents
of shrimp feeds used in Chilaw and quantity fed per cycle. The feed types were
confirmed through observations in the field at Chilaw, with findings in the report by
Zetterstrőm (1998). Table 6 shows a breakdown of this information.
Table 6: the contents of shrimp feeds fed in Chilaw farms.
Golden Brand CP Aquaculture GrobestInodmakmur
Protein 39% min 42 % min 40% minFat 2.8 % min 5 % min 4.5 % minAsh 17 % max - -Hydrochlorideinsoluble
2 % max - -
Crude fibre 3 % max 3 % max 3 % maxMoisture 13 % max 11 % max 12 % maxIngredients - Fish meal, shrimp head
meal, squid meal, soybean,cod liver oil, broken rice,wheat flour, cholesterol,phospholipid, vitamins andminerals.
Fish meal, wheatflour, shrimpmeal
Country oforigin
Taiwan India Indonesia
(Source: Zetterstrőm, 1998 and CP Aquaculture (India) PVT Ltd.)
Lagoon support area:
The heavy dependence of the farming systems in Chilaw on the Lagoonal water inputs
mean this measurement is very important to the footprint of farming. Ponds are 1
metre deep on average, and half of the pond water is changed per week for 2 cycles
Effective Management for Biodiversity Conservation in Sri Lankan Coastal Wetlands:The Ecological Footprint of Shrimp Farming in Chilaw
21
per year. The pond surface area is 2,478,000 m2, half of which is removed weekly,
which is 1,239,000 m3, as the ponds are generally in use for 33.66 weeks of the year,
this means that 41,704,740 m3 used in water exchange with lagoon per year.
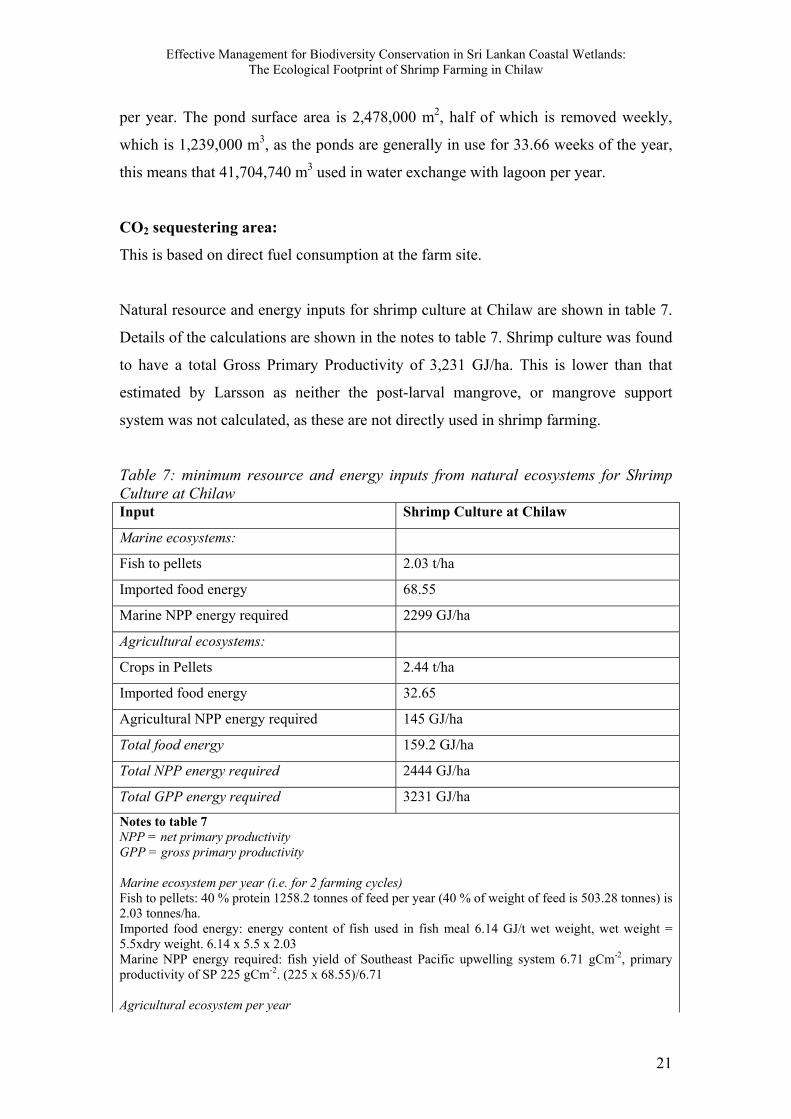
CO2 sequestering area:
This is based on direct fuel consumption at the farm site.
Natural resource and energy inputs for shrimp culture at Chilaw are shown in table 7.
Details of the calculations are shown in the notes to table 7. Shrimp culture was found
to have a total Gross Primary Productivity of 3,231 GJ/ha. This is lower than that
estimated by Larsson as neither the post-larval mangrove, or mangrove support
system was not calculated, as these are not directly used in shrimp farming.
Table 7: minimum resource and energy inputs from natural ecosystems for ShrimpCulture at ChilawInput Shrimp Culture at Chilaw
Marine ecosystems:
Fish to pellets 2.03 t/ha
Imported food energy 68.55
Marine NPP energy required 2299 GJ/ha
Agricultural ecosystems:
Crops in Pellets 2.44 t/ha
Imported food energy 32.65
Agricultural NPP energy required 145 GJ/ha
Total food energy 159.2 GJ/ha
Total NPP energy required 2444 GJ/ha
Total GPP energy required 3231 GJ/ha
Notes to table 7NPP = net primary productivityGPP = gross primary productivity
Marine ecosystem per year (i.e. for 2 farming cycles)Fish to pellets: 40 % protein 1258.2 tonnes of feed per year (40 % of weight of feed is 503.28 tonnes) is2.03 tonnes/ha.Imported food energy: energy content of fish used in fish meal 6.14 GJ/t wet weight, wet weight =5.5xdry weight. 6.14 x 5.5 x 2.03Marine NPP energy required: fish yield of Southeast Pacific upwelling system 6.71 gCm-2, primaryproductivity of SP 225 gCm-2. (225 x 68.55)/6.71
Agricultural ecosystem per year
Effective Management for Biodiversity Conservation in Sri Lankan Coastal Wetlands:The Ecological Footprint of Shrimp Farming in Chilaw
22
Crops in pellets: 12 % is water, assume 48 % agricultural produce 1258.2 tonnes of feed per year (48 %of weight of feed is 603.94 tonnes) is 2.44 tonnes/haImported food energy: agricultural products 1.78 t/ha wet weight, food energy 13.38 J/t, 2.44 x 13.38Agricultural NPP energy required: total energy content of cereal and soybean plant equal to 4.44 timesthe energy content of edible products. 32.65 x 4.44
Total food energyShrimp yield (3.72 t/ha) x (0.26 dry weight) x (energy content 25.953GJ/t) / (shrimp growth efficiency0.15766 J/J)Total NPP energy requiredMarine NPP + Agricultural NPP. 2299 +145
Total GPP energy requiredGPP = Agricultural GPP + Marine GPP; Agricultural GPP = 1.67 x NPP, marine GPP = 1.3 x NPP.242 + 3989
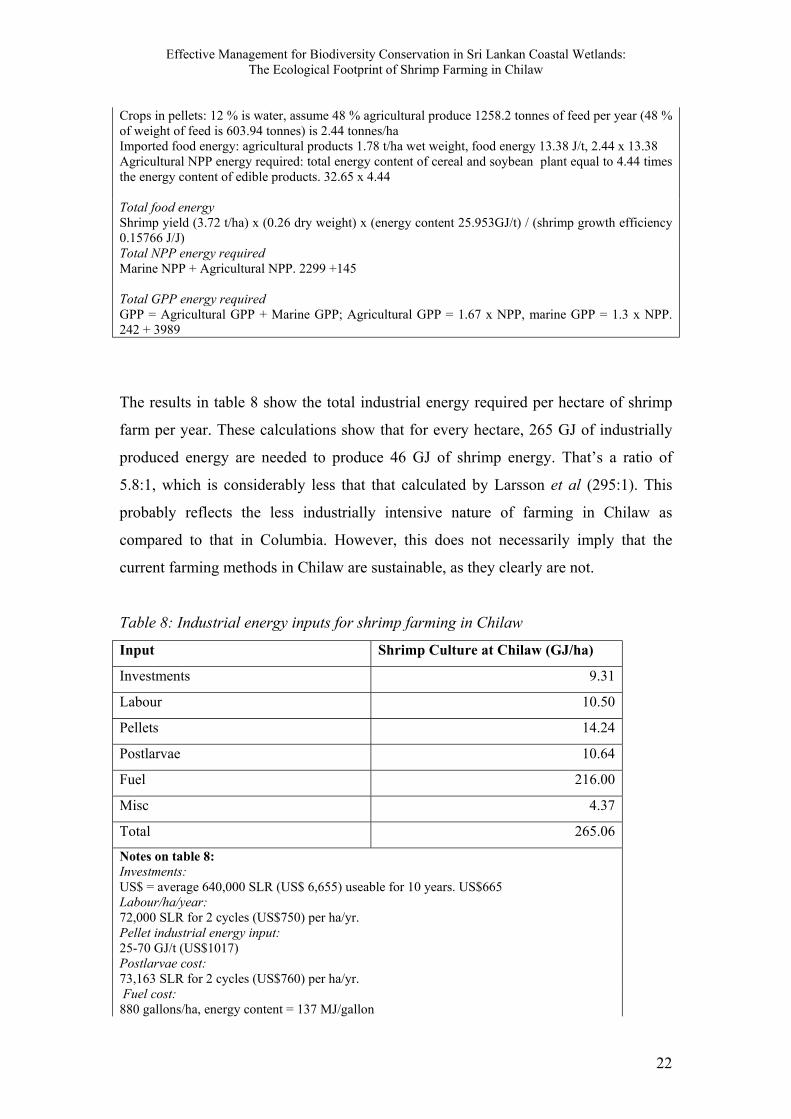
The results in table 8 show the total industrial energy required per hectare of shrimp
farm per year. These calculations show that for every hectare, 265 GJ of industrially
produced energy are needed to produce 46 GJ of shrimp energy. That’s a ratio of
5.8:1, which is considerably less that that calculated by Larsson et al (295:1). This
probably reflects the less industrially intensive nature of farming in Chilaw as
compared to that in Columbia. However, this does not necessarily imply that the
current farming methods in Chilaw are sustainable, as they clearly are not.
Table 8: Industrial energy inputs for shrimp farming in Chilaw
Input Shrimp Culture at Chilaw (GJ/ha)
Investments 9.31
Labour 10.50
Pellets 14.24
Postlarvae 10.64
Fuel 216.00
Misc 4.37
Total 265.06
Notes on table 8:Investments:US$ = average 640,000 SLR (US$ 6,655) useable for 10 years. US$665Labour/ha/year:72,000 SLR for 2 cycles (US$750) per ha/yr.Pellet industrial energy input:25-70 GJ/t (US$1017)Postlarvae cost:73,163 SLR for 2 cycles (US$760) per ha/yr. Fuel cost:880 gallons/ha, energy content = 137 MJ/gallon
Effective Management for Biodiversity Conservation in Sri Lankan Coastal Wetlands:The Ecological Footprint of Shrimp Farming in Chilaw
23
Miscellaneous:30,000 SLR for 2 cycles (US$312) per ha/yr.0.014GJ/US$ (in Sri Lanka) by total energy use/GNP (221,525,000 GJ/15.7 US$ billion)Shrimp energy content = 6.14 GJ/tShrimps produced = 7.44 t/ha/yrShrimp energy produced per hectare per year = 45.68 GJ
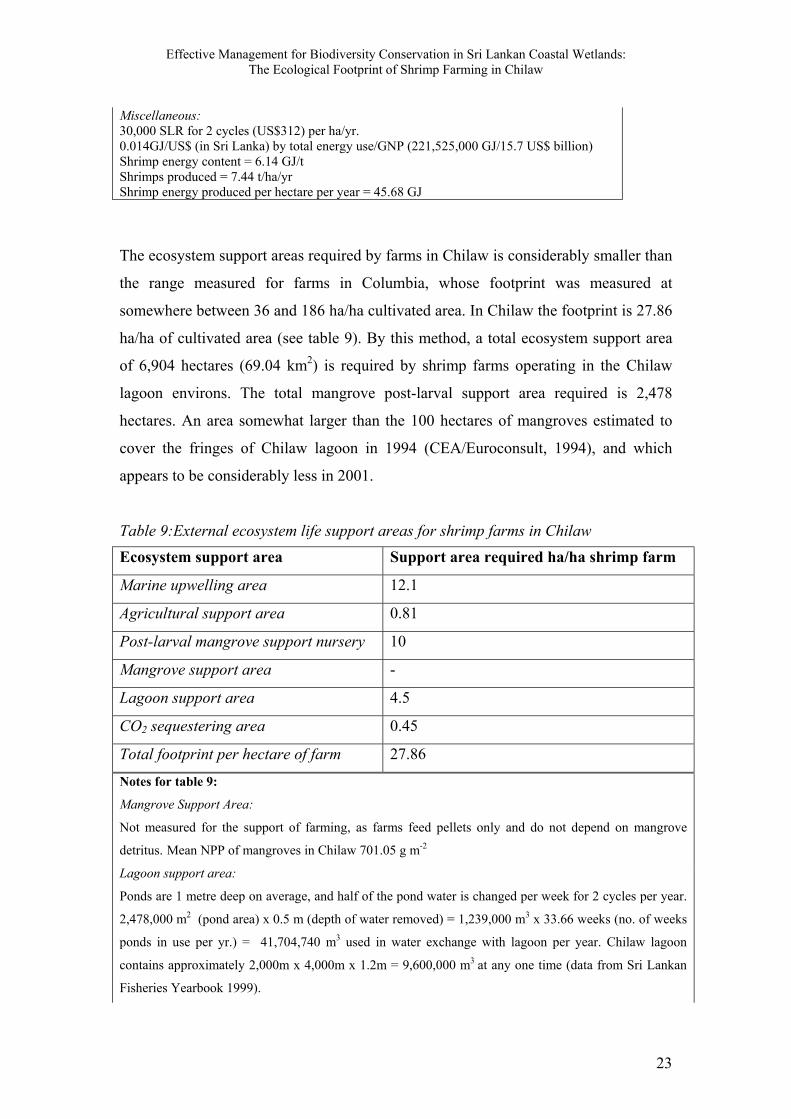
The ecosystem support areas required by farms in Chilaw is considerably smaller than
the range measured for farms in Columbia, whose footprint was measured at
somewhere between 36 and 186 ha/ha cultivated area. In Chilaw the footprint is 27.86
ha/ha of cultivated area (see table 9). By this method, a total ecosystem support area
of 6,904 hectares (69.04 km2) is required by shrimp farms operating in the Chilaw
lagoon environs. The total mangrove post-larval support area required is 2,478
hectares. An area somewhat larger than the 100 hectares of mangroves estimated to
cover the fringes of Chilaw lagoon in 1994 (CEA/Euroconsult, 1994), and which
appears to be considerably less in 2001.
Table 9:External ecosystem life support areas for shrimp farms in Chilaw
Notes for table 9:
Mangrove Support Area:
Not measured for the support of farming, as farms feed pellets only and do not depend on mangrove
detritus. Mean NPP of mangroves in Chilaw 701.05 g m-2
Lagoon support area:
Ponds are 1 metre deep on average, and half of the pond water is changed per week for 2 cycles per year.
2,478,000 m2 (pond area) x 0.5 m (depth of water removed) = 1,239,000 m3 x 33.66 weeks (no. of weeks
ponds in use per yr.) = 41,704,740 m3 used in water exchange with lagoon per year. Chilaw lagoon
contains approximately 2,000m x 4,000m x 1.2m = 9,600,000 m3 at any one time (data from Sri Lankan
Fisheries Yearbook 1999).
Ecosystem support area Support area required ha/ha shrimp farm
Marine upwelling area 12.1
Agricultural support area 0.81
Post-larval mangrove support nursery 10
Mangrove support area -
Lagoon support area 4.5
CO2 sequestering area 0.45
Total footprint per hectare of farm 27.86
Effective Management for Biodiversity Conservation in Sri Lankan Coastal Wetlands:The Ecological Footprint of Shrimp Farming in Chilaw
24
CO2 sequestering area:
Fuel: cost of aeration = 21,853 SLR; cost of pumping = 89,484 SLR; total cost = 111,337 SLR;
cost of fuel/litre = 0.27 SLR; litres used = 824,718; litres/ha/yr = 3,328; release 8.15 t CO2/ha/yr, in order
to estimate the surface area needed for carbon sequestration, a carbon assimilation capacity of 18.3 t
CO2/ha. Not including CO2 produced in shrimp feed manufacturing, industrial fishing etc.
The area required for lagoon water support is calculated to be 4.5 times the surface
area of the farms. This means a lagoon water surface area of 1,115 hectares is required
per year to support farming in Chilaw. This, perhaps, can help explain the problems
the industry in Chilaw, Mundal and Puttalam has suffered from poor quality lagoon
water as a result of self-pollution.
To suggest a management plan for the implementation of mangroves as biofilters in
Chilaw lagoon is beyond the scope of this research. However, it is an interesting
option, which may assist in a more sustainable development of shrimp aquaculture,
and one that is considered briefly here.
The potential benefit of integrating mangrove and shrimp farms to protect ponds
against erosion, to enhance the productivity of supply water and to treat pond
effluents has been investigated extensively in the past (Gautier et al, 2001). Effluents
from shrimp ponds have in the past been treated by the use of sedimentation ponds,
mollusc culture and seaweed and microalgae culture. However, there are drawbacks to
these methods, including the need for increased space on a farm for sedimentation
ponds, something, which in an overcrowded coastal zone is not always feasible
(ibid.).
An alternative is the use of wetlands as a biofilter for the effective removal of solids
and the transformation of excess nutrients. Experimental constructed wetlands, using
planted vegetation, have been tested successfully for treating effluents from fresh
water catfish ponds in the USA, and for treating salt-water shrimp ponds in Thailand
(ibid.). The processes involved in suspended solids and nutrient removal in wetlands
include sedimentation, decomposition of organic matter, uptake of nutrients by plants
4.6 Mangroves as Biofilters
Effective Management for Biodiversity Conservation in Sri Lankan Coastal Wetlands:The Ecological Footprint of Shrimp Farming in Chilaw
25
and bacteria, nitrification-denitrification and absorption of ions by soil. Mangroves
forests have also been reported as sinks of phosphorous and nitrogen and several
authors have reported their effectiveness in removing nutrients from effluent water
(Gautier et al, 2001).
The approach of combining shrimp farms and mangroves to act as biofilters, is
supported by many environmentalists, as a positive move in the sustainable
management of shrimp farms. In theoretical studies (Rivera-Monroy et al, 1999),
calculations have estimated that 0.04-0.12 ha of mangrove could remove the dissolved
inorganic nitrogen from effluents produced by a 1 ha, semi-intensive shrimp pond
(Gautier et al, 2001).
In a site based study of a Colombian shrimp farm using a mangrove area as a biofilter,
Gautier et al. found that the mangrove was indeed an efficient way of removing
suspended particles from the effluent. However, they also went on to highlight the fact
that differing mangrove ecosystems would have differing capacities to perform as a
biofilter. In addition the effect of permanent flooding was not known on the mangrove
ecosystem, and could cause long-term problems and threats to biodiversity. In
addition to this, Gautier et al found that, in general, sedimentation ponds were as
efficient as mangroves as reducing sedimentation.
Nevertheless, the benefits of mangroves as biofilters for shrimp farm effluents may be
significant in areas such as Chilaw, where space is limited for the siting of
sedimentation ponds, and the regeneration of mangroves may be beneficial to more
interest groups than simply shrimp farmers. Here, the replanting of mangroves, if
managed effectively could benefit local communities for livestock fodder, firewood
and traditional uses and fisher groups, as the presence of mangroves have been shown
to increase shrimp fishery productivity in Chilaw lagoon (Jayasundera et al. 1999).
Effective Management for Biodiversity Conservation in Sri Lankan Coastal Wetlands:The Ecological Footprint of Shrimp Farming in Chilaw
26
5. Tentative conclusions
Shrimp farming in Chilaw has many environmental problems including self-pollution
of the lagoon water, which contributes towards the spread of shrimp diseases. This
reduces the productivity, and success of farming ventures in the lagoon, increasing
vulnerability to the shocks and stresses experienced by less wealthy farmers has
negative impacts on household income and increases hardship.
The clearance of mangroves also has an affect on the capacity of the lagoon to sustain
the present levels of production in Chilaw. The cleaning capacity of mangroves will
continue to be important to the productivity while the farms are dependent on lagoon
water working in open-culture systems. NARA, the government agency concerned
with research into shrimp culture has recommended an increase in the use of closed
culture systems. Essentially, there are too many farms in the vicinity of the lagoon
given the current farming methods, should the farms change their methods in favour
of closed-farming systems, then this situation would alter.
The ecological footprint of shrimp farming in Chilaw is not as large as that observed
in the farming methods of Colombia. However, it is sufficient in size to be a cause for
concern when the footprint is scaled up to consider all farms in Sri Lanka. The area
under cultivation in 2001 was estimated to be 2,760 ha (Siriwardena, unpublished).
The minimum footprint measure is then a total ecosystem support area of 76,894 ha,
and a required mangrove support area of 27,600 ha. Sri Lanka’s mangroves are
approximately 12,500 ha in extent. By this measure the mangrove area in Sri Lanka is
insufficient to support the current area of shrimp farms.
Effective Management for Biodiversity Conservation in Sri Lankan Coastal Wetlands:The Ecological Footprint of Shrimp Farming in Chilaw
27
6. References
DS Chilaw 2001. Data available from the Divisional Secretariat in Chilaw.
Siriwardena, P.P.G.S.N. Management Strategies for Major Diseases in ShrimpAquaculture in Sri Lanka. NARA, Unpublished.
Chilaw Estuary. Wetland Conservation Project. Central Environmental Authority (SriLanka)/Euroconsult (Netherlands). May 1994.
DS Chilaw 1998. DS Resource Profile. Data available from the Divisional Secretariatin Chilaw.
Stirrat, R.L. 1988. On the Beach. Fishermen, Fish Wives and Fish Traders in Post-Colonial Sri Lanka. Hindustan Press, Delhi.
Foell, J., Harrison, E. and Stirrat, R.L. 2000. Participation, Patrons and the Village:The case of coastal zone management in the Puttalam District, Sri Lanka. DfIDproject R6977. http://www.sussex.ac.uk/units/CDE/research/coastal/fr.html
Gautier, D., Amador, J. and Newmark, F. 2001. The use of mangrove wetland as abiofilter to treat shrimp pond effluents: preliminary results of an experiment on theCaribbean coast of Colombia. Aquaculture Research. Vol. 32, pp 787-799.
Jayasundera, J.W.K.K., Amarasinghe, M.D. and Ranawana, K.B. 1999. MangroveVegetative Structure and the Abundance of Shrimps in Chilaw Lagoon, Sri Lanka. SriLanka Journal of Aquatic Science. Vol. 4 pp 69-81.
Larsson, J. 1993. An Ecosystems Analysis of Shrimp Farming and Mangroves in theBay of Barbacoas, Colombia. Honours Thesis. Institution for Systems Ecology,University of Stockholm.
Wackernagel, M. and William E. Rees, Our Ecological Footprint: Reducing HumanImpact on the Earth. New Society Publishers, Gabriola Island. 1996.
Larsson, J., Folke, C. and Kautsky, N. 1994. Ecological limitations and appropriationof ecosystem support by shrimp farming in Colombia. Emvironmental ManagementVol. 18. No. 5. pp. 663-676.
Kautsky, N., Berg, H., Folke, C., Larsson, J. and Troell, M. 1997. Ecological footprintfor assessment of resource use and development limitations in shrimp and tilapiaaquaculture. Aquaculture Research. Vol. 28. pp. 753-766.
Rönnbäck, P. 1997. Evaluation of mangrove forests for finfish and shellfishproduction: challenges from an ecological perspective. Institute for Systems Ecology,University of Stockholm.
Effective Management for Biodiversity Conservation in Sri Lankan Coastal Wetlands:The Ecological Footprint of Shrimp Farming in Chilaw
28
Kautsky, N, Folke, C, Rönnbäck, P and M. Troell. The ecological footprint – a toolfor assessing resource use and development limitations in aquaculture. EC FisheriesCooperation Bulletin vol 11 no 2 ECHOS of EXPO’98.
Folke, C., N. Kautsky, H. Berg, Å. Jansson and M. Troell. The Ecological FootprintConcept for Sustainable Seafood Production: A Review. Ecological Applications, 8(1)Supplement, pp. S63-S71.1998.
Rönnbäck, P. 1999. The ecological basis for economic value of seafood productionsupported by mangrove ecosystems. Ecological Economics. Vol 29 pp 235-252.
Zetterstrőm, T. 1998. Sustainable Coastal Resource Utilisation vs. CommercialShrimp Production. MSc Thesis, Free University of Brussels.
Corea, A., Johnstone, R., Jayasinghe, J., Ekaratne, S. and Jayawardene, K. 1998. Self-pollution: A Major Threat to the Prawn Farming Industry in Sri Lanka. Ambio Vol.27No. 8.
Effective Management for Biodiversity Conservation in Sri Lankan Coastal Wetlands:The Ecological Footprint of Shrimp Farming in Chilaw
29
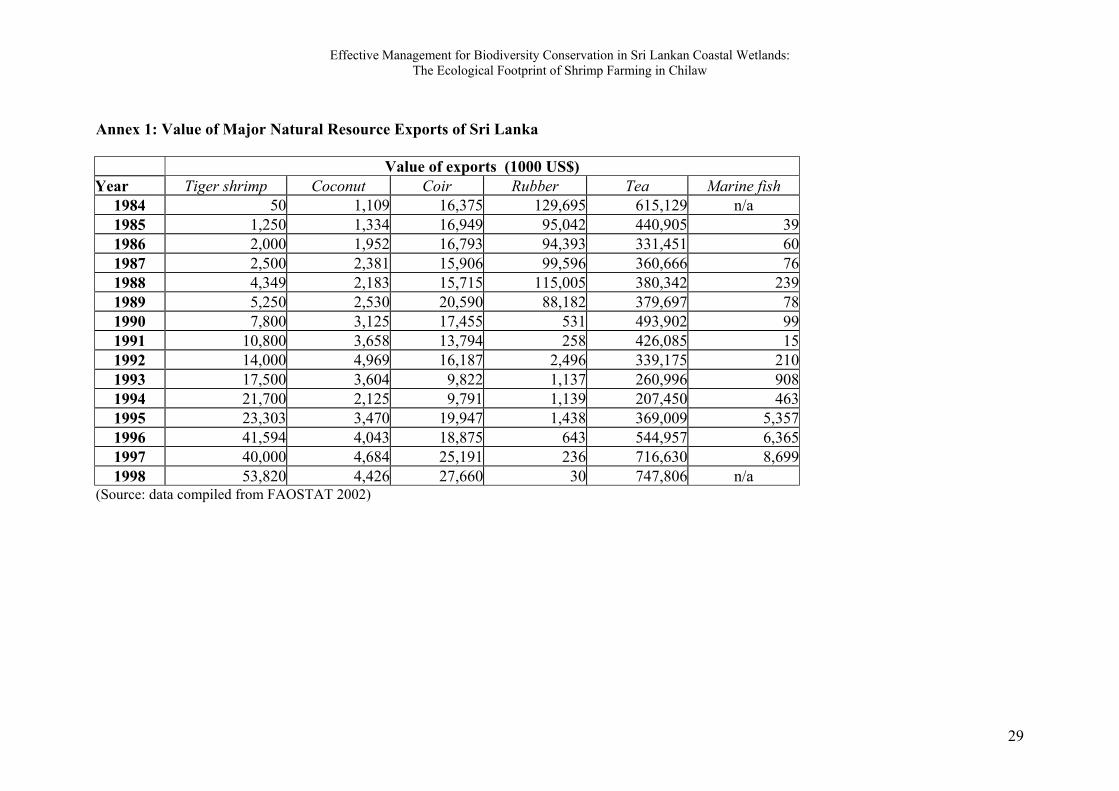
Annex 1: Value of Major Natural Resource Exports of Sri Lanka
Value of exports (1000 US$)Year Tiger shrimp Coconut Coir Rubber Tea Marine fish
1984 50 1,109 16,375 129,695 615,129 n/a1985 1,250 1,334 16,949 95,042 440,905 391986 2,000 1,952 16,793 94,393 331,451 601987 2,500 2,381 15,906 99,596 360,666 761988 4,349 2,183 15,715 115,005 380,342 2391989 5,250 2,530 20,590 88,182 379,697 781990 7,800 3,125 17,455 531 493,902 991991 10,800 3,658 13,794 258 426,085 151992 14,000 4,969 16,187 2,496 339,175 2101993 17,500 3,604 9,822 1,137 260,996 9081994 21,700 2,125 9,791 1,139 207,450 4631995 23,303 3,470 19,947 1,438 369,009 5,3571996 41,594 4,043 18,875 643 544,957 6,3651997 40,000 4,684 25,191 236 716,630 8,6991998 53,820 4,426 27,660 30 747,806 n/a
(Source: data compiled from FAOSTAT 2002)
Effective Management for Biodiversity Conservation in Sri Lankan Coastal Wetlands:The Ecological Footprint of Shrimp Farming in Chilaw
30
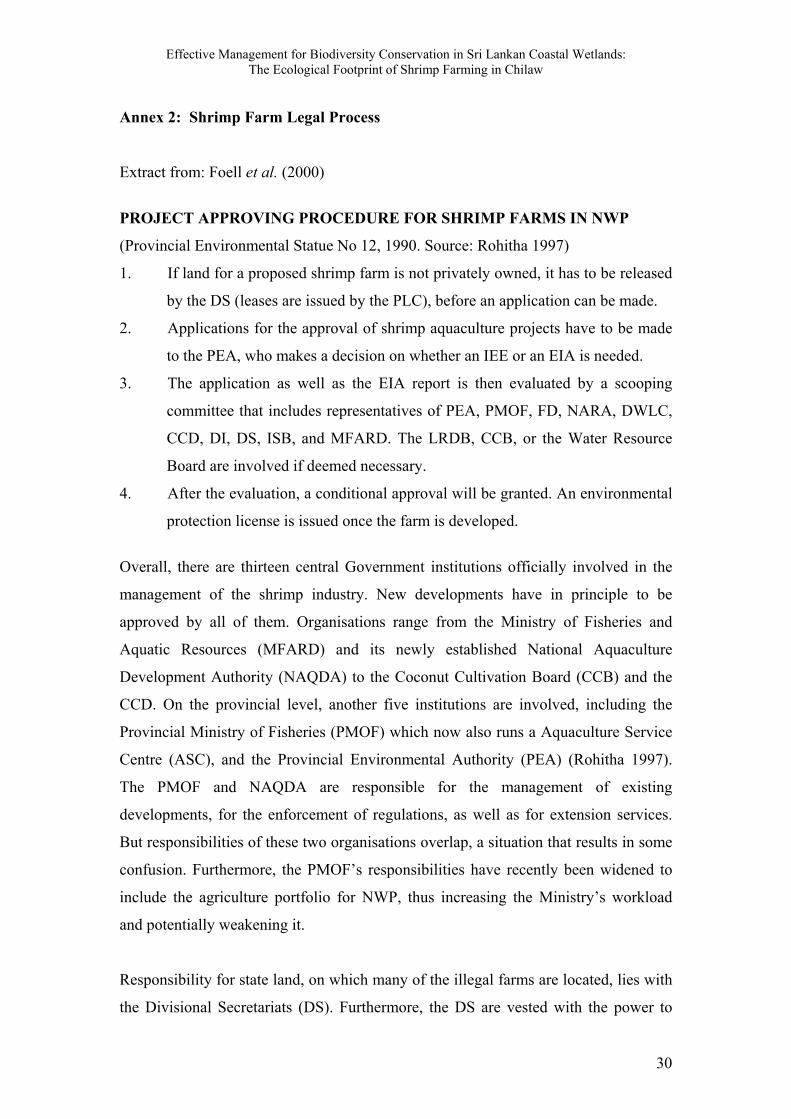
Annex 2: Shrimp Farm Legal Process
Extract from: Foell et al. (2000)
PROJECT APPROVING PROCEDURE FOR SHRIMP FARMS IN NWP
(Provincial Environmental Statue No 12, 1990. Source: Rohitha 1997)
1. If land for a proposed shrimp farm is not privately owned, it has to be released
by the DS (leases are issued by the PLC), before an application can be made.
2. Applications for the approval of shrimp aquaculture projects have to be made
to the PEA, who makes a decision on whether an IEE or an EIA is needed.
3. The application as well as the EIA report is then evaluated by a scooping
committee that includes representatives of PEA, PMOF, FD, NARA, DWLC,
CCD, DI, DS, ISB, and MFARD. The LRDB, CCB, or the Water Resource
Board are involved if deemed necessary.
4. After the evaluation, a conditional approval will be granted. An environmental
protection license is issued once the farm is developed.
Overall, there are thirteen central Government institutions officially involved in the
management of the shrimp industry. New developments have in principle to be
approved by all of them. Organisations range from the Ministry of Fisheries and
Aquatic Resources (MFARD) and its newly established National Aquaculture
Development Authority (NAQDA) to the Coconut Cultivation Board (CCB) and the
CCD. On the provincial level, another five institutions are involved, including the
Provincial Ministry of Fisheries (PMOF) which now also runs a Aquaculture Service
Centre (ASC), and the Provincial Environmental Authority (PEA) (Rohitha 1997).
The PMOF and NAQDA are responsible for the management of existing
developments, for the enforcement of regulations, as well as for extension services.
But responsibilities of these two organisations overlap, a situation that results in some
confusion. Furthermore, the PMOF’s responsibilities have recently been widened to
include the agriculture portfolio for NWP, thus increasing the Ministry’s workload
and potentially weakening it.
Responsibility for state land, on which many of the illegal farms are located, lies with
the Divisional Secretariats (DS). Furthermore, the DS are vested with the power to
Effective Management for Biodiversity Conservation in Sri Lankan Coastal Wetlands:The Ecological Footprint of Shrimp Farming in Chilaw
31
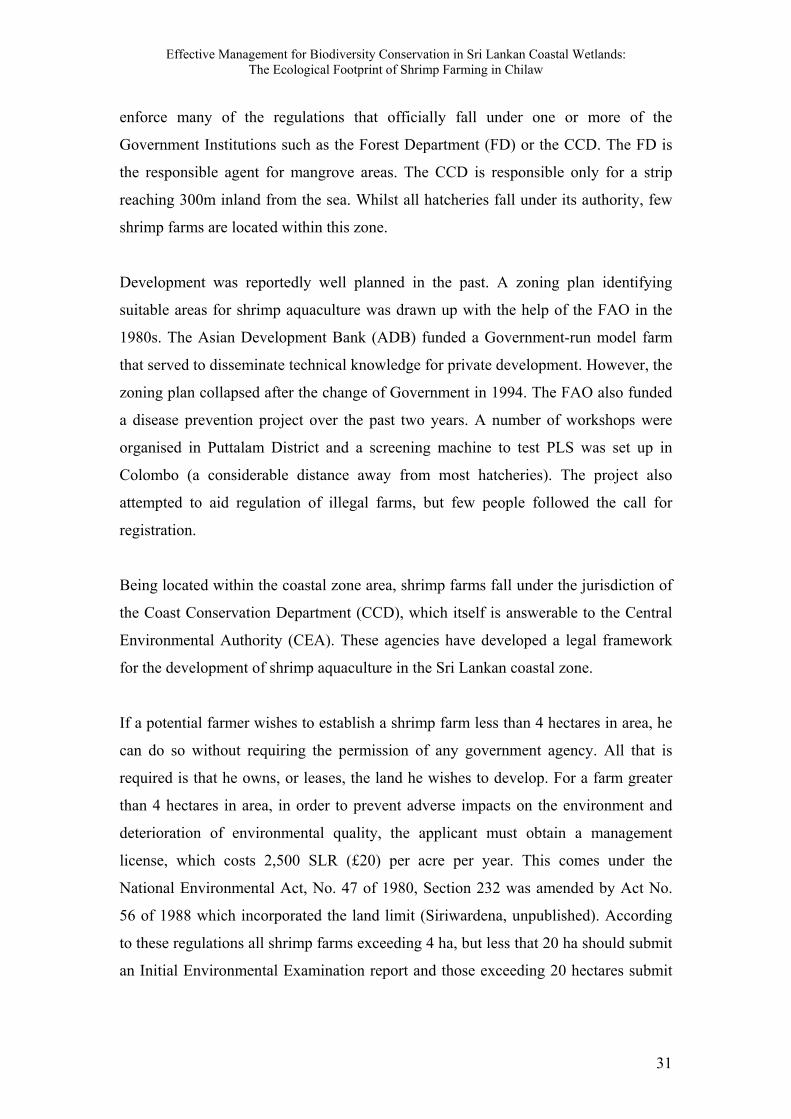
enforce many of the regulations that officially fall under one or more of the
Government Institutions such as the Forest Department (FD) or the CCD. The FD is
the responsible agent for mangrove areas. The CCD is responsible only for a strip
reaching 300m inland from the sea. Whilst all hatcheries fall under its authority, few
shrimp farms are located within this zone.
Development was reportedly well planned in the past. A zoning plan identifying
suitable areas for shrimp aquaculture was drawn up with the help of the FAO in the
1980s. The Asian Development Bank (ADB) funded a Government-run model farm
that served to disseminate technical knowledge for private development. However, the
zoning plan collapsed after the change of Government in 1994. The FAO also funded
a disease prevention project over the past two years. A number of workshops were
organised in Puttalam District and a screening machine to test PLS was set up in
Colombo (a considerable distance away from most hatcheries). The project also
attempted to aid regulation of illegal farms, but few people followed the call for
registration.
Being located within the coastal zone area, shrimp farms fall under the jurisdiction of
the Coast Conservation Department (CCD), which itself is answerable to the Central
Environmental Authority (CEA). These agencies have developed a legal framework
for the development of shrimp aquaculture in the Sri Lankan coastal zone.
If a potential farmer wishes to establish a shrimp farm less than 4 hectares in area, he
can do so without requiring the permission of any government agency. All that is
required is that he owns, or leases, the land he wishes to develop. For a farm greater
than 4 hectares in area, in order to prevent adverse impacts on the environment and
deterioration of environmental quality, the applicant must obtain a management
license, which costs 2,500 SLR (£20) per acre per year. This comes under the
National Environmental Act, No. 47 of 1980, Section 232 was amended by Act No.
56 of 1988 which incorporated the land limit (Siriwardena, unpublished). According
to these regulations all shrimp farms exceeding 4 ha, but less that 20 ha should submit
an Initial Environmental Examination report and those exceeding 20 hectares submit
Effective Management for Biodiversity Conservation in Sri Lankan Coastal Wetlands:The Ecological Footprint of Shrimp Farming in Chilaw
32
an Environmental Impact Assessment (EIA) to an approving body (depending on the
province in which the farm is to be constructed).
The application for the development of a farm in the Chilaw environs must go before
the north-west province, which then passes it on to a scoping committee which is
called to meet once a month to discuss current applications. This committee consists
of the following individuals and organisations:
• Land Commissioner
• Provincial Land Commissioner
• Deputy Land Commissioner
• Chairman CLA
• Chairman NARA
• Chairman Urban Development Agency
• Chairman Sri Lankan Land Reclamation and Development Corporation
• Director General NARESA
• Director CCD
• Director Aquatic and Coastal Resources
• Secretary for the Ministry of Fisheries
• Divisional Secretary Puttalam
• Divisional Secretary Mundel
• Divisional Director of Irrigation, Puttalam
• DFEO Puttalam
• Environmental Authority NW Province
NARA inspects the land, as does the Irrigation Department. The CCD examines the
application and reports on the contents.
According to the CCD guidelines, the farm must be sited at least 100 metres from the
waters edge (both sea and lagoon), and there must be a thirty-metre buffer zone
between itself and other farms. This buffer zone is also used to provide access to the
lagoon for the local fishermen. Once clearance is given by these agencies, the
committee reconvenes and a decision is made. The entire application process can take
up to 2 years.

Effective Management for Biodiversity Conservation in Sri Lankan Coastal Wetlands:The Ecological Footprint of Shrimp Farming in Chilaw
33
Annex 3: capital costs of shrimp farming in Chilaw area
Item Cost (rupees) CommentsFixed costs:Building of pond 100,000 Manually dug. Concrete in- and outletsLights and wiring 35,000 -3 paddle wheels 100,000 SecondhandGenerator 200,000 -Water pumps 55,000 -Total: 490,000 US$ 7,000
Variable costs:Pond preparation 10,000 Includes pond cleaning and preparation
of the soilPLS 55,000 – 100,000 Depends on market price and stocking
densityFeeds 150,000 – 300,000 Depends on survival rate, stocking
density, market price of feed, andduration of different stages ofcultivation
Fuel 140,000 35,000/month, no electricity from thegrid
Labour 36,000 2 labourers at 4,000/month each, plusadditional labour for harvest
Consultant 5,000Total 396,000 – 591,000 US$ 5,650 – 8,440(Source: Foell et al. 2001)