effect ofsewage enrichment on the phytoplankton population ... · effect ofsewage enrichment on...
TRANSCRIPT

I Hawaii Institute of Marine Biology contributionnumber 561. This work was supported by EnvironmentalProtection Agency grant number R803983. Manuscriptaccepted 5 February 1979.
2 University of Hawaii, Department of Oceanography,Honolulu, Hawaii 96822.
KANEOHE BAY is a subtropical embaymentlocated on the northeast side of the islandof Oahu in the Hawaiian Islands (Figure I).The human population of the bay's watershedhas grown rapidly over the past 60 years,
Pacific Science (1979), vol. 33, no. 2© 1980 by The University Press of Hawaii. All rights reserved
Effect of Sewage Enrichment on the Phytoplankton Population of aSubtropical Estuary 1
EDWARD A. LAWS and DONALD G. REDALJE 2
ABSTRACT: Phytoplankton primary production; concentrations of chlorophyll a, particulate carbon and nitrogen, adenosine triphosphate, inorganicnitrogen and phosphorus; and secchi depths were measured at four stationsin Kaneohe Bay, Oahu, on a biweekly basis for 20 months prior to diversionof sewage discharges from the bay. Nutrient enrichment experiments designedto determine biomass limitation indicated that phytoplankton biomass, asmeasured by chlorophyll a, was nitrogen-limited in all parts of the bay, andthat phosphorus was simultaneously limiting in the sector of the bay furthestfrom the sewer outfalls. Mean light-saturated productivity indices in all partsof the bay were about 11-12 mg C' mg- t chi a' hr- t
, values close to the maximum reported for phytoplankton in eutrophic marine environments. Basedon the results of dawn-to-dusk C-14 incubations and an estimated phytoplankton C: chi a ratio of 50 by weight, phytoplankton growth rates wereestimated to fall in the range of 4-6 percent per hour in all parts of the bay.Such growth rates are close to the maximum growth rates reported for marinephytoplankton grown on light-dark cycles in continuous culture, suggestingthat phytoplankton growth rates (as opposed to biomass) were limited primarilyby suboptimal or supraoptimal light intensities rather than by nutrients. Basedon these growth rates and an assumed phytoplankton C : N ratio of 5.68 byweight, nitrogen recycling was estimated to account for 80 percent of phytoplankton nitrogen uptake in the part of the bay receiving direct sewage inputs,and for over 90 percent of phytoplankton nitrogen uptake in the other sectorsof the bay. Estimates of living and detrital particulate carbon were madebased on an assumed C: ATP ratio in living organisms of 285 by weight.From this partitioning, living carbon was found to vary by a factor of 3-4between the sewage-enriched and unenriched sectors of the bay. However,estimated detrital carbon concentrations were uniform throughout the bay,as were the measured concentrations of inorganic nitrogen. These results areconsistent with the interpretation that the population of microorganisms, bothbacteria and phytoplankton, are substrate-limited in all sectors of the bay.
from about 3000 persons in 1920 to roughly60,000 in 1978 (Smith, Laws, and Hirota1978). This rapid development of the watershed has been associated with an increasingstress on the bay's ecosystem due to the discharge of treated sewage and urban runoff.
The first sewage treatment plant (STP) inthe watershed was constructed to serve theKaneohe Marine Corps Air Station onMokapu Peninsula during World War II. Amunicipal STP for the town of Kaneohe wasbuilt in 1963. The outfalls of both these plants
129

130 PACIFIC SCIENCE, Volume 33, April 1979
45'46'47'
Pacific Ocean
N
48'49'
NW
•
I
IIII,,
I,IIIIIII,,,----',
//
//
//
//
50'
31'
26'
29'
28'
27'
30'
32'
FIGURE I. Map of Kaneohe Bay showing sector divisions (dashed lines). Filled circles indicate station locations.
are located in the southeast sector of the bayas indicated by the crosses (x ) in Figure I.Both plants presently provide secondarytreatment by means of trickling filters. Athird and relatively small tertiary treatment
plant was built in 1969 and discharges intoAhuimanu Stream (Figure I). About 97 percent of the watershed's population is presently served by one or another of these threeplants, while the remainder of the population

Effect of Sewage Enrichment on Phytoplankton-LAWs AND REDALJE 131
is served by cesspools. As of 1977, the secondary STPs were discharging about 17,300m 3jday of effluent into the southeast sectorof the bay, while the tertiary plant was discharging about 1000 m 3jday of effluent intoAhuimanu Stream (Smith et al. 1978).
The large amount of sewage dischargedinto the southeast sector has created an artificial enrichment gradient proceeding fromthe eutrophic southeast sector to the relatively oligotrophic northwest region of thebay (Figure I). The effects of this enrichmentgradient on the plankton and coral reef communities in the bay have been the subject ofseveral investigations during the last 10 years(Banner 1974, Caperon, Cattell, and Krasnick1971, Caperon, Harvey, and Steinhilper 1976,Harvey and Caperon 1976, Hirota and Szyper1976, Szyper et al. 1976). Published studiesof the bay's phytoplankton community havebeen based on data collected over periods ofno more than 4 months at a time. Beginningin February 1976, an intensive study ofKaneohe Bay was begun to assess the statusof the ecosystem prior to anticipated diversion of the secondary-treated sewage fromthe bay. In conjunction with this study, sampling of the bay's phytoplankton communityhas been conducted on a biweekly basis since17 February 1976. This report summarizesthe results of that phytoplankton study untilthe time of the initial sewage diversion inNovember 1977.
THE STUDY AREA
Kaneohe Bay is a well-mixed subtropicalembayment with salinities generally in therange of 33-35 %0' Circulation with thePacific Ocean is somewhat restricted by abarrier reef system that extends along mostof the 8.8-km mouth of the bay. A lagoonbehind the barrier reef contains numerouspatch reefs and several small islands. Fringingreefs are found along most of the landwardshoreline. Although the mean depth of thebay is only about 6 m, the mean depth of thesoutheast sector is about twice this value,and a ship channel dredged to a depth ofabout 12 m extends along the principal axis
of the bay. The southeast sector of the bay ispartially isolated from the rest of the bay byCoconut Island (Figure I) and a system ofshallow reefs. As a result, circulation in thesoutheast sector is somewhat sluggish; themean residence time of water in the southeastsector has been estimated to be about 2 weeks,while the residence time of water in the restof the bay is about 10 days (Smith et al. 1978).For purposes of the phytoplankton study,sampling areas were initially established inthe southeast sector (SE), and in the central(CE) and northwest (NW) parts of the bay(Figure I). In September 1976, a fourth station was added near the Kaneohe municipalsewer outfall (OF).
MATERIALS AND METHODS
Water samples were taken using a modifiedbilge pump fitted with an ordinary gardenhose. Primary production measurements onwater samples before and after passingthrough the pump were found not to besignificantly different (p > 0.05). The waterfrom the pump was screened through 102/lm-mesh nylon gauze in order to removethe larger zooplankton. Samples were takenfrom depths of 1,5, and 10 m at the NW, CE,and SE stations, and from I, 3, and 5 m atthe shallower OF station. Water samples tobe analyzed for nutrients and particulate concentrations were stored in polyethylene bottles which had been acid-cleaned and rinsedwith distilled water. These samples werestored in the dark at ambient water temperature until they were filtered. All filteringoperations were generally completed within4-5 hr of the time the samples were collected.Samples (200 ml) for particulate carbon (PC)and particulate nitrogen (PN) analysis werefiltered onto precombusted GFC filters andstored at - 200 C until analysis on a HewlettPackard model 185B CHN analyzer. Particulate organic carbon (POC) and particulate inorganic carbon (PIC) were determinedby precombusting samples at 5000 C for 4-6hr according to the method of Hirota andSzyper (1975). Samples (2 liter) for chlorophyll analysis were filtered onto GFC filters

132
and analyzed following the procedures recommended by Jeffrey (1974) and Jeffrey andHumphrey (1975). Phaeo-pigment corrections were made following the proceduresin Strickland and Parsons (1968: 193).
For adenosine triphosphate (ATP) extractions, either 200- or 400-ml samples werefiltered onto Nucleopore O.4-J-Lm polycarbonate filters, and the particulate ATP extracted in boiling Tris buffer at apH of 7.7.The ATP was assayed with an AMINCOphotometer by the procedure of HolmHansen and Booth (1966) but employing theluciferase enzyme preparation of Karl andLa Rock (1975). Initially, the assay was performed by the integration method (HolmHansen and Booth 1966), but after June 1977,the peak height method was employed. Thischange in procedure resulted from the discovery that the integration method fails todistinguish between ATP and other nucleotide triphosphates, particularly guanosinetriphosphate (GTP), and hence may seriouslyoverestimate the amount of ATP in a sample(Karl 1978, Karl and Holm-Hansen 1978).Comparison of ATP results before and afterthis change in methodology indicated thatthe integration method overestimated ATPconcentrations by about 50 percent at theNW, CE, and SE stations, and by about 20percent at the OF station.
Samples for nutrient analysis were filteredand stored at - 20° C until analysis on aTechnicon AutoAnalyzer. Analysis for nitrate plus nitrite was done using the cadmium-copper reduction method of Wood,Armstrong, and Richards (1967). Phosphateand ammonium analyses were performed according to the methods of Murphy and Riley(1962) and Solorzano (1969), respectively.
Primary production measurements weremade using C-14 according to the basic procedures in Strickland and Parsons (1968:267-271), except that 60-ml BOD bottleswere used to incubate the samples and theassimilated C-14 radioactivity was determined by counting on a Searle AnalyticDelta 300 liquid scintillation counter. Theactivity of C-14 spikes was determined following the recommendations of Iverson,Bittaker, and Meyers (1976). The BOD bot-
PACIFIC SCIENCE, Volume 33, April 1979
ties were incubated in situ between approximately 0930 and 1230 hr. On three occasionssunrise-to-sunset incubations were done inconjunction with short-term incubations todetermine the relationship between daily andshort-term (i.e., 0930-1230 hr) production.
Nutrient enrichment experiments were performed 5-7 times at each of the bay stationsover the course of the 20-month study period.Approximately 500-ml aliquots of prescreened (102-J-Lm-mesh) water were poured intoglass flasks which had been acid-cleaned andrinsed with distilled water. A control flaskfrom each station received no nutrient additions, while other flasks received additions offour ofthe following five essential nutrients ornutrient mixtures:
I. Nitrate, 500 J-Lm2. Phosphate, 50 J-Lm3. Silicate, 250 J-Lm4. Metal mixture: zinc, 1.7 x 10⁻³ J-Lm;
copper, 1.0 x 10⁻³ J-Lm; cobalt, 1.1 x10⁻³ J-Lm; molybdenum, 1.0 x 10⁻³ J-Lm;iron, 1.9 J-Lm; manganese, 1.2 J-Lm;Na z ' EDTA· 2H zO, 5 mg/liter
5. Vitamins: vitamin BIz, I J-Lg/liter;biotin, I J-Lg/liter; thiamine-HCI, 10J-Lg/liter
A final flask received a complete quota ofnutrient additions. The flasks were incubatedunder continuous light of about 20 J-Leinstein .m-z . sec- 1 (400-700 nm radiation) providedby cool-white fluorescent lamps and at atemperature of 22-24° C. The flasks wereusually monitored every 2-3 days for a periodof not more than I month for chlorophyll afluorescence using a Turner fluorometer.Fluorometer readings were converted tochlorophyll a concentrations using the invivo fluorescence yield for chlorophyll adetermined from a mixed population of marine phytoplankton cultures as recommendedby Strickland and Parsons (1968: 202). Thehighest chlorophyll a concentration determined by this method in each flask at anytime during the I-month period was taken tobe the yield in that flask. This approach toanalyzing nutrient enrichment results avoidsthe problems associated with short-term C-14

Effect of Sewage Enrichment on Phytoplankton-LAws AND REDALJE 133
bioassays discussed by Gerhart and Likens(1975). Since the completion of this work,Slovacek and Hannan (1977) have pointedout that the in vivo fluorescence yield ofchlorophyll a may vary with nutrient availability as well as between species. Such variability may have quantitatively affected ourenrichment yields, but we feel it is unlikelythat statistical tests on the yield results werequalitatively affected by this problem.
Secchi disk readings were made at eachstation from the sun side ofthe boat (a BostonWhaler) using a 30-cm diameter white disk(Tyler 1968). On one occasion a survey ofnumerous stations in the bay was made,combining secchi measurements with measurements of surface and subsurface photosynthetically active radiation (400-700 nm)using a quantum radiometer equipped witha cosine collector (Lambda Instrumentsmodel LI-185A). This survey provided acheck of the correlation between secchi depthand light extinction coefficient.
RESULTS
Nutrient Limitation
Two different types of experiments wereused to study nutrient limitation in the bay.The first set of experiments consisted of thenutrient enrichment experiments previouslydescribed. Of the first nine such experiments,three were performed at the CE station andtwo each at the OF, SE, and NW stations.Analysis of these results revealed that (1)yields in the flasks enriched with all nutrientsexcept silica, metals, or vitamins were greaterthan yields in the control flasks in all ninecases (p < 0.002); and (2) yields in the flasksenriched with all nutrients except silica,metals, or vitamins were not significantlydifferent (p > 0.10) from yields in the flaskthat received all nutrient additions, based ona (-test of the mean of paired differences.
We therefore concluded that silica, metals,and vitamins were not limiting phytoplanktonbiomass in Kaneohe Bay. The remainingexperiments concentrated exclusively on thequestion of inorganic nitrogen (N;) and
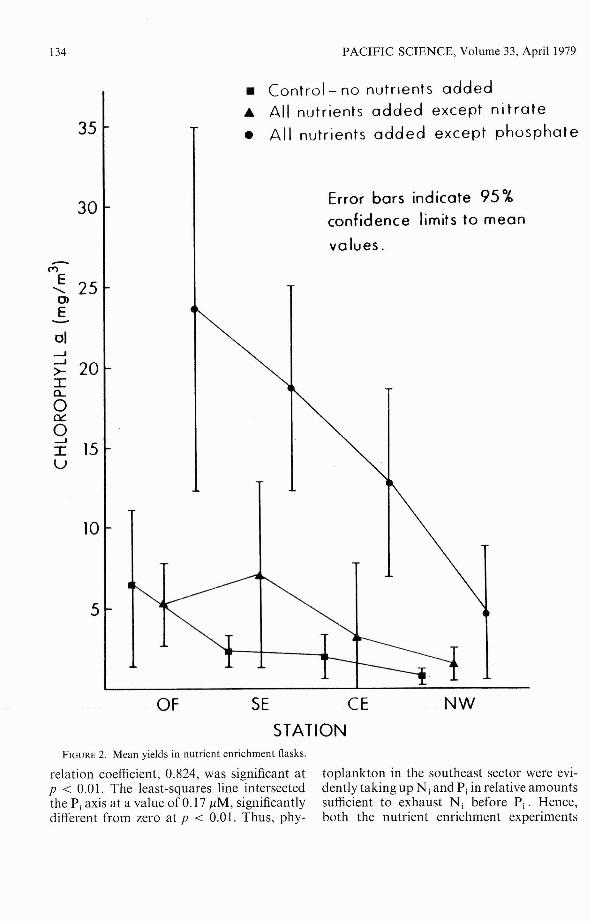
inorganic phosphorus (P;) limitation. Figure2 summarizes the results of the enrichmentexperiments relevant to the question of N j
and Pi limitation.Based on a t-test of the mean of paired
differences, the following conclusions couldbe reached from these results: (1) There wasno difference at any of the stations betweenyields in the control flasks and the flaskswith no nitrates. (2) There was a significant(p < 0.01) difference between yields in thecontrol flask and the flask with no phosphates, and· between yields in the no-phosphate and no-nitrate flasks at the OF, SE,and CE stations. (3) There was no significantdifference between yields in the control, nophosphate, and no-nitrate flasks at the NWstation.
On the basis of these experiments, we concluded that nitrogen was limiting phytoplankton biomass in all parts of the bay, butthat phosphorus was simultaneously limiting(or nearly so) with nitrogen at the NW station.
As a check on nutrient limitation in thesoutheast sector, a series of stations was setup on a transect beginning near the Kaneohemunicipal sewer outfall and extending awayfrom the outfall in roughly a NNE directionto the center of the southeast sector. Samplesfrom approximately 1 m depth were takenfor Pi and N j analysis along this transecton 18 occasions between September 1976 andMarch 1977. Nutrient concentrations nearthe outfall were of course rather high, butdeclined steadily with increasing distancefrom the outfall due to the combined effectsof mixing (dilution) and nutrient uptake bythe phytoplankton. By plotting the concentrations of N j against Pi' it was possible toestimate which nutrient would be exhaustedfirst. This technique is analogous to themethod used by Edmondson (1970), whoplotted nitrate concentration versus phosphate concentration during the spring bloomin Lake Washington, but in this case we madeuse of a spatial rather than temporal variation in nutrient concentrations. The datapoints were fit by a straight line using thegeometric mean model II regression technique suggested by Ricker (1973). The cor-
134
35
30
-MJ:: 250>E-01-J
>= 20Ia...aa::a-J
I 15u
10
5
PACIFIC SCIENCE, Volume 33, April 1979
• Control- no nutrients added• All nutrients added except nitrate
• All nutrients added except phosphate
Error bars indicate 95 %confidence limits to mean
values.
OF SE CE
STATION
NW
FIGURE 2. Mean yields in nutrient enrichment flasks.
relation coefficient, 0.824, was significant atp < 0.0 I. The least-squares line intersectedthe Pi axis at a value of 0.17 pM, significantlydifferent from zero at p < 0.01. Thus, phy-
toplankton in the southeast sector were evidently taking up N i and Pi in relative amountssufficient to exhaust N i before Pi' Hence,both the nutrient enrichment experiments
MM-ffl¥ . Ii r tb2if.lfidS1J2£E24 MfflfMll!!: HE g;;;;;

Effect of Sewage Enrichment on Phytoplankton-LAWs AND REDALJE 135
and the nutrient gradient study indicated thatN i was more limiting than Pi to phytoplankton biomass in the southeast sector.
where K is the extinction coefficient (m'-!)and D is the secchi depth (m) (Sverdrup,Johnson, and Fleming 1942: 82). A checkon the validity of equation (2) was possiblefrom the set of secchi depths and visible light(400-700 nm) intensity profiles made at various stations in the bay on 9 August 1977,
Light Limitation
The photosynthetic rate of phytoplanktoncan be expressed as the product of the phytoplankton chlorophyll a concentration timesthe photosynthetic rate per unit of chlorophyll G, i.e., the productivity index. Althoughit is evident from the previous discussion thatnitrogen primarily limited the phytoplanktonbiomass as measured by chlorophyll a inKaneohe Bay, it is logical to expect fromprevious work (Platt and Jassby 1976, Steemann Nielsen and Jq\rgensen 1968) thatproductivity indices would be strongly influenced by the supply of light. In general,one expects productivity indices to varylinearly with light intensity at low light levels,to saturate at some optimal light level, andto decline at higher light levels due to photoinhibition. A simple analytical model expressing this relationship has been workedout by Steele (1965: 389), who adopted anempirical equation of the form
p = Pm . I. exp (I - ~) (I)1m 1m
where P is the productivity index, I is lightintensity, and 1m and Pm are empirical parameters. Clearly, Pm is to be interpreted asthe light-saturated value of P and 1m is thecorresponding light intensity. In applyingequation (I) to our field data, we assumedthat light intensity varied exponentially inthe water column and that the extinctioncoefficient of light could be estimated fromthe commonly assumed expression
(3)
Extinction coefficients were estimated fromthe natural logarithm of'the ratio of surfacelight intensity to the light intensity at a givendepth. Extinction coefficients calculated inthis way showed little variation with depthin most parts of the bay and were describedquite well by equation (2). However, at theOF station, significant stratification of thewater column was apparent, causing theextinction coefficient to change by about afactor of 2 in the first few meters. Analysisof particulate concentrations (see followingresults) and salinity (Smith et al. 1978) indicated that this stratification was a persistentfeature near the OF station, due to the tendency of the sewage plume to rise to thesurface. Because we had no detailed information on the variation of light intensity withdepth at the OF station, it was impossible toexamine the photosynthesis versus light relationships at that station. At the other baystations, we used equation (2) to rewriteequation (I) in the form
P = P . 10 exp (_ 1.7X)m 1
mD
.exP[I- J:'exp (_l~X)J
where 10 is the surface light intensity and xis the depth at which P is measured. Equation(3) contains only two independent empiricalparameters, Pm and the ratio Im/10 ' Since ateach station we measured photosyntheticrates and chlorophyll G concentrations atthree depths on each sampling day, it wasnecessary to use a least-squares method tofind the values of Pm and Im/10 that gave thebest fit to the data on each day and at eachstation. Because Pm appears as a linearparameter in equation (3) it was necessaryonly to search for the best value of I m/10 ,
since the optimum value of Pm could be determined in a straightforward manner for agiven value of 1m /10 ' From a total of 129such analyses, we found 3 caseS that gaveunreasonable parameter values and we simplyignored these in analyzing our results. Because of the gradient in trophic status of ourstations in the order OF (eutrophic), SE, CE,
(2)K = 12D

136 PACIFIC SCIENCE, Volume 33, April 1979
TABLE I
MEAN PARAMETER VALUES FROM THE LiGHT LIMITATION STUDY
STATION
OFSECENW
Pm (mg C' mg- 1 chi a 'Ilf-') ±95% CONFIDENCE LIMITS*
(12.2 ± 2.3)13.7 ± 3.0 (11.1 ± 2.1)13.1 ± 2.0 (12.3 ± 2.4)12.7 ± 1.7 (11.7 ± 1.7)
Im/IO ±95% CONFIDENCE LIMITS
0.57 ± 0.120.57 ± 0.150.49 ± 0.07
• Values in parentheses are means of the maximum productivity index measured at any depth on each sampling day.
and NW (oligotrophic), we felt that it wasinteresting to compare the mean values ofPm and Im /la at each station. Table 1 summarizes these results. For all stations, wehave included the mean of the maximumproductivity index measured at any depthon each day in order to provide a comparisonwith the OF station, where Pm could not beestimated. We did not attempt to measuremean values for la at each station duringthe C-14 incubations, and therefore couldnot determine 1m in absolute units. However,it is known that phytoplankton adapt todifferent light levels in a time scale on theorder of 1 day or less (Steemann Nielsen,Hansen, and Js6rgensen 1962), and thus largevariations in 1m could be expected due tochanges in solar insolation. Hence, we expected less scatter in the parameter Im /la thanin 1m itself.
Standing Stocks and Production
Because of the shallowness of KaneoheBay and the persistence of the tradewinds,the water column is generally well mixed.With the exception of primary productionrates, which declined significantly with depthat the SE and OF stations due to the turbidityof the water, most parameters measuredduring this study therefore showed littlesignificant variation with depth. In general,mean particulate concentrations tended toincrease slightly with depth at the SE, CE,and NW stations due to settling during calmweather, but decreased with depth at the OFstation due to the tendency of the sewageplume to rise to the surface. For example,mean chlorophyll a concentrations (±95%confidence limits) at I, 5, and 10 m were
0.54 ± 0.11, 0.61 ± 0.12, and 0.71 + 0.14mg/m 3, respectively, at the NW station. Comparable values at 1, 3, and 5 m at the OFstation were 5.07 ± 0.92, 4.10 ± 0.61, and3.22 ± 0.46 mg/m 3, respectively. For purposes of comparing the four stations, wehave simply averaged each parameter valueover the depth of sampling on each samplingday and then taken the mean of this integralaverage over all sampling days. These resultsare summarized in Table 2. We have includedin this table the mean at each depth of theprimary production rates and productivityindices as well as the mean of the integralaverages. Based on the comparisons of sunrise-to-sunset C-14 uptake with short-termC-14 uptakes, mean daytime integral production rates would be about 8.4 ± 1.0 (mean± the standard error for n = 3) times thehourly integral rates listed in Table 2.
It is noteworthy here that Caperon et al.(1976) previously found a steady increasewith time of particulate organic carbon(POC), particulate nitrogen (PN), and chlorophyll a (chi a) in the southeast sector, basedon data collected in 1970, 1972, and 1974.Examination of our data revealed evidenceof seasonal periodicity in the depth-averagedvalues of some parameters, and since the datawere collected over a nonintegral (1.66) number of years, it seemed best to filter out theeffects of seasonal periodicity before examining the data for temporal trends. Inorder to filter out seasonality, we fit the rawdata with a truncated Fourier series consisting of a constant term and sine and cosineterms having periods of I year. A leastsquares straight line was then fit to the differences between the raw data and the truncatedFourier series, and the significance of the
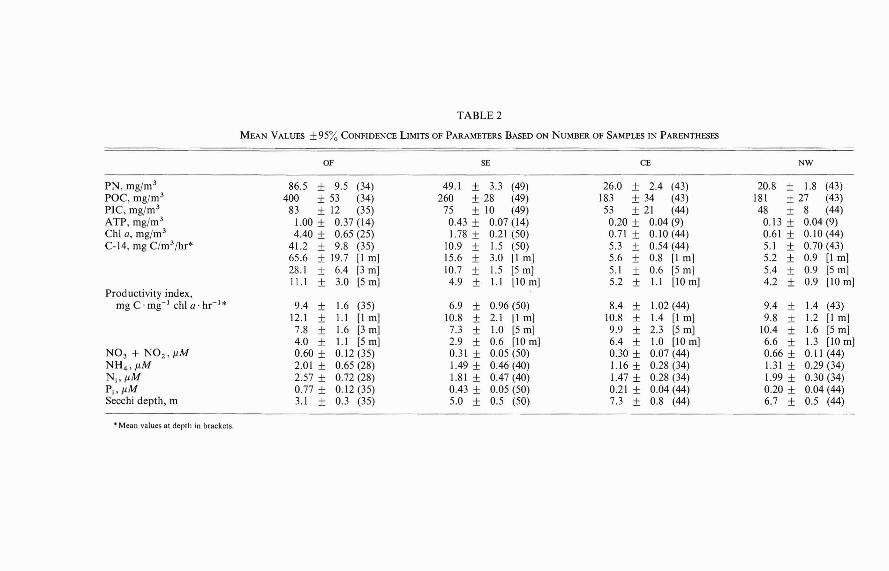
TABLE 2
MEAN VALUES ±95% CONFIDENCE LIMITS OF PARAMETERS BASED ON NUMBER OF SAMPLES IN PARENTHESES
OF SE CE NW
PN, mg/m 3 86.5 ± 9.5 (34) 49.1 ± 3.3 (49) 26.0 ± 2.4 (43) 20.8 ± 1.8 (43)POC, mg/m 3 400 ± 53 (34) 260 ± 28 (49) 183 ± 34 (43) 181 ± 27 (43)PIC, mg/m 3 83 ± 12 (35) 75 ± 10 (49) 53 ± 21 (44) 48 ± 8 (44)ATP, mg/m 3 1.00 ± 0.37 (14) 0.43 ± 0.07 (14) 0.20 ± 0.04 (9) 0.13 ± 0.04(9)Chi G, mg/m 3 4.40 ± 0.65 (25) 1.78 ± 0.21 (50) 0.71 ± 0.10 (44) 0.61 ± 0.10 (44)C-14, mg C(m3/hr* 41.2 ± 9.8 (35) 10.9 ± 1.5 (50) 5.3 ± 0.54 (44) 5.1 ± 0.70 (43)
65.6 ± 19.7 [I m] 15.6 ± 3.0 [I m] 5.6 ± 0.8 [I m] 5.2 ± 0.9 [I m]28.1 ± 6.4 [3 m] 10.7 ± 1.5 [5 m] 5.1 ± 0.6 [5 m] 5.4 ± 0.9 [5 m]11.1 ± 3.0 [5 m] 4.9 ± 1.\ [10 m] 5.2 ± l.l [10 m] 4.2 ± 0.9 [10 m]
Productivity index,mg C· mg- I chi G' hr- 1* 9.4 ± 1.6 (35) 6.9 ± 0.96 (50) 8.4 ± 1.02 (44) 9.4 ± 1.4 (43)
12.1 ± l.l [I m] 10.8 ± 2.1 [I m] 10.8 ± 1.4 [I m] 9.8 ± 1.2 [I m]7.8 ± 1.6 [3 m] 7.3 ± 1.0 [5 m] 9.9 ± 2.3 [5 m] 10.4 ± 1.6 [5 m]4.0 ± 1.1 [5 m] 2.9 ± 0.6 [10 m] 6.4 ± 1.0 [10 m] 6.6 ± 1.3 [10 m]
N0 3 + N02 , flM 0.60 ± 0.12 (35) 0.31 ± 0.05 (50) 0.30 ± 0.07 (44) 0.66 ± 0.11 (44)NH 4 , flM 2.01 ± 0.65 (28) 1.49 ± 0.46 (40) 1.16 ± 0.28 (34) 1.31 ± 0.29 (34)N;,flM 2.57 ± 0.72 (28) 1.81 ± 0.47 (40) 1.47 ± 0.28 (34) 1.99 ± 0.30 (34)P;, flM 0.77 ± 0.12 (35) 0.43 ± 0.05 (50) 0.21 ± 0.04 (44) 0.20 ± 0.04 (44)Secchi depth, m 3.1 ± 0.3 (35) 5.0 ± 0.5 (50) 7.3 ± 0.8 (44) 6.7 ± 0.5 (44)
• Mean values at depth in brackets.

138
linear regression tested using the correlationcoefficient. Based on this analysis, we founda significant positive correlation betweenprimary production rate and time at the OFand SE stations (p < 0.05 and p < 0.01,respectively), and a significant positive correlation between chi a concentration andtime at the SE station (p < 0.05). However,we found no significant temporal correlationsfor any of the other parameters listed in Table2. A similar analysis of monthly mean sewagedischarge rates from the Kaneohe municipaloutfall also revealed no significant temporalcorrelation.
DISCUSSION
Nutrient Limitation
The results of our nutrient limitationstudies are in qualitative agreement with theearlier findings of Ryther and Dunstan (1971),who performed nutrient enrichment experiments in sewage-polluted Long Island baysand along transects radiating from the NewYork bight into the Atlantic Ocean. Theyfound nitrogen to be the only nutrient limitingphytoplankton biomass in the Long Islandbays and at stations near New York harbor,but with increasing distance from the NewYork bight the Pi concentration in the watersteadily declined, and at stations beyond thecontinental shelf addition of only N i or Pito enrichment flasks produced yields littledifferent from controls. That N j should beprimarily limiting to phytoplankton biomassin sewage-enriched systems is hardly surprising; the ratio of N j to Pi in sewage isabout 6 by atoms (6.1 for the Kaneohe municipal sewage effluent), whereas phytoplankton appear to take up N i and Pi in a ratioof about 10: 15 when both nutrients arepresent in abundance (Edmondson 1970,Ryther and Dunstan 1971).
Some nutrient enrichment experiments(e.g., Thomas 1969) have indicated that N;is primarily limiting to phytoplankton biomass in certain parts of the open ocean aswell as in sewage-enriched coastal areas.Ryther and Dunstan (1971) have reasoned
PACIFIC SCIENCE, Volume 33, April 1979
that N j might be more limiting than Pi inopen ocean areas due to the slower regeneration rate of N i from detritus, but theirargument, based on a study of the decomposition of a mixed plankton population byVaccaro (1965:381), has been found to be inerror (Ryther, personal communication).They ignored the initial concentration of Piin the water containing the plankton, andtherefore overestimated the regeneration rateof Pi relative to N i' A least-squares regression of Vaccaro's (1965) Pi and N i dataversus time gives aNi: Pi regeneration ratioof 14.6 by atoms, within the preferred rangeof 10: 15 noted by Ryther and Dunstan(1971). Therefore, there is nothing in Vaccaro's (1965) data to indicate that remineralization rates would favor either Pi or N ilimitation in the open ocean. However, ina similar study of decaying plankton, Antiaet al. (1963) found very little (about 10 percent) regeneration of nitrogen over a 75-dayperiod, though over half the particulate phosphorus was remineralized in 2 weeks. Thecause of the discrepancy between the resultsof Antia et al. (1963) and Vaccaro (1965) isnot clear, but may be due to differences inthe bacterial populations present in theplankton cultures. More recently, Perry(1972) has found evidence of Pi limitation(as well as N i limitation) in the oligotrophicCentral North Pacific, based both on theresults of nutrient enrichment experimentsand on the presence of alkaline phosphataseactivity in the seawater. Her results are consistent with the findings of this work as wellas with the nutrient enrichment experimentsperformed by Ryther and Dunstan (1971)off the Atlantic continental shelf, in the sensethat all three studies showed evidence ofsimultaneous N; and Pi limitation in marineareas removed from the direct influence ofsewer outfalls or sludge dumping. Edmondson (1969, 1972) has noted that land runoffsometimes contains Ni and Pi in a ratio considerably greater than 15 by atoms, andhence Pi limitation may be favored in somecoastal systems where land runoff is a significant source of nutrients. In this respectit is noteworthy that the N i : Pi ratio in streamrunoff to Kaneohe Bay is about 21 by atoms,
_-hi'.

Effect of Sewage Enrichment on Phytoplankton - LAWS AND REDALJE 139
and that the northwest sector of the bayreceives about 59 percent of that runoff(Smith et al. 1978). This runoff is probablythe cause of the significantly elevated nitrateplus nitrite concentrations at the NW stationas compared to the CE and SE stations(Table 2), and undoubtedly contributes tothe tendency for phytoplankton biomass atthe NW station to be simultaneously limitedby N j and Pj.
Light Limitation
A comparison of mean productivity indicesas a function of depth at the four bay stations(Table 2) indicates that primary productionin the SE sector is significantly reduced dueto light attenuation, whereas at the CE andNW stations productivity indices are insignificantly different at 1 and 5 m, and declineby only about 35 percent at a depth of 10 m.In fact, productivity indices were higher ateither 5 or 10 m than at I m on 54 and 41percent of the sampling days at the NW andCE stations, respectively, indicating thatprimary production was often repressedat these stations due to photoinhibition(McAllister 1961, Ryther 1956). By contrast,productivity indices were highest at depthsbelow I m on only 19 and 7 percent of thesampling days at the SE and OF stations,respectively. Thus, primary production appears to have been close to light saturationthoughout much of the water column inthe central and northwest sectors of the bay,but light-limited below the first few metersin the southeast sector..
Considering the gradient in trophic statusand light limitation between the four baystations, the similarity in the mean valuesof Pm and ImlIO in Table I may be surprising.Based on the work of Steemann Nielsen andHansen (1959a: 362) and Steemann Nielsenand Jeprgensen (1968), one would expect phytoplankton in the more turbid southeastsector of the bay to have lower Pm and ImlIOvalues than phytoplankton in the centraland northwest sectors. However, given themean secchi depths in Table 2, and assumingthat conditions at the SE station are fairlyrepresentative of most of the southeast sector,
the mean water column light intensity in thesoutheast sector is only about 25 percent lessthan that of the central and northwest sectors.This difference in light conditioning is evidently insufficient to produce a significantchange in Pm and Iml10 , or else the effect ismasked by other factors. Curl and Small(1965) have argued that Pm values are correlated with the degree of growth limitationby nutrient depletion, with Pm values in therange 0-3 indicative of oligotrophy andvalues in the range 5-10 indicative ofeutrophy. More recently, Thomas (1970: 384)measured Pm values in nitrogen-poor andnitrogen-rich waters of the eastern tropicalPacific, and reported mean values of 3.15and 4.95 mg C· mg- 1 chi a· hr- 1
, respectively. Judging from these two studies, phytoplankton production in all parts of KaneoheBay would be considered nutrient-saturated.In this respect it is noteworthy that Caperonet al. (1971: 603) reported mean Pm valuesof 11.5, 11.5, and 13.0 mg C· mg- 1 chIa . hr- 1 in the southeast, central, and northwest sectors of the bay, respectively, in 1970.Although sewage input to the bay has increased by over 20 percent since that time,there has evidently been no significant changein Pm values (see Table I), suggesting thatphytoplankton production has been nutrientsaturated for several years in all parts of thebay. Indeed, the mean N j concentrations inTable 2 are a factor of 4 or more higher thanN j concentrations measured in Nj-limitedchemostat cultures, even for cultures grownat close to maximum growth rates (Caperonand Meyer 1972, Eppley and Rengel' 1974,Eppley et al. 1971).
An estimate of phytoplankton growth ratesat each of the four stations can be made fromthe productivity indices and chi a values inTable 2, given the chi a : C ratio in the phytoplankton and the dark respiration rate. Ingeneral, the chi a : C ratio in marine phytoplankton is believed to fall in the approximaterange 0.01-0.04 by weight (Strickland andParsons 1968: 185), and has been foundto correlate positively with nutrient-limitedgrowth rates (Caperon and Meyer 1972,Perry 1976, Thomas and Dodson 1972). Respiration rates in natural marine phytoplank-

140
ton communities probably rarely exceed 15percent of photosynthetic rates (SteemannNielsen and Hansen 1959b) except at verylow growth rates. Following the methodologyof Steele and Baird 1965), Caperon et al.(1976) estimated the chi a : C ratio of phytoplankton in the southeast sector to be about0.02 by weight based on the slope of a regression of chi a against pac. Assumingthis ratio to be typical of phytoplankton inall parts of the bay, taking a dark respirationrate equal to 15 percent of the daytime netphotosynthetic rate and a mean daytime production rate equal to 8.4 times the hourlyproduction rates in Table 2, we concludethat phytoplankton at the OF, SE, CE, andNW stations are growing at 5.8, 4.1, 5, and5.6 percent per hour, respectively. Theserates are 5-7 times higher than the estimatedmean growth rate of phytoplankton in theoligotrophic central gyre of the North Pacific(Eppley and Sharp 1975: 985) and well withinthe range of maximum growth rates observedfor phytoplankton grown on light-dark cycles(Caperon and Ziemann 1976, Paasche 1967,1968).
Thus, we conclude that the phytoplanktonin all parts of Kaneohe Bay are growing inclose to a nutrient-saturated environment,with either suboptimal or supraoptimallightintensities being perhaps the principal factorlimiting growth rates. Although the phytoplankton biomass itself is evidently limitedby the availability of nitrogen, the nitrogenpool seems to be turning over rapidly;our own data (see the following discussion)indicate that even in the southeast sector,which receives most of the sewage input,nitrogen recycling accounts for about 80percent of phytoplankton nitrogen uptake.
Standing Stocks
Of the various particulate parameters measured, only ATP and chi a provide directmeasures of the size of living populations.Particulate ATP is found only in livingorganisms, since hydrolysis of ATP to ADPoccurs rapidly upon death. The ratio ofcarbon to ATP in living microorganisms isvariable, but a ratio of about 285: I by weight
PACIFIC SCIENCE, Volume 33, April 1979
TABLE 3
PARTITIONING OF pac BASED ON ASSUMED POC:chl
a AND POC:ATP RATIOS
OF SE CE NW
Detrital pac, mg/m3 115 137 126 144Living pac, mg/m 3 285 123 57 37Phytoplankton pac, mg/m 3 220 89 35.5 30.5
Living pac x 100% 71% 47% 31% 20%Total pac
Phytoplankton pac x 100% 77% 72% 62% 82%LlVlng pac
appears to represent a good working mean(Holm-Hansen 1970). Using this ratio andthe previously noted estimate of 0.02 forthe chi a : C ratio in the phytoplankton, it ispossible to use the mean concentrations ofpac, ATP, and chi a in Table 2 to make abreakdown of the particulate carbon poolsat each station (Table 3). This analysisindicates that the percentage of living pacsteadily decreases from the most productiveto the least productive sector of the bay.However, the percentage of living carbon asphytoplankton shows no clear correlationwith productivity.
That living carbon should constitute ahigher percentage of the total pac in themore eutrophic part of the bay is logicallyappealing if one assumes that the seweroutfalls provide the principal source of nutrients to the phytoplankton in the southeastsector, while in the less productive sectors ofthe bay recycling of nutrients from detritusis more important than external nutrientinputs. However, an analysis of our dataindicates that this explanation is probablyan oversimplification. Table 4 summarizesa simple calculation to estimate the relativeimportance of sewage and -stream inputsversus recycling as sources of nitrogen to thephytoplankton in the three sectors of thebay. In estimating the phytoplankton biomassin terms of nitrogen, we have converted themean chi a concentrations in Table 2 tophytoplankton nitrogen by assuming a chia : C ratio of 0.02 by weight and a C : N ratioof 5.68 by weight (Riley and Chester 1971:173). From these calculations, we concludethat at least 80 percent of phytoplankton
a::z:t!!22IJilltt· $1$1 ¥ffi4i¥'iffiPf!t g.

Effect of Sewage Enrichment on Phytoplankton-LAws AND REDALJE
TABLE 4
141
CALCULATION OF RELATIVE IMPORTANCE OF EXTERNAL NUTRIENT INPUTS AND RECYCLING TO PHYTOPLANKTONN i UPTAKE
SE CE NW
Phytoplankton PN, mg/m 3 15.7 6.25 5.37kg/sector 1,250 751 343
Phytoplankton N i uptake, kg/day 1,230 901 461N i input, kg/day 248 2.8 38.8Recycled N i , kg/day 982 898 423
mg/m 3/day 12.3 7.5 6.6N i input
x 100% 20.2% 0.3% 8.4%Phytoplankton N i uptake
nitrogen uptake in all parts of the bay is to beaccounted for by recycling. This conclusionis qualitatively consistent with the earlierstudy of Harvey and Caperon (1976), whoestimated that recycling accounted for about95 percent of phytoplankton nitrogen uptakein the southeast sector. The principal causeof the discrepancy between their estimate of95 percent and our estimate of 80 percent(Table 4) appears to be due to the fact thatthey overestimated the biomass of phytoplankton in the southeast sector because theirsampling stations were "biased" by beinglocated "in the more eutrophic part of thesouthern basin" (Caperon et al. 1976: 324).In any case, it is apparent that the relativeabundance of living and detrital POC in thethree sectors is not to be accounted for onthe basis of the relative importance ofexternalnutrient inputs and recycling, since externalinputs apparently account for only a smallpercentage of phytoplankton uptake in allparts of the bay. The almost eightfold declinein living POC between the OF and NWstations (Table 3) undoubtedly reflects theeffect of dilution with oligotrophic offshorewater. The lack of any corresponding trendin detrital POC is noteworthy, since onewould expect the rate of detritus productionto correlate positively with living biomass.Furthermore, Table 4 indicates a decreasingtrend in the rate of N j recycling per unitvolume from the southeast to the northwestsector. These observations suggest that thedetrital POC is rather refractory and is notdirectly linked with nitrogen recycling. Following this line of reasoning, it seems likely
that the detritivore population is substratelimited, and that easily biodegradable detritusis rapidly consumed. Hence, actual nutrientregeneration rates would be expected tocorrelate with the biomass of detritivoresrather than with detrital carbon. In thisrespect it is noteworthy that the percentageof nonphytoplankton living POC (perhapslargely protozoans, bacteria, and other detritivores) is largest at the CE station, whereexternal nutrient inputs are negligible, andsmallest at the OF and NW stations, whichreceive the greatest external nutrient inputs.
Indices of Eutrophication
Government agencies charged with theresponsibility of setting water quality standards must inevitably wrestle with the problem of choosing parameters that are bothsensitive to the problem of concern andapplicable to many different types of aquaticsystems. The mean parameter values in Table2 provide a good check of the sensitivity ofvarious water quality criteria to eutrophication in Kaneohe Bay. In order to rank thevarious parameters as to sensitivity, we havesimply taken the ratio of the parameter valueat the OF and SE stations to the mean of thevalues at the CE and NW stations. Theseratios are listed in Table 5. Using these ratiosas criteria, chI a concentration is clearly themost sensitive indicator of sewage enrichment, followed by P j , ATP, and PN. Ofparticular interest is the very insensitivenature of the inorganic nitrogen concentrations. Ryther and Dunstan (1971) have

142 PACIFIC SCIENCE, Volume 33, April 1979
TABLE 5
RELATIVE SENSITIVITY OF PARAMETERS AS INDICATORS OF EUTROPHICATION
OF SE
1/2(CE + NW) 1/2(CE + NW)
Most sensitive ChI a 6.7 2.7Sensitive P; 3.8 2.1
PN 3.7 2.1ATP 3.0 1.3
Insensitive l/secchi 2.3 1.4POC 2.2 1.4
Very insensi ti ve PIC 1.6 1.5NH 4 1.6 1.2Ni 1.5 1.0N03 + N02 1.3 0.7Pm 1.0 0.9
NOTE: Pm ratios are based on values in parentheses in Table 1.
Wi
previously noted that in Ni-limited systemsinorganic nitrogen concentrations are keptuniformly low by phytoplankton uptake, andin such systems Pi provides a much bettertracer of eutrophication. Our results are inagreement with this thesis. Following similarreasoning, it seems likely that in Pi-limitedsystems, inorganic nitrogen concentrationswould provide a good indicator of enrichment, whereas Pi would not. In short, innutrient-enriched systems much of the addednutrient is likely to become incorporatedinto seston due to rapid uptake by phytoplankton, and therefore particulate concentrations such as chI a, ATP, and PN are likelyto provide more sensitive and more widelyapplicable indices of eutrophication than doinorganic nutrient concentrations.
ACKNOWLEDGMENTS
The technical assistance of Ted Walsh andDiana Wong is gratefully acknowledged. Wethank Stephen Smith for numerous helpfuldiscussions during the course of this work,and we thank David Karl and Paul Bienfangfor their comments on the manuscript.
LITERATURE CITED
ANTIA, N. J., C. D. McALLISTER, T. R.PARSONS, K. STEPHENS, and J. D. H.
&JO!
STRICKLAND. 1963. Further measurementsof primary production using a largevolume plastic sphere. Limn. Oceanogr.8:166-183.
BANNER, A. H. 1974. Kaneohe Bay, Hawaii:Urban pollution and acoral reef ecosystem.Proc. 2d Internat. Coral Reef Symp.2:685-607.
CAPERON, J., and J. MEYER. 1972. Nitrogenlimited growth of marine phytoplankton.Deep-Sea Res. 18: 601-632.
CAPERON, J., and D. A. ZIEMANN. 1976.Synergistic effects of nitrate and ammonium ion on the growth and uptake kineticsof Monochrysis lutheri in continuous culture. Mar. BioI. 36: 73-84.
CAPERON, J., S. A. CATTELL, and G.KRASNICK. 1971. Phytoplankton kineticsin a subtropical estuary: Eutrophication.Limn. Oceanogr. 16: 599-607.
CAPERON, J., W. A. HARVEY, and F. A.STEINHILPER. 1976. Particulate organiccarbon, nitrogen, and chlorophyll as measures of phytoplankton and detritus standingcorps in Kaneohe Bay, Oahu, HawaiianIslands. Pac. Sci. 30:317-327.
CURL, H., and L. F. SMALL. 1965. Variationsin photosynthetic assimilation ratios innatural, marine phytoplankton communities. Limn. Oceanogr. 10: R67-R73.
EDMONDSON, W. T. 1969. Eutrophication inNorth America. Pages 124-149 in Eutrophication: Causes, consequences, correc-

Effect of Sewage Enrichment on Phytoplankton-LAws AND REDALJE 143
tives. National Academy of Sciences,Washington, D. C.
---. 1970. Phosphorus, nitrogen, andalgae in Lake Washington after diversionof sewage. Science 169: 690-691.
---. 1972. Nutrients and phytoplanktonin Lake Washington. Pages 172-193 inG. E. Likens, ed. Nutrients and eutrophication. American Society of Limnologyand Oceanography, Lawrence, Kansas.
EpPLEY, R. W., and E. H. RENGER. 1974.Nitrogen assimilation ofan oceanic diatomin nitrogen-limited continuous culture. J.Phyco!.10:15-23.
EpPLEY, R. W., and J. H. SHARP. 1975.Photosynthetic measurements in the Central North Pacific: The dark loss of carbonin 24-h incubations. Limn. Oceanogr. 20:981-987.
EpPLEY, R. W., J. N. ROGERS, J. J. McCARTHY, and A. SOURNIA. 1971. Light/darkperiodicity in nitrogen assimilation of themarine phytoplankters Skeletonema costat£1m and Coccolithus huxleyi in N-limitedchemostat culture. J. Phyco!. 7: 150-154.
GERHART, D. Z., and G. E. LIKENS. 1975.Enrichment experiments for determiningnutrient limitation: Four methods compared. Limn. Oceanogr. 20: 649-653.
HARVEY, W. A., and J. CAPERON. 1976. Therate of utilization of urea, ammonium, andnitrate by natural populations of marinephytoplankton in a eutrophic environment.Pac. Sci. 30: 329-340.
HIROTA, J., and J. P. SZYPER. 1975. Separation of total particulate carbon into inorganic and organic components. Limn.Oceanogr.20:896-899.
---. 1976. Standing stocks ofzooplanktonsize-classes and trophic levels in KaneoheBay, Oahu, Hawaiian Islands. Pac. Sci.30:341-361.
HOLM-HANSEN, O. 1970. ATP levels in algalcells as influenced by environmental conditions. Plant Cell Physio!. 11: 689-700.
HOLM-HANSEN, 0., and C. R. BOOTH. 1966.The measurement of adenosine triphosphate in the ocean and its ecological significance. Limn. Oceanogr. 14:740-747.
IVERSON, R. L., H. F. BITTAKER, and V. B.MEYERS. 1976. Loss of radiocarbon in di-
rect use of Aquasol for liquid scintillationcounting of solutions containing 14C_NaHC0 3 . Limn. Oceanogr. 21: 756-758.
JEFFREY, S. W. 1974. Profiles ofphotosynthetic pigments in the ocean, using thin-layerchromatography. Mar. Bio!. 26: 101-110.
JEFFREY, S. W., and G. F. HUMPHREY. 1975.New spectrophotometric equations fordetermining chlorophylls a, b, c1 and C2 inhigher plants, algae and natural phytoplankton. Biochem. Physio!. Pflanz. 167:191-194.
KARL,.D. M. 1978. Occurrence and ecologicalsignificance of GTP in the ocean and inmicrobial cells. App!. Environmental Microbio!. 36: 349-355.
KARL, D. M., and O. HOLM-HANSEN. 1978.Methodology and measurement of adenylate energy charge ratios in environmentalsamples. Mar. Bio!. 48: 185-197.
KARL, D. M., and P. A. LA ROCK. 1975.Adenosine triphosphate measurements insoil and marine sediments. J. Fish. Res.Board Can. 32: 599-607.
McALLISTER, C. D. 1961. Observations onthe variation of planktonic photosynthesiswith light intensity, using both the O
2and
C 14 methods. Limn. Oceanogr. 6 :483484.
MURPHY, J., and J. P. RILEY. 1962. A modified single solution method for the determination of phosphate in natural waters.Ana!. Chim. Acta 27:31-36.
PAASCHE, E. 1967. Marine plankton algaegrown with light-dark cycles. I. Coccolithushuxleyi. Physio!. Plantarum 20: 946-956.
---. 1968. Marine plankton algae grownwith light-dark cycles. II. Ditylum brightwellii and Nitzschia turgidula. Physio!.Plantarum 20: 66-77.
PERRY, M. J. 1972. Alkaline phosphataseactivity in subtropical Central North Pacificwaters using a sensitive fluorometric method.Mar.Bio!.15:113-119.
---. 1976. Phosphate utilization by anoceanic diatom in phosphorus limitedchemostat cultures and in oligotrophicwaters of the Central North Pacific. Limn.Oceanogr. 21 :88-107.
PLATT, T., and A. D. JASSBY. 1976. Therelationship between photosynthesis and
144
light for natural assemblages of coastalmarine phytoplankton. J. Phycol. 12: 421430.
RICKER, W. E. 1973. Linear regressions infishery research. J. Fish. Res. Board Can.30: 409-434.
RILEY, J. P., and R. CHESTER. 1971. Introduction to marine chemistry. AcademicPress, New York.
RYTHER, J. H. 1956. Photosynthesis in theocean as a function of light intensity.Limn. Oceanogr. 1:61-70.
RYTHER, J. H., and W. M. DUNSTAN. 1971.Nitrogen, phosphorus, and eutrophicationin the coastal marine environment. Science171: 1008-1013.
SLOVACEK, R. E., and P. J. HANNAN. 1977.In vivo fluorescence determinations ofphytoplankton chlorophyll a. Limn.Oceanogr. 22: 919-925.
SMITH, S. V., E. A. LAWS, and J. HIROTA.1978. Kaneohe Bay sewage relaxationexperiment: Pre-diversion report. Reportprepared for the U. S. EnvironmentalProtection Agency under contract no.R803983.
SOLORZANO, L. 1969. Determination ofammonia in natural waters by the phenolhypochlorite method. Limn. Oceanogr. 14:799-801.
STEELE, J. H. 1965. Notes on some theoreticalproblems in production ecology. Pages383-398 in C. R. Goldman, ed. Primaryproductivity in aquatic environments.Mem. 1st. Ital. Idrobiol., 18 Suppl., University of California Press, Berkeley.
STEELE, J. H., and I. E. BAIRD. 1965. Thechlorophyll-a content of particulate organic matter in the northern North Sea.Limn. Oceanogr. 10:261-267.
STEEMANN NIELSEN, E. and V. K. HANSEN.1959a. Light adaptation in marine phytoplankton populations and its interrelationwith temperature. Physiol. Plantarum 12:353-370.
---. 1959b. Measurements with thecarbon-14 technique of the respirationrates in natural populations of phytoplankton. Deep-Sea Res. 5: 222-233.
PACIFIC SCIENCE, Volume 33, April 1979
STEEMANN NIELSEN, E., and E. G. J¢RGENSEN.1968. The adaptation of plankton algaeI. General part. Physiol. Plantarum 21:401-413.
STEEMANN NIELSEN, E., V. K. HANSEN, andE. G. J¢RGENSEN. 1962. The adaptationto different light intensities in Chiarellavulgaris and the time dependence ontransfer to a new light intensity. Physiol.Plantarum 15:505-517.
STRICKLAND, J. D. H., and T. R. PARSONS.1968. A practical handbook of seawateranalysis. Bull. Fish. Res. Board Can. 167.
SVERDRUP, H. U., M. W. JOHNSON, andR. H. FLEMING. 1942. The oceans. Theirphysics, chemistry, and general biology.Prentice-Hall, Englewood Cliffs, N.J.
SZYPER, J. P., J. HIROTA, J. CAPERON, andD. A. ZIEMANN. 1976. Nutrient regeneration by the larger net zooplankton in thesouthern basin of Kaneohe Bay, Oahu,Hawaiian Islands. Pac. Sci. 30: 363-372.
THOMAS, W. H. 1969. Phytoplankton nutrientenrichment experiments off Baja Californiaand in the eastern equatorial Pacific Ocean.J. Fish. Res. Board Can. 26: 1133-1145.
---. 1970. On nitrogen deficiency intropical Pacific oceanic phytoplankton:Photosynthetic parameters in poor andrich water. Limn. Oceanogr. 15: 380-385.
THOMAS, W. H., and A. N. DODSON. 1972.On nitrogen dificiency in tropical Pacificoceanic phytoplankton. II. Photosyntheticand cellular characteristics of a chemostatgrown diatom. Limn. Oceanogr. 17: 515523.
TYLER, J. E. 1968. The Secchi disc. Limn.Oceanogr. 13: 1-6.
VACCARO, R. F. 1965. Inorganic nitrogen inthe sea. Pages 365-408 in J. P. Riley andG. Skirrow, eds. Chemical oceanography.Academic Press, New York.
WOOD, E. D. F., A. J. ARMSTRONG, andF. A. RICHARDS. 1967. Determination ofnitrate in sea water by cadmium-copperreduction to nitrite. J. Mar. BioI. Assoc.U. K. 47:23-31.
ICftteflP6tfffit-MJ, i; &ifi!4¥flUffi! g:.' L i 4i &12&£1JM4 ; 4