effect of water absorption by the aggregate on properties
TRANSCRIPT

A/fTZ:- A/0--
EFFECT OF WATER ABSORPTION BY THE AGGREGATE ON PROPERTIES OF
HIGH-STRENGTH LIGHTWEIGHT CONCRETE
Jouni Punkki
Dr. Ing. Dissertation 1995:113 The Norwegian Institute of Technology Division of Building Materials Trondheim, Norway December 1995
OBmWTON OF im DOCUMENT » UNLIMITED
pp

As a Finnish proverb goes: Strong guts will help get a person even through a gray rock.
What about lightweight aggregate?

DISCLAIMER
Portions of this document may be illegible in electronic image products. Images are produced from the best available original document
ABSTRACT i
ABSTRACT
While in Norway and most of Europe, the production of high-strength lightweight aggregate concrete is normally based on dry lightweight aggregate, prewetted aggregate is normally used in North America. Different moisture condition, and thus different water absorption by the aggregate, may affect both the fresh and the hardened concrete properties differently. In the present experimental program, the effect of water absorption by three different types of lightweight aggregate has been investigated.
One type of lightweight aggregate did not show any water absorption ability at all, and did therefore not represent any problem to the concrete production. For the two other more conventional types of high-strength aggregate, the water absorption by the aggregate did not only depend on the aggregate properties, but also on the concrete mixing procedure and the properties of the fresh cement paste. For one of these aggregates which had a very fine pore structure, the ratio of water absorption in fresh concrete to that in pure water was practically constant equal 0.6, while for the other type of aggregate having a more coarse pore system, the ratio varied from 0.2 to 0.8 depending on the concrete mixing procedure, the cement paste properties and the time after mixing. When prewetted lightweight aggregate was used, the results indicate that a small amount of water moved out from the aggregate already when the cement paste was in a fresh state.
When dry, water absorbing lightweight aggregate was used, the water absorption by the aggregate significantly increased the loss of concrete workability. When prewetted aggregate was used, this effect was eliminated.
The water absorption by the lightweight aggregate also affected the early compressive strength of concrete. Thus, after one day, the use of dry aggregate gave on the average 10 MPa higher compressive strength than that of prewetted aggregate. The strength-density ratio was affected by the moisture condition of the aggregate. Thus, dry lightweight aggregate gave 9 MPa higher compressive strength at a density of 2000 kg/m3 compared to that of prewetted aggregate.
The water absorption by the lightweight also affected the microstructure of the hardened concrete. Dry lightweight aggregate gave a slightly better microstructure compared to that of normal weight aggregate. When prewetted aggregate was used, a more poor microstructure was obtained compared to that of normal weight aggregate. In particular, the results indicate that the use of prewetted aggregate harmfully affected the transition zone between the
II ABSTRACT
aggregate and the cement paste. This effect was more pronounced when the type of aggregate with the finer pore structure was used.
By testing the water absorption characteristics of lightweight aggregate, the present investigation clearly demontrates that a simple submersion type of test in pure water does not reflect the actual water absorption taking place by the aggregate in the fresh concrete mixture.
ACKNOWLEDGEMENTS iii
ACKNOWLEDGEMENTS
The work reported in this dissertion has been carried out at the Division of Building Materials, The Norwegian Institute of Technology (NTH). Only the microstructural study of the aggregate and concrete was carried out at the Department of Civil Engineering, University of California at Berkeley (UCB).
I would like to thank Professor Odd E. Gjorv of the Norwegian Institute of Technology, under whose supervision the present studies were carried out. I extend my gratitude to him for his neverending interest and encouragement throughout.
I am also very greateful to my supervisor at the University of California, Berkeley, Professor Paulo J.M. Monteiro for his advice on the microstructural study.
Special thanks also to Henrik Panning at NTH and Jon G. Asselanis at UCB for helping in the laboratory work, Carita Lindberg at Finncement for preparing the thin sections, Tim Teague at UCB for helping in the specimen polishing and Ron Wilson at UCB for assisting on the scanning electron microscopy. Also, the support from Bo-Erik Eriksson at Cementa and Professors Seppo Matala and Vesa Penttala at Concrete Technology, Helsinki University of Technology is greatly appreciated.
I wish to express my thanks to all my colleagues and friends in Trondheim, Berkeley and Espoo for help and support: Grete Lind, Olav Lahus, Tiewei Zhang, Mireia Canyellas, Monica Prezzi, Riitta and Nikolas Zelinski, Timo and Liisa Soinio, Hanna Jarvenpaa, Risto Mannonen, Juha Komonen and Karri Makinen.
Funding for the study was made possible through the scholarships from The Research Council of Norway, Kerttu and Jukka Vuorinen Foundation from Finland, Emil Aaltonen Foundation from Finland, Einar Kahelin Foundation from Finland, Foundation for Civil Engineering, Finland and the finacial support from the Division of Building Materials at NTH.

IV ACKNOWLEDGEMENTS

CONTENTS v
ABSTRACT ........................................................................................................ i
ACKNOWLEDGEMENTS ................................................................................... iii
CONTENTS ........................................................................................................ v
NOTATIONS ........................................................................................................ix
LIST OF FIGURES .............................................................................................. xi
LIST OF TABLES ...............................................................................................xiii
1 INTRODUCTION ........................................................................................ 1
2 WATER ABSORPTION BY LIGHTWEIGHT AGGREGATE ...................... 3
2.1 CAPILLARY SUCTION ................................................................... 3
2.2 AGGREGATE CHARACTERISTICS ...............................................52.2.1 Expanded lightweight aggregate ........................................62.2.2 Agglomerated lightweight aggregate .................................72.2.3 Foamed lightweight aggregate............................................ 8
2.3 WATER ABSORPTION IN PURE WATER..................................... 9
2.4 WATER ABSORPTION IN FRESH CONCRETE ........................11
2.5 TESTING OF WATER ABSORPTION .......................................... 142.5.1 Water absorption in pure water ......................................142.5.2 Water absorption in fresh concrete ................................. 152.5.3 Indirect methods ............................................................... 16
3 EFFECT OF WATER ABSORPTION ............................................... 19
3.1 EFFECTIVE COMPOSITION OF CONCRETE ............................ 203.1.1 Water absorption by lightweight aggregate ...................203.1.2 Other factors ....................................................................213.1.3 Concrete composition ......................................................22
3.2 FRESH CONCRETE PROPERTIES ............................................ 233.2.1 Workability loss of cement paste in concrete ................ 243.2.2 Workability loss caused by water absorption ................ 27

VI CONTENTS
3.3 MICROSTRUCTURE ................................................................283.3.1 Transition zone between aggregate and cement paste 28
3.4 OTHER EFFECTS ........................................................................ 35
4 EXPERIMENTAL PROGRAM .................................................................37
4.1 TEST PROGRAM ...........................................................................37
4.2 MATERIALS .................................................................................... 394.2.1 Cement and admixtures ................................................... 394.2.2 Lightweight aggregate ......................................................414.2.3 Normal weight aggregate ................................................. 42
4.3 MIX DESIGN, MIXING AND SPECIMEN PREPARATION ... 434.3.1 Mix design ........................................................................ 434.3.2 Mixing procedure .............................................................454.3.3 Specimen preparation ......................................................46
4.4 TEST PROCEDURES ................................................................ 474.4.1 Water absorption by lightweight aggregate ...................474.4.2 Fresh concrete properties ...............................................524.4.3 Compressive strength and density .................................564.4.4 Capillary suction of concrete ........................................574.4.5 Mercury intrusion porosimeter ..................................... 614.4.6 Optical microscopy ........................................................614.4.7 Scanning electron microscopy ........................................62
4.5 STATISTICAL ANALYSIS .......................................................... 644.5.1 Standard deviation ...........................................................644.5.2 Analysis of variance ........................................................ 64
5 TEST RESULTS AND DISCUSSION ................................................... 67
5.1 CHARACTERISTICS OF LIGHTWEIGHT AGGREGATE ___ 675.1.1 Microstructure of aggregate surface ...............................675.1.2 Internal microstructure ......................................................735.1.3 Concluding remarks .........................................................76
5.2 WATER ABSORPTION BY LIGHTWEIGHT AGGREGATE ... 775.2.1 Water absorption in water ............................................... 775.2.2 Water absorption in cement paste ................................. 795.2.3 Water absorption in fresh concrete ................................. 805.2.4 Concluding remarks ........................................................ 87

CONTENTS vii
5.3 WORKABILITY LOSS OF CONCRETE ....................................... 875.3.1 Slump loss ........................................................................875.3.2 Change in other rheological properties ..........................915.3.3 Concluding remarks ........................................................93
5.4 COMPRESSIVE STRENGTH AND DENSITY OFCONCRETE ................................................................................... 935.4.1 Compressive strength ..................................................... 935.4.2 Effect of casting time ........................................................995.4.3 Density .......................................................................... 1015.4.4 Strength-density ratio ................................................. 1025.4.5 Concluding remarks ................................................... 104
5.5 MICROSTRUCTURE AND POROSITY OF CONCRETE ... 1055.5.1 Capillary suction and porosity ..................................... 1055.5.2 Optical microscopy ..................................................... 1125.5.3 Scanning electron microscopy ......................................1155.5.4 Concluding remarks ................................................... 122
6 CONCLUSIONS ..................................................................................... 123
REFERENCES ................................................................................ 125
APPENDICES
APPENDIX A Corrected proportionings of test concretes APPENDIX B Water absorption in pure water APPENDIX C Water absorption in concrete APPENDIX D Results of slump testsAPPENDIX E Results of compressive strength and density tests APPENDIX F Analysis of variance of compressive strength APPENDIX G Results of capillary suction tests

NOTATIONS IX
A aggregateAFm aluminium monoferrite phaseBSEI backscattered electron imageC cementitious materialCA coarse aggregateCH calcium hydrokside (Ca(OH)2)CoV coefficient of variationC-S-H calsium silicate hydrate gelC2S dicalcium silicate (2CaO • Si02)C3A tricalcium aluminate (3CaO • Al203)C3S tricalcium silicate (3CaO • Si02)C4AF tetracalcium aluminate ferrite (4CaO • Al203 • Fe203)DF degrees of freedomF variance ratioFA fine aggregateG yield stressH maximum capillary riseH plastic viscosityLWAC lightweight aggregate concreteL4 thickness of surface layer of lightweight aggregateMIP mercury intrusion porosimeterMS, mean of squareM2 weight of aggregate particles after cleaning but before dryingM3 weight of aggregate particles after dryingN rotation velocityNDC normal density concreteP probabilityQ capillary suctionR, average surface pore size of lightweight aggregateR2 average interior pore size of lightweight aggregateR3 average connection pore size of lightweight aggregateR2 coefficient of multiple determinationSEI secondary electron imageSEM scanning electron microscopeSF silica fumeSI strength indexSP superplasticizerSB, sum of squareT torqueV volume of test specimenVacl actual volume of concreteVpas proportion of cement pasteW waterW, weight of oven-dry specimenW2 weight after capillary suction and water immersion W3 weight after pressure saturationX, variable of function

X NOTATIONS
avg averagefc compressive strengthg acceleration of gravityh height of test specimenk capillary numberk' rate of suctionm resistance numberr radius of porestd standard deviationt timetcap time of capillary suctionwcr effective water-cement ratio of concrete
a contact angle between liquid and materiala degree of hydrationr) dynamic viscosity of liquidE non-evaporable water content in dried cement pastep density of liquidp density of concretePi particle densityct surface tension of liquida average dried paste content on aggregate surfaceeair air porosityesuc suction porosityetotal total porosityAPcap capillary pressureAu maximum error of function fA X, error of variable

LIST OF FIGURES XI
Figure 1. Figure 2. Figure 3. Figure 4. Figure 5. Figure 6.
Figure 7. Figure 8.
Figure 9.
Figure 10. Figure 11.
Figure 12.
Figure 13.
Figure 14.
Figure 15.
Figure 16.
Figure 17. Figure 18. Figure 19.
Figure 20. Figure 21. Figure 22. Figure 23. Figure 24. Figure 25. Figure 26. Figure 27. Figure 28. Figure 29.
Figure 30. Figure 31. Figure 32.
Figure 33. Figure 34. Figure 35. Figure 36.
Figure 37.
Figure 38.
Capillary rise of water versus pore size and time.Pore structure of expanded lightweight aggregate.Pore structure of agglomerated lightweight aggregate.Pore structure of foamed lightweight aggregate.Model of the pore structure of the expanded clay lightweight aggregate. Mercury intrusion porosimeter results for the different types of lightweight aggregates.Water absorption by lightweight aggregate as a function of time.Various stages of water absorption by lightweight aggregate from fresh concrete.Ratio of water absorption in fresh concrete at 30 min to that in pure water (60 min) as a function of water-binder ratio.Effect of external water pressure on water absorption.Factors controlling the water absorption by lightweight aggregate and its effects on various concrete properties.Effect of superplasticizer dosage on yield stress and plastic viscosity 2, 30 and 60 minutes after mixing.Effect of silica fume content on yield stress and plastic viscosity 2, 30 and 60 minutes after mixing.Schematic presentation of the microstructure of the transition zone between polished rock aggregate and cement paste.Diagrammatic representation of the transition zone and bulk cement paste in concrete.Results of image analysis in the transition zone, in the bulk concrete and in the pastes for anhydrous material and porosity.Hydration of lightweight absorptive aggregate concrete.Mixing procedures.Determination of the constant and coefficient value by use of regression analysis.Effect of particle size of the aggregate on the water absorption. Repeatability of water absortion by lightweight aggregate in concrete. Repeatability of slump measurements.Schematic construction of BML-Viscometer.Apparatus for measuring air content of fresh concrete by volumetric method. Arrangement of capillary suction test.An ideal capillary suction diagram.Resolution of different electrons in the scanning electron microscope. Overall photographs of aggregates.Low magnitude scanning electron photomicrographs of lightweight aggregate surfaces.Scanning electron photomicrographs of lightweight aggregate surfaces. Mercury intrusion porosimeter results for lightweight aggregate. Microphotographs of the aggregate interior showing the aggregate surface layer.Scanning electron photomicrographs of lightweight aggregate interiors. Water absorption in pure water.Water absorption in pure water as a function of square root of time.Effect of moisture condition of the aggregate on the water absorption in concrete.Ratio of water absorption in fresh concrete to that in pure water as a function of time.Effective water-cement ratios immediately after mixing and 60 min after mixing calculated from the water absorption results.
LIST OF FIGURESxii
Figure 39. Figure 40. Figure 41. Figure 42.
Figure 43.
Figure 44. Figure 45.
Figure 46. Figure 47.
Figure 48. Figure 49.
Figure 50.
Figure 51.
Figure 52.
Figure 53.
Figure 54.
Figure 55.
Figure 56.
Figure 57.
Figure 58.
Effect of moisture condition of the aggregate on the slump loss of concrete. Relationship between slump half-live and coefficient of water absorption. Results of concrete viscometer tests.Relationship between compressive strength and effective water-cement ratio at 60 min after mixing.Interaction between the aggregate type and the moisture condition of the aggregate when the cement paste type 1 was used.Standard deviations within each batch of concrete.Effect of moisture condition of the aggregate on the capillary suction of concrete.Effect of moisture condition of the aggregate on the rate of the suction. Relationship between effective water-cement ratio at 60 min after mixing and the capillary number and the suction porosity.Relationship between compressive strength and the capillary number. Microphotographs of white rims around lightweight aggregate particle in concrete sample 222.Scanning electron microphograph of the interface between lightweight aggregate and cement paste when cement paste type 1 was used. Scanning electron microphograph of the interface between lightweight aggregate and cement paste when cement paste type 2 was used. Scanning electron photomicrograph of the aggregate pore filled with ettringite needles.Scanning electron photomicrograph of the interface between lightweight aggregate and cement paste. Concrete sample 211.Scanning electron photomicrograph of the interface between lightweight aggregate and cement paste. Concrete sample 212.Scanning electron photomicrograph of the interface between lightweight aggregate and cement paste. Concrete sample 221.Scanning electron photomicrograph of the interface between lightweight aggregate and cement paste. Concrete sample 222.Scanning electron photomicrograph of the interface between lightweight aggregate and cement paste. Concrete sample 111.Scanning electron photomicrograph of the interface between normal weight aggregate and cement paste. Concrete sarnie 214.

LIST OF TABLES xiii
Table 1.
Table 2.
Table 3. Table 4. Table 5. Table 6.
Table 7. Table 8. Table 9. Table 10. Table 11. Table 12. Table 13. Table 14.
Table 15.
Table 16.
Table 17.
Table 18. Table 19. Table 20. Table 21. Table 22. Table 23. Table 24.
Table 25. Table 26. Table 27. Table 28. Table 29.
Table 30.
Table 31.
Table 32.
Table 33.
Table 34.
Table 35.
Table 36.
Table 37.
Influence of variation of input parameters on the calculated water absorption.Estimated errors of the most important variables for normal density concrete and lightweight aggregate concrete.Chemical and mineral composition of the cement.Physical properties of the cement.Chemical composition of the silica fume.Trade marks, fractions, particle densities and bulk densities of the lightweight aggregate fractions.Grading of the lightweight aggregate fractions.Grading and particle density of normal weight aggregate fractions.Rock type composition of coarse normal weight aggregate.Contents of cement, silica fume and superplasticizer.Aggregate composition.Combined aggregate grading.Test specimens cast from different concrete batches.Effect of the particle size of aggregate on the water absorption and the dried cement paste content on the aggregate surface.Variation in particle density of the lightweight aggregate and its effect on the water absorption value measured.Average values, standard deviations and coefficients of variation of the water absorption repeatability tests.Average values, standard deviations and coefficients of variation of the slump repeatability tests.Analysis of variance table.Water absorption by lightweight aggregate in cement paste.Dried cement paste content on the aggregate surface.Regression analysis results of the water absorption tests.Analysis of variance for the constant value of the water absorption.Analysis of variance for the coefficient value of the water absorption. Effective water content and water-cement ratio immediately after mixing and 60 min after mixing calculated from the water absorption results.Results of slump loss tests.Analysis of variance for the slump half-live.Results of concrete viscometer tests.Compressive strength.Analysis of variance for the compressive strength of 1 day using cement paste type 1.Analysis of variance for the compressive strength of 1 day using using cement paste type 2.Analysis of variance for the compressive strength of 28 days using using cement paste type 1.Analysis of variance for the compressive strength of 28 days using using cement paste type 2.Effect of moisture condition of the aggregate on the compressive strength at the ages of 1 and 28 days.Effect of aggregate type on the compressive strength at the ages of 1 and 28 days.Stem-and-leaf diagram of the compressive strength difference between the specimens cast 30 and 1 min after mixing.Average within batch coefficients of variation for compressive strength and density.Analysis of variance for the wet density of concrete.

XIV LIST OF TABLES
Table 38. Table 39. Table 40. Table 41.
Table 42.
Analysis of varinace for the strength index of concrete.Results of capillary suction tests.Suction, air and total porosities of the normal density concrete.Effect of casting time of specimens on the capillary number and the suction porosity.Presence of white rims around lightweight aggregate particles in thin sections.

1
INTRODUCTION
During concrete production, a proper control of the water content in the concrete mixture is always important. During production of high-strength concrete, a proper control of the water content is even more important. During production of high-strength lightweight aggregate concrete, special attention to the water absorbing properties of the lightweight aggregate is therefore necessary. In Norway and most of Europe, dry lightweight aggregate is normally used, while in North America, prewetted lightweight aggregate is normally used during production of high-strength lightweight aggregate concrete. When dry lightweight aggregate is used, the water absorption by lightweight aggregate may increase the rate of workability loss. Also, the concrete may not be pumpable. On the other hand, dry lightweight aggregate may give a higher strength-density ratio compared to that of prewetted aggregate. In addition, control of concrete composition is more difficult when prewetted aggregate is used. The two different procedures may also affect the hardened concrete properties differently.
In spite of its importance, the water absorption properties of lightweight aggregate are not very well known. Generally, the water absorption in fresh concrete is assumed to be proportional to the water absorption measured in pure water, although the cement paste properties and the mixing procedure also affect the rate and amount of water absorption.
The objective of the present study has been to study the effect of water absorption by different types of lightweight aggregate on the properties of high-strength lightweight concrete. Fresh concrete properties, compressive strength and density of concrete as well as microstucture of concrete obtained by use of dry lightweight aggregate are compared to that obtained by prewetted lightweight aggregate and also by normal weight aggregate.


2
WATER ABSORPTION BY LIGHTWEIGHT AGGREGATE
In this chapter, the theoretical basis for capillary suction by a porous material is briefly described. The characteristics of different types of lightweight aggregate affecting the water absorption are also described. Then, the water absorption both in pure water and in fresh concrete and some test methods for testing of this water absorption are presented.
CAPILLARY SUCTION2.1
The capillary rise is due to attractive forces between the liquid molecules and the surface of the capillary. This rise, which is limited by the potential energy, depends on pore size, surface tension and density of the liquid and the contact angle between the liquid and the material. The capillary pressure and the maximum rise can be calculated from the following equations:
A P,cap2 • o • COS tt
r(1)
2 • o • COS a (2)P • 9 ■ r
4 WATER ABSORPTION BY LIGHTWEIGHT AGGREGATE
where APggp is capillary pressure [Pa],H is maximum capillary rise [m],a is surface tension of the liquid [N/m]
(water: 72.75 mN/m, when T = +20°C), a is contact angle between the liquid and material,
(untreated concrete and water: normally 0°) r is radius of the pore [m],p is density of the liquid [kg/m3] and g is acceleration of gravity [kgm/s2].
The rate of capillary rise also depends on the viscosity of the liquid. The capillary rise and the rate of the capillary rise (dH/dt) as function of time can be calculated from the equations:
H(t) = O • COS g • t 2 n
(3)
where t n
d H dt
(t) = • a • cos a 8 • tj • t
is time [s] andis dynamic viscosity of the liquid [Pa • s] (water: 1.002 mPa • s, when T = +20°C).
(4)
The rate of capillary absorption is smaller for smaller pore sizes and slows down with time. Figure 1 shows the dependence of capillary rise of water on the pore size and time. When the total porosity is the same, a material with small pores absorbs more water than a material with larger pores, but the filling of the smaller pores takes more time.
The above equations are based on open capillaries. In a porous material, however, this is not necessarily the case. The pores often form different serial and parallel systems and are not necessarily open from both ends. If a pore is closed, the air entrapment also makes the absorption much slower. The volume occupied by air will only be available for the liquid if the air can escape. The time needed to dissolve an air bubble in water depends on the pore size. For r = 10"5 m the time is 7 seconds, for r = 10"4 m it is 98 minutes and for r = 10"3 m it is 67 days (BOMBERG 1974).

WATER ABSORPTION BY LIGHTWEIGHT AGGREGATE 5
00000
10000maximum capillary rise
0.01
0.0011E-09 IE-08 1E-07 1E-06 1E-05 IE-04 1E-03
Pore radius [m]
Figure 1. Capillary rise of water versus pore size and time. Contact angle between water and the material is assumed to be 0°.
Capillary suction and the gravity do not necessarily affect the flow of water in opposite direction. A horizontal flow or an infiltration of liquid may also exist. In the case of infiltration, the total flow is the sum of capillary- and gravity-driven forces. However, the effect of the gravitational force is generally very small compared with the capillary force and, therefore, it can normally be ignored.
Also a difference in ion concentration may affect the capillary suction. When pure water is absorbed by a material and the medium contains soluble constituents, a difference in ion concentrations may form. In cement paste, relatively high concentrations of Ca2\ K+, Na\ SO/" and OH* are quickly formed, whereas water in the aggregate is practically pure water.
2.2 AGGREGATE CHARACTERISTICS
Water absorption by lightweight aggregate depends on both the properties of the aggregate and the properties of the surrounding liquid. The aggregate properties are primarily controlled by the manufacturing process of the aggregate. Thus, from one type of high-strength lightweight aggregate to another, the properties of the aggregate may vary within rather wide limits. Depending on the manufacturing process, high-strength lightweight aggregates can roughly be divided into three groups:
6 WATER ABSORPTION BY LIGHTWEIGHT AGGREGATE
1. Expanded lightweight aggregate2. Agglomerated lightweight aggregate3. Foamed lightweight aggregate
In the following, a brief description of the various types of aggregate is presented, with main emphasize on those characteristics which are important for the water absorption.
2.2.1 Expanded lightweight aggregate
Most of the high-strength lightweight aggregates are of the expanded type. The raw material can be clay, shale, slate, perlite or exfoliated vermiculite. To achieve a proper expansion, the raw material must contain sufficient gas-producing constituents, and the state of pyroplasticity must occur simultaneously with the formation of gas. The required gas formation can be caused by expulsion of water of hydration, removal of C02 from carbonates or liberation of oxygen caused by reduction of Fe203 (FIR Manual of LWAC 1983). The burning temperature is normally about 1150°C. In a state of pyroplasticity, a glassy layer is formed on the surface of aggregate nodules and the layer prevents the gas from streaming out of the nodules. In practice, however, some gas escapes through the glassy layer forming open pores through the aggregate surface.
Expanded lightweight aggregate typically has a less porous surface layer although the thickness and the porosity of the layer depend on both the raw material and the burning process. The pores of the surface layer are normally connected to the inner pores. Also, the internal pore structure is generally continuous. Only a small volume of the pores is closed. Zhang (1989) determined the open and closed porosity of different types of expanded clay aggregate. The proportion of the closed pores of the total porosity varied from 10.5 to 13.3% depending on the aggregate type. The pore structure of the expanded lightweight aggregate is schematically presented in Figure 2.
The total porosity and the pore size distribution of both the aggregate interior and the surface layer are essential for the water absorption properties of the aggregate. Also, the open and closed porosity ratio and the connection between pores in the surface layer and the inner structure play important roles. The expanded lightweight aggregate generally shows a relatively high ability to absorb water.

WATER ABSORPTION BY LIGHTWEIGHT AGGREGATE 7
Figure 2. Pore structure of expanded lightweight aggregate.
Two of the high-strength lightweight aggregate types used in the experimental part of the study are expanded clay lightweight aggregates. However, the manufacturing process of the aggregates differs to some extent. Liapor 8 aggregate is pelletized before burning (dry process), whereas in the case of HS Leca 800 aggregate, clay is fed directly into the rotary kiln (wet process). Because of the pelletizing, Liapor 8 aggregate has a more rounded particle shape, but on the other hand, the internal structure of the aggregate may be more layered.
2.2.2 Agglomerated lightweight aggregate
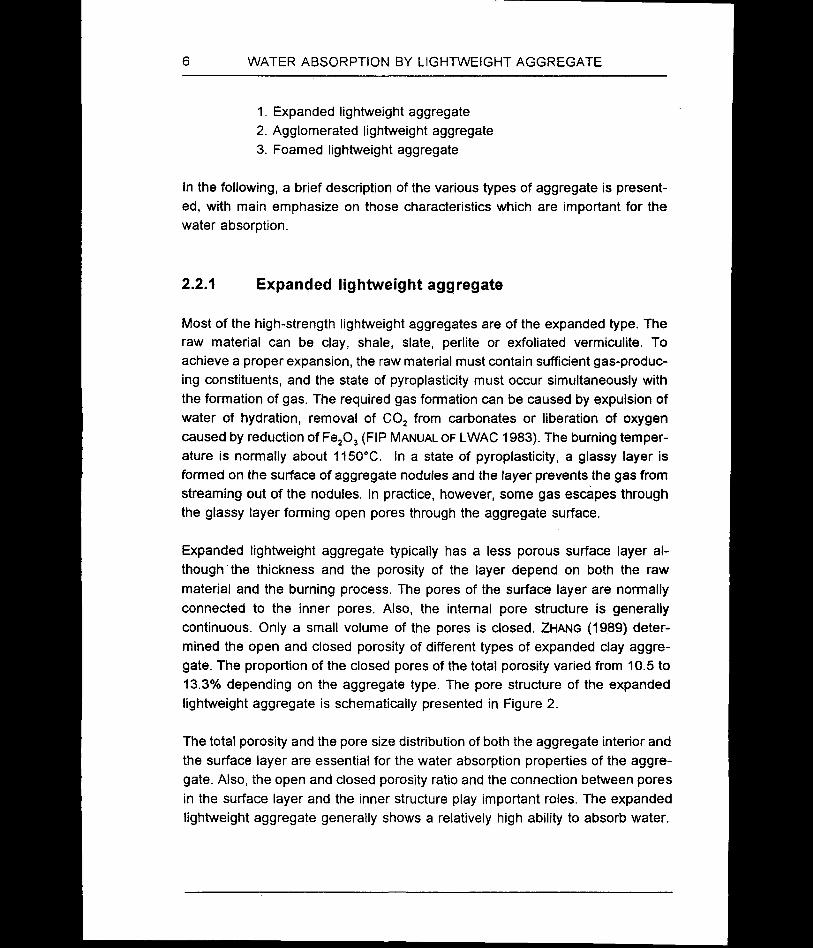
Agglomerated lightweight aggregate is produced from various industrial by-products such as pulverized-fuel ash, blastfurnace slag and pelletized slag. When the pulverized-fuel ash, "fly-ash", is used, the process is as follows. The ash is mixed with water and coal slurry and then pelletized. The pellets are fed into a sinter strand and processed at a temperature of about 1400°C. At this temperature the ash particles coagulate without fully melting, to form hard spherical particles (FIR Manual of LWAC 1983). The aggregate has no special surface layer and the pore structure is similar throughout the whole particle. Most of the pores are connected with each other. The pore structure of the aggregate is schematically presented in Figure 3.
This type of aggregate generally shows a higher total water absorption and a clearly higher rate of absorption compared to that of the expanded lightweight aggregate.
8 WATER ABSORPTION BY LIGHTWEIGHT AGGREGATE
Figure 3. Pore structure of agglomerated lightweight aggregate.
2.2.3 Foamed lightweight aggregate
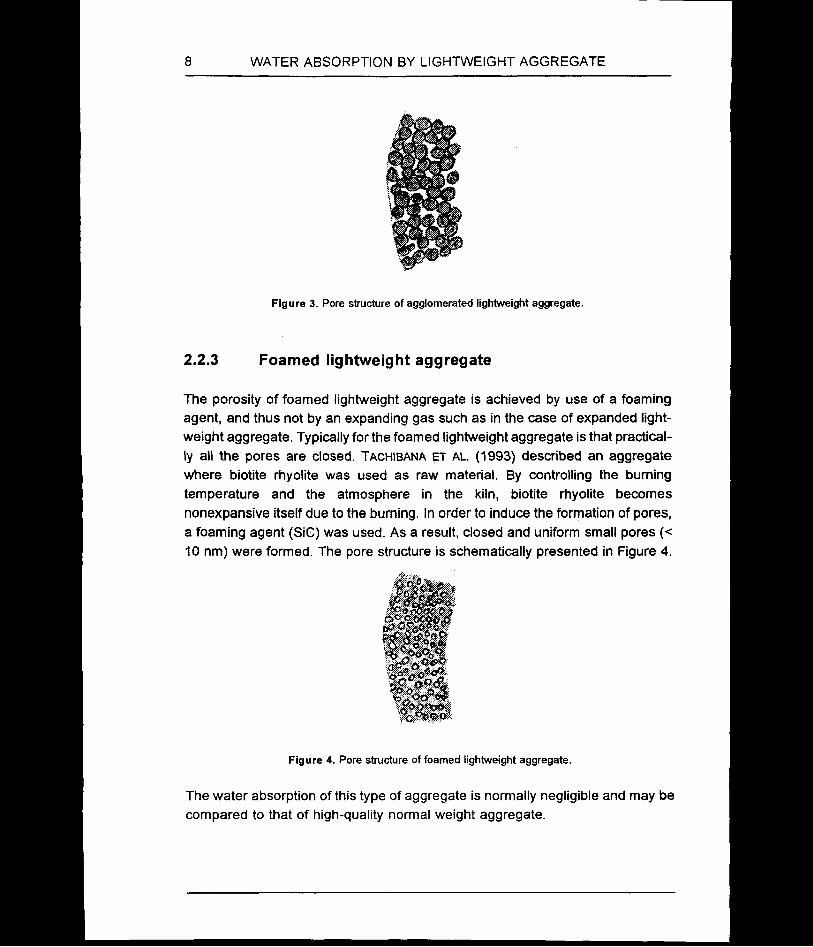
The porosity of foamed lightweight aggregate is achieved by use of a foaming agent, and thus not by an expanding gas such as in the case of expanded lightweight aggregate. Typically for the foamed lightweight aggregate is that practically all the pores are closed. Tachibana et al. (1993) described an aggregate where biotite rhyolite was used as raw material. By controlling the burning temperature and the atmosphere in the kiln, biotite rhyolite becomes nonexpansive itself due to the burning. In order to induce the formation of pores, a foaming agent (SiC) was used. As a result, closed and uniform small pores (< 10 nm) were formed. The pore structure is schematically presented in Figure 4.
Figure 4. Pore structure of foamed lightweight aggregate.
The water absorption of this type of aggregate is normally negligible and may be compared to that of high-quality normal weight aggregate.

WATER ABSORPTION BY LIGHTWEIGHT AGGREGATE 9
2.3 WATER ABSORPTION IN PURE WATER
As described above, the water absorption properties of lightweight aggregate significantly depends on type of aggregate. In the following, the water absorption by expanded clay lightweight aggregate in pure water is discussed.
The pore structure of expanded clay lightweight aggregate can be modelled as presented in Figure 5. The average surface pore size (R.,) is clearly smaller than that of the interior pore (R2). The interior pores are connected to the aggregate surface through the surface layer (length: L,), but they are also connected to each other. The connection pores (R3) between the interior pores are smaller than the interior pores.
Figure 5. Model of the pore structure of the expanded clay lightweight aggregate.
Lightweight aggregate is an inhomogeneous material. Therefore, the surface pores, interior pores as well as the pores between the interior pores varies in size and shape to a great extent.
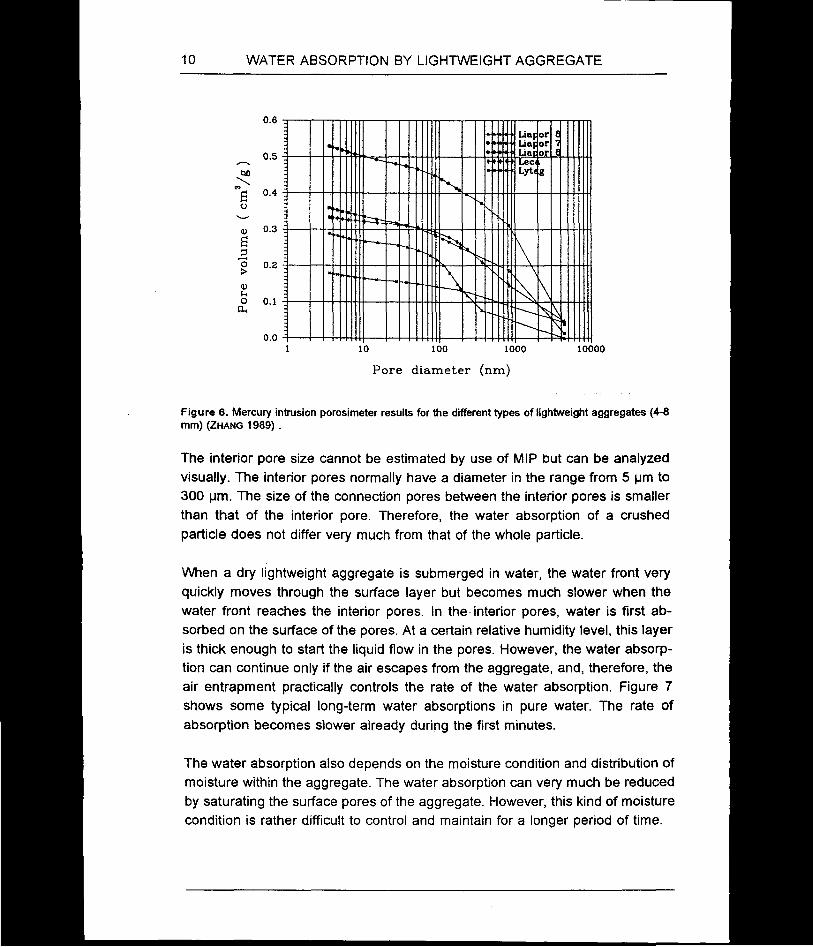
The average surface pore size can be estimated by use of mercury intrusion porosimetry (MIR). Sellevold (1987) investigated the surface pore size of some ordinary and high-strength expanded clay lightweight aggregates and found that the average pore size varied between the aggregate types from 0.2 to 10 pm. Zhang (1989) examined the pore size distribution of five types of high-strength lightweight aggregate by use of MIR (Figure 6). As can be seen, the surface porosity varied in the same range as presented by Sellevold (1987). Liapor 8 appeared to have a smaller average surface pore size than the other aggregate types investigated.
10 WATER ABSORPTION BY LIGHTWEIGHT AGGREGATE
10000
Pore diameter (nm)
Figure 6. Mercury intrusion porosimeter results for the different types of lightweight aggregates (4-8 mm) (Zhang 1989).
The interior pore size cannot be estimated by use of MIP but can be analyzed visually. The interior pores normally have a diameter in the range from 5 pm to 300 pm. The size of the connection pores between the interior pores is smaller than that of the interior pore. Therefore, the water absorption of a crushed particle does not differ very much from that of the whole particle.
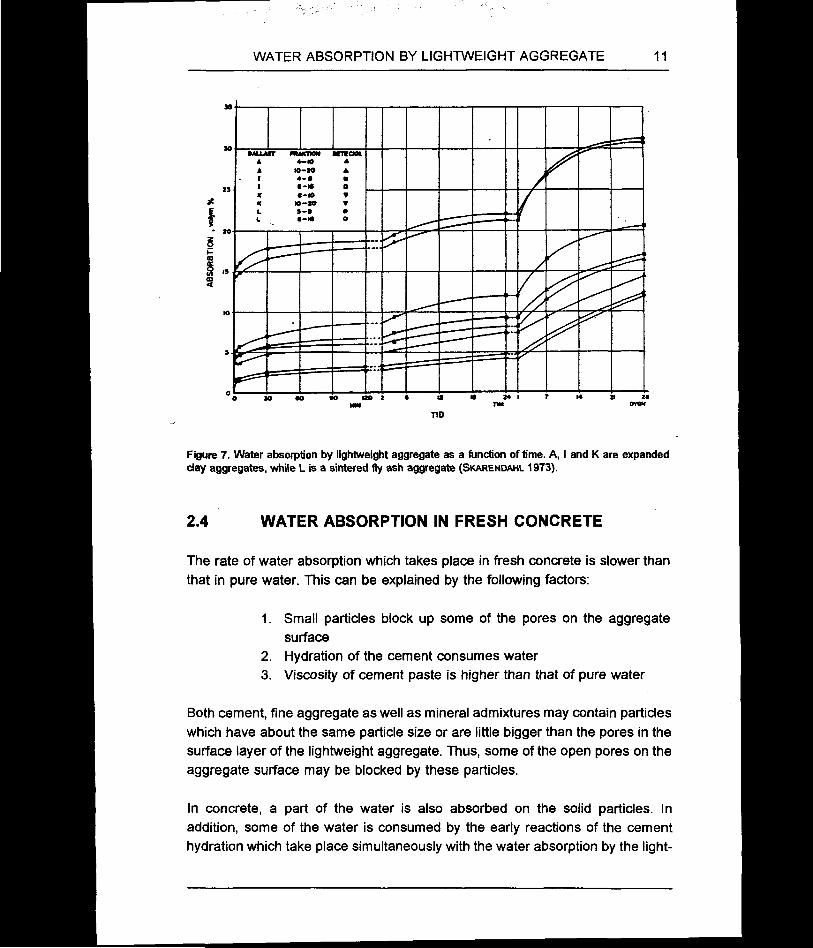
When a dry lightweight aggregate is submerged in water, the water front very quickly moves through the surface layer but becomes much slower when the water front reaches the interior pores. In the interior pores, water is first absorbed on the surface of the pores. At a certain relative humidity level, this layer is thick enough to start the liquid flow in the pores. However, the water absorption can continue only if the air escapes from the aggregate, and, therefore, the air entrapment practically controls the rate of the water absorption. Figure 7 shows some typical long-term water absorptions in pure water. The rate of absorption becomes slower already during the first minutes.
The water absorption also depends on the moisture condition and distribution of moisture within the aggregate. The water absorption can very much be reduced by saturating the surface pores of the aggregate. However, this kind of moisture condition is rather difficult to control and maintain for a longer period of time.
WATER ABSORPTION BY LIGHTWEIGHT AGGREGATE 11
10-10
Figure 7. Water absorption by lightweight aggregate as a function of time. A, I and K are expanded day aggregates, while L is a sintered fly ash aggregate (Skarendahl 1973).
2.4 WATER ABSORPTION IN FRESH CONCRETE
The rate of water absorption which takes place in fresh concrete is slower than that in pure water. This can be explained by the following factors:
1. Small particles block up some of the pores on the aggregate surface
2. Hydration of the cement consumes water3. Viscosity of cement paste is higher than that of pure water
Both cement, fine aggregate as well as mineral admixtures may contain particles which have about the same particle size or are little bigger than the pores in the surface layer of the lightweight aggregate. Thus, some of the open pores on the aggregate surface may be blocked by these particles.
In concrete, a part of the water is also absorbed on the solid particles. In addition, some of the water is consumed by the early reactions of the cement hydration which take place simultaneously with the water absorption by the light

12 WATER ABSORPTION BY LIGHTWEIGHT AGGREGATE
weight aggregate. Therefore, all the water in the fresh concrete is not available for aggregate absorption.
The viscosity of the cement paste also affects the water absorption by aggregate. A low water-cement ratio causes a high viscosity of the cement paste which gives a reduced water absorption (Punkki and GJ0RV 1993). This effect may vary depending on whether the cement paste is absorbed into the aggregate or not. Zhang and Gjgrv (1990a) did not observe any penetration of cement paste into high-strength lightweight aggregate. Thus, it appears that only water is absorbed by the aggregate.
The water absorption by aggregate continues throughout the dormant period of the cement hydration and ends at a stage between the initial and the final set. The maximum time of water absorption in fresh concrete appears to be between two and four hours, depending on type of cement and admixtures used. Then, water may move back out of the aggregate into the cement paste and thus support further hydration. However, water can move out of the aggregate to the cement paste only if the biggest capillary pores are empty. Therefore, the time when the water begins to move depends on the cement paste properties and it is normally several days.
Stage IV(after setting of cement)/ \— Stage III
/ (after compaction)
Stage II(after mixing, before compaction)
Stage I(during mixing)
Figure 8. Various stages of water absorption by lightweight aggregate from fresh concrete.
In principable, the water absorption by lightweight aggregate from fresh concrete can be split into four different stages as shown in Figure 8. Stage I corresponds to the water absorption during mixing. This water absorption is very fast, and the water is being absorbed equally from the whole cement paste. The rate of water
WATER ABSORPTION BY LIGHTWEIGHT AGGREGATE 13
absorption is probably not equal during the whole mixing time but is higher in the beginning. The next stage includes the water absorption after mixing but before compaction of the concrete. Gradients of water content in the cement paste may form, but they will, at least partly, level out during compaction. The water absorption continues even after compaction (stage III), but the rate of absorption is probably very slow. In that stage, distincts gradients of water absorption are probably formed. Stage IV may take place later on, after the setting of cement has started.
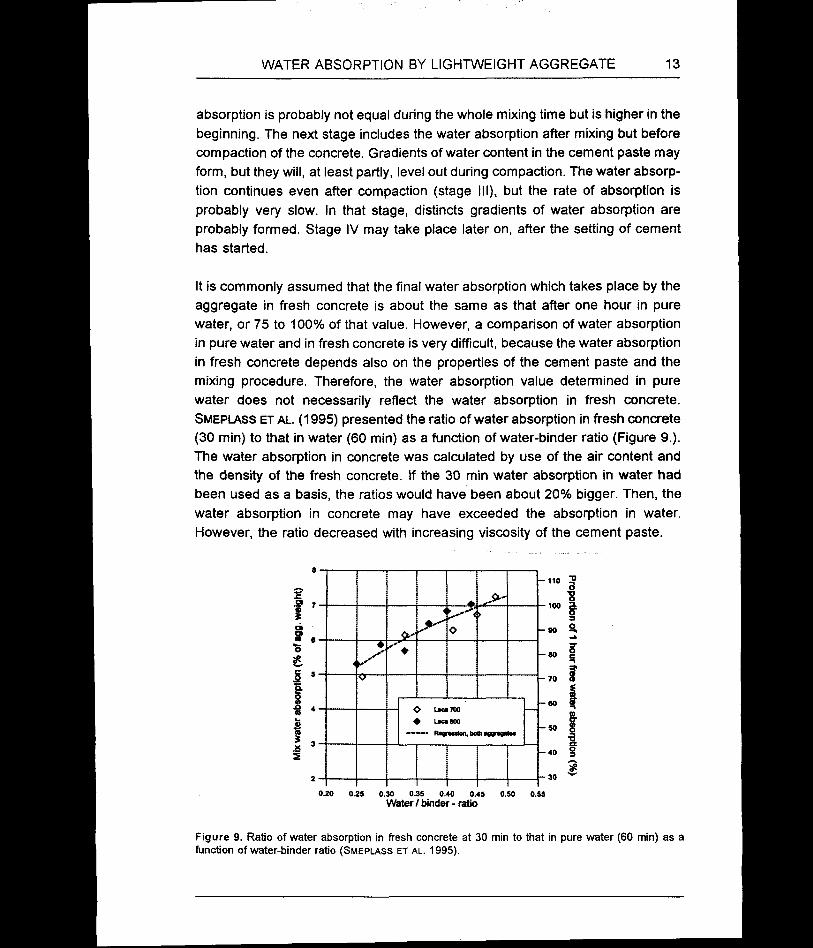
It is commonly assumed that the final water absorption which takes place by the aggregate in fresh concrete is about the same as that after one hour in pure water, or 75 to 100% of that value. However, a comparison of water absorption in pure water and in fresh concrete is very difficult, because the water absorption in fresh concrete depends also on the properties of the cement paste and the mixing procedure. Therefore, the water absorption value determined in pure water does not necessarily reflect the water absorption in fresh concrete. Smeplass et al. (1995) presented the ratio of water absorption in fresh concrete (30 min) to that in water (60 min) as a function of water-binder ratio (Figure 9 ). The water absorption in concrete was calculated by use of the air content and the density of the fresh concrete. If the 30 min water absorption in water had been used as a basis, the ratios would have been about 20% bigger. Then, the water absorption in concrete may have exceeded the absorption in water. However, the ratio decreased with increasing viscosity of the cement paste.
2 7-
9O*
i
X o >
<
♦
o
O l*ca 700♦ Ucatoo
~ Regrwion,bodiegyegeies
I I I
IO
f
ICD
19
0.20 0.23 0.30 0.35 0.40 0.45 0.50 0.5Water / binder - ratio
Figure 9. Ratio of water absorption in fresh concrete at 30 min to that in pure water (60 min) as a function of water-binder ratio (Smeplass et al. 1995).
14 WATER ABSORPTION BY LIGHTWEIGHT AGGREGATE
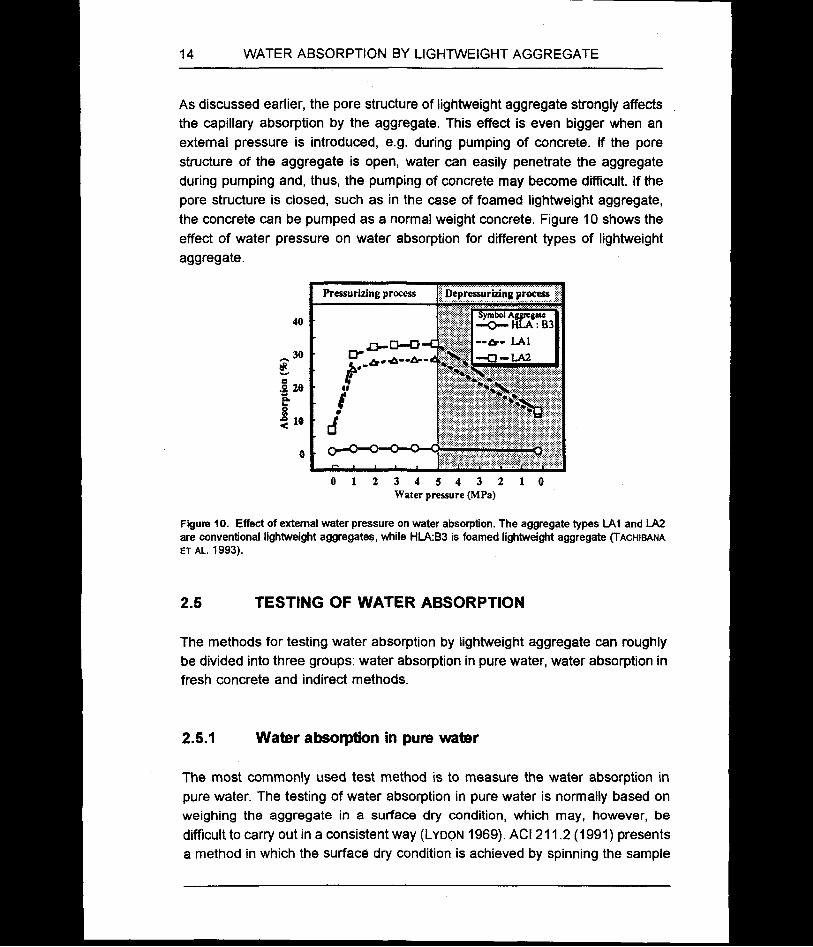
As discussed earlier, the pore structure of lightweight aggregate strongly affects the capillary absorption by the aggregate. This effect is even bigger when an external pressure is introduced, e g. during pumping of concrete. If the pore structure of the aggregate is open, water can easily penetrate the aggregate during pumping and, thus, the pumping of concrete may become difficult. If the pore structure is closed, such as in the case of foamed lightweight aggregate, the concrete can be pumped as a normal weight concrete. Figure 10 shows the effect of water pressure on water absorption for different types of lightweight aggregate.
Pressurizing process : Depressurizing process
O0
01234543210 Water pressure (MPa)
Figure 10. Effect of external water pressure on water absorption. The aggregate types LA1 and LA2 are conventional lightweight aggregates, while HLA:B3 is foamed lightweight aggregate (Tachibana ET AL. 1993).
TESTING OF WATER ABSORPTION2.5
The methods for testing water absorption by lightweight aggregate can roughly be divided into three groups: water absorption in pure water, water absorption in fresh concrete and indirect methods.
2.5.1 Water absorption in pure water
The most commonly used test method is to measure the water absorption in pure water. The testing of water absorption in pure water is normally based on weighing the aggregate in a surface dry condition, which may, however, be difficult to carry out in a consistent way (Lydon 1969). AC 1211.2 (1991) presents a method in which the surface dry condition is achieved by spinning the sample

WATER ABSORPTION BY LIGHTWEIGHT AGGREGATE 15
at a rotation of 500 min"1 for 20 min. Water absorption in pure water as a function of time can also be determined by keeping the aggregate submerged in water and then observe the weight of the aggregate in water or the volume of the water. Water absorption measured in water only reflects the aggregate properties, but cannot take into account the effects of the cement paste properties or the mixing procedure.
2.5.2 Water absorption in fresh concrete
A direct method for measurement of the water absorption by lightweight aggregate in fresh concrete has been suggested by Punkki and Gjorv (1993). In this method, the water absorption is measured on the basis of increased weight of a certain number of individual aggregate particles picked out from the fresh concrete. Before each measurement, the particles are carefully cleaned with a brush. The weight is determined before and after drying to constant weight at 105eC. Since it is difficult to remove all the cement paste from the porous particle surface, a special pre-determination of remaining dried paste content on the aggregate has to be carried out and corrected for. When the initial moisture content of the aggregate is small, the water absorption (Wabs) can be calculated as follows:
IV. (1 + <o) - <o (wcr - 5) (1 + 5)
(5)
where M2 is weight of aggregate particles after cleaning but before drying,
M3 is weight of aggregate particles after drying, a is average dried paste content on aggregate surface,% is non-evaporable water content in dried cement paste andwcr is effective water-cement ratio of concrete.
The non-evaporable water content of the cement paste on the aggregate surface (£) can be assumed to be 2.5% by weight of cement, which corresponds to a degree of hydration of approximately 10%. The average dried cement paste content on the aggregate surface (co), which is determined in a separate cement paste test, typically varies for high-strength lightweight aggregate from 0.5 to 2.5% by weight of aggregate.

16 WATER ABSORPTION BY LIGHTWEIGHT AGGREGATE
In this test procedure, only a limited number of individual aggregate particles can be measured. The normal sample size is five particles. Therefore, a natural variation cannot be avoided. Normally, at least three parallel tests are needed. Other sources of error are evaporation during cleaning of the particles and an erroneous determination of dried paste content on the aggregate surface. Because of the water absorption, the effective water-cement ratio is not necessarily the same in the vicinity of the aggregate surface as in the bulk paste. The test method and its reliability are described more precisely and discussed in Chapter 4.4.1.
2.5.3 Indirect methods
MOller-Rochholz (1979) separated the lightweight aggregate from the cement paste at certain time intervals and then measured the change in water-cement ratio caused by the water absorption. However, an accurate determination of the water-cement ratio is not very easy. Also, the change in water-cement ratio may be relatively small.
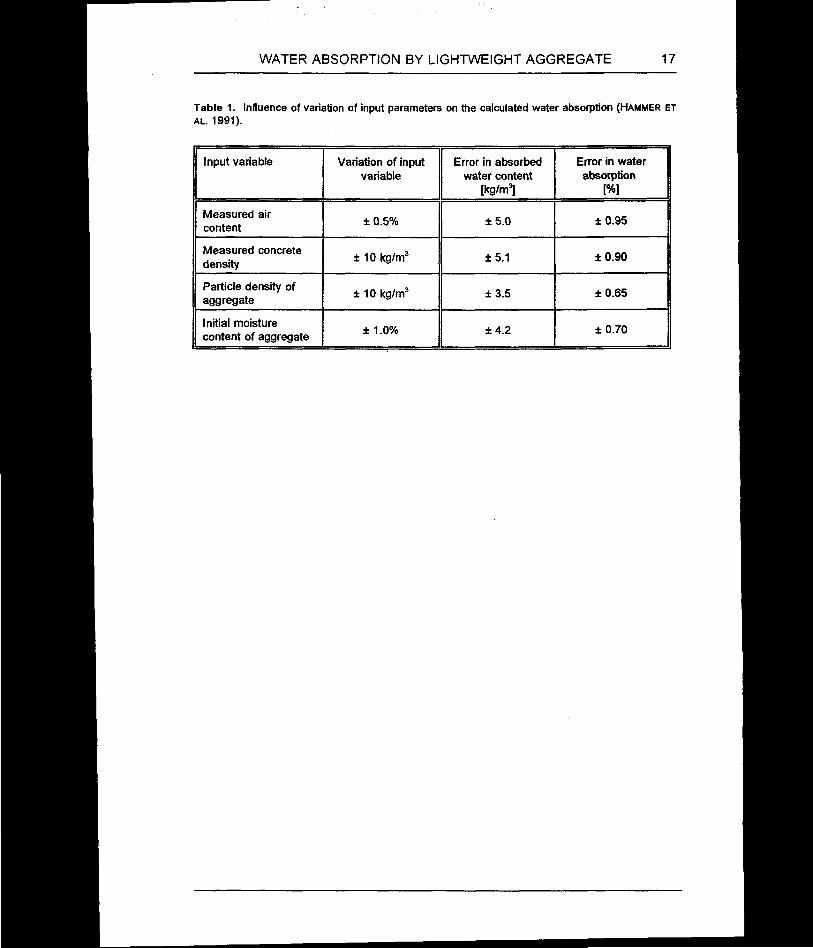
Another approach is to determine the water absorption indirect!y by calculating the water absorption on the basis of the observed air content and the density of the fresh concrete (Smeplass et al. 1992). With this method, water absorption can be determined at certain intervals, and the method also takes into account the cement paste properties. In addition, the method is very simple to carry out even on a construction site. Although the method is theoretically correct, a variation in the input variables may affect the calculated water absorption quite substantially (Table 1). Several of the input variables are difficult to experimentally observe, and hence, the method becomes rather unreliable.
According to Table 1, the determined water absorption may differ from the real value by about ± 17.8 dm3/m3, which corresponds to about ±3.2% of water absorption.
WATER ABSORPTION BY LIGHTWEIGHT AGGREGATE 17
Table 1. Influence of variation of input parameters on the calculated water absorption (Hammer et al. 1991).
Input variable Variation of input variable
Error in absorbed water content
[kg/m3]
Error in water absorption
[%]
Measured air content
± 0.5% ±5.0 ±0.95
Measured concrete density
± 10 kg/m3 ±5.1 ±0.90
Particle density of aggregate
±10 kg/m3 ±3.5 ± 0.65
Initial moisture content of aggregate ± 1.0% ±4.2 ±0.70

18 WATER ABSORPTION BY LIGHTWEIGHT AGGREGATE

3
EFFECT OF WATER ABSORPTION
A water absorption by the lightweight aggregate may affect the properties of lightweight aggregate concrete in various ways, where both the fresh and hardened concrete properties are affected. Figure 11 shows the main effects of the water absorption as well as those factors controlling the water absorption.
In the present work, attention has been given to the possible effects on workability loss of the fresh concrete as well as compressive strength and density of the concrete. Possible effects on the micro structure of the hardened concrete have also been studied. In addition, the effects of water absorption on the effective composition as well as on the durability properties are discussed. In the following, the effects of water absorption are presented in a chronological order, first on the effective composition of concrete, then on the fresh concrete properties and finally on the hardened concrete properties.

20 EFFECT OF WATER ABSORPTION
Aggregateproperties
Fresh concrete properties
Othereffects
Durabilityproperties
Mechanicalproperties
Composition of concrete
Microstructure of concrete
Cement paste properties
lightweight aggregate
Water absorption
Figure 11. Factors controlling the water absorption by lightweight aggregate and its effects on various concrete properties.
3.1 EFFECTIVE COMPOSITION OF CONCRETE
The effective composition of lightweight aggregate concrete varies more than that of normal density concrete. This is partly due to the water absorption by the lightweight aggregate, but it is also due to some other factors which will discussed in the following.
3.1.1 Water absorption by lightweight aggregate
Water absorption by lightweight aggregate affects the effective composition of concrete due to different reasons:
1. Amount of water absorption is not well known2. Water absorption changes with time3. Water absorption creates water gradients within the cement paste

EFFECT OF WATER ABSORPTION 21
As discussed earlier, the determination of water absorption by lightweight aggregate is not simple. It is possible to determine an approximate value for the water absorption, but a more correct value is normally not known. If the water absorption is unknown, so is the effective water-cement ratio and the actual volume of concrete. The water absorption may also vary within a relatively small aggregate volume. The variation in water absorption is biggest when the initial moisture content of the aggregate varies. In addition to the initial moisture content, the water absorption depends on the moisture distribution within the aggregate (Chapter 2.3).
Dry lightweight aggregate does not normally become water-saturated during mixing, but the water absorption continues also after mixing. Therefore, the absorbed water content increases with time, and only one water absorption value cannot describe the phenomena. When the fresh concrete properties immediately after mixing are considered, the water absorption value immediately after mixing is also the most useful. If this value is used, the effective water content of lightweight aggregate concrete is directly comparable with that of normal density concrete and also the volume of the fresh concrete is approximately correct. On the other hand, if hardened concrete properties are considered, the final water absorption value is more useful. These two values may differ from each other by several percentage units. The problem is to determine the final absorption value. This can be estimated only by use of indirect methods and even then, an accurate determination is rather difficult. For example, the method which is based on measured air content and fresh concrete density (see Chap. 2.5) cannot take into account the water absorption which takes place after the compaction of concrete.
Water absorption causes gradients of the water content within the fresh concrete. The water-cement ratio is smaller adjacent to the lightweight aggregate particles than in the bulk paste. The effective water-cement ratio, even if it could be determined, is only an average value of the water-cement ratio.
3.1.2 Other factors
Other factors which may negatively affect the accuracy of the mix design are variations in the particle density of the lightweight aggregate and incorrect determination of the air content in the lightweight aggregate concrete. In addition, the moisture content of the lightweight aggregate may vary within wide limits.

22 EFFECT OF WATER ABSORPTION
The variation in particle density of the lightweight aggregate is bigger than that of normal weight aggregate. This is due to the nature of the manufacturing process of the lightweight aggregate. The porosity of the individual particles may vary within wide limits. In a larger scale, the variation is smaller but still bigger than that of normal weight aggregate.
An accurate determination of the air content of fresh lightweight aggregate concrete is more difficult than that of normal density concrete. The pressure method gives too big values because it also includes some of the air in the pores of the lightweight aggregate. The volumetric method should be preferred in the case of lightweight aggregate, but even then, the repeatability of the measurement is not as good as in the case of normal density concrete.
Because of its high porosity, lightweight aggregate may have a high initial moisture content (more than 20% by volume). In the case of non-porous aggregate, the initial moisture is located on the aggregate surface, and the maximum moisture content is relatively small. Originally, the lightweight aggregate is very dry. After burning it is "bone-dry", but sometimes it is slightly wetted by water spraying in order to reduce dust problems during storing and transportation. Outdoor storage may also increase the moisture content. However, if the lightweight aggregate is kept in a "production-dry" condition until concrete production, the variation in moisture content is normally very small and comparable to that of dry normal weight aggregate.
When p re wetted lightweight aggregate is used, the effect of the water absorption is practically eliminated. However, the moisture content of the prewetted aggregate varies and it is very difficult to distinguish between the water located in the aggregate and the water located on the aggregate surface. The moisture on the aggregate surface contributes to the free water and, therefore, has to be taken into account in the proportioning of the concrete. Generally, the use of prewetted lightweight aggregate causes a bigger variation in concrete composition compared with that of dry lightweight aggregate.
3.1.3 Concrete composition
With a simple calculation, it can be shown that the maximum error of concrete composition may be up to twice for lightweight aggregate concrete compared to that of normal density concrete. The bigger error is due to the bigger variation of the air content of fresh concrete and bigger variation of the moisture content of

EFFECT OF WATER ABSORPTION 23
the aggregate in addition to the water absorption by lightweight aggregate. Table 2 shows estimations for the error of the different variables.
Table 2. Estimated errors of the most important variables for normal density concrete (NDC) and for lightweight aggregate concrete (LWAC).
Variable Error
NDC LWAC
Air content 2.5 dm3/m3 5.0 dm3/m3
Moisture content of aggregate
0.5%0.5% (11.0% 12
Density of aggregate
15 kg/m315 kg/m31120 kg/m3 (2
Water absorption - 1.0%
(1 = normal weight aggregate p = lightweight aggregate
The error of the effective water-cement ratio is practically the same for both lightweight aggregate concrete and normal density concrete. Lightweight aggregate concrete has an additional variable in the form of incorrect water absorption by the aggregate. However, the error in the effective water-cement ratio is not much bigger, because the error in the initial moisture content of the lightweight aggregate does not affect the effective water content. The error is biggest, when a prewetted lightweight aggregate is used.
3.2 FRESH CONCRETE PROPERTIES
A very important effect of the water absorption by lightweight aggregate is the increased rate of workability loss of the fresh concrete. The workability loss of lightweight aggregate concrete can be divided into two parts:
1. Workability loss of the concrete caused by workability loss of cement paste.
2. Workability loss of the concrete caused by water absorption by lightweight aggregate.
The workability loss of normal density concrete (non-absorptive aggregate) is due to the first factor only. When a dry, water absorbing aggregate is used,

24 EFFECT OF WATER ABSORPTION
however, the workability loss is caused by the combined effect of both factors. In the following, the two above factors are discussed in more detail.
The workability properties of concrete can be described by use of simple empirical test methods such as slump test or flow table. However, in order to describe the workability properties of concrete more properly, more basic rheological measurements must be carried out. Based on a Bingham behavior, the fresh concrete behavior can be described by use of the two parameters: yield stress and plastic viscosity (Tattersal 1991). The yield stress is a measure of the force necessary to start a flow, and the plastic viscosity is a measure of the resistance of the concrete to increase the rate of flow. Also, the workability loss of concrete can be more properly described by changes in these two parameters.
3.2.1 Workability loss of cement paste
The factors that cause workability loss of the cement paste in concrete are level of initial consistency of the concrete, type and amount of superplasticizer, type and amount of cement, time of addition of superplasticizer, presence of other admixtures, humidity, temperature and mixing sequence (Ramachandran 1981).
All the workability properties of cement paste are affected by the surface area of the cement. The most important phases of the cement which can affect the workability properties of fresh concrete are C3A, gypsum, C4AF and alkalis. The main reaction occurring in the first couples of hours of hydration is the reaction between gypsum and C3A to form ettringite. A higher C3A content is often reported to increase the workability loss, although the use of a low C3A is no guarantee for a reduced slump loss (Malhotra 1981). It is possible that the extent of reaction between C3A and gypsum and the crystalline form of the reaction product may have an important effect on the workability properties. Although the content of gypsum is relative small, it is concentrated in the finer fractions. Therefore, 1% gypsum may make up 15% of the total specific surface of the cement. The heat produced during grinding normally causes partial conversion of the gypsum (CaS04 • 2H20) into hemihydrate (CaS04 - 0.5H2O) or anhydrite (CaS04) (Taylor 1990). Hemihydrate or soluble anhydrite supplies ions more quickly than gypsum, and thus the grade of conversion may also affect the workability properties of the fresh concrete (Mork 1994).

EFFECT OF WATER ABSORPTION 25
Hattori has stated that a coagulation of hydrated cement particles in the dormant period plays a more important role than the chemical bonding which may be formed between the particles through the hydration process (Malhotra 1981).
The temperature also has a strong effect on the workability loss. An increasing temperature from +15 to 32°C dramatically increases the rate of workability loss (Mailvaganam 1979).
High-strength concrete is commonly reported to have a higher rate of workability loss than normal grade concrete. High-strength concrete is characterized by low water-cement ratios, high dosages of superplasticizer and often also by use of silica fume. The mechanism of workability loss of high-strength concrete is rather complex. The most important factors are the time for addition of the superplasticizer, temperature, cement content, and C3A and S03 contents of the cement (Malhotra 1981, Mailvaganam 1979).
Chiocchio and Paolini (1985) studied the optimum time for addition of the superplasticizer. They noticed that the highest consistency of cement paste was achieved when the addition of superplasticizer was delayed by two minutes. Also, the change in workability was the lowest in that case. More of the admixture seems to be adsorbed by the early hydration products, especially of the aluminate phase, when the admixture is added simultaneously with water (Taylor 1990). Mannonen et al. (1995) investigated the effect of the addition time of superplasticizer with different types of cement. They distinguished between three different states of the superplasticizer in the fresh concrete: free admixture, admixture adsorbed on the surface of the cement and admixture absorbed in the cement. When a delayed addition of admixture was used, only the two first states of superplasticizer were observed. In the case of simultaneous addition, a remarkable content of the admixture was tightly absorbed by the cement. In addition to the time of addition, also the type of cement affected the admixture absorption. Cements containing a low C3A-content had a very small admixture absorption and, therefore, the difference between the simultaneous and delayed addition was negligible.
The incremental slump loss caused by superplasticizers is more pronounced for higher cement contents (Perenchio et al. 1979). There is also an optimum range of S03 content for which the slump loss is minimized.
Punkki et AL. (1995) studied the workability loss of high-strength concrete using both a coaxial cylinders viscometer and the slump test. Mixing procedure,

26 EFFECT OF WATER ABSORPTION
superplasticizer dosage, water and silica fume content were varied, but the initial slump was kept constant. The effects of superplasticizer dosage and silica fume content on yield stress and plastic viscosity as function of time are presented in Figures 12 and 13.
E
V)(/>0)L_(Z)
"G
$
Plastic viscosity [Nms]
%
SP = 2.5 %
SP = 3.1 %
Figure 12. Effect of superplasticizer dosage on yield stress and plastic viscosity 2, 30 and 60 minutes after mixing (Punkki et al. 1995). The water-cement ratios were: SP = 1.9% o w/c = 0.39, SP = 2.5% «■ w/c = 0.37, SP = 3.1% <=> w/c « 0.36. Silica fume: 5% by weight of cement. The initial slump value was constant.
£zV)m0)
"w
"O.0)>
0 % SF
5 % SF, slurry
5 % SF, powder0 rrin
10 % SF, slurry
Plastic viscosity [Nms]
Figure 13. Effect of silica fume content on yield stress and plastic viscosity 2, 30 and 60 minutes after mixing (Punkki et al. 1995). The water-cement ratio was 0.37. The initial slump value was constant.
A high superplasticizer dosage (3.1% by weight of cement) caused a smaller slump loss than smaller dosages but increased the change in viscosity of the

EFFECT OF WATER ABSORPTION 27
concrete. The use of silica fume increased the slump loss but the change in viscosity became smaller. Thus, the lowest slump loss was achieved by using a high superplasticizer dosage and a low silica fume content. However, in that case, the plastic viscosity increased most with time. The results clearly demonstrate that the slump loss describes only a part of the workability loss.
The workability loss of high-strength concrete can effectively be reduced both by delaying the addition of the superplasticizer and by using a repeated dosage of superplasticizer (Penttala 1990, Malhotra 1981). However, a long delaying may cause water separation in the fresh concrete (Anttila and Penttala 1989). Also, the risk of secondary ettringite formation may be increased at later ages in a moist environment (Penttala 1993).
3.2.2 Workability loss caused by water absorption
The water absorption by aggregate reduces the effective water content with time and, therefore, increases the rate of workability loss of the fresh concrete. The four stages of water absorption by lightweight aggregate in concrete were presented in Figure 8. For the workability loss of concrete, the most important one is stage II. Water absorption after compaction (stage III) does not affect the workability properties. Also, the water absorption during mixing is generally not harmful but may indirectly affect the absorption on the second stage. The lowest workability loss is presumably achieved by minimizing the slope at stage II.
In practice, the most effective way to reduce or avoid aggregate absorption in concrete is to prewet or impregnate the lightweight aggregate. In order to obtain an adequate degree of saturation, a relatively long storage in water or a vacuum treatment is needed. The disadvantages of a saturated aggregate are a higher concrete density and possibly also, detrimental effects on the durability properties of the concrete. In addition, a constant and known moisture content may be difficult to achieve and maintain. An impregnation increases the price of the aggregate and may also detrimentally affect the bonding between the aggregate and the cement paste.
An effective and also a commonly used method to reduce the problems caused by water absorption is to remix the fresh concrete. The concrete is remixed on the construction site and an additional dosage of superplasticizer may be added. The usability of such a procedure depends on the application and local circumstances.

28 EFFECT OF WATER ABSORPTION
3.3 MICROSTRUCTURE
The water absorption by lightweight aggregate may have a beneficial effect on the microstructure of concrete and thus also on both the durability and mechanical properties of the concrete. As discussed earlier, the water absorption reduces the water-cement ratio in the vicinity of the lightweight aggregate particles. Consequently, the transition zone between the lightweight aggregate and the cement paste may differ from that of normal density concrete. In following, the transition zone of normal density and lightweight aggregate concrete is discussed.
3.3.1 Transition zone between aggregate and cement paste
It is well known that the microstructure of the cement paste around the coarse aggregate particles in normal density concrete is different from that of the bulk cement paste. The transition zone, which is typically 50 pm thick, may include up to 70% of the total volume of the cement paste (Danielsen 1989). Studies have revealed that the microstructure of the transition zone is very complex and also variable (Diamond 1986).
The main reason for the development of the transition zone is the so-called "wall effect". Cement paste consists of multi-particle floes having the size of several hundreds pm, and roughly spherical in shape. These flocks pack poorly against the aggregate particles. Consequently, high local water content around the aggregate particles may form. Because of early calcium hydroxide supersaturation in the mixing water, a layer of calcium hydroxide (0.5 pm thick) tends to accumulate on the aggregate surface. These calcium hydroxide crystals are strongly orientated with the c-axis perpendicularly to the interface. The film thickness does not increase very much with time, but a thin single layer of C-S-H gel may start to form on the calcium hydroxide film. The thickness of this combined duplex film is normally less than 1 pm (Diamond 1986). Struble and Midness (1983), however, did not observe any duplex film. After a couple of days, on the paste side of the duplex film, a new thin secondary layer of calcium hydroxide may develop. The thickness of this film may typically be 3 pm, but the layer is usually incomplete.
On the cement paste side of the secondary calcium hydroxide layer, a space of high local water content is formed due to the "wall effect". In this space, further deposits of calcium hydroxide, and also ettringite may precipitate. These late

EFFECT OF WATER ABSORPTION 29
calcium hydroxide deposits often appear as arrays of layered crystals, tens of micrometers long, and surrounded by previously deposited hydration products. The crystal particles of the hydration products are also bigger in the transition zone than in the bulk paste. In Figures 14 and 15, schematic presentations of the microstructure of the transition zone are shown.
''TRANSITION O „
BULK
^ CASH
Q O ca(OH)2
IKMM C S H
O CEMENT GRAIN
Figure 14. Schematic presentation of the microstructure of the transition zone between polished rock aggregate and cement paste (Monteiro 1985).
Figure 15. Diagrammatic representation of the transition zone and bulk cement paste in concrete (Mehta and Monteiro 1993).
Because of the more poorly packed cement particles, the porosity of the transition zone is normally higher than that of the bulk paste. Scrivener et al. (1988) also determined the quantity and distribution of unreacted cement, pores larger than 0.5 pm and calcium hydroxide by use of backscattered electron imaging

30 EFFECT OF WATER ABSORPTION
combined with quantitative image analysis. As shown in Figure 16, the porosity was higher in the vicinity of the aggregate surface extending over a transition zone of about 50 pm into the paste. Scrivener et al. (1988) also confirmed that the content of unhydrous material is smaller in the transition zone than in the bulk paste. Because of their relatively large size, cement particles simply cannot approach the aggregate particles.
Of 20
32 io
(hf Porosity
Figure 16. Results of image analysis in the transition zone, in the bulk concrete and in the pastes for anhydrous material and porosity (Scrivener et al. 1988).
The quality and volume of the transition zone is primarily controlled by water- cement ratio, use of pozzolanic materials and chemical admixtures, cement type, size and shape of sand particles and mineral composition of aggregate.
A lower water-cement ratio normally gives a smaller transition zone. Pozzolanic materials may have a big effect on the transition zone, particularly condensed silica fume, because it is much smaller than the cement particles. In addition, the pozzolanic materials very efficiently consume calcium hydroxide. Silica fume also reduces the bleeding of concrete. The main effect of silica fume is assumed to be the "filler effect", which contributes to the reduced porosity of the transition zone (Fig. 16). Monteiro and Mehta (1986a) found a remarkable decrease in the thickness of the transition zone when silica fume was used. Scrivener et al.
(1988) postulated that the major effect of silica fume on the concrete quality was a densification of the transition zone. The effect on the total observed porosity in the bulk paste was very small.
Although the cement paste properties primarily control the quality of the transition zone, also the aggregate properties may have an influence. Monteiro et al.
(1985) reported that the thickness of the transition zone was larger for larger aggregates but it was also a function of size and shape of the sand particles.

EFFECT OF WATER ABSORPTION 31
The surface effects originated by the sand particles interfere with those caused by the larger aggregates.
Different types of interaction between the coarse aggregate and the hardened cement paste may exist. The interactions can be divided into three groups:
1. Physical interaction2. Physical-chemical interaction3. Mechanical interlocking
Normally, the interaction is physical in nature, but the bond between the components is normally very weak. However, for some types of aggregate, e g. carbonate rocks, a physical-chemical interaction may also be developed (Monteiro and Mehta 1986b).
High-strength concrete is characterized by a low water-cement ratio and mineral admixtures, especially silica fume. Therefore, in high-strength concrete, the properties of the transition zone do not differ from the bulk paste to the same extent as in the case of "normal strength" concrete. Often, the transition zone is not detectable at all.
As discussed above, the transition zone of normal density concrete is generally the weakest link and also the most permeable part of the concrete. Consequently, both the mechanical and the durability properties of the concrete are strongly affected by the quality of the transition zone. In the case of lightweight aggregate concrete, however, the situation is somewhat different. The lightweight aggregate is often the weakest link independently of the quality of the transition zone and, therefore, the mechanical properties are not necessarily so strongly controlled by the quality of the transition zone. However, as far as permeability of lightweight aggregate concrete is concerned, the transition zone may still play an important role. Even though the lightweight aggregate is porous, the permeability of lightweight aggregate concrete is not necessary controlled by the porosity of the aggregate, but rather by the quality of the hardened cement paste.
In principle, the transition zone of lightweight aggregate concrete is caused by the same factors as in the case of normal density concrete. However, the water absorption, a possible high initial moisture content, different surface structure and lower density of the lightweight aggregate may affect the quality of the transition zone. Due to the lower density of the aggregate, bleeding may be different between lightweight concrete and normal density concrete. Also, the elastic mis
32 EFFECT OF WATER ABSORPTION
match between the aggregate and the cement paste is smaller in the case of lightweight aggregate concrete (Bremner and Holm 1986). The transition zone of lightweight aggregate concrete may differ from that of normal density concrete due to the following effects:
1. Water absorption by the lightweight aggregate may reduce the water-cement ratio adjacent to the lightweight aggregate particles.
2. Outcoming air from the lightweight aggregate may form rims of air bubbles on the aggregate surface
3. The open surface pore structure of the lightweight aggregate may improve the mechanical interlocking between the aggregate and the cement paste.
4. A pozzolanic reaction may take place between the lightweight aggregate and the cement paste.
In the case of high-strength lightweight aggregate concrete, only the first two effects are probably relevant. The mechanical interlocking may have some influence when a more porous lightweight aggregate type is used, but hardly in the case of high-strength lightweight aggregate. Khokhrin (1973) found new chemical formations at the interfacial zone between Keramzite aggregate and the cement matrix. Zhang (1989) studied pozzolanic activity of ground lightweight aggregate. According to her results, a pozzolanic reaction between the lightweight aggregate and the cement paste does probably not play an important role.
The transition zone of lightweight aggregate concrete has been studied by several researchers. Khokhrin (1973), Fagerlund (1972) and Scheider and Chen (1992) found an improved transition zone, i.e. the properties of the transition zone were better than that of the bulk paste. Helene et al. (1992) found that the transition zone between the lightweight aggregate and the cement paste was generally smaller than that around the sand particles.
By use of microhardness tests, Khokhrin (1973) reported that the improved transition zone was about 60 pm. Fagerlund (1972) suggested that the quality of the matrix in the vicinity of lightweight aggregate was improved by a "filtration effect", where only the water entered the aggregate. Scheider and Chen (1992) reported that the fresh cement paste was sucked into the open capillaries of the aggregate resulting in a significant strengthening of the mechanical bonds. The
EFFECT OF WATER ABSORPTION 33
microhardness near the aggregate surface (approximately 20 pm) was about two times that of the bulk paste. When a lightweight aggregate was soaked for 24 hours in water before mixing, the microhardness was slightly smaller near the aggregate than in the neighboring region but about the same as that further away. Zhang and Gjorv (1990a) investigated the penetration of cement paste into high-strength lightweight aggregate. They reported that the cement paste penetrated most of the open pores in the surface layer of the aggregate, but a deeper penetration was not observed. The penetration depth depended on the surface porosity of the aggregate.
Helene et al. (1992) investigated the microstructure of lightweight aggregate mortars. They found a better bond between the lightweight aggregate particles and the cement paste than between the sand and the cement paste. They suggested that the small size and the internal cell structure in the lightweight aggregate particles tended to reduce the bleeding at the interface. In addition, the pozzolanic reaction from the lightweight aggregate was believed to improve the characteristics of the transition zone.
Zhang and Gjgrv (1990b) observed that the quality of the transition zone depended on the aggregate type. Lightweight aggregate with a dense outer layer had a transition zone similar to that of normal weight aggregate, while more porous aggregates gave a more dense and homogeneous transition zone.
Scheider and Chen (1992) suggested that lightweight aggregate may have a so- called "micro-waterpump-effect", i.e. the aggregate is able to suck water from the fresh paste and later on give it back for improved curing of the cement paste. These combined effects were assumed to improve the quality of the lightweight aggregate concrete. Weber and Reinhardt (1995) did also assume that the use of prewetted lightweight aggregate supports the curing of the cement paste.
The primary reason for the development of a good transition zone between the lightweight aggregate and the cement paste is the water absorption by lightweight aggregate. The water absorption by lightweight aggregate may reduce the thickness of the transition zone. The water around the aggregate particles is partly sucked up by the lightweight aggregate. However, it is questionable whether the porosity of the transition zone is smaller than that of the bulk paste. Although the water absorption may improve the packing of the cement particles around the aggregate particles, it is possible that the packing is still more poor than in the bulk paste.
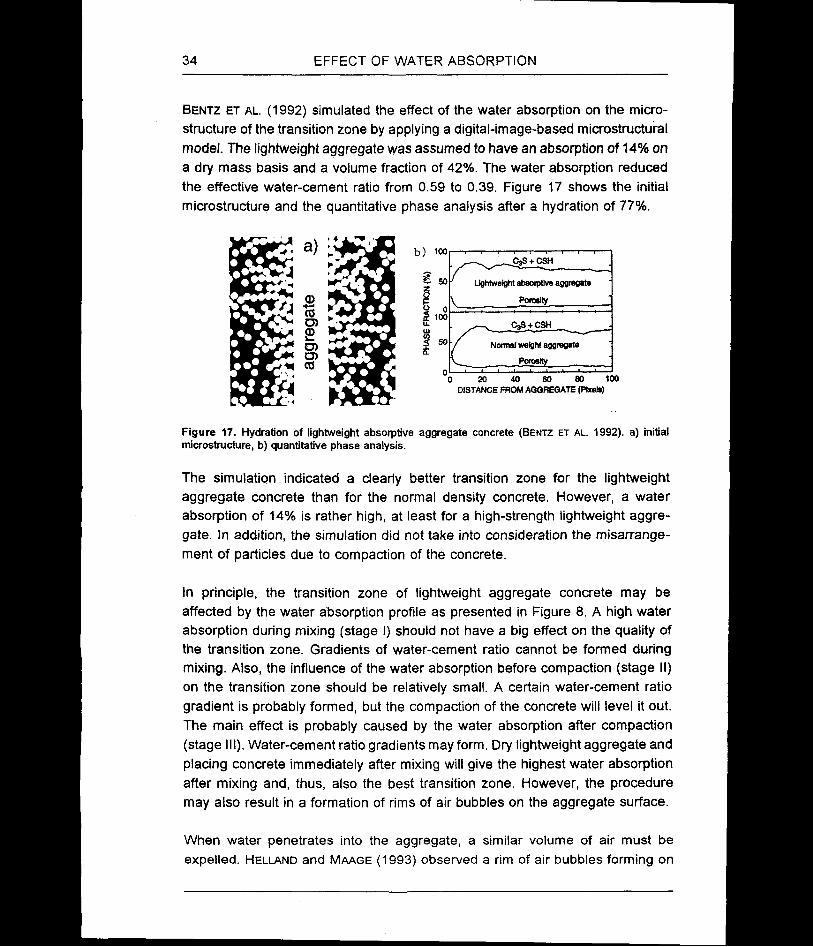
34 EFFECT OF WATER ABSORPTION
Bentz et al. (1992) simulated the effect of the water absorption on the microstructure of the transition zone by applying a digital-image-based microstructural model. The lightweight aggregate was assumed to have an absorption of 14% on a dry mass basis and a volume fraction of 42%. The water absorption reduced the effective water-cement ratio from 0.59 to 0.39. Figure 17 shows the initial microstructure and the quantitative phase analysis after a hydration of 77%.
b' —
0 20 40 60 80 100DISTANCE FROM AGGREGATE (Pixels)
0
Figure 17. Hydration of lightweight absorptive aggregate concrete (Bentz et al. 1992). a) initial microstructure, b) quantitative phase analysis.
The simulation indicated a clearly better transition zone for the lightweight aggregate concrete than for the normal density concrete. However, a water absorption of 14% is rather high, at least for a high-strength lightweight aggregate. In addition, the simulation did not take into consideration the (Disarrangement of particles due to compaction of the concrete.
In principle, the transition zone of lightweight aggregate concrete may be affected by the water absorption profile as presented in Figure 8. A high water absorption during mixing (stage I) should not have a big effect on the quality of the transition zone. Gradients of water-cement ratio cannot be formed during mixing. Also, the influence of the water absorption before compaction (stage II) on the transition zone should be relatively small. A certain water-cement ratio gradient is probably formed, but the compaction of the concrete will level it out. The main effect is probably caused by the water absorption after compaction (stage III). Water-cement ratio gradients may form. Dry lightweight aggregate and placing concrete immediately after mixing will give the highest water absorption after mixing and, thus, also the best transition zone. However, the procedure may also result in a formation of rims of air bubbles on the aggregate surface.
When water penetrates into the aggregate, a similar volume of air must be expelled. Helland and Maage (1993) observed a rim of air bubbles forming on

EFFECT OF WATER ABSORPTION 35
the surface of the lightweight aggregate when the concrete was cast immediately after mixing. The compressive strength was also distinctly lower compared with the specimens cast 22 minutes later on. The amount of out-coming air is dependent on the water absorption which takes place after compaction. In principle, the influence of out-coming air should not be very big, becauce the water in the cement paste is replaced by about the same volume of air. However, out-coming air may concentrate in certain locations and, thus, increase stress concentrations. The existence of air bubbles at the aggregate surface may also be due to the use of air-entraining agents. Dodson (1990) reported that in the case of a high entrained air content, the air is accumulating on the surfaces of the large aggregates and, therefore, the bond between the aggregate and the cement paste may be reduced.
3.4 OTHER EFFECTS
As discussed above, a water absorption by lightweight aggregate will probably improve the concrete microstructure in general and, thus, have a beneficial effect on both the durability and the mechanical properties of the concrete. However, water absorption may also affect the durability of concrete in a detrimental way. The water absorption itself does not necessarily have a detrimental effect on the concrete durability, but the final moisture content of the aggregate does, i.e. the sum of the initial moisture content and the water absorption may affect the behaviour.
The water located inside the aggregate particles may have a detrimental effect both on the freeze-thaw and fire resistance of concrete. It has often been reported that lightweight aggregate concrete has an excellent freeze-thaw durability (Wilson and Malhotra 1988, Bilodeau et al. 1995). However, when the moisture content of the aggregate is sufficiently high, the freeze-thaw durability may be reduced (LaFraugh 1987, Johnston and Malhotra 1987). Jacobsen et al. (1995) got a very good frost resistance for the high-strength lightweight aggregate concrete when a dry lightweight aggregate was used, whereas the use of vacuum saturated lightweight aggregate gave a relatively low frost resistance. Even though prewetted aggregate is used, the freeze-thaw durability may be satisfactory if the concrete is allowed to dry prior to freezing exposure (ACl 213 1987). As in normal density concrete, air entraining improves the freeze-thaw resistance of lightweight aggregate concrete (Klieger and Hanson 1961). Danielson (1989) reported that the fire resistance of concrete was also reduced when lightweight aggregate was used. Hammer (1990) got a relatively low
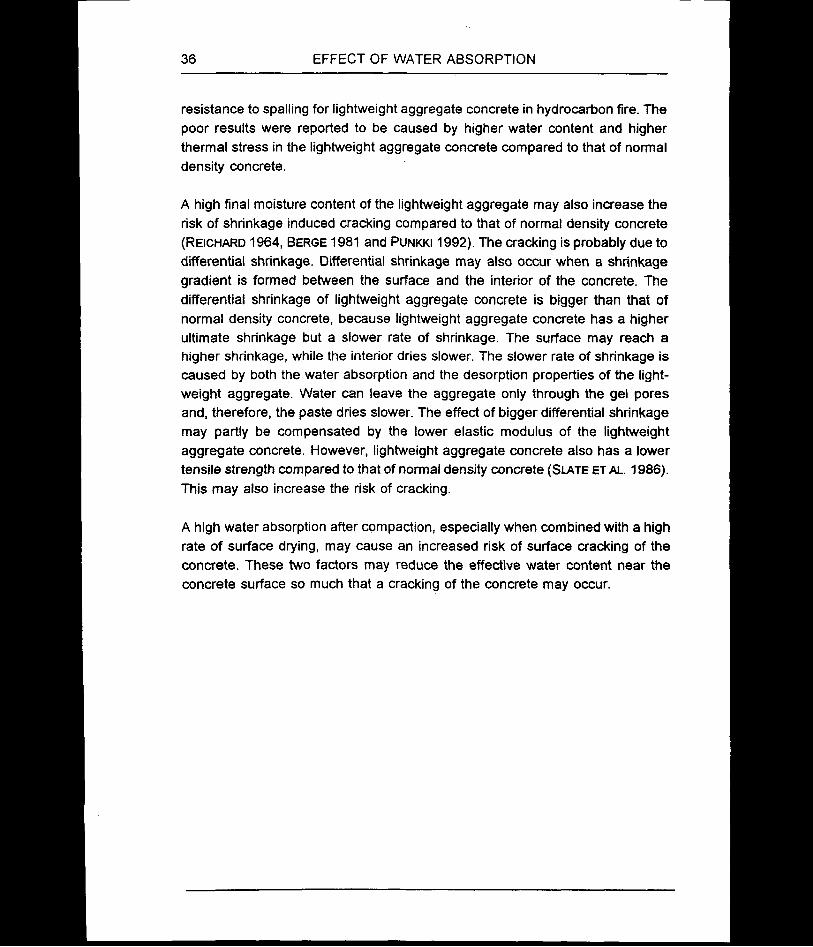
36 EFFECT OF WATER ABSORPTION
resistance to spalling for lightweight aggregate concrete in hydrocarbon fire. The poor results were reported to be caused by higher water content and higher thermal stress in the lightweight aggregate concrete compared to that of normal density concrete.
A high final moisture content of the lightweight aggregate may also increase the risk of shrinkage induced cracking compared to that of normal density concrete (Reichard 1964, Berge 1981 and Punkki 1992). The cracking is probably due to differential shrinkage. Differential shrinkage may also occur when a shrinkage gradient is formed between the surface and the interior of the concrete. The differential shrinkage of lightweight aggregate concrete is bigger than that of normal density concrete, because lightweight aggregate concrete has a higher ultimate shrinkage but a slower rate of shrinkage. The surface may reach a higher shrinkage, while the interior dries slower. The slower rate of shrinkage is caused by both the water absorption and the desorption properties of the lightweight aggregate. Water can leave the aggregate only through the gel pores and, therefore, the paste dries slower. The effect of bigger differential shrinkage may partly be compensated by the lower elastic modulus of the lightweight aggregate concrete. However, lightweight aggregate concrete also has a lower tensile strength compared to that of normal density concrete (Slate et al. 1986). This may also increase the risk of cracking.
A high water absorption after compaction, especially when combined with a high rate of surface drying, may cause an increased risk of surface cracking of the concrete. These two factors may reduce the effective water content near the concrete surface so much that a cracking of the concrete may occur.
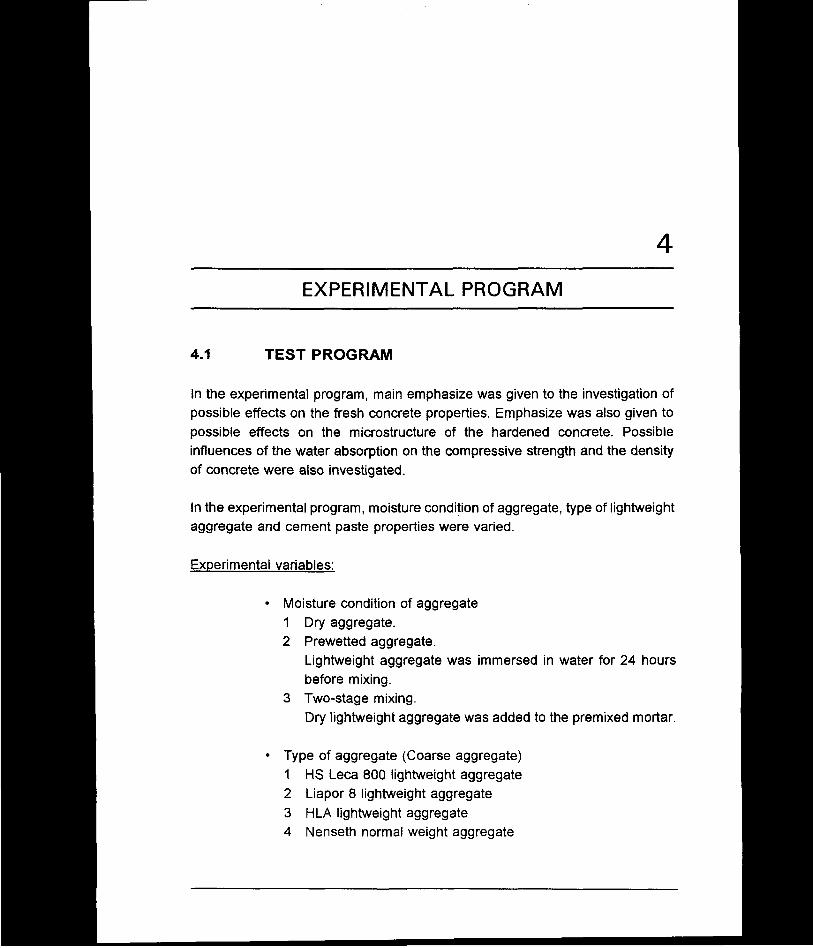
4
EXPERIMENTAL PROGRAM
4.1 TEST PROGRAM
In the experimental program, main emphasize was given to the investigation of possible effects on the fresh concrete properties. Emphasize was also given to possible effects on the microstructure of the hardened concrete. Possible influences of the water absorption on the compressive strength and the density of concrete were also investigated.
In the experimental program, moisture condition of aggregate, type of lightweight aggregate and cement paste properties were varied.
Experimental variables:
• Moisture condition of aggregate1 Dry aggregate.2 Prewetted aggregate.
Lightweight aggregate was immersed in water for 24 hours before mixing.
3 Two-stage mixing.Dry lightweight aggregate was added to the premixed mortar.
• Type of aggregate (Coarse aggregate)1 HS Leca 800 lightweight aggregate2 Liapor 8 lightweight aggregate3 HLA lightweight aggregate4 Nenseth normal weight aggregate
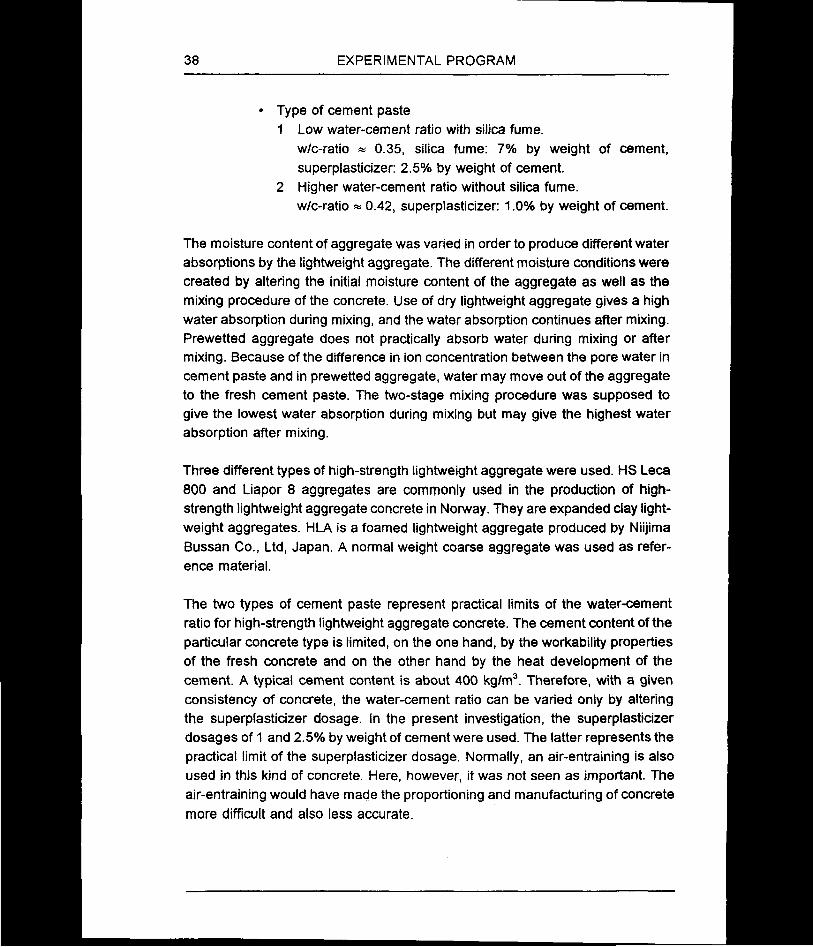
38 EXPERIMENTAL PROGRAM
• Type of cement paste1 Low water-cement ratio with silica fume.
w/c-ratio « 0.35, silica fume: 7% by weight of cement, superplasticizer: 2.5% by weight of cement.
2 Higher water-cement ratio without silica fume.w/c-ratio « 0.42, superplasticizer: 1.0% by weight of cement.
The moisture content of aggregate was varied in order to produce different water absorptions by the lightweight aggregate. The different moisture conditions were created by altering the initial moisture content of the aggregate as well as the mixing procedure of the concrete. Use of dry lightweight aggregate gives a high water absorption during mixing, and the water absorption continues after mixing. Prewetted aggregate does not practically absorb water during mixing or after mixing. Because of the difference in ion concentration between the pore water in cement paste and in prewetted aggregate, water may move out of the aggregate to the fresh cement paste. The two-stage mixing procedure was supposed to give the lowest water absorption during mixing but may give the highest water absorption after mixing.
Three different types of high-strength lightweight aggregate were used. HS Leca 800 and Liapor 8 aggregates are commonly used in the production of high- strength lightweight aggregate concrete in Norway. They are expanded clay lightweight aggregates. HLA is a foamed lightweight aggregate produced by Niijima Bussan Co., Ltd, Japan. A normal weight coarse aggregate was used as reference material.
The two types of cement paste represent practical limits of the water-cement ratio for high-strength lightweight aggregate concrete. The cement content of the particular concrete type is limited, on the one hand, by the workability properties of the fresh concrete and on the other hand by the heat development of the cement. A typical cement content is about 400 kg/m3. Therefore, with a given consistency of concrete, the water-cement ratio can be varied only by altering the superplasticizer dosage. In the present investigation, the superplasticizer dosages of 1 and 2.5% by weight of cement were used. The latter represents the practical limit of the superplasticizer dosage. Normally, an air-entraining is also used in this kind of concrete. Here, however, it was not seen as important. The air-entraining would have made the proportioning and manufacturing of concrete more difficult and also less accurate.

EXPERIMENTAL PROGRAM 39
The different combinations were coded with a three digit number in which the first means the cement paste type, the second the moisture condition of aggregate and the third the aggregate type. For example, 121 means the combination of low water-cement ratio, prewetted lightweight aggregate and HS Leca 800 lightweight aggregate.
The response variables of the experimental program are listed in the following:
Response variables:
• Water absorption by lightweight aggregate in concrete
• Slump loss
• Compressive strength and density
• Microstructure and porosity of concrete Only for moisture conditions 1 and 2.
The response variables are described in more detail in Chapter 4.4.
4.2 MATERIALS
4.2.1 Cement and admixtures
A high-strength Norwegian Portland cement of type HS 65 and a Norwegian condensed silica fume were used as cementitious material. The composition and the physical properties of the cement are given in Tables 3 and 4. The silica fume, which had a particle density of 2200 kg/m3 and a surface area of 20 m2/g, had a chemical composition as shown in Table 5.
A modified naphthalene formaldehyde polycondensate type of superplasticizer, Mighty 150, was used. The admixture had a density of 1210 kg/m3 and a solid concentration of about 42%.
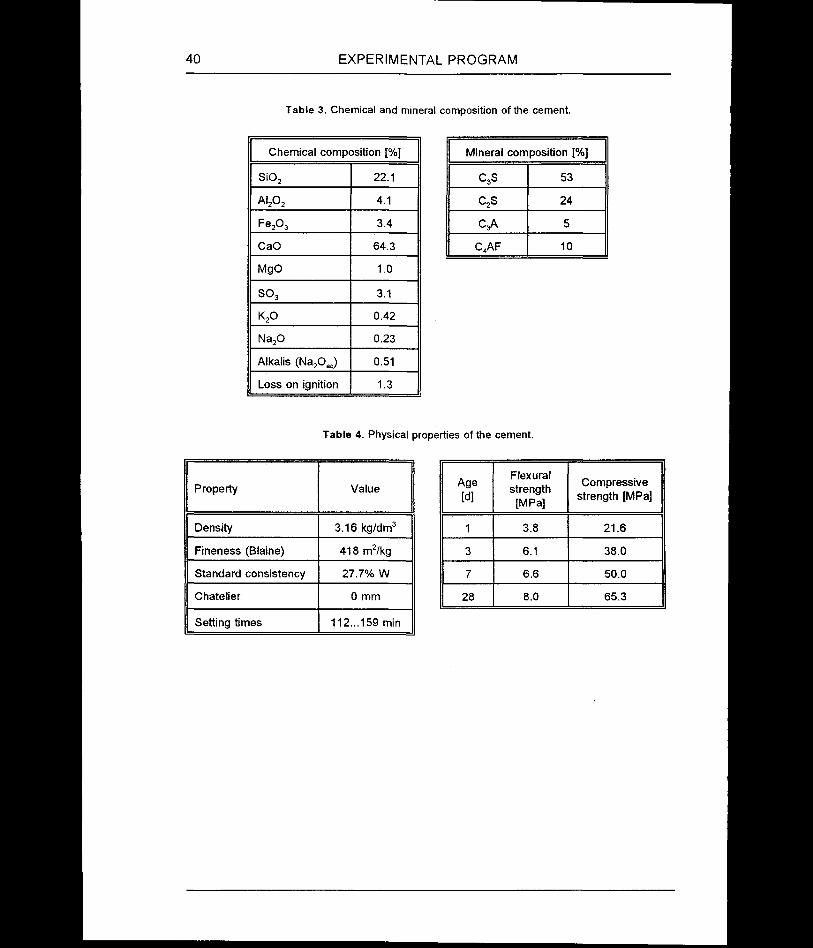
40 EXPERIMENTAL PROGRAM
Table 3. Chemical and mineral composition of the cement.
Mineral composition [%]
C3S 53
C2S 24
c3a 5
c4af 10
Chemical composition [%]
Si02 22.1
Al202 4.1
Fe203 3.4
CaO 64.3
MgO 1.0
SO, 3.1
k2o 0.42
Na20 0.23
Alkalis (Na2Oeq) 0.51
Loss on ignition 1.3
Table 4. Physical properties of the cement.
Property Value
Density 3.16 kg/dm3
Fineness (Blaine) 418 nf/kg
Standard consistency 27.7% W
Chatelier 0 mm
Setting times 112...159 min
Age[d]
Flexuralstrength
[MPa]
Compressive strength [MPa]
1 3.8 21.6
3 6.1 38.0
7 6.6 50.0
28 8.0 65.3

EXPERIMENTAL PROGRAM 41
Table 5. Chemical composition of the silica fume.
Chemical composition [%]
Si02 91.7
Fe203 3.0
AI2O3 0.26
CaO 1.4
MgO 0.70
Na20 0.31
K20 0.48
Cl 0.05
h2o 0.32
C 1.5
Loss on ignition 2.1
4.2.2 Lightweight aggregate
Of the different types of lightweight aggregate, only the coarse fractions (> 4 mm) were used. HS Leca 800 had the fractions 4-8 mm and 8-12 mm, Liapor 8 had the fractions 4-8 mm and 8-16 mm and HLA had the fractions 5-10 mm and 10-15 mm. The water absorption tests showed that HLA aggregate did not absorb any water and, therefore, no further testing in concrete was carried out with this type of aggregate.
The densities of the lightweight aggregate are presented in Table 6 and the gradings in Table 7. Typical photographs are shown in Figure 28.

42 EXPERIMENTAL PROGRAM
Table 6. Trade marks, fractions, particle densities and bulk densities of the lightweight aggregate fractions.
Trade mark Fraction[mm]
Particle density [kg/m3]
Bulk density [kg/m3]
HS Leca 8004-8 1 430 810
8-12 1 450 805
Liapor 84-8 1 410 7558-16 1 480 715
HLA5-10 1 230 n10-15 1 230 n
h not determined
Table 7. Grading of the lightweight aggregate fractions (weight-%).
Aggregate fraction Sieve size [mm]
0.125 0.25 0.5 1 2 4 8 16
HS Leca 800, 4-8 mm 0 0 0 0 0 2 97 100HS Leca 800, 8-12 mm 0 0 0 0 0 0 4 95
Liapor 8, 4-8 mm 0 0 0 0 1 2 87 100Liapor 8, 8-16 mm 0 0 0 0 0 0 8 98
4.2.3 Normal weight aggregate
A natural, dried sand was used as fine aggregate in all concrete mixtures. The aggregate consisted of three fractions, 0-0.5 mm, 0.5-2 mm and 2-4 mm, and was produced in Kilemoen, Norway. In addition, a normal weight aggregate fraction from Nenseth, Norway was used as coarse aggregate. Of this aggregate, only one fraction (4-8 mm) was used. The particle densities and the grading are presented in Table 8. The rock type compositions of the coarse normal weight aggregate are given in Table 9. A photograph of the coarse normal weight aggregate is shown in Figure 28 (page 69).
The coarse normal weight aggregate was only used as a reference material. The upper grading limit of the normal weight coarse aggregate was smaller than that of the lightweight aggregate. However, because of the different particle shapes, the real aggregate sizes were relatively close to each other. This can be seen in Figure 28.

EXPERIMENTAL PROGRAM 43
Table 8. Grading and particle density of normal weight aggregate fractions (weight-%).
Fraction Particledensity[kg/m3]
Sieve size [mm
0.125 0.25 0.5 1 2 4 8 16
0-0.5 mm 2 660 9 34 94 100 100 100 100 1000.5-2 mm 2 660 1 2 21 83 100 100 100 1002-4 mm 2 660 0 1 1 1 14 95 100 100
4-8 mm 2 650 0 0 0 0 0 1 56 100
Table 9. Rock type composition of coarse normal weight aggregate.
Rock type Composition [vol %]
Gneiss / Granite 54
Quartzite, coarse-grained 16
Feldspar / monzonite-type rock 8
Metarhyolite 7
Quartzite, fine-grained 4
Mafic rock type 3
Mylonite 3
Volcanic rock type 3
Breccia-type rock 1
Metasandstone 1
4.3 MIX DESIGN, MIXING PROCEDURE AND SPECIMENPREPARATION
4.3.1 Mix design
When the moisture condition or the type of aggregate was varied, the cement, silica fume and superplasticizer contents were kept constant. Water content was adjusted so that an approximately constant slump immediately after mixing was achieved.

44 EXPERIMENTAL PROGRAM
The effective water-cement ratio was calculated on the basis of the water absorption value immediately after mixing. Thus, the effective water-cement ratio was not exactly constant, but dependent on the water demand of the coarse aggregate. In addition, the final effective water-cement ratio varied depending on the aggregate absorption after mixing. Another possibility would be to keep the effective water-cement ratio after mixing or the final effective water-cement ratio constant. This could be achieved by varying the superplasticizer content or the initial consistency of the concrete. However, the workability loss cannot be analyzed if the initial consistency or the effective composition of the concrete immediately after mixing varies significantly. In the present study, it was considered that a certain consistency of concrete had to be achieved with a certain content of cement and superplasticizer. If one type of aggregate allowed for smaller water content or the water absorption by aggregate reduced the final effective water-cement ratio, this was considered as part of the aggregate properties.
The fixed parameters in the mix design are presented in Table 10, while the aggregate composition is shown in Table 11. The combined aggregate grading curves are presented in Table 12.
Table 10. Contents of cement, silica fume and superplastizer.
Constituent | Content [kg/m3]
| Cement paste type 1 Cement paste type 2
Cement| 400
400
Silica fume| 28
-
Superplasticizer | 104
Table 11. Aggregate composition [vol %].
Fraction Coarse aggregate |
HS Leca 800 Liapor 8 Nenseth(NWA)
0-0.5 mm 15 15 15
0.5-2 mm 5 5 5
2-4 mm 20 20 20
4-8 mm 30 30 60
8-12 (16) mm 30 30 -

EXPERIMENTAL PROGRAM 45
Table 12. Combined aggregate grading [vol %].
Coarseaggregate
Sieve size [mm
0.125 0.25 0.5 1 2 4 8 16
HS Leca 800 2 5 15 19 23 40 71 99
Liapor 8 2 5 15 19 23 40 69 99
Nenseth 2 5 15 19 23 40 74 100
In the concrete proportioning, the air content was assumed to be 10 dm3/m3 for the cement paste type 1 and 20 dm3/m3 for the type 2. The target slump value was 220 mm for the cement paste type 1 and 180 mm for the type 2. A somewhat smaller target slump was used for the cement paste type 2 in order to reduce possible segregation problems. It should also be noted that these two target slumps are not directly comparable. Even if the slump values were the same, the rheological properties would not necessarily be the same for so different cement paste compositions. Also, different types of coarse aggregate would give different initial slump values, even though the consistencies of the concretes were the same.
The average water absorption value immediately after mixing was determined from three parallel test batches. The mix design was corrected by taking into account the measured water absorption value. Both the coarse aggregate fractions were assumed to have the same water absorption, although only the water absorption of the biggest particles was measured. The fresh concrete density or the measured air content was not used in the correction. The corrected proportionings differed from the originals to some extent as shown in Appendix A.
4.3.2 Mixing procedure
The concrete batches were mixed by use of an Eirich mixer with a capacity of 50 dm3. The batch volume was 20, 30 or 40 dm3 depending on the tests made from the batch. The tests carried out from each type of batch are presented in Chapter 4.3.3. The total mixing time varied depending on the mixing procedure. However, the coarse aggregate was always mixed for four minutes. The mixing procedures are shown in Figure 18.

46 EXPERIMENTAL PROGRAM
C, A SP
0.33 W 0.67 W MIXING PROCEDURES
I Dry aggregate
3 Prewetted aggregate
C, FA SP0.33 W 0.67 W CA
'' Two-stage mixing
0 12 3 4 5 6 7Time [min]
Figure 18. Mixing procedures. C = cementitious material, A = aggregate (fine and coarse), FA = fine aggregate, CA = coarse aggregate, W = water and SP = superplasticizer. The procedures have been presented in Chapter 4.1.
4.3.3 Specimen preparation
The experimental program consisted of 14 different concrete mixtures. All the concrete mixtures were produced at least three times (three parallel batches). The slump and the water absorption by lightweight aggregate were measured from all three parallel batches, compressive strength was measured from two parallel batches, and the microstructural analyses were carried out from the specimens prepared only in one batch. Table 13 shows the test specimens prepared from each type of batch. Test specimens were prepared both 1 min and 30 min after mixing.
Table 13. Test specimens cast from different concrete batches. Specimens were prepared at two separate times: 1 and 30 min after mixing, respectively.
Test specimen Batch volume [dm3]
20 30 40
Cubes (100 mm)
1 min after mixing - 3 3
30 min after mixing - 6 6
Cylinders (0 = 100 mm)
1 min after mixing - - 2
30 min after mixing - - 3

EXPERIMENTAL PROGRAM 47
The specimens were compacted on a laboratory vibrating table. The specimens were demolded the next morning and stored in water until time of testing. For the 1 day compressive testing, the specimens were stored in a plastic bag between demolding and testing.
The cubes were used for compressive strength and density tests. The cylinder specimens were used for microstructura! analyses.
4.4 TEST PROCEDURES
4.4.1 Water absorption by lightweight aggregate
The water absorption by lightweight aggregate was determined in water, in cement paste and in fresh concrete. The main analysis was made using the results determined in fresh concrete - the water absorption in water and in cement paste were used as additional information. All three test procedures are described in the following. The reliability of the concrete procedure is also discussed.
Water absorption in water
Water absorption in water was determined by keeping the aggregate immersed in water for a certain period. Then, the aggregate was dried by towels to a surface dry condition. The water absorption was measured after 1,4,7, 24, 44, 60 min and 24 h. These periods were partly the same as those used in the concrete procedure.
Water absorption in cement paste
The cement paste tests were primarily carried out in order to determine how much dry cement paste would typically remain on the aggregate surface from the concrete procedure. In addition to the cement paste content, the paste test also gives information about the water absorption.
In the paste tests, 1 dm3 cement paste with a water-cement ratio of 0.35 was prepared. The cement type was the same as in all the other tests and no admixture was used. Six parallel tests were made. The cement paste was first mixed for three minutes with a small laboratory mixer. Then, five aggregate particles were added to the paste and the mixture was further mixed for five

48 EXPERIMENTAL PROGRAM
minutes with a rubber spatula. After mixing the aggregate particles were picked from the paste, cleaned with a brush, weighed and dried to a constant weight at 105°C. The weight of the dry aggregate, the weight after cleaning but before drying and the weight after drying enabled a simple determination of the water absorption by the aggregate in cement paste as well as the dried cement paste content on the aggregate surface.
Water absorption in fresh concrete
The water absorption by lightweight aggregate in fresh concrete was determined according to a method presented by Punkki and Gjorv (1993), see also Chap. 2.5. According to this method, five individual aggregate particles are picked from the fresh concrete mix at 3, 20, 40 and 57 min after mixing. The particles are cleaned with a brush and the weight of the aggregate particles is determined before and after drying to a constant weight at 105°C.
The water absorption is calculated from Equation 5. The dried cement paste content on the aggregate surface for each aggregate type is pre-determined in the paste tests. The non-evaporable water content of the dried cement paste on the aggregate surface is assumed to be 2.5% by weight of cement.
The water absorption was determined from all three parallel test batches. By use of a regression analysis, a constant value (water absorption immediately after mixing) and a coefficient were calculated (Figure 19). The time dependence was assumed to be linear. The results were analyzed by use of an analysis of variance.
Coefficient
Constant
Time after mixing [mil
Figure 19. Determination of the constant and the coefficient value by use of regression analysis.

EXPERIMENTAL PROGRAM 49
Both coarse aggregate fractions were assumed to have the same water absorption properties although only the largest particles were analyzed. The effect of the particle size has been investigated by Punkki (1993) and the results are presented in Table 14 and Figure 20. In the case of HS Leca 800 aggregate, the particle shape is rather indefinite and, therefore, the particle size measured is only suggestive. The results indicate that there is no significant correlation between particle size and water absorption.
Table 14. Effect of the particle size of aggregate on the water absorption and the dried cement paste content on the aggregate surface. Water-cement ratio: 0.35. The results of six parallel tests are shown.
Aggregate type Average particle size
[mm]
Water absorption [wt %] Dried paste content [wt %]average std
HS Leca 800, 4-8 mm 8.0 3.59 0.309 1.95
HS Leca 800, 8-12 mm 11.9 3.83 0.200 2.46
Liapor 8, 4-8 mm 6.0 2.38 0.417 0.18
Liapor 8, 4-8 mm 7.0 2.46 0.165 0.19
Liapor 8, 4-8 mm 8.0 2.54 0.447 0.50
Liapor 8, 8-16 mm 9.0 3.44 0.451 0.78
Liapor 8, 8-16 mm 12.0 2.93 0.348 0.57
Liapor 8, 8-16 mm 15.0 2.80 0.191 0.89
? 5
74ioe- 3 4.o
0 2 4
I1
Fraction:
4-8 mmFraction:8-12 mm / 8-16 mm Liapor 8
HS Leca 800
8 9 10 11 12 13 14 15Particle size [mm]
Figure 20. Effect of particle size of the aggregate on the water absorption (Punkki 1993). Average values and confidence limits (95%) are indicated.

50 EXPERIMENTAL PROGRAM
The sample size is so small that a relative big natural variation cannot be avoided. The natural variation is mostly due to the variation in the porosity of aggregate. The other sources of error in this method are evaporation during cleaning, incorrect dry paste content on the aggregate surface, incorrect water-cement ratio and incorrect non-evaporable water content, respectively. Because of the variation, several test series should normally be run.
The variation in porosity of aggregate was estimated by measuring the particle density of 30 individual aggregate particles. The particle density was determined by weighing aggregate particles in air and in oil. Oil was used instead of water in order to minimize the effect of the absorption. The coefficients of variation are presented in Table 15. The table also shows estimations for the error of the average particle density when five individual aggregate particles are treated together. The probability level used was 95%. The effect of the particle density variation on the water absorption was estimated by assuming that the water absorption is directly dependent on the total porosity of the aggregate. The errors have been calculated for different water absorption values.
Table 15. Variation in particle density of the lightweight aggregate and its effect on the water absorption value measured (average of five particles).
Aggregate type Coefficient of variation of
particle density [%]
Error in measured
particle density [%]
Effect on water absorption [percentage unit]
WAB0:1%
WAB0:3%
WAB0:5%
HS Leca 800, 8-12 mm 7.5 7.0 0.08 0.24 0.39
Liapor 8, 8-16 mm 4.6 4.2 0.05 0.14 0.24
In addition to the variation of the particle density, the maximum errors of the method were estimated as follows (expressed as percentage units) (Punkki
1993):
Evaporation during cleaning:Incorrect dried paste content:Incorrect water-cement ratio:Incorrect non-evaporable water content:
-0.3...0% -0.5...+0.5% -0.3...0% -0.1...+0.1%
The analysis indicates that the measured value is rather too small than too big.
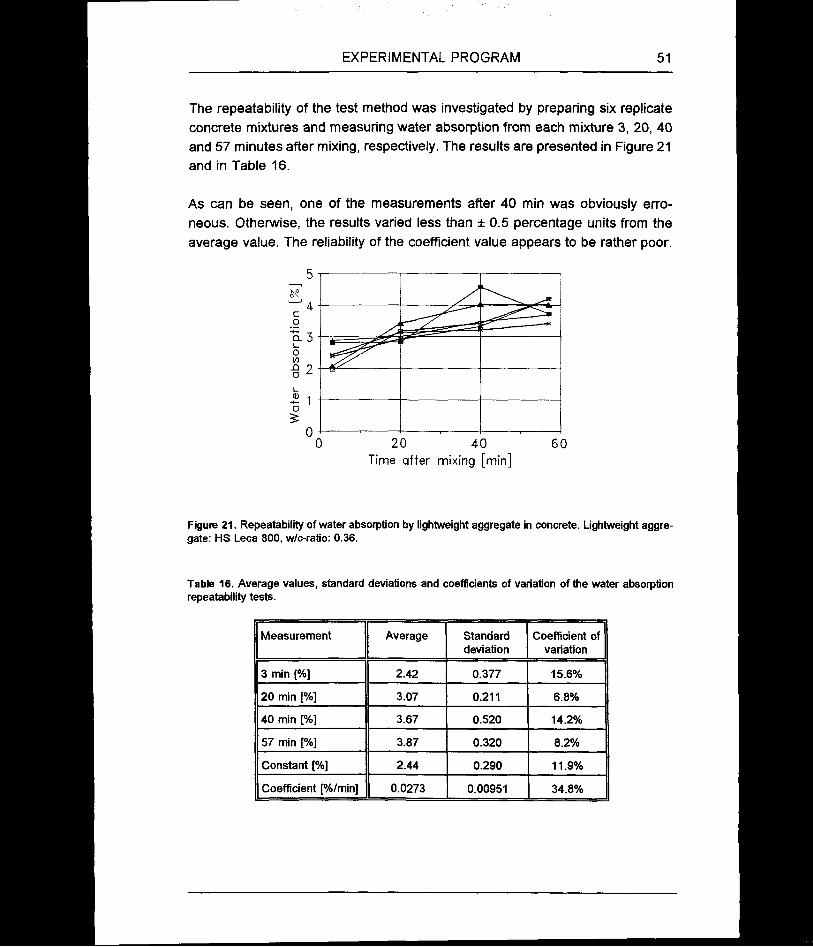
EXPERIMENTAL PROGRAM 51
The repeatability of the test method was investigated by preparing six replicate concrete mixtures and measuring water absorption from each mixture 3, 20, 40 and 57 minutes after mixing, respectively. The results are presented in Figure 21 and in Table 16.
As can be seen, one of the measurements after 40 min was obviously erroneous. Otherwise, the results varied less than ± 0.5 percentage units from the average value. The reliability of the coefficient value appears to be rather poor.
Time after mixing [min]
Figure 21. Repeatability of water absorption by lightweight aggregate in concrete. Lightweight aggregate: HS Leca 800, w/c-ratio: 0.36.
Table 16. Average values, standard deviations and coefficients of variation of the water absorption repeatability tests.
Measurement Average Standarddeviation
Coefficient of variation
3 min [%] 2.42 0.377 15.6%
20 min [%] 3.07 0.211 6.8%
40 min [%] 3.67 0.520 14.2%
57 min [%] 3.87 0.320 8.2%
Constant [%] 2.44 0.290 11.9%
Coefficient [%/min] 0.0273 0.00951 34.8%

52 EXPERIMENTAL PROGRAM
4.4.2 Fresh concrete properties
Of the fresh concrete properties, the main interest was focused on the slump loss. In some cases the change of workability was also studied by use of a concrete viscometer. The air content of the fresh concrete was measured using the volumetric method.
Slump loss
The slump measurements were carried out 1,15, 30, 45 and 60 min after mixing from all the three parallel test batches, respectively. The concrete was mixed for 20 seconds before and 10 seconds after each slump test and then put back into the mixer after each testing. The slump measurements were carried out after stable slump was obtained.
A characterization of the workability properties of high-strength lightweight aggregate concrete by use of the slump test is rather difficult. The slump is often the collapsed type, and the slump values may be out of the reliable range for the method. The slump results are commonly considered to be less reliable when the slump value is more than about 175 mm. In addition, the slump scale is not linear. When the slump loss of a high-strength lightweight aggregate concrete is measured, the slump type typically changes stepwise from a collapsed type to a shear type and finally to a true slump type. Changing from one slump type to another causes a relatively big change in the slump value, whereas within one slump type changes may be rather small.
The slump loss can be expressed as an absolute value (difference between the initial and final values or as the ratio between the final and initial values) or as the time at which the initial value is reduced by 50% (slump half-life by Perenchio et al. 1979). Two first two values give no information about the rate of slump loss. The final value can be achieved within 15 to 60 min, but e g. the difference at 60 min can be the same in all cases. Therefore, the slump half-live (t os) was selected for the present study. In some cases, the value was more than 60 min and was then extrapolated. The extrapolation was made by use of the last two data points or all the data points depending on which of them was giving the smaller slump half-live. An extrapolation obviously overestimates the slump half-live.

EXPERIMENTAL PROGRAM 53
The repeatability of the method was calculated by preparing six replicate concrete mixtures from which the slump loss was measured. The results are presented in Figure 22 and in Table 17.
E 150
Time after mixing [min]
Figure 22. Repeatability of slump measurements. Lightweight aggregate: HS Leca 800, w/c-ratio: 0.36.
Table 17. Average values, standard deviations and coefficients of variation of the slump repeatability tests.
Measurement Average Standarddeviation
Coefficient of variation
1 min [mm] 219 7.4 3.4%
15 min [mm] 195 5.5 2.8%
30 min [mm] 175 14.8 8.5%
45 min [mm] 146 25.0 17.1%
60 min [mm] 117 15.4 13.2%
Slump half-live [min] 63.7 14.0 22.0%
Absolute slump loss [mm] 102 20.9 20.4%
Proportional final slump [%] 53.4 8.3 15.5%
According to the repeatability tests, the reliability of the slump test was rather good during the first 15 min, but then, it became more and more poor. The characterization of the slump loss seems to have a rather poor reliability. In the present experimental program, the repeatability may even be worse than presented above, because the volume of the concrete batches varied. In spite of its

54 EXPERIMENTAL PROGRAM
obvious limitations, the slump test was used because it is very simple and commonly used. The slump loss results were analyzed by use of an analysis of variance, where the slump half-live was used as the response variable.
Viscometer tests
From different concrete mixtures, 6 were selected for viscometer tests. HS Leca 800 lightweight aggregate and Nenseth normal weight aggregate were used in dry condition. In addition, prewetted HS Leca 800 aggregate was also used (moisture condition 2). These tests were carried out with both types of cement paste. The viscometer measurements were carried out 2, 30 and 60 min after mixing. Concrete was mixed for 20 s before and 10 s after each viscometer test and put back into the mixer after each testing.
The measurements were carried out by use of a coaxial cylinders viscometer of type BML-Viscometer (Wallevik and Gjorv 1990). This viscometer, which is specially developed for testing of fresh concrete, is fully automatic and records the torque on the inner cylinder at different speeds of rotation of the outer cylinder. For the present experiments, each testing lasted 75 seconds. The outer cylinder started rotating progressing to a maximum velocity where the first torque reading was made. Subsequently, the outer cylinder speed was reduced in predetermined steps from 0.5 to 0.1 s"1. Each change of speed lasted two and a half seconds. At each speed, 25 torque measurements were made during five seconds, from which the average of the five lowest torque values was recorded. The apparatus is schematically shown in Figure 23.
In principle, the testing procedure is based on a Bingham behavior of the concrete with the following relationship (Tattersal 1991):
T = G + H • N (6)
where T G H N
is torque [Nm], is yield stress [Nm], is plastic viscosity [Nms] and is rotation velocity [s'1 ].
In rheology, yield stress and plastic viscosity are normally measured as parameters dependent of the instrument applied and expressed in torque units. Although these values can be transferred into proper yield stress and plastic viscosity terms by multiplying with certain viscometer dependent factors, torque units are used in the present work.
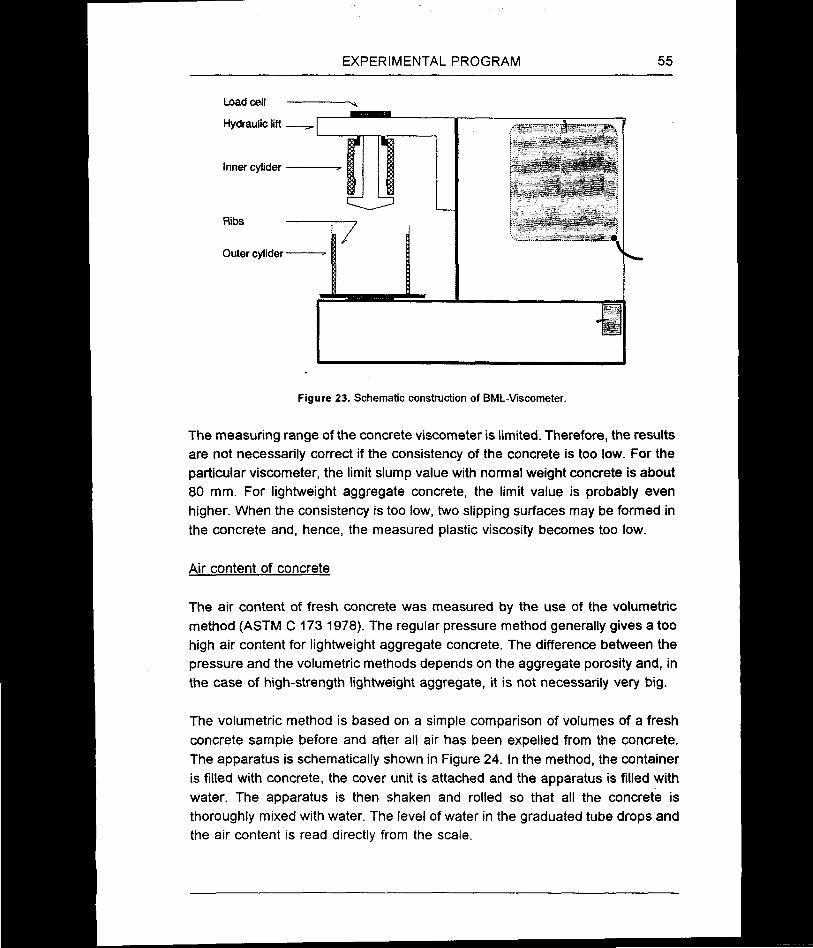
EXPERIMENTAL PROGRAM 55
Load cell
Hydraulic lift V' ' '
Inner cylider
Outer cylider
Figure 23. Schematic construction of BML-Viscometer.
The measuring range of the concrete viscometer is limited. Therefore, the results are not necessarily correct if the consistency of the concrete is too low. For the particular viscometer, the limit slump value with normal weight concrete is about 80 mm. For lightweight aggregate concrete, the limit value is probably even higher. When the consistency is too low, two slipping surfaces may be formed in the concrete and, hence, the measured plastic viscosity becomes too low.
Air content of concrete
The air content of fresh concrete was measured by the use of the volumetric method (ASTM C 173 1978). The regular pressure method generally gives a too high air content for lightweight aggregate concrete. The difference between the pressure and the volumetric methods depends on the aggregate porosity and, in the case of high-strength lightweight aggregate, it is not necessarily very big.
The volumetric method is based on a simple comparison of volumes of a fresh concrete sample before and after all air has been expelled from the concrete. The apparatus is schematically shown in Figure 24. In the method, the container is filled with concrete, the cover unit is attached and the apparatus is filled with water. The apparatus is then shaken and rolled so that all the concrete is thoroughly mixed with water. The level of water in the graduated tube drops and the air content is read directly from the scale.

56 EXPERIMENTAL PROGRAM
In the experimental program, the concrete volume used with the apparatus was about 2 dm3. Also, the fresh concrete density can be measured with the apparatus. However, because of the small concrete volume the results are not reliable enough.
N-Watertight Screw Cop
Graduated Neck Lined with Glow or Transparent Plastic
/ \ V|« Vg(Approti
TopSectionVol.«V2 Flanges with
Gasket and Clomps
MeoavringBowl
V0l.«V|
IH
L*-D*ltol^H—*
Figure 24. Apparatus for measuring air content of fresh concrete by volumetric method (ASTM C 173).
4.4.3 Compressive strength and density
Compressive strength was determined at the age of 1 and 28 days. The compressive strength at 1 day was determined from the cubes prepared 30 min after mixing (3 cubes). At the age of 28 days, both the specimens prepared 1 and 30 min after mixing were tested (3 cubes each). The cubes were tested in a position normal to the casting position.
The density of the concrete was determined by weighing the cubes prepared 30 min after mixing (6 cubes) both in air and in water immediately after demolding.
The compressive strength and density results were analyzed by use of an analysis of variance. Compressive strength as well as density measurements were carried out from two parallel test batches. In the analysis of variance, the following response variables were used:
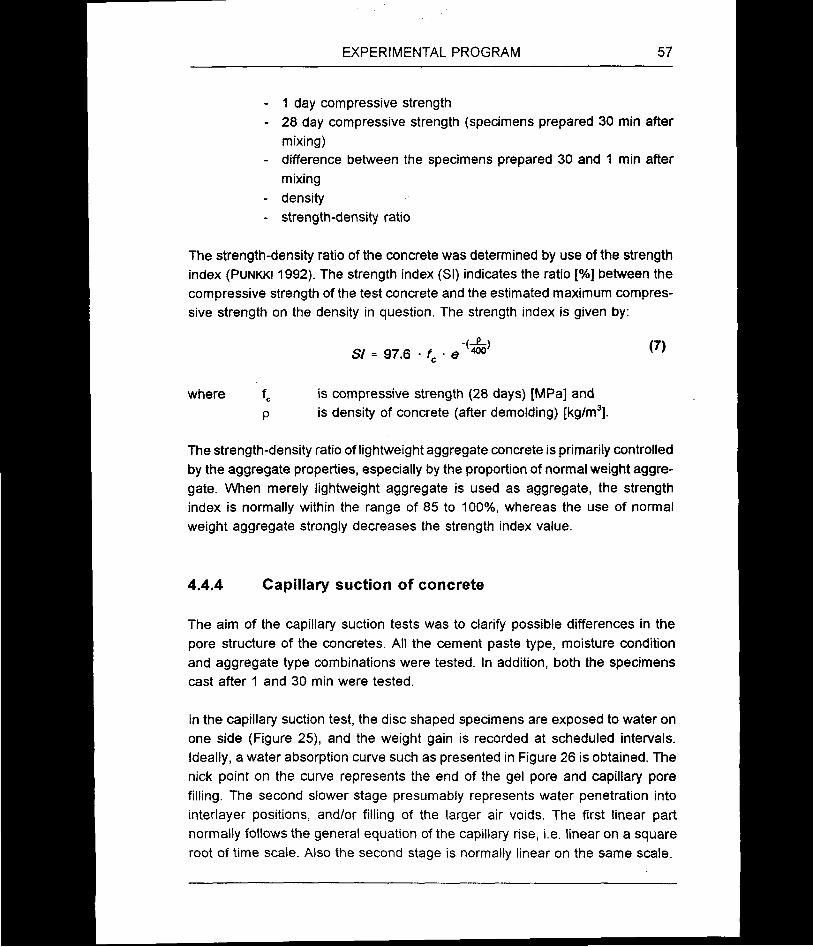
EXPERIMENTAL PROGRAM 57
- 1 day compressive strength- 28 day compressive strength (specimens prepared 30 min after
mixing)- difference between the specimens prepared 30 and 1 min after
mixing- density- strength-density ratio
The strength-density ratio of the concrete was determined by use of the strength index (Punkki 1992). The strength index (SI) indicates the ratio [%] between the compressive strength of the test concrete and the estimated maximum compressive strength on the density in question. The strength index is given by:
(7)S/ = 97.6 • fc • e
is compressive strength (28 days) [MPa] and is density of concrete (after demolding) [kg/m3].
where fc P
The strength-density ratio of lightweight aggregate concrete is primarily controlled by the aggregate properties, especially by the proportion of normal weight aggregate. When merely lightweight aggregate is used as aggregate, the strength index is normally within the range of 85 to 100%, whereas the use of normal weight aggregate strongly decreases the strength index value.
4.4.4 Capillary suction of concrete
The aim of the capillary suction tests was to clarify possible differences in the pore structure of the concretes. All the cement paste type, moisture condition and aggregate type combinations were tested. In addition, both the specimens cast after 1 and 30 min were tested.
In the capillary suction test, the disc shaped specimens are exposed to water on one side (Figure 25), and the weight gain is recorded at scheduled intervals. Ideally, a water absorption curve such as presented in Figure 26 is obtained. The nick point on the curve represents the end of the gel pore and capillary pore filling. The second slower stage presumably represents water penetration into interlayer positions, and/or filling of the larger air voids. The first linear part normally follows the general equation of the capillary rise, i.e. linear on a square root of time scale. Also the second stage is normally linear on the same scale.
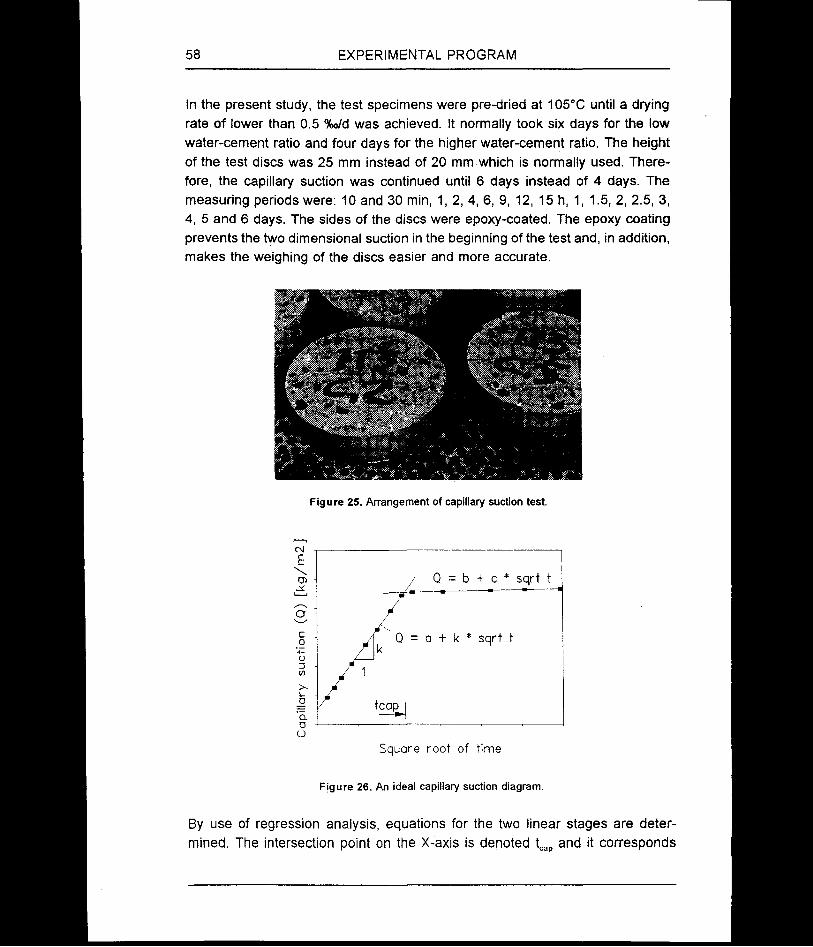
58 EXPERIMENTAL PROGRAM
In the present study, the test specimens were pre-dried at 105°C until a drying rate of lower than 0.5 %o/d was achieved. It normally took six days for the low water-cement ratio and four days for the higher water-cement ratio. The height of the test discs was 25 mm instead of 20 mm which is normally used. Therefore, the capillary suction was continued until 6 days instead of 4 days. The measuring periods were: 10 and 30 min, 1, 2, 4,6,9,12,15 h, 1, 1.5, 2, 2.5, 3, 4, 5 and 6 days. The sides of the discs were epoxy-coated. The epoxy coating prevents the two dimensional suction in the beginning of the test and, in addition, makes the weighing of the discs easier and more accurate.
Figure 25. Arrangement of capillary suction test.
Square root of time
Figure 26. An ideal capillary suction diagram.
By use of regression analysis, equations for the two linear stages are determined. The intersection point on the X-axis is denoted tcap and it corresponds

EXPERIMENTAL PROGRAM 59
with the time needed to fill all the gel and capillary pores. The capillary number, k, and the resistance number, m, are determined as follows:
(8)
(9)
where Q is sucted water content,t is time andh is height of test specimen.
In principle, both the capillary number and the resistance number give the same type of information. However, the capillary number also depends on the cement paste content. Therefore, the resistance number is generally considered better to reflect the concrete quality. In the case of lightweight aggregate concrete the situation is, however, different. Absorption by the lightweight aggregate cannot be totally avoided and, therefore, the absorbed water content is bigger than in the respective normal density concrete, especially at later ages. The resistance number is affected more by the aggregate absorption than the capillary number and, so, the quality of the pore structure of lightweight aggregate concrete can be best characterized by use of the capillary number.
As discussed earlier, Figure 26 shows an ideal capillary suction curve. In practice, the relationship is not perfectly linear up to the nick point. Fagerlund (1982) explained the "rounded" transition between the two linear parts by a model consisting of parallel capillary tubes with different radii. Later on, it has been noticed that the curved transition is the longer the lower the water-cement ratio is and, therefore, for some high-strength concretes, the original model does not fit very well. Also, the ideal model may not fit the case when the initial moisture content is higher than that corresponding to drying at 105°C. In some cases, a differential curve of the capillary suction may give additional information. In the differential curve, the rate of suction is presented as a function of time and is calculated by (Punkki and Sellevold 1994):
(10)
where k" is rate of suction [kg/m2 V"s].
60 EXPERIMENTAL PROGRAM
A point is plotted on the X-axis at the average value of Vts and Vti+1. In practice, the differential curve gives the momentary capillary number value as a function of square root of time.
After the capillary suction test, the specimens are submerged in water for three additional days. Finally, the test specimens are normally fully saturated by applying water pressure (5 to 10 MPa) over night. However, in the case of lightweight aggregate concrete, the pressure saturation is not meaningful. The test is ended by drying the discs at 105°C. The following weights are recorded:
W, weight of oven-dry specimen (105°C),W2 weight after capillary suction and water immersion and W3 weight after pressure saturation.
The volume of the test specimen (V) is determined by weighing the specimen in air and in water. The following porosities can then be calculated (Sellevold 1986):
(W3- W,)Z total y
(W2 - W,)esuc y
(W3 - W2)Rair y
(11)
(12)
(13)
where etotal is total porosity,esuc is suction porosity andealr is air porosity.
The air porosity represents the pore volume which is not filled up during capillary suction, and therefore, includes both air-entrained pores as well as larger air voids due to incomplete compaction. The water-cement ratio of a concrete can be estimated by use of the suction porosity. According to Powers equations, the water-cement ratio of concrete can be calculated by:
EXPERIMENTAL PROGRAM 61
wcr
0.172 • a + 0.317 • iss
1(14)
where wcr is water-cement ratio,esuc is suction porosity,Vpas is proportion of cement paste anda is degree of hydration.
In the case of lightweight aggregate concrete, the porosity results are not very interesting, because the suction porosity also contains a certain part of the pores of the lightweight aggregate. Smeplass (1995) reported that the difference between measured and theoretical suction porosity of lightweight concrete depends on the water-cement ratio; for low water-cement ratios the difference is about 3%. If a pressure saturation is made, the measured total porosity contains large pores in the cement paste but also most of the aggregate pores.
4.4.5 Mercury intrusion porosimetry
Mercury intrusion porosimeter of type Carlo Erba Strumentazione Porosimeter 2000 WS at Helsinki University of Technology, Concrete Technology was used for measuring the porosity of lightweight aggregate (only the coarsest fractions). The method gives information only about the surface pore size. The interior pore size cannot be estimated. The aggregate particles were first dried at 105°C and then kept in a desicator until time of testing. The number of particles tested depended on the type of aggregate. For HS Leca 800 and Liapor 8 it was three and for HLA ten. Two parallel tests were made. A contact angle of 141.3° and a surface tension of 0.48 N/m were used in the calculations. The measuring range of the equipment is from 4 nm to 300 pm.
4.4.6 Optical microscopy
Optical microscopy with thin sections were used in analyzing the microstructure of the concrete. In addition, the internal pore structure of lightweight aggregate was studied using the same thin sections.

62 EXPERIMENTAL PROGRAM
The specimens were more than three months old when the thin sections were prepared. The moisture condition 3 (Two-stage mixing) was not analyzed. Two thin sections were prepared from each test concrete.
The sample was first cut to a thickness of 8 to 10 mm and glued to a glass plate. The sample was then put in alcohol for overnight. The sample was dried with a hot-air blower and further in room temperature for one hour. The sample was then put in a vacuum chamber, vacuumed and impregnated with fluorescent epoxy at +37 to 38°C. The next day the sample was cleaned, ground, dried and glued to an optical glass. The sample was then cut near the optical glass and gradually ground to a thickness of 20 pm. Finally, the sample was covered with a cover slide.
4.4.7 Scanning electron microscopy
Scanning electron microscopy was used both to investigate the microstructure of the concrete as well as the microstructure of the lightweight aggregate.
Secondary electron imaging (SEI), the conventional mode of the scanning electron microscope, detects relatively weak electrons that have ionized from the specimen by the high energy beam. The detected electrons are those that are near the surface of the specimen (see Fig. 27). As a result, the topography of the surface of the specimen can be observed with a high resolution.
Back-scattered electron imaging (BSEI), also called primary electron imaging, is used to yield direct chemical contrast. It detects the beam electrons that are directly scattered back out the specimen and which depends on the elemental composition of the specimen. Comparatively, materials composed of lighter elements will appear darker in the microscope image and materials composed heavier elements will appear lighter.
Figure 27 shows the resolutions of different electrons in the scanning electron microscope. The emission depth for the back-scattered electrons, Xd, depends on the accelerating voltage and the elemental composition of the specimen. For example, for aluminum with 20 kV the depth is about 1.2 pm.
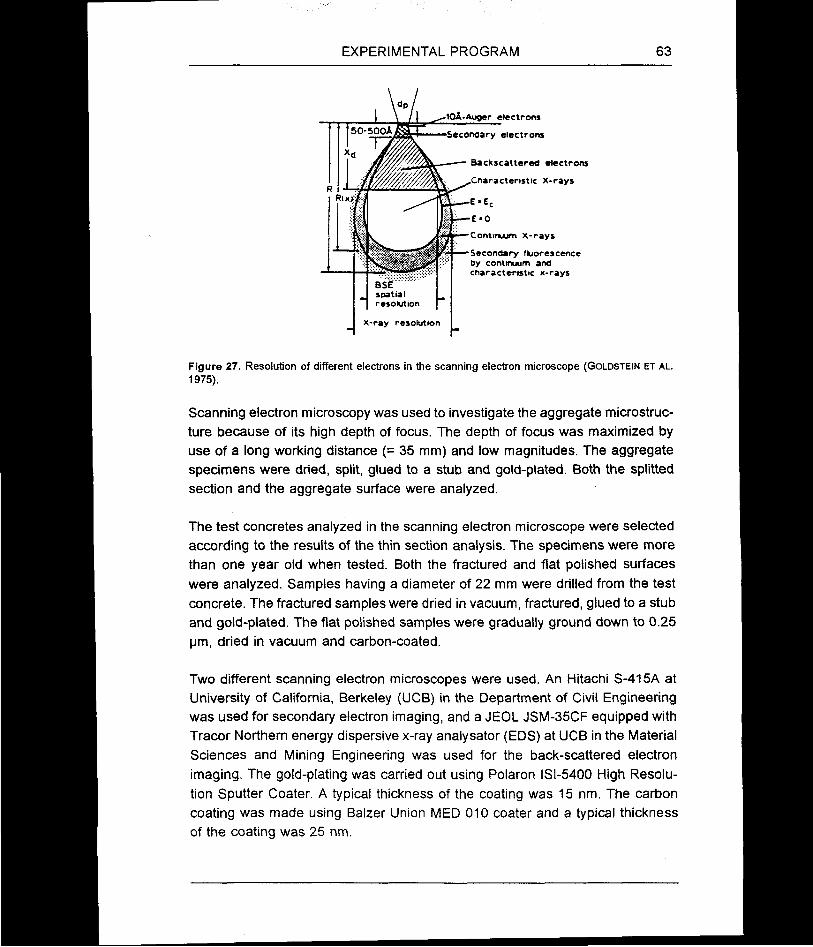
EXPERIMENTAL PROGRAM 63
■10A-Auger electrons
50-500A ■Secondary electrons
Backscattered electrons
.Characteristic X-rays
Continuum X-rays
Secondary fluorescence by continuum and characteristic x-rays
BSEspatialresolution
X-ray resolution
Figure 27. Resolution of different electrons in the scanning electron microscope (Goldstein et al. 1975).
Scanning electron microscopy was used to investigate the aggregate microstructure because of its high depth of focus. The depth of focus was maximized by use of a long working distance (= 35 mm) and low magnitudes. The aggregate specimens were dried, split, glued to a stub and gold-plated. Both the splitted section and the aggregate surface were analyzed.
The test concretes analyzed in the scanning electron microscope were selected according to the results of the thin section analysis. The specimens were more than one year old when tested. Both the fractured and flat polished surfaces were analyzed. Samples having a diameter of 22 mm were drilled from the test concrete. The fractured samples were dried in vacuum, fractured, glued to a stub and gold-plated. The flat polished samples were gradually ground down to 0.25 pm, dried in vacuum and carbon-coated.
Two different scanning electron microscopes were used. An Hitachi S-415A at University of California, Berkeley (UCB) in the Department of Civil Engineering was used for secondary electron imaging, and a JEOL JSM-35CF equipped with Tracor Northern energy dispersive x-ray analysator (EDS) at UCB in the Material Sciences and Mining Engineering was used for the back-scattered electron imaging. The gold-plating was carried out using Polaron ISI-5400 High Resolution Sputter Coater. A typical thickness of the coating was 15 nm. The carbon coating was made using Balzer Union MED 010 coater and a typical thickness of the coating was 25 nm.

64 EXPERIMENTAL PROGRAM
4.5 STATISTICAL ANALYSIS
4.5.1 Standard deviation
The standard deviation of the test results were calculated either based on Equation 15 or Equation 16 depending on the sample size. Equation 16 is not applicable when the sample size is small. For the small sample sizes, the reliability of the standard deviation is very low, and, therefore, the standard deviation can be more reliably calculated from Equation 15. In the present study, Equation 15 was used when the sample size was three or smaller.
S-£ (15)d2
where S is standard deviation,R is range of the test results andd2 is coefficient which depends on the sample size (n=3: d2 = 1.693).
, E <*/ - & (16)i n - 1
where n is sample size.
4.5.2 Analysis of variance
The effects of the cement paste type, moisture condition of aggregate and aggregate type on the water absorption, slump loss, compressive strength and density were studied by use of a factorial design and analyzed by use of an analysis of variance. The analysis of variance is a statistical method in which the total variation in a measured response is partitioned into components which can be attributed to recognizable sources of variation. For three factors, the model can be expressed as
Xqu = |i+«/+Py + Y* + (a'P),y + (a-Y)/k+(p-Y)y*+(a-p-Y)iifr+£'8y <17)
The model expresses symbolically the idea that each observation (Xljkl) can be partitioned into five components: an overall mean effect (p), effects due to the factors A, B and C (a,, P, and yk), effects due to interactions ((a • P)ijt (a • y)ik, (3 ■ y)jk and (a • p • y)ijk) and a random deviation due to unexplained sources (Eijk) (Milton and Arnold 1986). The model requires that the residuals (Eijk) are IIDN(0,

EXPERIMENTAL PROGRAM 65
a2), that is, independently and identically distributed according to a normal distribution with mean zero and unknown but fixed variance a2. The analysis is made by use of the sum of squares of the components. The sum of squares identity is given by
SS(0( = + SSg + SSq + SSyy + SSjyQ + SSgQ + S$abc + SS. (1®)
where ss* is measure of total variability in data,SS* is measure of variability in data attributable to the use of
different levels of factor A,SS*, is measure of variability in data due to interactions between
levels of factors A and B andSS. is measure of variability in data due to random or unexplained
sources.
The analysis of variance table is arranged as shown in Table 18. The factors A, B and C have a, b and c levels, respectively.
The probability value corresponding to the variance ratio can be read from readymade tables, for example presented by Milton and Arnold (1986, p. 596). A probability of 5% was considered as the limit value for significance. Thus, if the probability was smaller than 0.05, the source was considered as significant. In the present study, the statistical analyses were carried out by using Systat 5.04 for Windows statistical program.
The coefficient of determination can be calculated with the help of the sum of squares of model (SSmode,) and the total sum of squares. The sum of squares of model in the three factor case is given by:
SSmodel = S&A + &SB + SSC + SSAB + SSAC + SSgp + SSABC (19)
or generally
ss.model SStot - sse
The coefficient of determination is calculated by:
m0Cjeiss,tot
(20)
(21)

66 EXPERIMENTAL PROGRAM
Table 18. Analysis of variance table.
Source Degree of freedom
DF
Sum of squares
SS
Mean sum of squares MS (= SS, / DF)
Varianceratio
F
A a-1 SSA MSa MSA / MS.
B b-1 SSB msb MSB / MS,
C c-1 ssc MSC MSC / MS,
A * B (a-1)(b-1) ssAB msab MSab / MS,
A * C (a-1)(c-1) ssAC MSac MSac / MS,
B * C (b-1)(c-1) SS* MSqc MSqc / MS.
A* B * C (a-1)(b-1)(c-1) MSabc MSABC / MS.
Error abc(n-1) SS. MS. -
Total abcn-1 ss*. MS*, -
In order to eliminate effects of the unknown sources of variation, the run order of the tests should be randomized. When test replicates are used, the randomization of run order usually ensures that replicates are genuine. In the present study, it was not possible to do a perfect randomization, because of practical limitations. However, all the materials and the conditions were kept constant through the whole test period. In addition, repeatability tests were made in order to show up possible unknown sources of error.

5
TEST RESULTS AND DISCUSSION
5.1 CHARACTERISTICS OF LIGHTWEIGHT AGGREGATE
The pore structure of the lightweight aggregate was investigated in order to better understand the water absorption properties of the aggregate. Both the pore structure of the aggregate surface and the aggregate interior was analyzed.
It should be noted that the microstructure of the lightweight aggregate may vary from one particle to another. In addition, the area which can be analyzed in an optical and especially in a scanning electron microscope is very small. On the other hand, Bremner and Newman (1982) observed that the microstructure of different types of lightweight aggregate was quite similar although different raw materials and manufacturing processes were used. This was explained due to similar chemical compositions of the raw materials and similar temperature regimes which the aggregates had been subjected to during the manufacturing process.
5.1.1 Microstructure of aggregate surface
Overall photographs of all the aggregate types are presented in Figure 28. Figure 29 presents typical low magnitude scanning electron photomicrographs of the aggregate surfaces for the different types of lightweight aggregate. Figure 30 shows the surface in a larger magnitude. The surface porosity of lightweight aggregate was also analyzed by use of mercury intrusion porosimeter (MIR) and the results are presented in Figure 31. Here, it should be noted that the porosimeter results indicate only the size of the surface pores. The content of the
68 TEST RESULTS AND DISCUSSION
surface pores or any information about the interior porosity cannot be estimated with this method. In addition, the lightweight aggregate may contain some pores outside the measuring range of the porosimeter (4 nm to 300 pm).
Figure 28 shows that HS Leca 800 had more relatively big cracks and holes on the aggregate surface than the other aggregate types. The width of the cracks was typically ranging from 100 to 500 pm. The low magnitude photomicrographs (Figure 29) showed, in turn, that Liapor 8 contained some big pores having a diameter over 300 pm, whereas the surface pores of HS Leca 800 and HLA aggregates were normally smaller than 100 pm. In a larger magnification (Figure 30), pore sizes from 1 pm up to 100 pm could be observed on all the aggregate types. The surface structure of HS Leca 800 appeared to be more glassy than that of the other aggregate types.
The mercury intrusion porosimeter results indicated a clearly smaller size of surface pore for Liapor 8 compared with HS Leca 800. The average size of surface pores was about 0.15 pm (range: 0.1 to 0.4 pm) for Liapor 8 and about 2 pm (range: 0.6 to 6 pm) for HS Leca 800, respectively. The porosimeter results indicated a very small porosity for HLA aggregate (1.7% / 5.0%). In the second test, the pressure obviously broke part of the pore structure resulting in a higher content of fine pores. The maximum pressure of the porosimeter (2000 bar) was not enough for this type of aggregate.

TEST RESULTS AND DISCUSSION 69
c) HLA, 10-15 mm d) Nenseth, 4-8 mm
Figure 28. Overall photographs of aggregates. The aggregates are in natural scale.

70 TEST RESULTS AND DISCUSSION
c) HLA
Figure 29. Low magnitude scanning electron photomicrographs (SEI) of lightweight aggregatesurfaces. Original magnification: x 50, the picture width: 1.95 mm.
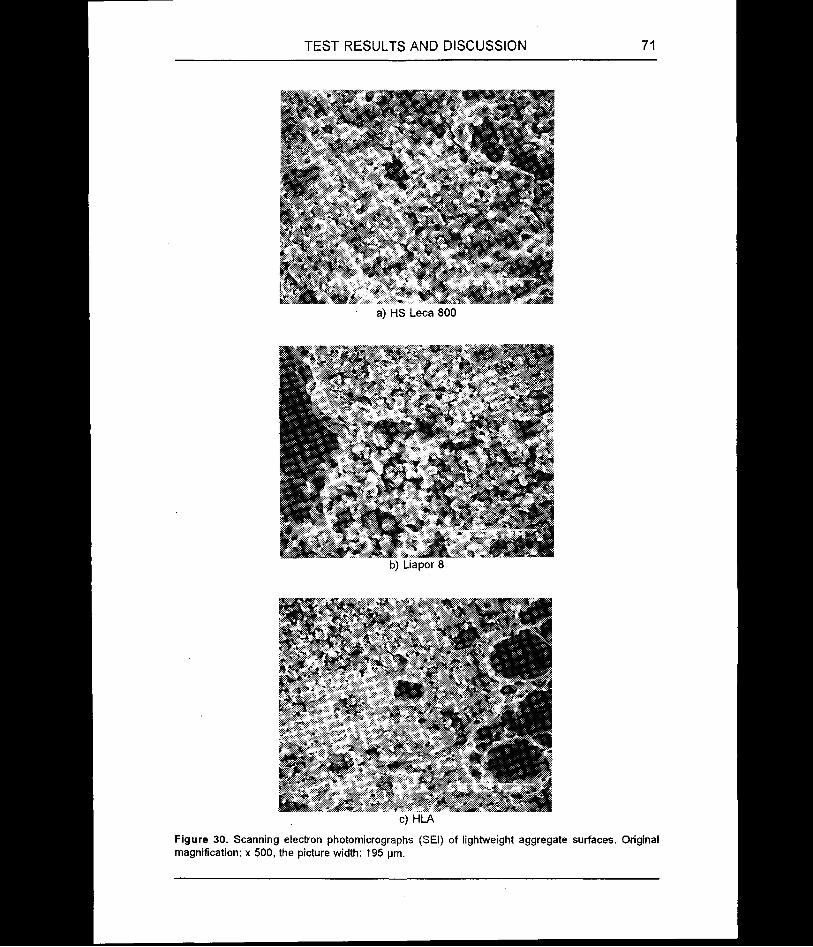
TEST RESULTS AND DISCUSSION 71
a) HS Leca 800
c) HLA
Figure 30. Scanning electron photomicrographs (SEI) of lightweight aggregate surfaces. Originalmagnification: x 500, the picture width: 195 pm.
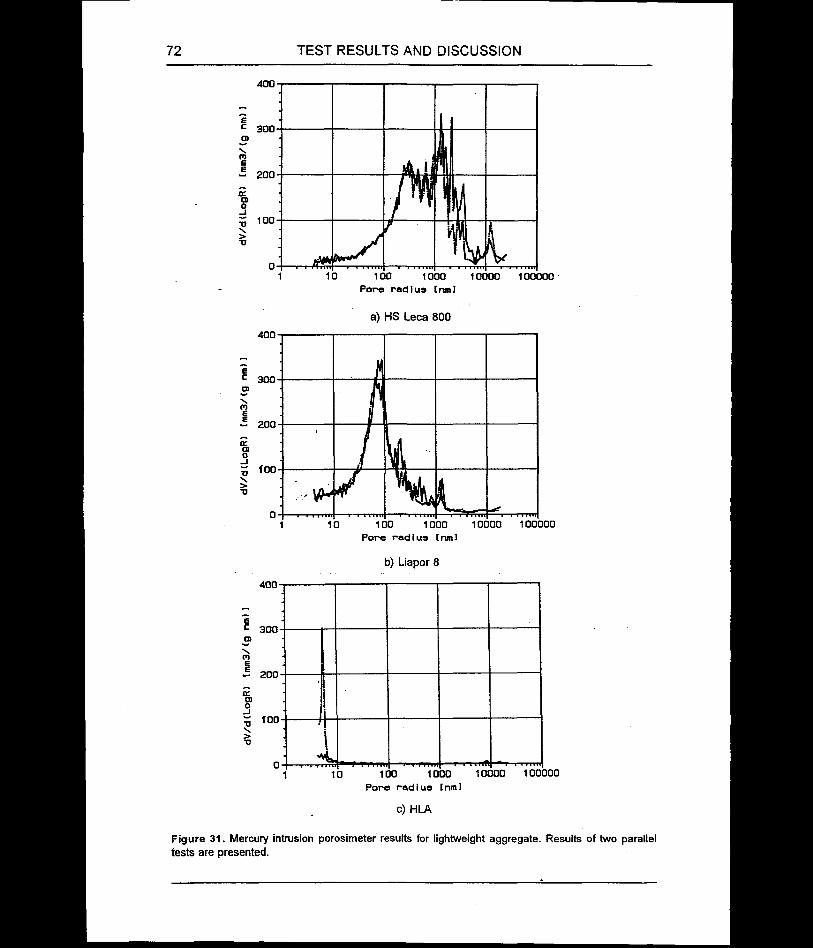
72 TEST RESULTS AND DISCUSSION
100 1000 Pore rad I us t nm]
10000 100000
a) HS Leca 800
10000 1000001000Pore radius t
b) Liapor 8
10000 1000001000Pore radius [nml
c) HLA
Figure 31. Mercury intrusion porosimeter results for lightweight aggregate. Results of two parallel tests are presented.

TEST RESULTS AND DISCUSSION 73
5.1.2 Internal microstructure
The internal pore structure of the aggregate was investigated by use of an optical microscope and a scanning electron microscope. Because of the vesicular structure of the lightweight aggregate, preparation of the thin sections may also have affected the microstructure to some extent. Therefore, the pore structure observed in the optical microscope may be coarser than in reality.
The photomicrographs of the thin sections for HS Leca 800 and Liapor 8 aggregates are shown in Figure 32. A clear surface layer can be seen in both aggregate types. The thickness of the layer was larger in the Liapor 8 aggregate than in the HS Leca 800 aggregate. However, the thickness of the layer varied greatly from one particle to another. Also, the scanning electron microscopy revealed a characteristic surface layer, although not so clearly as the optical microscopy. The porosity was lower in the vicinity of the surface. In the optical microscope, the surface layer can be easily distinguished because of its different color. The typical thickness of the layer was 50 pm for HS Leca 800 and 100 pm for Liapor 8, respectively.
The scanning electron microphotographs of the internal pore structure are shown in Figure 33. The pore structure greatly varies between the different types of aggregate. Liapor 8 aggregate had a finer pore structure than the two other aggregate types. HS Leca 800 and Liapor 8 had unhomogenous and continuous pore structure, whereas the pore structure of HLA aggregate was homogenous and closed.

74 TEST RESULTS AND DISCUSSION
b) Liapor 8
Figure 32. Microphotographs of the aggregate interior showing the aggregate surface layer. Original magnification: x 40, the picture width: 2.5 mm.

TEST RESULTS AND DISCUSSION 75
b) Liapor 8
Figure 33. Scanning electron photomicrographs (SEI) of lightweight aggregate interiors. Originalmagnification: x 200, the picture width: 485 pm.

76 TEST RESULTS AND DISCUSSION
5.1.3 Concluding remarks
A theoretical modelling of the water absorption by lightweight aggregate in concrete is very difficult. The water absorption is controlled by both the surface and internal porosity. Therefore, it is not possible to evaluate the water absorption properties only based on a microstructural analysis.
A comparison of the surface pore structures of HS Leca 800 and Liapor 8 aggregates revealed that HS Leca 800 had more relatively big cracks and holes (up to 500 pm), Liapor 8 had more pores in the area 100 to 300 pm, and the average surface pore size measured by mercury intrusion porosimeter was essentially smaller in the case of Liapor 8 aggregate (0.15 pm vs. 2 pm). HLA aggregate appeared to contain surface pores in the range from 1 to 100 pm, but the pores were closed and, therefore, the measured total porosity was very low.
Concerning the water absorption by lightweight aggregate in fresh concrete only the pores having a diameter smaller than the size of the cement particles in the fresh cement paste are important. Therefore, the pores bigger than about 10 pm probably do not play a very important role. These pores become filled up by cement paste and, thus, do not significantly affect the water absorption. According to the results, water is more slowly passing the surface layer of Liapor 8 aggregate than that of HS Leca 800 aggregate (smaller pore size and thicker surface layer). However, the time needed to pass the surface layer is very short, less than 1 s (see Figure 1). In practice, the air entrapment into the interior pores controls the rate of absorption. The surface porosity may also have an effect on the rate of absorption, e g. through the blocking effect.
Both HS Leca 800 and Liapor 8 had a very open internal pore structure, but HS Leca 800 had a less homogenous and coarser internal pore structure than Liapor 8. The interior pore size varied from 5 pm to 100 pm for HS Leca 800, from 5 pm to 40 pm for Liapor 8 and from 10 pm to 40 pm for HLA aggregate, respectively. The finer internal pore structure of Liapor 8 aggregate makes the absorption slower compared with HS Leca 800, because of the air entrapment effect. According to the mercury intrusion porosimeter results, the water absorption by HLA aggregate is negligible.
A fine interior porosity combined with a relatively thick surface layer also indicate good mechanical properties. Therefore, the results suggest that Liapor 8 has the best strength properties. HLA aggregate had a suprisingly coarse internal pore structure. However, the homegenous and closed pore structure probably gives
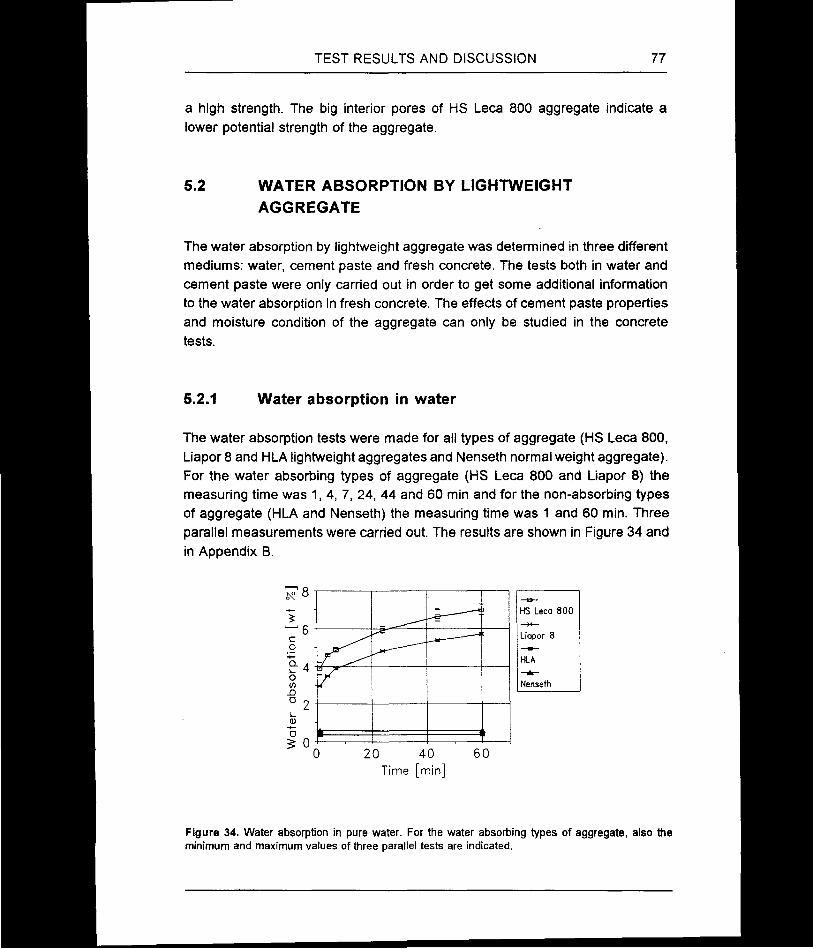
TEST RESULTS AND DISCUSSION 77
a high strength. The big interior pores of HS Leca 800 aggregate indicate a lower potential strength of the aggregate.
5.2 WATER ABSORPTION BY LIGHTWEIGHTAGGREGATE
The water absorption by lightweight aggregate was determined in three different mediums: water, cement paste and fresh concrete. The tests both in water and cement paste were only carried out in order to get some additional information to the water absorption in fresh concrete. The effects of cement paste properties and moisture condition of the aggregate can only be studied in the concrete tests.
5.2.1 Water absorption in water
The water absorption tests were made for all types of aggregate (HS Leca 800, Liapor 8 and HLA lightweight aggregates and Nenseth normal weight aggregate). For the water absorbing types of aggregate (HS Leca 800 and Liapor 8) the measuring time was 1, 4, 7, 24, 44 and 60 min and for the non-absorbing types of aggregate (HLA and Nenseth) the measuring time was 1 and 60 min. Three parallel measurements were carried out. The results are shown in Figure 34 and in Appendix B.
Time [min]
HS Leca 800
Liapor 8
HLA
Nenseth
Figure 34. Water absorption in pure water. For the water absorbing types of aggregate, also the minimum and maximum values of three parallel tests are indicated.
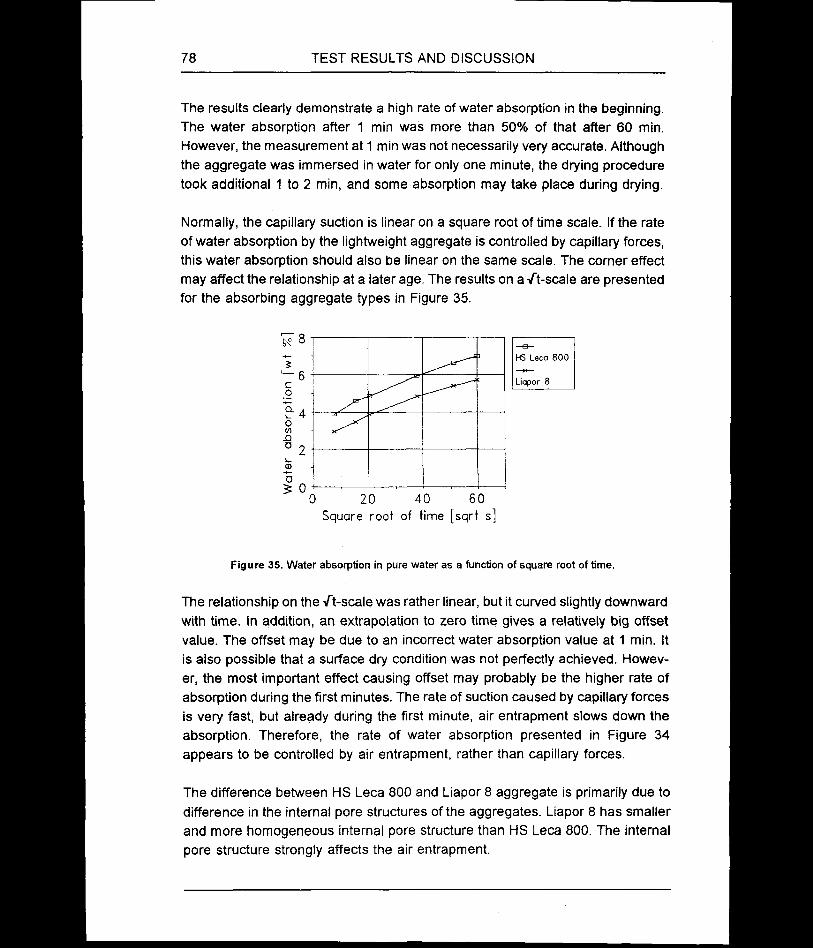
78 TEST RESULTS AND DISCUSSION
The results clearly demonstrate a high rate of water absorption in the beginning. The water absorption after 1 min was more than 50% of that after 60 min. However, the measurement at 1 min was not necessarily very accurate. Although the aggregate was immersed in water for only one minute, the drying procedure took additional 1 to 2 min, and some absorption may take place during drying.
Normally, the capillary suction is linear on a square root of time scale. If the rate of water absorption by the lightweight aggregate is controlled by capillary forces, this water absorption should also be linear on the same scale. The corner effect may affect the relationship at a later age. The results on a Vt-scale are presented for the absorbing aggregate types in Figure 35.
Square root of time [sqrt s
HS Leca 800
Liapor 8
Figure 35. Water absorption in pure water as a function of square root of time.
The relationship on the V"t-scale was rather linear, but it curved slightly downward with time. In addition, an extrapolation to zero time gives a relatively big offset value. The offset may be due to an incorrect water absorption value at 1 min. It is also possible that a surface dry condition was not perfectly achieved. However, the most important effect causing offset may probably be the higher rate of absorption during the first minutes. The rate of suction caused by capillary forces is very fast, but already during the first minute, air entrapment slows down the absorption. Therefore, the rate of water absorption presented in Figure 34 appears to be controlled by air entrapment, rather than capillary forces.
The difference between HS Leca 800 and Liapor 8 aggregate is primarily due to difference in the internal pore structures of the aggregates. Liapor 8 has smaller and more homogeneous internal pore structure than HS Leca 800. The internal pore structure strongly affects the air entrapment.

TEST RESULTS AND DISCUSSION 79
5.2.2 Water absorption in cement paste
All the four types of aggregate were tested in cement paste. The results are presented in Table 19.
Table 19. Water absorption by lightweight aggregate in cement paste. Results of six parallel tests are shown.
Aggregate type Water absorption [wt %]
Average Minimum Maximum Standarddeviation
Coefficient of variation
HS Leca 800 3.83 3.46 4.06 0.200 5.2%
Liapor 8 2.85 2.62 3.26 0.222 7.8%
HLA -0.02 -0.07 0.02 0.033 165.0%
Nenseth 0.24 0.09 0.37 0.109 45.4%
The water absorption in cement paste was only measured at one time (after 5 minutes) and only one water-cement ratio was used. Therefore, the results cannot give very much information. However, the results are comparable with the results from pure water. Theoretically, the paste tests should give very accurate results - more accurate than the tests in water or in fresh concrete. A subjective judging of the surface dry condition, which is the problem in the water test, is not needed in the paste test. In the concrete procedure, the weight of the dry aggregate is not known and, therefore, the results are not so accurate as in the paste procedure.
The foamed lightweight aggregate, HLA, gave a smaller water absorption than the normal weight aggregate. The small negative value was obviously caused by an incorrect initial moisture and/or non-evaporable water content used in the calculations. In practice, the test results demonstrate that this type of aggregate does not absorb water. Therefore, the aggregate is not further used in the concrete tests. The water absorption of the normal weight aggregate was relatively high. However, as presented in Table 9, the normal weight aggregate contains some rock types which may absorb water to some extent, e g. volcanic rock type and metasandstone.

80 TEST RESULTS AND DISCUSSION
5.2.3 Water absorption in fresh concrete
Water absorption in fresh concrete was determined for both HS Leca 800 and Liapor 8 and for Nenseth normal weight aggregate. The measurements were made from three parallel batches.
The dried cement paste content on the aggregate surface which was needed in the calculations, was determined in the cement paste. The results are shown in Table 20.
Table 20. Dried cement paste content on the aggregate surface. Results of six parallel tests are shown.
Aggregate type Dried cement paste content [wt %]
Average Minimum Maximum Standarddeviation
Coefficient of variation
HS Leca 800 2.46 2.04 2.66 0.252 10.2%
Liapor 8 0.95 0.68 1.23 0.177 18.6%
Nenseth 0.49 0.41 0.64 0.093 19.0%
The dried cement paste content observed was in accordance with the apparence of the aggregate on the natural scale. HS Leca 800 aggregate had more cracks and voids on the aggregate surface than the other types of aggregate. When a comparison of the values are made, different particle densities of the aggregate also have to be taken into consideration. The dried cement paste content expressed as volume percent for HS Leca 800, Liapor 8 and Nenseth aggregates were 3.57%, 1.34% and 1.30%, respectively.
The water absorption results were analyzed by use of a regression analysis, which gives a constant value and a coefficient (Figure 19). The time dependence was assumed to be linear. The regression analysis was made for each individual test as well as for all three parallel tests together. The average constant and coefficient values for each combination are presented in Table 21. The average water absorption curves for different moisture conditions of the aggregate are shown in Figure 36 and the more detailed results in Appendix C.
The tests in pure water suggest that air entrapment makes the rate of absorption slower already during the first minutes. Also the concrete tests showed that the rate of absorption quickly slows down - already during mixing. When a dry lightweight aggregate was used, the water absorption during mixing (4 min

TEST RESULTS AND DISCUSSION 81
mixing time) varied from 2.02 to 2.73%, which corresponds to the average absorption rate of 0.505 to 0.683 %/min. The absorption is probably not linear through the whole mixing and, therefore, the maximum rate was probably even higher. After mixing, the rate was between 0.0205 and 0.0531 %/min, i.e. less than 10% of the value during mixing. The linear time scale may have affected the ratio to some extent.
Table 21. Regression analysis results of the water absorption tests. Results are the average of three parallel tests.
Cementpaste
Moisturecondition
Aggregatetype
Constant[%]
Coefficient[%/min]
R2
1 1 1 2.02 0.0391 0.796
1 1 2 2.36 0.0205 0.651
1 1 4 0.23 0.0010 0.015
1 2 1 -0.44 -0.0140 0.449
1 2 2 -1.62 0.0105 0.101
1 3 1 0.89 0.0358 0.828
1 3 2 2.14 0.0117 0.467
2 1 1 2.73 0.0531 0.867
2 1 2 2.56 0.0287 0.749
2 1 4 0.12 0.0052 0.297
2 2 1 -1.18 0.0024 0.013
2 2 2 -0.87 -0.0031 0.007
2 3 1 2.24 0.0338 0.713
2 3 2 2.26 0.0253 0.746
Codes for the cement paste, the moisture condition and the aggregate type: see Chapter 4.1.
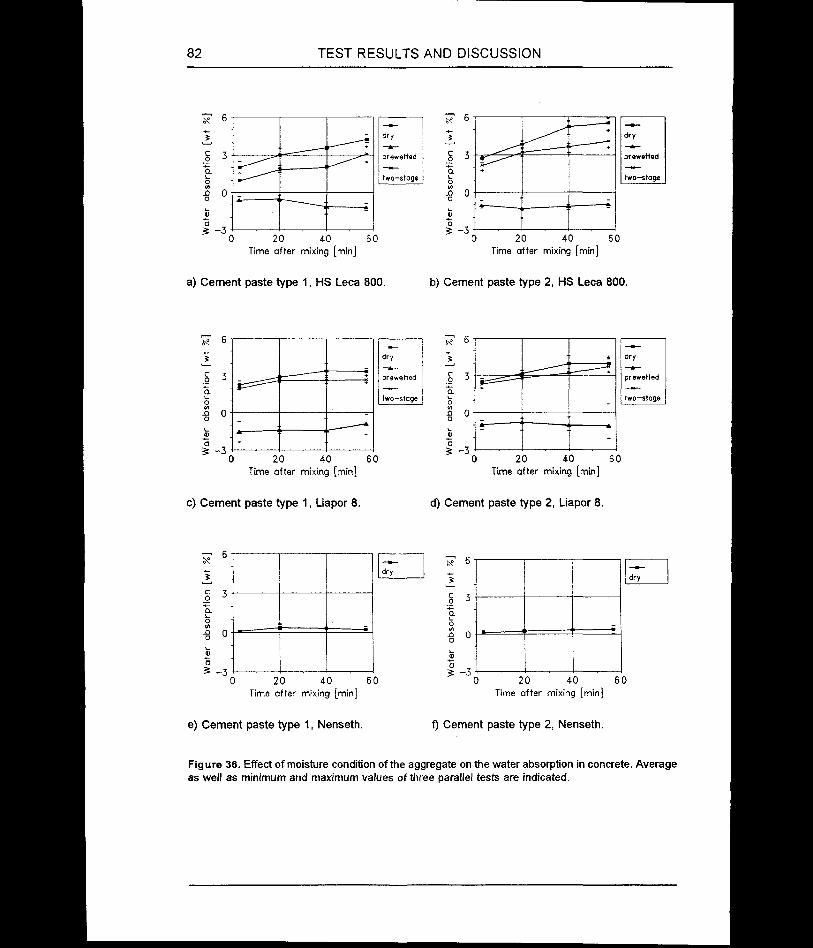
82 TEST RESULTS AND DISCUSSION
1
o$Vo5
a) Cement paste type 1, HS Leca 800. b) Cement paste type 2, HS Leca 800.
1,0Q.
£ -3
dry
prewetted
two-stoge
0 20 40 60Time after mixing [min]
1oo.
*I -3
dry
prewetted
two-stoge
0 20 40 60Time after mixing [min]
c) Cement paste type 1, Liapor 8. d) Cement paste type 2, Liapor 8.
Time after mixing [min] Time after mixing [min]
e) Cement paste type 1, Nenseth. f) Cement paste type 2, Nenseth.
Figure 36. Effect of moisture condition of the aggregate on the water absorption in concrete. Average as well as minimum and maximum values of three parallel tests are indicated.

TEST RESULTS AND DISCUSSION 83
Figure 37 shows the ratio of water absorption in concrete to that in pure water as a function of time for HS Leca 800 and Liapor 8 aggregates. Only the moisture conditions 1 and 2 are included.
a) HS Leca 800 b) Liapor 8
Figure 37. Ratio of water absorption in fresh concrete to that in pure water as a function of time. The time is after mixing in concrete. Codes: see Chapter 4.1.
In the case of HS Leca 800, the water absorption ratio depended on the cement paste type and the moisture condition. Also, the ratio increased with time. For Liapor 8 aggregate, the cement paste type and the moisture condition did not have so big effect, and the ratio was practically constant (« 0.6). The ratios are very different compared with those presented by Smeplass et al. (1995) as shown in Figure 9.
The analysis of variance for the constant value is shown in Table 22 and for the coefficient value in Table 23.
Table 22. Analysis of variance for the constant value of the water absorption. Normal density concretes are not included. Rz = 0.978.
Source DF SS F P Significancy
Cement paste (A) 1 1.464 17.87 0.0003 significant
Moisture condition (B) 2 82.39 502.68 0.0000 significant
Aggregate type (C) 1 0.007840 0.96 0.3378 insignificant
A* B 2 0.8065 4.92 0.0162 significant
A* C 1 0.001778 0.22 0.6456 insigfinicant
B * C 2 1.728 10.54 0.0005 significant
A * B * C 2 2.956 18.04 0.0000 significant
Error 24 1.967 - - -
Total 35 91.41 - - -
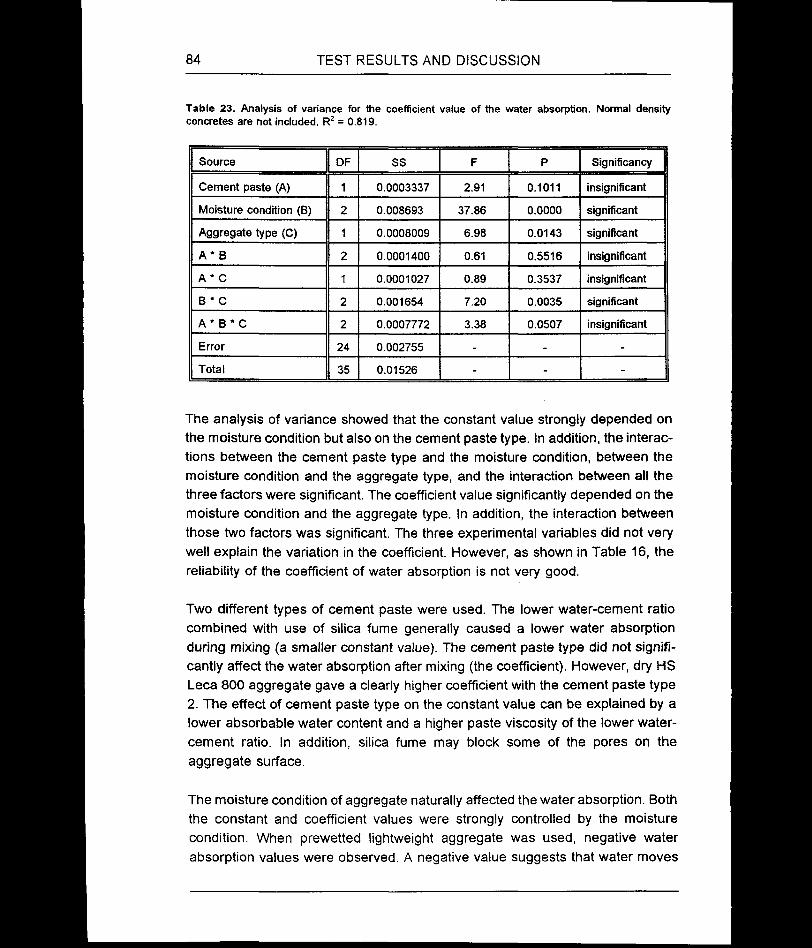
84 TEST RESULTS AND DISCUSSION
Table 23. Analysis of variance for the coefficient value of the water absorption. Normal density concretes are not included. R2 = 0.819.
Source DF SS F P Significance
Cement paste (A) 1 0.0003337 2.91 0.1011 insignificant
Moisture condition (B) 2 0.008693 37.86 0.0000 significant
Aggregate type (C) 1 0.0008009 6.98 0.0143 significant
A* B 2 0.0001400 0.61 0.5516 insignificant
A* C 1 0.0001027 0.89 0.3537 insignificant
B * C 2 0.001654 7.20 0.0035 significant
A* B * C 2 0.0007772 3.38 0.0507 insignificant
Error 24 0.002755 - - -
Total 35 0.01526 - - -
The analysis of variance showed that the constant value strongly depended on the moisture condition but also on the cement paste type. In addition, the interactions between the cement paste type and the moisture condition, between the moisture condition and the aggregate type, and the interaction between all the three factors were significant. The coefficient value significantly depended on the moisture condition and the aggregate type. In addition, the interaction between those two factors was significant. The three experimental variables did not very well explain the variation in the coefficient. However, as shown in Table 16, the reliability of the coefficient of water absorption is not very good.
Two different types of cement paste were used. The lower water-cement ratio combined with use of silica fume generally caused a lower water absorption during mixing (a smaller constant value). The cement paste type did not significantly affect the water absorption after mixing (the coefficient). However, dry HS Leca 800 aggregate gave a clearly higher coefficient with the cement paste type 2. The effect of cement paste type on the constant value can be explained by a lower absorbable water content and a higher paste viscosity of the lower water- cement ratio. In addition, silica fume may block some of the pores on the aggregate surface.
The moisture condition of aggregate naturally affected the water absorption. Both the constant and coefficient values were strongly controlled by the moisture condition. When prewetted lightweight aggregate was used, negative water absorption values were observed. A negative value suggests that water moves

TEST RESULTS AND DISCUSSION 85
from the aggregate to the cement paste during mixing. According to the capillary theory, water cannot move from the prewetted aggregate to the fresh cement paste. Both components have very high humidity and, therefore, the driving force is missing. However as discussed earlier, the difference in ion concrentration difference between the pore water in the aggregate and in the cement paste may give a moisture movement. According to the analysis presented in Chapter 4.4.1, the measured water absorption value in fresh concrete is rather too small than too big. in the case of prewetted aggregate, the water absorption in fresh concrete was calculated by comparing the measured water absorption value in fresh concrete after mixing to the moisture content of the prewetted aggregate prior to mixing. These two different methods may give slightly different results. The method obviously slightly underestimates the water absorption in the case of the prewetted lightweight aggregate (gives too small negative value) Therefore, only very little water probably moves out of the prewetted aggregate to the cement paste during mixing. After mixing, the prewetted lightweight aggregate neither absorbed nor desorbed water. The difference of the water absorption between the dry aggregate and the two-stage mixing was small. It was slightly bigger for HS Leca 800 than for Liapor 8.
Both the tests in pure water and in cement paste gave a clearly higher shortterm water absorption for HS Leca 800 than for Liapor 8 aggregate. In the fresh concrete, however, the constant value was not significantly affected by the aggregate type. The coefficient was bigger in the case of HS Leca 800. Also, the water absorption ratios were different between HS Leca 800 and Liapor 8 aggregates. Microstructure studies of the lightweight aggregate (Chap. 5.1) showed that Liapor 8 had a finer internal pore structure. Therefore, it is likely that the air entrapment controls more of the absorption in the case of Liapor 8, and that the absorption is more time-dependent. HS Leca 800 aggregate appears to be more sensitive to the medium than Liapor 8 aggregate. This is due to different surface pore structures. The short-term absorption of HS Leca 800 strongly depends on the cement paste properties, but at later ages the air entrapment is a more important factor controlling the rate of absorption.
The mix design was made so that only the water absorption which took place during mixing was taken into account. As a result, the effective final water- cement ratio varied depending on the water absorption after mixing. The exact final water-cement ratio cannot be known, but the effective water-cement ratio at 60 min after mixing was calculated from the water absorption results. The results are presented in Table 24 and Figure 38.

86 TEST RESULTS AND DISCUSSION
Table 24. Effective water content and water-cement ratio immediately after mixing and 60 min after mixing calculated from the water absorption results. Codes: see Chapter 4.1.
Cementpaste
Moisturecondition
Aggregatetype
Effectivcontent
s water dnf/m3]
Effective water- cement ratio
Aftermixing
After60 min
Aftermixing
After60 min
1 1 1 147 134 0.359 0.324
1 1 2 144 137 0.352 0.333
1 1 4 141 141 0.344 0.344
1 2 1 140 144 0.341 0.352
1 2 2 143 140 0.351 0.342
1 3 1 144 133 0.352 0.322
1 3 2 140 137 0.342 0.334
2 1 1 166 151 0.422 0.377
2 1 2 166 157 0.423 0.396
2 1 4 164 162 0.417 0.411
2 2 1 164 164 0.418 0.417
2 2 2 164 165 0.417 0.420
2 3 1 166 156 0.422 0.392
2 3 2 169 161 0.430 0.406
232 231 222 221 214 212 21 1 132 131 122 121 11 4 112 1 1 1
V//////////MZ77, '//////&7X
After mixing
60 min offer mixing
0.3 0.35 0.4 0.45Effective water-cement ratio
Figure 38. Effective water-cement ratios immediately after mixing and 60 min after mixing calculated from the water absorption results.

TEST RESULTS AND DISCUSSION 87
5.2.4 Concluding remarks
Normally, the water absorption by lightweight aggregate is measured in water. However, the situation in pure water and in fresh concrete is rather different. In addition to the aggregate properties, the water absorption in fresh concrete depended also on the cement paste properties and the mixing procedure of concrete. The ratio of water absorption in fresh concrete to that in water also varied from one type of aggregate to another. Therefore, the water absorption value determined in pure water cannot be satisfactorily used to describe the real water absorption in fresh concrete.
Concerning the workability loss of fresh concrete, the water absorption characteristics of Liapor 8 aggregate indicated a better performance than that of HS Leca 800 aggregate. The water absorption during mixing was on the same level, but HS Leca 800 absorbed more water after mixing. A higher water absorption after mixing probably gives a higher workability loss. On the other hand, the higher water absorption after mixing may produce a better transition zone between the aggregate and the cement paste. Therefore, HS Leca 800 aggregate may give a better transition zone in the hardened concrete.
5.3 WORKABILITY LOSS OF CONCRETE
The workability loss of concrete was studied primarily by use of the slump test, but some additional tests were made with the concrete viscometer.
5.3.1 Slump loss
The slump loss was measured from three parallel test batches. The average results are presented in Table 25, and the individual results are shown in Appendix D. The slump half-lives, the absolute slump losses and the proportional final slump values are presented. The results were analyzed by using the slump half- lives. The average slump losses are shown in Figure 39.
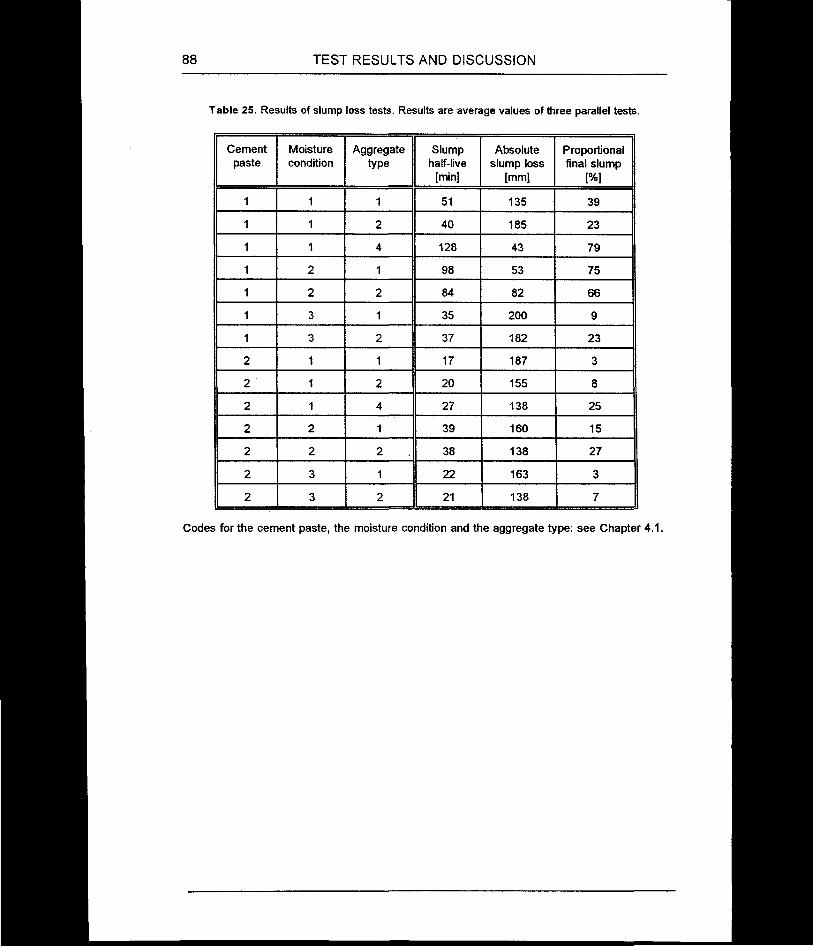
88 TEST RESULTS AND DISCUSSION
Table 25. Results of slump loss tests. Results are average values of three parallel tests.
Cementpaste
Moisturecondition
Aggregatetype
Slumphalf-live
[min]
Absolute slump loss
[mm]
Proportional final slump
[%]
1 1 1 51 135 39
1 1 2 40 185 23
1 1 4 128 43 79
1 2 1 98 53 75
1 2 2 84 82 66
1 3 1 35 200 9
1 3 2 37 182 23
2 1 1 17 187 3
2 1 2 20 155 8
2 1 4 27 138 25
2 2 1 39 160 15
2 2 2 38 138 27
2 3 1 22 163 3
2 3 2 21 138 7
Codes for the cement paste, the moisture condition and the aggregate type: see Chapter 4.1.
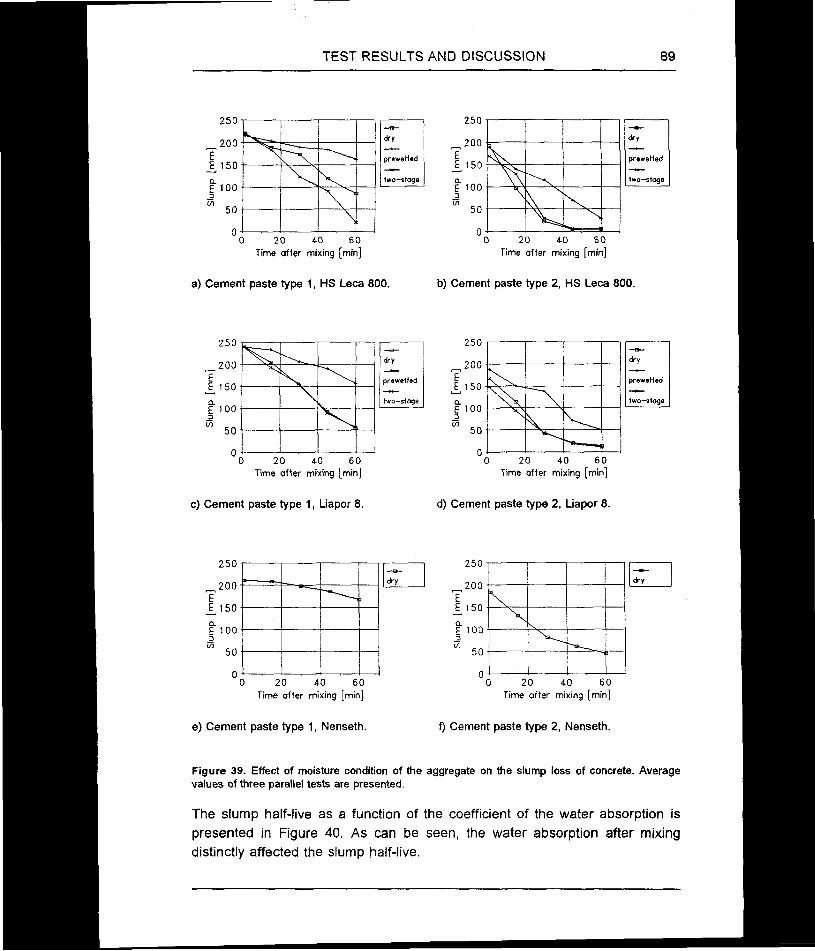
TEST RESULTS AND DISCUSSION 89
a) Cement paste type 1, HS Leca 800. b) Cement paste type 2, HS Leca 800.
E 150
two-stogeE 100
Time after mixing [min]
E 150
E 100
Time after mixing [min
dry
prewetted
two-stoge
c) Cement paste type 1, Liapor 8. d) Cement paste type 2, Liapor 8.
Time after mixing [min]
E 150
E 100
Time after mixing [min
e) Cement paste type 1, Nenseth. 0 Cement paste type 2, Nenseth.
Figure 39. Effect of moisture condition of the aggregate on the slump loss of concrete. Average values of three parallel tests are presented.
The slump half-live as a function of the coefficient of the water absorption is presented in Figure 40. As can be seen, the water absorption after mixing distinctly affected the slump half-live.

90 TEST RESULTS AND DISCUSSION
R squired = 0.45
R squared =A0.46
o-------- -------------------------------------0.04-0.02 0 0.02 0.04 0.06
Coefficient [%/min]
Figure 40. Relationship between slump half-live and coefficient of water absorption. Also the linear regression lines for the cement paste type 1 and the cement paste type 2 are presented.
The effects of the experimental variables were analyzed by use of the analysis of variance. The results for the slump half-live are presented in Table 26.
Table 26. Analysis of variance for the slump half-live. Normal density concretes are not included. R2 = 0.921.
Source DF SS F P Significancy
Cement paste (A) 1 8930.2 116.14 0.0000 significant
Moisture condition (B) 2 9760.9 63.47 0.0000 significant
Aggregate type (C) 1 117.36 1.53 0.2286 insignificant
A* B 2 2188.7 14.23 0.0001 significant
A * C 1 148.03 1.93 0.1780 insigfinicant
B * C 2 96.222 0.63 0.5434 insignificant
A* B * C 2 139.56 0.91 0.4169 insignificant
Error 24 1845.3 - - -
Total 35 23226 - - -
As discussed earlier, the accuracy of the slump test is not very good for this type of concrete. The variation in the slump results was relative high. In addition, the analysis was made using the slump half-lives which had to be extrapolated in some cases. However, the effects of the experimental variables on the slump loss were very clear and, thus, can be satisfactorily analyzed. It should be noted that the workability loss of fresh concrete is also controlled by the
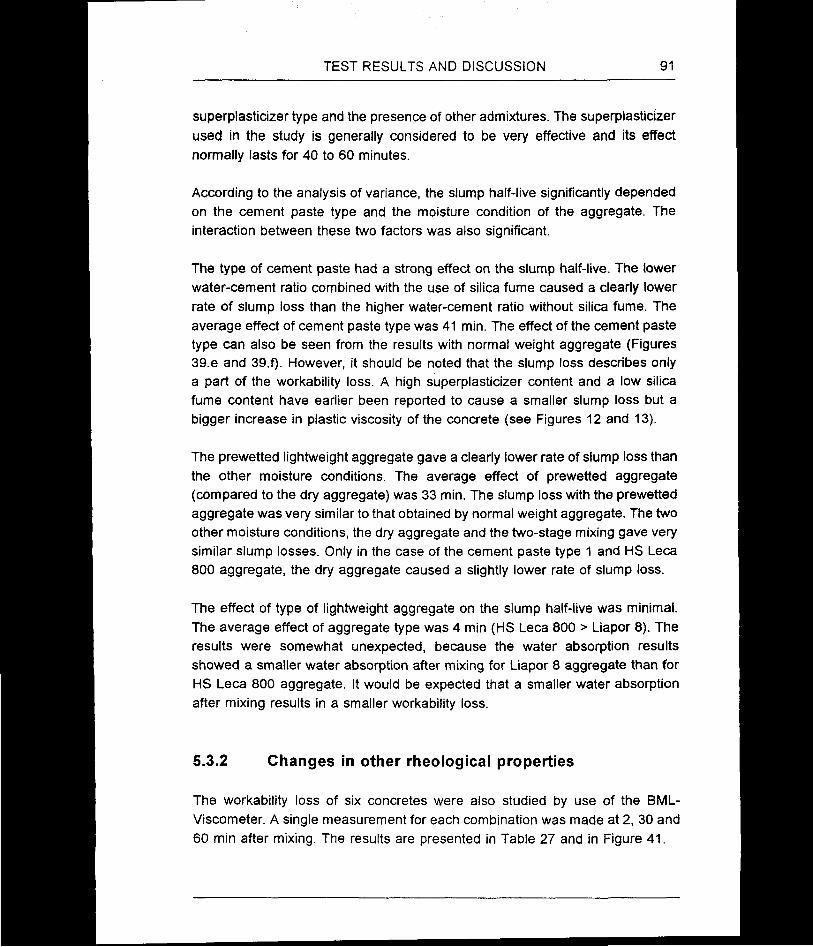
TEST RESULTS AND DISCUSSION 91
superplasticizer type and the presence of other admixtures. The superplasticizer used in the study is generally considered to be very effective and its effect normally lasts for 40 to 60 minutes.
According to the analysis of variance, the slump half-live significantly depended on the cement paste type and the moisture condition of the aggregate. The interaction between these two factors was also significant.
The type of cement paste had a strong effect on the slump half-live. The lower water-cement ratio combined with the use of silica fume caused a clearly lower rate of slump loss than the higher water-cement ratio without silica fume. The average effect of cement paste type was 41 min. The effect of the cement paste type can also be seen from the results with normal weight aggregate (Figures 39.e and 39.f). However, it should be noted that the slump loss descnbes only a part of the workability loss. A high superplasticizer content and a low silica fume content have earlier been reported to cause a smaller slump loss but a bigger increase in plastic viscosity of the concrete (see Figures 12 and 13).
The prewetted lightweight aggregate gave a clearly lower rate of slump loss than the other moisture conditions. The average effect of prewetted aggregate (compared to the dry aggregate) was 33 min. The slump loss with the prewetted aggregate was very similar to that obtained by normal weight aggregate. The two other moisture conditions, the dry aggregate and the two-stage mixing gave very similar slump losses. Only in the case of the cement paste type 1 and HS Leca 800 aggregate, the dry aggregate caused a slightly lower rate of slump loss.
The effect of type of lightweight aggregate on the slump half-live was minimal. The average effect of aggregate type was 4 min (HS Leca 800 > Liapor 8). The results were somewhat unexpected, because the water absorption results showed a smaller water absorption after mixing for Liapor 8 aggregate than for HS Leca 800 aggregate. It would be expected that a smaller water absorption after mixing results in a smaller workability loss.
5.3.2 Changes in other rheological properties
The workability loss of six concretes were also studied by use of the BML- Viscometer. A single measurement for each combination was made at 2, 30 and 60 min after mixing. The results are presented in Table 27 and in Figure 41.
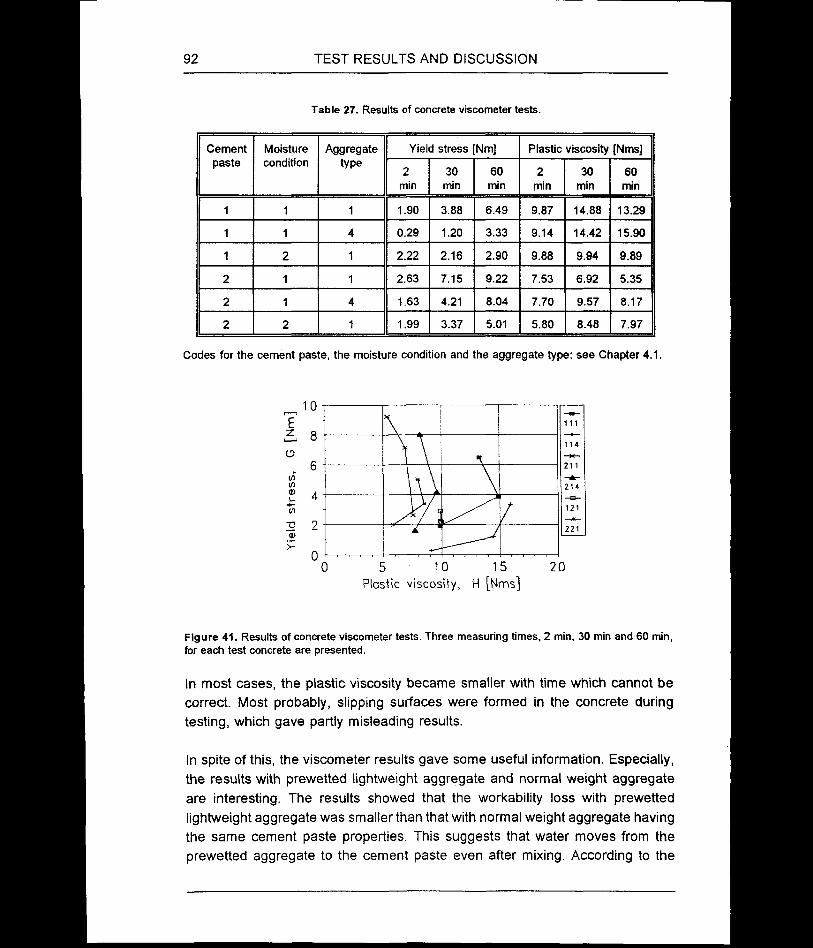
92 TEST RESULTS AND DISCUSSION
Table 27. Results of concrete viscometer tests.
Cementpaste
Moisturecondition
Aggregatetype
Yield stress Nm] Plastic viscosity [Nms]
2min
30min
60min
2min
30min
60min
1 1 1 1.90 3.88 6.49 9.87 14.88 13.29
1 1 4 0.29 1.20 3.33 9.14 14.42 15.90
1 2 1 2.22 2.16 2.90 9.88 9.94 9.89
2 1 1 2.63 7.15 9.22 7.53 6.92 5.35
2 1 4 1.63 4.21 8.04 7.70 9.57 8.17
2 2 1 1.99 3.37 5.01 5.80 8.48 7.97
Codes for the cement paste, the moisture condition and the aggregate type: see Chapter 4.1.
Plastic viscosity, H [Nms]
Figure 41. Results of concrete viscometer tests. Three measuring times, 2 min, 30 min and 60 min, for each test concrete are presented.
In most cases, the plastic viscosity became smaller with time which cannot be correct. Most probably, slipping surfaces were formed in the concrete during testing, which gave partly misleading results.
In spite of this, the viscometer results gave some useful information. Especially, the results with prewetted lightweight aggregate and normal weight aggregate are interesting. The results showed that the workability loss with prewetted lightweight aggregate was smaller than that with normal weight aggregate having the same cement paste properties. This suggests that water moves from the prewetted aggregate to the cement paste even after mixing. According to the

TEST RESULTS AND DISCUSSION 93
water absorption tests, a small amount of water may move from the prewetted aggregate to the cement paste during mixing but not after mixing.
5.3.3 Concluding remarks
According to the test results, there are two main factors controlling the slump loss of high-strength lightweight aggregate concrete: the cement paste properties and the moisture condition of the aggregate. However, the slump loss describes only a part of the workability loss.
The results clearly show that the slump loss of lightweight aggregate concrete is a combination of the water absorption by the aggregate and the changed properties of the cement paste. In the present study, the former effect could be eliminated by use of prewetted lightweight aggregate. However, the effect of the workability loss of the cement paste itself was also very important. Although different lightweight aggregates with different absorption properties were used, the slump loss was practically independent on the aggregate type.
5.4 COMPRESSIVE STRENGTH AND DENSITY OFCONCRETE
5.4.1 Compressive strength
The compressive strength was determined at the age of 1 and 28 days from two parallel concrete batches. At 28 days, the compressive strength was determined from the test specimens prepared 1 and 30 min after mixing. The average results are shown in Table 28, while the individual results are shown in Appendix E.
The relationship between the compressive strength at 1 and 28 days and the effective water-cement ratio at 60 min after mixing is presented in Figure 42. As can be seen, the dependence at 1 day is poor, even for the same lightweight aggregate type. Practically the same compressive strength was achieved with water-cement ratios about 0.35 and 0.39. At 28 days, the dependence is better, but still only indicative. Within one lightweight aggregate type, Liapor 8 gave much better correlation than HS Leca 800. The calculated effective water-cement ratio is the average value for the whole cement paste. Actually, the water-cement ratio varies locally depending on the absorptive properties of the aggregate. Therefore, a poor correlation was observed.

94 TEST RESULTS AND DISCUSSION
Table 28. Compressive strength. Two parallel test series were carried out. The results are average values of three parallel cubes.
Cementpaste
Moisturecondition
Aggregatetype
Compressive strength MPa]
1 day 28 days, cubes cast after 30 min
28 days, cubes cast after 1 min
1 1 1 53.3 54.4 86.1 84.9 85.0 85.0
1 1 2 53.7 51.5 100.2 97.5 97.5 95.4
1 1 4 50.2 49.5 114.8 113.0 111.5 110.4
1 2 1 44.4 46.8 91.2 89.6 87.4 85.0
1 2 2 39.1 41.5 94.9 96.2 90.0 93.4
1 3 1 57.1 58.6 87.4 89.0 80.9 83.6
1 3 2 57.7 56.2 96.4 97.0 100.1 95.4
2 1 1 48.7 47.3 80.4 79.9 79.5 78.7
2 1 2 38.0 38.7 79.2 82.2 76.7 81.3
2 1 4 33.8 31.8 81.1 81.5 84.1 82.5
2 2 1 35.6 36.5 75.1 73.5 75.4 73.7
2 2 2 26.1 28.3 74.4 74.7 75.8 74.1
2 3 1 47.7 45.1 83.3 79.0 78.0 78.7
2 3 2 35.9 36.2 79.3 81.8 76.0 79.4
Codes for the cement paste, the moisture condition and the aggregate type: see Chapter 4.1.
HS Leco 800
Uopor 8
Nenseth
Effective wafer-cement ratio
■c 100HS Leco 800
Liopor 8
Nenseth
Effective water-cement ratio
a) 1 d b) 28 d
Figure 42. Relationship between compressive strength and effective water-cement ratio at 60 min after mixing. For the compressive strength the specimens cast 30 min after mixing are used.
The effect of the experimental variables on the compressive strength was analyzed by use of the analysis of variance. The analysis was first carried out by
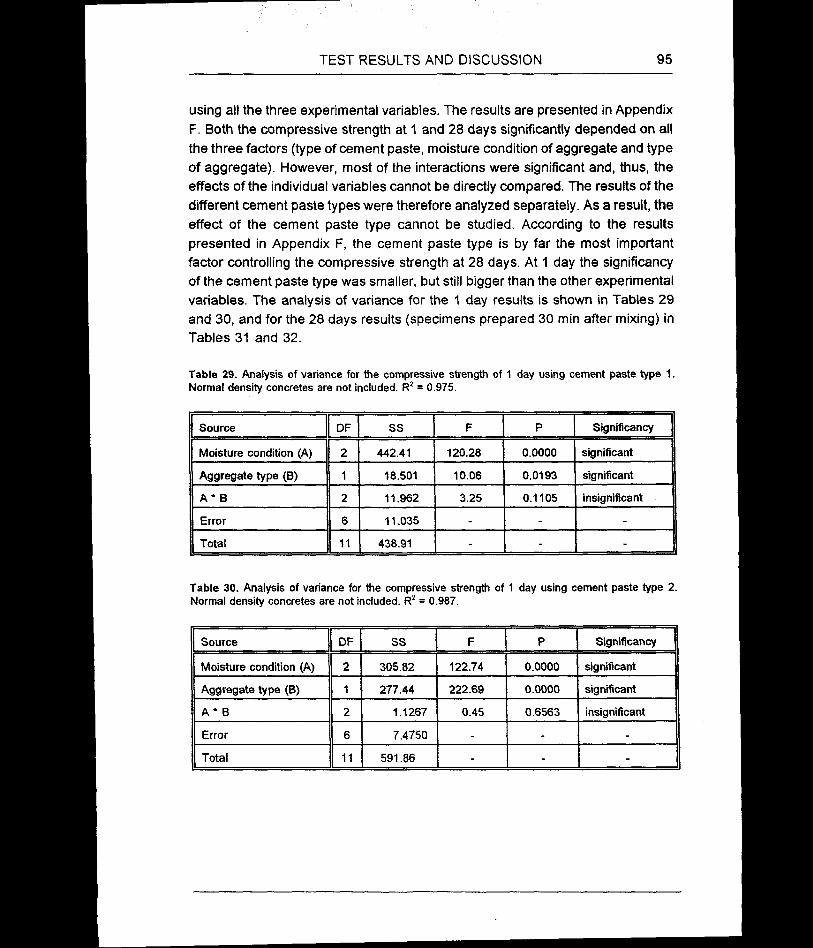
TEST RESULTS AND DISCUSSION 95
using all the three experimental variables. The results are presented in Appendix F. Both the compressive strength at 1 and 28 days significantly depended on all the three factors (type of cement paste, moisture condition of aggregate and type of aggregate). However, most of the interactions were significant and, thus, the effects of the individual variables cannot be directly compared. The results of the different cement paste types were therefore analyzed separately. As a result, the effect of the cement paste type cannot be studied. According to the results presented in Appendix F, the cement paste type is by far the most important factor controlling the compressive strength at 28 days. At 1 day the significancy of the cement paste type was smaller, but still bigger than the other experimental variables. The analysis of variance for the 1 day results is shown in Tables 29 and 30, and for the 28 days results (specimens prepared 30 min after mixing) in Tables 31 and 32.
Table 29. Analysis of variance for the compressive strength of 1 day using cement paste type 1. Normal density concretes are not included. R2 = 0.975.
Source DF SS F P Significancy
Moisture condition (A) 2 442.41 120.28 0.0000 significant
Aggregate type (B) 1 18.501 10.06 0.0193 significant
A* B 2 11.962 3.25 0.1105 insignificant
Error 6 11.035 - - -
Total 11 438.91 - - -
Table 30. Analysis of variance for the compressive strength of 1 day using cement paste type 2. Normal density concretes are not included. R2 = 0.987.
Source DF SS F P Significancy
Moisture condition (A) 2 305.82 122.74 0.0000 significant
Aggregate type (B) 1 277.44 222.69 0.0000 significant
A* B 2 1.1267 0.45 0.6563 insignificant
Error 6 7.4750 - - -
Total 11 591.86 - - -

96 TEST RESULTS AND DISCUSSION
Table 31. Analysis of variance for the compressive strength of 28 days (specimens prepared 30 min after mixing) using cement paste type 1. Normal density concretes are not included. Rz = 0.972.
Source DF SS F P Significancy
Moisture condition (A) 2 1.3217 0.50 0.6304 insignificant
Aggregate type (B) 1 243.00 183.40 0.0000 significant
A * B 2 33.995 12.83 0.0068 significant
Error 6 7.9500 - - -
Total 11 286.27 - - -
Table 32. Analysis of variance for the compressive strength of 28 days (specimens prepared 30 min after mixing) using cement paste type 2. Normal density concretes are not included. R2 = 0.851.
Source DF SS F P Significancy
Moisture condition (A) 2 103.28 16.91 0.0034 significant
Aggregate type (B) 1 0.0133 0.00 0.9495 insignificant
A* B 2 0.7117 0.12 0.8920 insignificant
Error 6 18.320 - - -
Total 11 122.33 - - -
The average comparisons for various moisture conditions and the aggregate types are presented in Tables 33 and 34. The normal weight aggregate was included in Table 34, although the aggregate was not used in the analysis of variance. The critical values for comparison were calculated by use of Tukeys pairwise comparison. If the difference between two treatments is bigger than the critical value of comparison, the treatments significantly differ from each other. The probability level used was 95%.
Table 33. Effect of moisture condition of the aggregate on the compressive strength at the age of 1 and 28 days [MPa], When a factor is not significant, the fields are shaded.
Moisture condition Cement paste type 1
Cement paste type 2
1 d 28 d 1 d 28 d
Dry aggregate 53.2 92.2 43.2 80.4
Prewetted aggregate 43.0 93.0 31.6 74.4
Two-stage mixing 57.4 92.5 41.2 80.9
Critical value for comparison 2.94 - 2.42 3.79

TEST RESULTS AND DISCUSSION 97
Table 34. Effect of aggregate type on the compressive strength at the age of 1 and 28 days [MPa], Normal weight aggregate (Nenseth) was not included in the analysis of variance. When a factor is not significant, the fields are shaded.
Aggregate type Cement paste type 1
Cement paste type 2
1 d 28 d 1 d 28 d
HS Leca 800 52.4 88.0 1 43.4 78 5
Liapor 8 50.0 97.0 ' 33.9 78.6
Nenseth (49.9) (113.9) (32.8) (81.3)
Critical value for comparison 1.92 - 1.58 -
1 = the interaction between the aggregate type and the moisture condition was significant (see Table 31 and Figure 43).
The interaction between the aggregate type and the moisture condition of the aggregate with the cement paste type 1 is presented in Figure 43.
HS Leco 800
Liopor 8
Moisture condition
Figure 43. Interaction between the aggregate type and the moisture condition of the aggregate when the cement paste type 1 was used.
The analysis of variance showed that the compressive strength at 1 day depended on both the moisture condition and the aggregate type with both cement paste types. With the cement paste type 1, the moisture condition was clearly the most important factor, while with the cement paste type 2 the above-mentioned two factors had about the same significancy. Prewetted lightweight aggre

98 TEST RESULTS AND DISCUSSION
gate gave a clearly lower 1 day compressive strength than the other moisture conditions. The difference was typically about 10 MPa. HS Leca 800 aggregate gave a higher 1 day compressive strength than Liapor 8 or normal weight aggregate. The difference between the aggregate types was biggest for the cement paste type 2 (=10 MPa). The effect of aggregate type on the early compressive strength was due to the different water absorption properties of the aggregate types.
The results at 28 days are more complicated. For the cement paste type 1, the compressive strength depended on the aggregate type. In addition, the interaction between the aggregate type and the moisture condition was significant. HS Leca 800 gave a higher compressive strength with the prewetted aggregate compared to that of the dry aggregate of the two-stage mixing In the case of Liapor 8 aggregate, the prewetted aggregate gave the lowest compressive strength. With both aggregates, the final effective water-cement ratio was higher with the prewetted aggregate compared to the other moisture conditions. An explanation for the phenomenon is the self curing effect in the case of the prewetted aggregate. The effect probably depends on the pore size distributions of the aggregate and the cement paste and, therefore, may vary between the aggregate types. HS Leca 800 had a clearly bigger average surface pore size than Liapor 8. Therefore, the prewetted HS Leca 800 may give away water more easily than Liapor 8. For the cement paste type 2, the moisture condition alone controlled the compressive strength.
The results at 28 days indicate that the potential strength of the lightweight aggregate was higher than the strength of the mortar at the cement paste type 2 but lower than that at the cement paste type 1. The potential strength of the lightweight aggregate was high. When the compressive strength of the concrete was up to about 80 MPa, the effect of the aggregate type was not very important. Both lightweight aggregate types and the normal weight aggregate gave practically the same compressive strength. The lower strength of the more porous aggregate was apparently compensated by a lower effective final water- cement ratio caused by a higher water absorption. When the strength of the mortar exceeded the potential strength of the aggregate, only the aggregate properties significantly affected the compressive strength of the concrete. Liapor 8 aggregate gave on the average a compressive strength of 9 MPa higher than HS Leca 800 aggregate, although the use of HS Leca 800 resulted in a lower final effective water-cement ratio. The normal weight aggregate gave on the average 17 MPa higher compressive strength than Liapor 8 and 26 MPa higher than HS Leca 800.

TEST RESULTS AND DISCUSSION 99
Due to the small number of the test specimens (3 cubes), the standard deviation was not analyzed but are shown in Figure 44. The within standard deviations were calculated using Equation 15. The variation of the compressive strength was generally smaller than 3% (coefficient of variation) which can be considered as an appropriate limit value for this kind of concrete produced under laboratory conditions. However, in some cases the coefficient of variation was clearly higher. In the case of the specimens cast 30 min after mixing, the biggest variation occured with the two-stage mixing combined with the cement paste type 1. However, the same concretes did not have the highest variation when the specimens were cast 1 min after mixing. Therefore, it is most likely that the standard variation varied rather randomly.
90 100 110 120Compressive strength [MPa]
7
6 5
4
3 2 1
060 70 80 90 100 110 120
Compressive strength [MPa]
LWAC
NWCijvi
3 % C 4r— .
t. • • 1. r -
a) specimens cast 1 min after mixing. b) specimens cast 30 min after mixing.
Figure 44. Standard deviations within each batch of concrete. Also the codes for the big variations as well as the coefficient of variation of 3% are shown.
5.4.2 Effect of casting time
The casting time of the test specimens has previously been reported to have a certain effect both on the microstructure as well as on the compressive strength of lightweight aggregate concrete (see page 35). Here, the effect of casting time for the test specimens was investigated by comparing the compressive strength of the specimens prepared 1 and 30 min after mixing (fc(30min) - fc(1 min)).
The analysis of variance showed that the difference between the specimens cast 30 and 1 min after mixing did not significantly depend on the type of cement paste, the moisture condition of aggregate or the aggregate type (Appendix F). The differences are shown in a stem-and-leaf diagram in Table 35. The stem- and-leaf diagram presents the maximum two significant numbers of each item. The left-hand column shows the first significant number. To the right, the second

100 TEST RESULTS AND DISCUSSION
significant number of all items are presented. The right side gives a rough indication of the distribution.
The standard deviation of the difference was 2.404 and the confidence limits (95%) for the average were 1.854 ± 0.934, i.e. 0.920 and 2.788 MPa.
Table 35. Stem-and-leaf diagram of the compressive strength difference between the specimens cast 30 and 1 min after mixing (fc(30min) - fc(1 m) [MPa],
-3-2-1-0
0123456
70
02113589014614566823869345
-31 7 represents -3.7 MPa, n = 28, average = 1.854 MPa
The consistency of the lightweight aggregate concrete was higher immediately after mixing than 30 min after mixing. Therefore, the compaction after 1 min may cause a higher segregation and thereby a higher variation in the compressive strength results. In the present study, only three parallel cubes were used for the compressive strength testing and, thus, the variation of the test results cannot be properly analyzed. The average within batch coefficients of variations for the compressive strength and the density tests are shown in Table 36 (see also Figure 44). The results indicate that variation of results for the specimens cast 30 min after mixing was slightly smaller than that of the specimens prepared earlier.
Table 36. Average within batch coefficients of variation for compressive strength and density. Lightweight aggregate concrete (LWAC) and normal density concrete (NDC) are treated separately.
Time of casting [min]
Coefficient of variation [%]
Compressive strength Density
LWAC NDC LWAC NDC
1 3.00 0.72 - -
30 2.45 1.17 0.668 0.128

TEST RESULTS AND DISCUSSION 101
In the present study, the cubes prepared 30 min after mixing gave on the average about 1.9 MPa higher compressive strength than those prepared 1 min after mixing (average of 28 mixes). However, the scatter was high, and the difference did not depend on any experimental variable. Therefore, the direct effect of water absorption on the compressive strength is probably not significant. The observed difference was probably caused by a slightly lower effective final water-cement ratio of the test specimens cast after 30 min. The water absorption may take place more easily in an uncompacted concrete than in a compacted one. In addition, the compaction immediately after mixing may cause a higher segregation of the fresh concrete and, therefore, also a higher variation in the compressive strength.
5.4.3 Density
The density of lightweight aggregate concrete is controlled by several factors, from which the most important is the density of lightweight aggregate and the proportion of normal weight aggregate. Here, only the effects of the experimental variables were analyzed.
The density results are based on two parallel tests from each combination, and each test consisted of six parallel cubes. The analysis of variance is shown in Table 37. All detailed results are given in Appendix E.
Table 37. Analysis of variance for the wet concrete density. Normal density concretes are not included. R2 = 0.936.
Source DF SS F P Significancy
Cement paste (A) 1 10045 96.09 0.0000 significant
Moisture condition (B) 2 4009.1 19.17 0.0002 significant
Aggregate type (C) 1 3577.0 34.22 0.0001 significant
A* B 2 34.083 0.16 0.8514 insignificant
A * C 1 155.04 1.48 0.2467 insigfinicant
B * C 2 326.08 1.56 0.2500 insignificant
A* B * C 2 200.08 0.96 0.4115 insignificant
Error 12 1254.5 - - -
Total 23 19601 - - -
102 TEST RESULTS AND DISCUSSION
All the experimental variables significantly affected the density of concrete. The effect of the cement paste type was the most significant. The average density for different types of cement paste, moisture condition and aggregate type was asfollows:
Cement paste type:Type 1 2009 kg/m3Type 2 1968 kg/m3
Moisture condition of the aggregate:Dry aggregate 1975 kg/m3Prewetted aggregate 2006 kg/m3Two-stage mixing 1984 kg/m3
Aggregate type:HS Leca 800 1976 kg/m3Liapor 8 2000 kg/m3
The effects of the experimental variables on the concrete density came out as expected. Only the two-stage mixing procedure gave a higher density than expected. The most probable explanation for the higher density is the bigger variation of the concrete quality when the two-stage mixing was used (see Fig. 44). In addition, the water absorption was measured only up til 60 min and, therefore, the final water absorption was not known. The use of prewetted aggregate increased the wet density of concrete on the average for about 30 kg/m3. The value is smaller than the absorbed water content indicates. However, also the effective water-cement ratio slightly varied depending on the moisture condition of the aggregate. The use of Liapor 8 aggregate gave a density on the average about 25 kg/m3 higher than HS Leca 800 aggregate. The effect of aggregate type on the density was partly caused by different particle densities but also by slightly different effective water contents.
5.4.4 Strength-density ratio
The strength-density ratio is a very important property for the competitiveness of lightweight aggregate concrete. In the present study, the strength-density ratio of the concrete was analyzed by use of the strength index. The strength index is calculated by use of 28 days compressive strength and the concrete density as shown in Equation 7 (page 57).
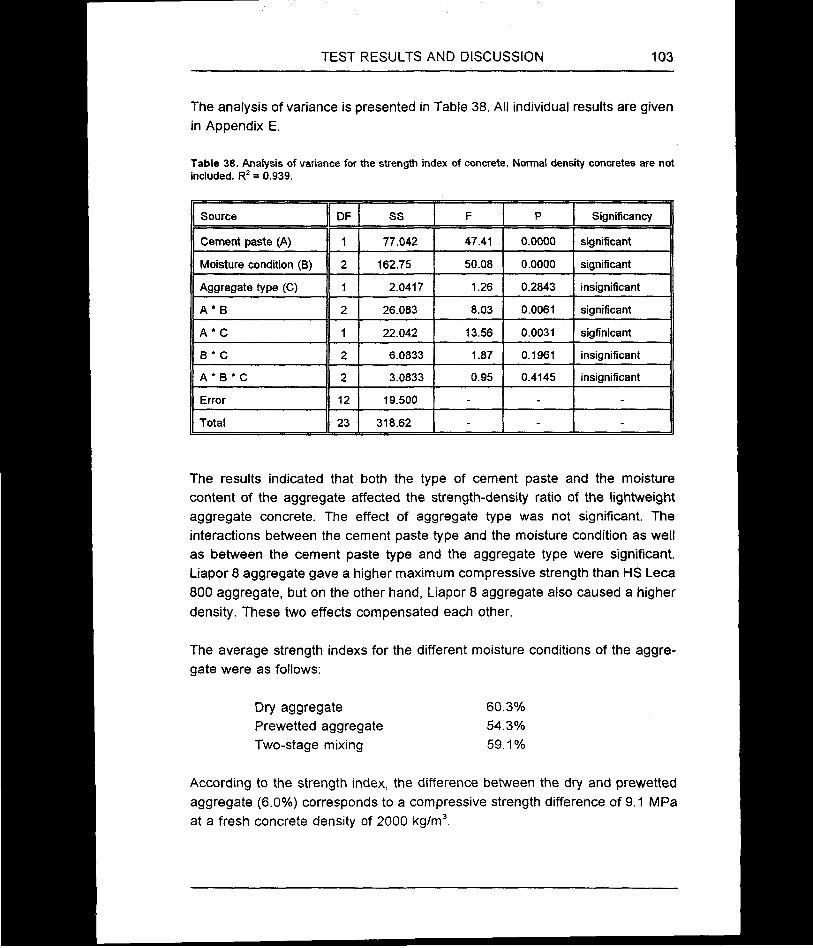
TEST RESULTS AND DISCUSSION 103
The analysis of variance is presented in Table 38. All individual results are given in Appendix E.
Table 36. Analysis of variance for the strength index of concrete. Normal density concretes are not included. R2 = 0.939.
Source DF SS F P Significancy
Cement paste (A) 1 77.042 47.41 0.0000 significant
Moisture condition (B) 2 162.75 50.08 0.0000 significant
Aggregate type (C) 1 2.0417 1.26 0.2843 insignificant
A* B 2 26.083 8.03 0.0061 significant
A * C 1 22.042 13.56 0.0031 sigfinicant
B * C 2 6.0833 1.87 0.1961 insignificant
A * B * C 2 3.0833 0.95 0.4145 insignificant
Error 12 19.500 - - -
Total 23 318.62 - - -
The results indicated that both the type of cement paste and the moisture content of the aggregate affected the strength-density ratio of the lightweight aggregate concrete. The effect of aggregate type was not significant. The interactions between the cement paste type and the moisture condition as well as between the cement paste type and the aggregate type were significant. Liapor 8 aggregate gave a higher maximum compressive strength than HS Leca 800 aggregate, but on the other hand, Liapor 8 aggregate also caused a higher density. These two effects compensated each other.
The average strength indexs for the different moisture conditions of the aggregate were as follows:
Dry aggregate 60.3%Prewetted aggregate 54.3%Two-stage mixing 59.1%
According to the strength index, the difference between the dry and prewetted aggregate (6.0%) corresponds to a compressive strength difference of 9.1 MPa at a fresh concrete density of 2000 kg/m3.

104 TEST RESULTS AND DISCUSSION
5.4.5 Concluding remarks
The results indicate that the compressive strength of lightweight aggregate concrete was primarily controlled by the strength of the lightweight aggregate and the strength of the mortar depending on the potential strength of the aggregate. In addition, the moisture condition of the aggregate affected especially the early strength of the concrete.
The one day compressive strength was strongly affected by the moisture condition of the aggregate. The use of prewetted lightweight aggregate gave on the average about 10 MPa lower compressive strength compared to that of dry aggregate.
The 28 day compressive strength was primarily controlled by the strength properties of the lightweight aggregate and the mortar depending on the compressive strength level. When a low water-cement ratio (» 0.35) was used, the aggregate properties controlled the compressive strength of the concrete. For a slightly higher water-cement ratio (» 0.42) the strength of the lightweight aggregate exceeded the strength of the mortar, and the compressive strength of the concrete was primarily controlled by the effective final water-cement ratio of the concrete. The potential strength level of the lightweight aggregates were high. Up to about 80 MPa, it was not very important which type of aggregate which was used.
The casting time for the test specimens had only a small influence on the compressive strength. The difference between the specimens cast 30 and 1 min after mixing was probably due to a higher effective final water-cement ratio and higher variation in the test specimens prepared immediately after mixing. Any special effect caused by the outcoming air could not be detected.
The moisture condition of the aggregate affected the density of the concrete. Thus, the use of prewetted lightweight aggregate increased the density approximately 30 kg/m3 compared to the dry aggregate. The difference corresponds to about 9 MPa in compressive strength at a fresh concrete density of 2000 kg/m3. The difference was smaller than the difference of the moisture contents of the aggregate suggests. However, also the water-cement ratio varied depending on the moisture condition. Different types of lightweight aggregate did produce different densities. However, the strength-density ratio was not significantly affected by the type of lightweight aggregate.
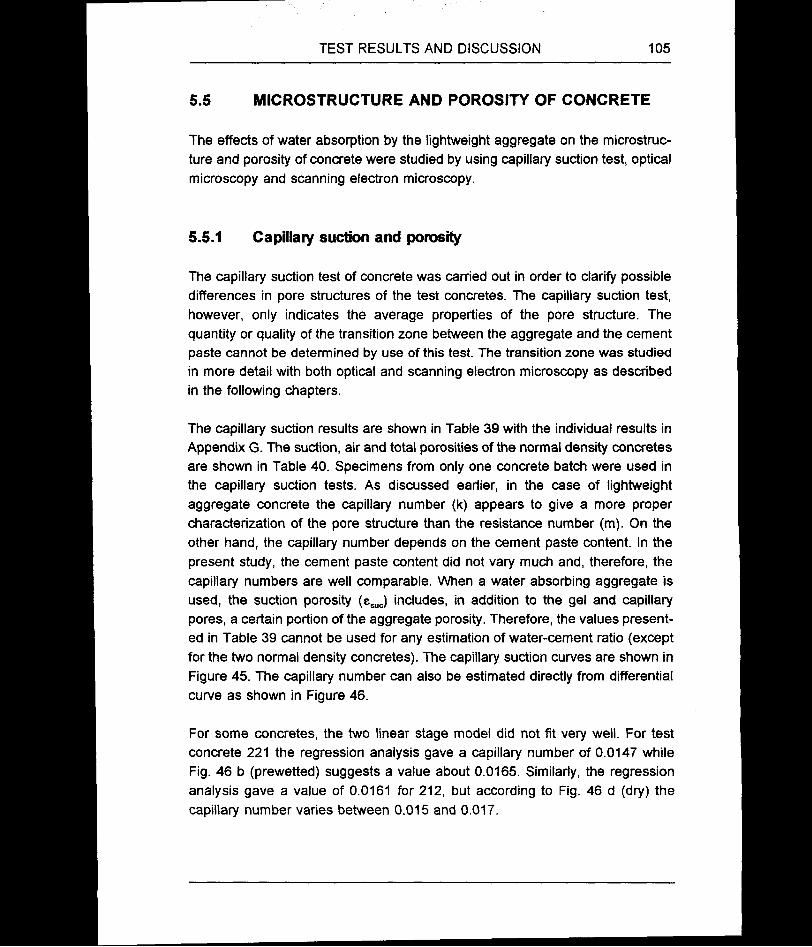
TEST RESULTS AND DISCUSSION 105
5.5 MICROSTRUCTURE AND POROSITY OF CONCRETE
The effects of water absorption by the lightweight aggregate on the microstructure and porosity of concrete were studied by using capillary suction test, optical microscopy and scanning electron microscopy.
5.5.1 Capillary suction and porosity
The capillary suction test of concrete was carried out in order to clarify possible differences in pore structures of the test concretes. The capillary suction test, however, only indicates the average properties of the pore structure. The quantity or quality of the transition zone between the aggregate and the cement paste cannot be determined by use of this test. The transition zone was studied in more detail with both optical and scanning electron microscopy as described in the following chapters.
The capillary suction results are shown in Table 39 with the individual results in Appendix G. The suction, air and total porosities of the normal density concretes are shown in Table 40. Specimens from only one concrete batch were used in the capillary suction tests. As discussed earlier, in the case of lightweight aggregate concrete the capillary number (k) appears to give a more proper characterization of the pore structure than the resistance number (m). On the other hand, the capillary number depends on the cement paste content. In the present study, the cement paste content did not vary much and, therefore, the capillary numbers are well comparable. When a water absorbing aggregate is used, the suction porosity (esuc) includes, in addition to the gel and capillary pores, a certain portion of the aggregate porosity. Therefore, the values presented in Table 39 cannot be used for any estimation of water-cement ratio (except for the two normal density concretes). The capillary suction curves are shown in Figure 45. The capillary number can also be estimated directly from differential curve as shown in Figure 46.
For some concretes, the two linear stage model did not fit very well. For test concrete 221 the regression analysis gave a capillary number of 0.0147 while Fig. 46 b (prewetted) suggests a value about 0.0165. Similarly, the regression analysis gave a value of 0.0161 for 212, but according to Fig. 46 d (dry) the capillary number varies between 0.015 and 0.017.
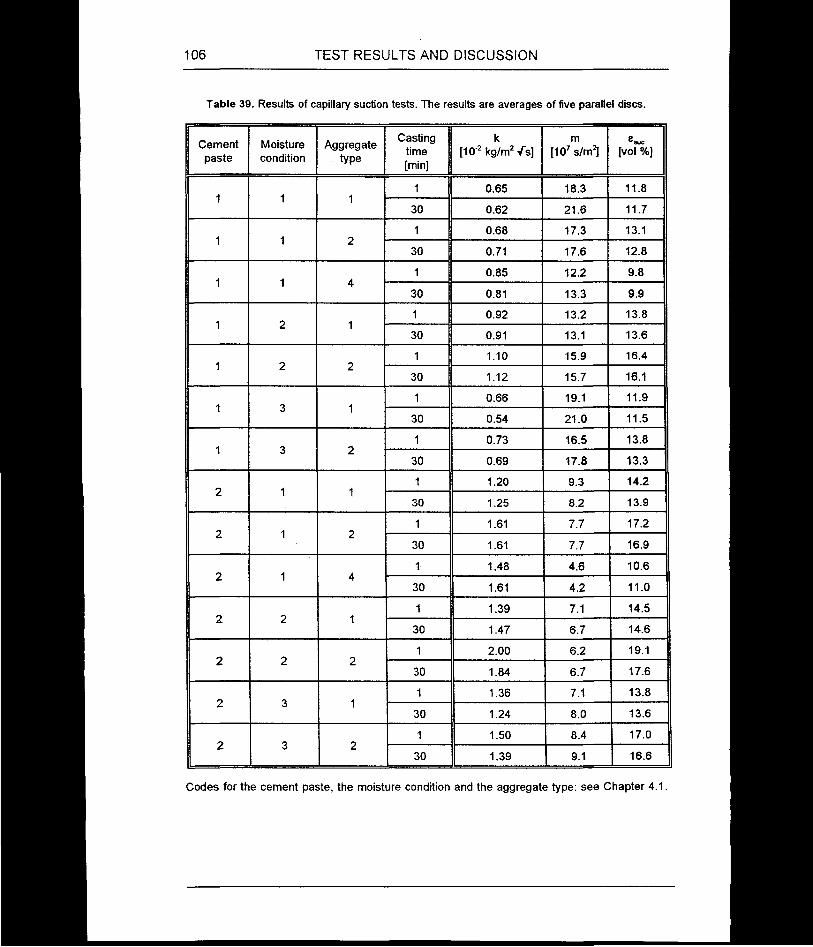
106 TEST RESULTS AND DISCUSSION
Table 39. Results of capillary suction tests. The results are averages of five parallel discs.
Cementpaste
Moisturecondition
Aggregatetype
Castingtime[min]
k[10"2 kg/m2 /s]
m[tO7 s/m2]
®SUC
[vol %]
1 1 1
1 0.65 18.3 11.8
30 0.62 21.6 11.7
1 1 21 0.68 17.3 13.1
30 0.71 17.6 12.8
1 1 41 0.85 12.2 9.8
30 0.81 13.3 9.9
1 2 11 0.92 13.2 13.8
30 0.91 13.1 13.6
1 2 21 1.10 15.9 16.4
30 1.12 15.7 16.1
1 3 11 0.66 19.1 11.9
30 0.54 21.0 11.5
1 3 21 0.73 16.5 13.8
30 0.69 17.8 13.3
2 1 1
1 1.20 9.3 14.2
30 1.25 8.2 13.9
2 1 21 1.61 7.7 17.2
30 1.61 7.7 16.9
2 1 41 1.48 4.6 10.6
30 1.61 4.2 11.0
2 2 11 1.39 7.1 14.5
30 1.47 6.7 14.6
2 2 21 2.00 6.2 19.1
30 1.84 6.7 17.6
2 3 11 1.36 7.1 13.8
30 1.24 8.0 13.6
2 3 21 1.50 8.4 17.0
30 1.39 9.1 16.6
Codes for the cement paste, the moisture condition and the aggregate type: see Chapter 4.1.

TEST RESULTS AND DISCUSSION 107
prewetted
Time [sqrt s Time [sqrt
a) Cement paste type 1, HS Leca 800. b) Cement paste type 2, HS Leca 800.
prewetted
two-stoge
Time [sqrt s]
c) Cement paste type 1, Liapor 8. d) Cement paste type 2, Liapor 8.
Time [sqrt s
e) Cement paste type 1, Nenseth. f) Cement paste type 2, Nenseth.
Figure 45. Effect of moisture condition of the aggregate on the capillary suction of the concrete. The specimes were cast 30 min after mixing. Averages of five parallel discs are presented.

108 TEST RESULTS AND DISCUSSION
0.016
0.012
0.008
0.004
200 400 600 800Time [sqrf s
a) Cement paste type 1, HS Leca 800.
0.012
0.008
0.004
200 400 600 800
c) Cement paste type 1, Liapor 8.
0.016
0.012
0.008
0.004
200 400 600 800Time [sqrf s
b) Cement paste type 2, HS Leca 800.
0.016prewetted
0.012two-stage
0.008
0.004
200 400 600 800Time [sqrf s
d) Cement paste type 2, Liapor 8.
S 0.016
a 0.012
0 0.008
£ 0.004
200 400 600 800Time [sqrf s
0.016
0.012
0.008
0.004
200 400 600 800Time [sqrf
e) Cement paste type 1, Nenseth. f) Cement paste type 2, Nenseth.
Figure 46. Effect of moisture condition of the aggregate on the rate of the suction. The specimes were cast 30 min after mixing. Averages of five parallel discs are presented.

TEST RESULTS AND DISCUSSION 109
Table 40. Suction, air and total porosity of the normal density concrete.
Cementpaste
Castingtime
®suc
[vol %]e,i,
[vol %]®tot
[vol %]
1 1 min 9.8 1.6 11.4
1 30 min 9.9 1.3 11.2
2 1 min 10.6 1.7 12.3
2 30 min 11.0 2.0 12.9
Codes for the cement paste: see Chapter 4.1.
The capillary suction results indicate that the pore structure of the lightweight aggregate concrete is primarily controlled by the effective water-cement ratio which, in turn, depends on the cement paste properties but also on the water absorption properties of the aggregate. Therefore, both the moisture condition of the aggregate as well as the type of aggregate significantly affected the capillary suction.
The use of prewetted aggregate significantly increased the capillary number. The effect was bigger for the cement paste type 1 than for the cement paste type 2. The results partly differ from the compressive strength results. The prewetted HS Leca 800 aggregate (121) gave a higher compressive strength than the dry aggregate (111), whereas the capillary numbers indicated a more permeable pore structure for the concrete with prewetted aggregate. This effect is probably due to different transition zones. The permeability of concrete is more sensitive to the quality of the transition zone than the compressive strength is.
Both the capillary number and the suction porosity indicate the quality of the cement paste and, therefore, should correlate with the effective water-cement ratio. The relationships are presented in Figure 47.
According to the linear regression model, the difference in effective water-cement ratio explained about 90% of the difference in capillary numbers. The concretes 122,212 and 222 had a clearly higher capillary number compared to the regression line. Therefore, in addition to the effective water-cement ratio, also the moisture condition and type of aggregate appear to have an influence on the capillary number.
The suction porosity correlates poorly with the effective water-cement ratio. The different types of aggregate gave clearly different levels of suction porosity. HS Leca 800 gave about 3.5% and Liapor 8 about 6% higher suction porosity than
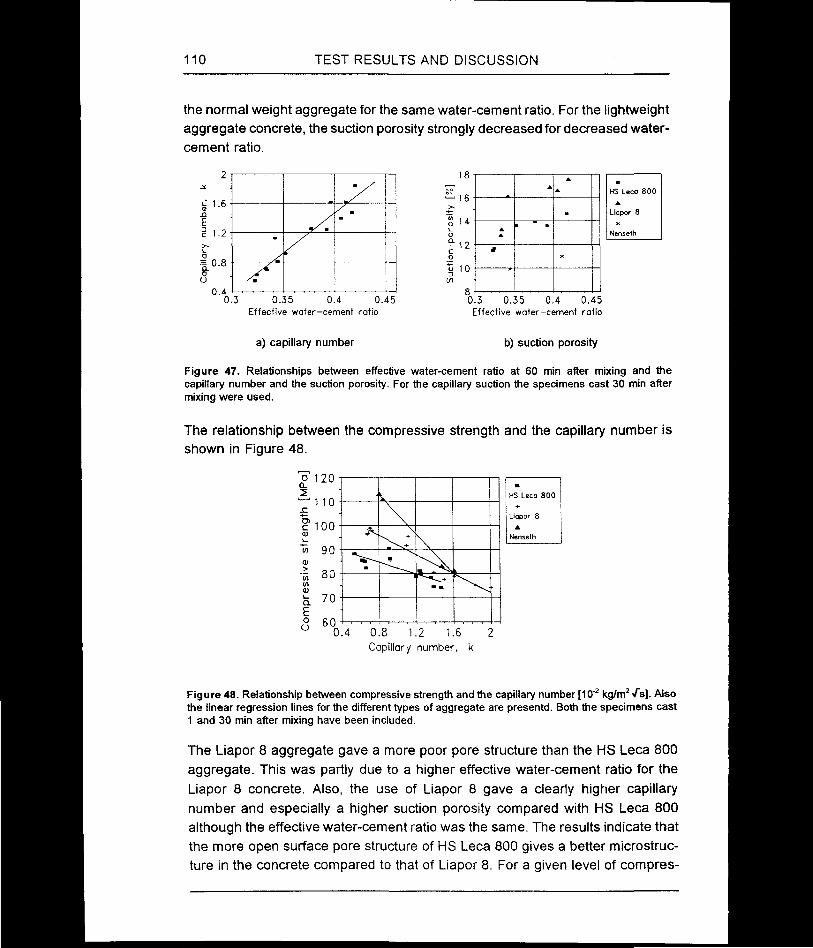
110 TEST RESULTS AND DISCUSSION
the normal weight aggregate for the same water-cement ratio. For the lightweight aggregate concrete, the suction porosity strongly decreased for decreased water- cement ratio.
0.35 0.4 0Effective water-cement ratio
HS Leco 800
liopor 8
Nenselh
Effective water-cement ratio
a) capillary number b) suction porosity
Figure 47. Relationships between effective water-cement ratio at 60 min after mixing and the capillary number and the suction porosity. For the capillary suction the specimens cast 30 min after mixing were used.
The relationship between the compressive strength and the capillary number is shown in Figure 48.
O 120
Capillary number, k
HS Leea 800
Liopor 8
Nenseth
Figure 48. Relationship between compressive strength and the capillary number [10"2 kg/m2 V"s]. Also the linear regression lines for the different types of aggregate are presentd. Both the specimens cast 1 and 30 min after mixing have been included.
The Liapor 8 aggregate gave a more poor pore structure than the HS Leca 800 aggregate. This was partly due to a higher effective water-cement ratio for the Liapor 8 concrete. Also, the use of Liapor 8 gave a clearly higher capillary number and especially a higher suction porosity compared with HS Leca 800 although the effective water-cement ratio was the same. The results indicate that the more open surface pore structure of HS Leca 800 gives a better microstructure in the concrete compared to that of Liapor 8. For a given level of compres

TEST RESULTS AND DISCUSSION 111
sive strength, HS Leca 800 gives a clearly better concrete microstucture than Liapor 8 which, in turn, gives a better microstructure than normal weight aggregate.
For the same type of cement paste, it appears that the lightweight aggregate concrete with dry lightweight aggregate has a slightly better pore structure compared to that of normal density concrete. This is primarily caused by a lower effective water-cement ratio. The quality of the transition zone is controlled by the water absorption which takes place after compaction of the concrete. In high- strength concrete, the absorption after compaction cannot be very high, and, therefore, a relatively small improvement was observed. The use of prewetted lightweight aggregate, however, may give a more poor pore structure than that of normal density concrete having the same effective water-cement ratio.
The difference between the specimens cast after 1 and 30 min was analyzed by comparing the capillary numbers and the suction porosities by use of the paired T-test. The results are shown in Table 41.
Table 41. Effect of casting time of specimens on the capillary number (k) and the suction porosity (esuc). The difference (value(30 min) - value,, mm)) was analysed by use of the paired T-test. (avg = average, std = standard deviation, P = probability).
Aggregatetype
Difference (value(30mln) - value,, min))
k [10'2 kg/m2 Vs] esuc [vol %]
avg std P avg std P
All -0.0229 0.0834 0.324 -0.279 0.427 0.0295
HS Leca 800 -0.0250 0.128 0.497 -0.183 0.263 0.0478
Liapor 8 -0.0433 0.117 0.224 -0.550 0.721 0.0357
Nenseth +0.0450 - - +0.250 - -
The results indicate that the casting time for the specimens only slightly affect the concrete quality. The specimens cast 30 min after mixing showed a slightly better quality than those cast 1 min after mixing. This is probably due to a difference in the effective final water-cement ratio. The specimens cast 30 min after mixing had smaller capillary numbers and suction porosities compared with the specimens cast 1 min after mixing (except in the case of the normal density concrete). However, the difference in capillary numbers was not significant. Only the suction porosity significantly depended on the casting time. The specimens cast 30 min after mixing showed on the average about 0.28 percentage units smaller

112 TEST RESULTS AND DISCUSSION
suction porosity than those cast 1 min after mixing. This only corresponds to about 0.003 to 0.004 in water-cement ratio (Equation 14). It has been reported that big air voids may be formed on the aggregate surface when the specimens are cast immediately after mixing. However, the presence of such big air voids cannot be detected in the capillary suction test. The observed difference in suction porosity was caused by different gel/capillary porosities, i.e. differences in the effective water-cement ratio.
5.5.2 Optical microscopy
Thin sections were used to investigate the microstructure of the concrete by optical microscopy. Since the concrete samples were high-strength concrete, all the samples had a relatively good microstructure. Thus, no big differences in microstructure could be detected. The main interest was focused on the quality of the transition zone and the possible presence of air voids appearing on the surface of the lightweight aggregate.
Although the microstructure appeared to be generally very good and homogenous, the following characteristics were observed.
1. A white rim adjacent to the lightweight aggregate particles was sometimes observed.
2. Presence of any air voids on the surface of the lightweight aggregate particles was not observed.
The white rim around the lightweight aggregate particles appeared to be a very porous zone which was probably caused by a high local water content around the lightweight aggregate (Figure 49). The extent of the white rim was estimated visually, the results of which are presented in Table 42.
The moisture condition of the aggregate appeared to be the main factor controlling the existence of the rim. Thus, most of the rims were observed with prewetted aggregate. Also, the type of aggregate and the type of cement paste affected the rim. The rim could more frequently be observed with Liapor 8 than with HS Leca 800 aggregate and more frequently with cement paste type 2 than with cement paste type 1.

TEST RESULTS AND DISCUSSION 113
The presence of rims varied from one aggregate particle to another within the same concrete and also within the same aggregate particle. The concrete sample 222 contained the largest amount of rims, but even in that case, only less than 5% of the interface was covered with a rim. The rims were located quite randomly around the aggregate particles in such a way that bleeding could not be the only factor causing such rims.
Table 42. Presence of white rims around lightweight aggregate particles in thin sections. 0 = no white rims, 1 = some white rims and 2 = several white rims.
Cementpaste
Moisturecondition
Aggregatetype
Castingtime[min]
Existence of white rims
1 1 11 0
30 0
1 1 21 1
30 1
1 2 11 1
30 1
1 2 21 1
30 1
2 1 11 1
30 1
2 1 21 0
30 0
2 2 11 1
30 2
2 2 21 2
30 2
Codes for the cement paste, the moisture condition and the aggregate type: see Chapter 4.1.
The white rim may primarily be caused by the water located on the aggregate surface prior to the mixing. Also, both the water absorption as well as the workability loss tests indicate that a small amount of water may move out of the aggregate to the fresh cement paste. The difference in ion concentration between the pore solution and the water in aggregate may be the reason to such a water movement. Later on, when the hydration of the cement proceeds, water

114 TEST RESULTS AND DISCUSSION
may move out of the aggregate to the cement paste by capillary forces. However, this water cannot form any porous areas adjacent to the aggregate. The white rims were sometimes also observed in the case of dry lightweight aggregate. Even when a dry lightweight aggregate is used, the aggregate may contain a certain amount of free water in the surface layer due to water absorption. This water may also contribute to the formation of a more porous transition zone. The white rims, which represent some porous zones, may be reflected to the high suction porosities observed in the capillary suction tests.
Figure 49. Microphotographs of white rims around lightweight aggregate particle in concrete sample 222. Original magnification: x 40, the picture width: 2.5 mm.

TEST RESULTS AND DISCUSSION 115
In addition to the white rims, some of the test samples had transition zones which appeared lighter than the bulk paste, i.e. the water-cement ratio was probably higher in the vicinity of the lightweight aggregate. The presence of a distinct transition zone was most commonly observed in the concretes with prewetted lightweight aggregate and when cement paste type 2 was used.
Rims of air bubbles on the aggregate surface as reported by Helland and Maage (1993) could not be observed on any of the samples. Occasionally, the lightweight aggregate concrete contained some air bubbles near the aggregate surface, but air bubbles were typically part of the randomly distributed entrapped air voids. The water absorption which takes place in a well compacted high- strength concrete is normally so low that even if the specimen is compacted immediately after mixing, only very little of air can come out of the aggregate. The situation may be different with a high water-cement ratio. Also, when air- entraining admixtures are used, air bubbles on the aggregate surface may form, but then the phenomena is not necessarily related to the water absorption by the lightweight aggregate. Also the normal density concrete contained some air voids, but to a lesser extent than in the lightweight aggregate concrete. It appears that air is more easily entrapped in lightweight aggregate concrete because of the lower aggregate density.
5.5.3 Scanning electron microscopy
Scanning electron microscopy was primarily used in order to study the possible effects of the moisture condition in the aggregate on the quality of the aggregate- paste transition zone. Both fractured and polished test samples were studied.
Secondary electron imaging
The fractured samples, which were analyzed by use of secondary electron imaging, did not reveal any special transition zone between the lightweight aggregate and the hardened cement paste. Because of its relatively low water- cement ratio, the cement paste was probably too dense. In addition, the microstructure of the lightweight aggregate and the cement paste appeared quite similar in the scanning electron microscope and, therefore, it was often even difficult to detect the exact location of the interface.
When cement paste type 1 was used, the cement paste was very dense and no concentration of calcium hydroxide adjacent to the aggregate surface was ob

116 TEST RESULTS AND DISCUSSION
served. However, some pores in the cement paste as well as in the lightweight aggregate contained some ettringite or calcium hydroxide crystals. A typical interface between the lightweight aggregate and the cement paste is shown in Figure 50.
Figure 50. Scanning electron photomicrograph (SEI) of the interface between lightweight aggregate and cement paste when cement paste type 1 was used. Concrete sample: 112 (30 min). The area to the left is aggregate and the area to right is cement paste. Original magnification: x 750, the picture width: 130 pm.
The cement paste was extensively cracked especially in the case of cement paste type 1. However, these cracks were probably caused by the severe drying procedure during specimen preparation. The specimens were not impregnated. Lightweight aggregate concrete is more sensitive to cracking than normal density concrete. The observed cracks often went along the interface between the aggregate and the cement paste, but sometimes also penetrated into the lightweight aggregate. Since the cracks were empty, they have obviously been formed during the specimen preparation.
Even when cement paste type 2 and prewetted lightweight aggregate was used, the cement paste was very dense. However, some few concentrations of calcium hydroxide were observed near the aggregate surface. An interface containing some calcium hydroxide plates can be seen in Figure 51. The wide crack at the interface is obviously formed during drying of the specimen. Some pores both in the cement paste and in the lightweight aggregate were partly filled by calcium
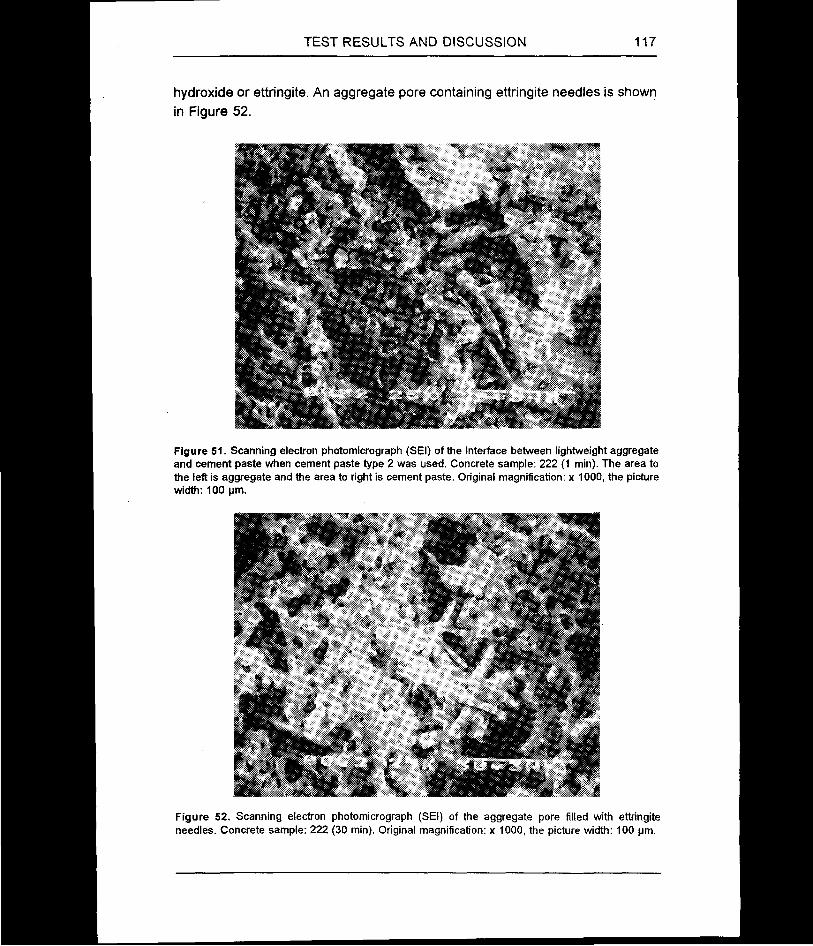
TEST RESULTS AND DISCUSSION 117
hydroxide or ettringite. An aggregate pore containing ettringite needles is shown in Figure 52.
Figure 51. Scanning electron photomicrograph (SEI) of the interface between lightweight aggregate and cement paste when cement paste type 2 was used. Concrete sample: 222 (1 min). The area to the left is aggregate and the area to right is cement paste. Original magnification: x 1000, the picture width: 100 pm.
Figure 52. Scanning electron photomicrograph (SEI) of the aggregate pore filled with ettringite needles. Concrete sample: 222 (30 min). Original magnification: x 1000, the picture width: 100 pm.

118 TEST RESULTS AND DISCUSSION
Backscattered electron imaging
Six concrete samples were analyzed by use of backscattered electron imaging. According to the previous tests, the test concretes with cement paste type 1 had a very good microstructure. In these specimens, no transition zone between the lightweight aggregate and the cement paste could be detected. Therefore, more attention was paid to the concrete with higher water-cement ratio (cement paste type 2). The following concrete samples were analyzed: 211,212, 221, 222, 111 and 214 (all cast 30 min after mixing). Typical backscattered electon images (BSEI) are shown in Figures 53 to 58. The area to the right is aggregate and the area to the left is cement paste. Original magnification: x 360, the picture width: 320 pm.
The interface is normally located where the paste cracks perpendicular to the aggregate surface stop and/or along the cracks parallel to the aggregate surface. All cracks and pores in the cement paste appear dark. The normal weight aggregate particles also appear dark in the back-scattered electron image. The bright areas in the cement paste are unhydrated cement particles. Massive calcium hydroxide can normally be seen as light grey, e g. shown by Zhang and Gjgrv (1990b). Within the lightweight aggregate particles, four colors can be distinguished. The black areas are pores, while the light grey and dark grey areas are the bulk matrix. The color of the bulk matrix obviously varies depending on the chemical composition of the clay. The brightest areas are inert particles. These can be observed as bright white in an optical microscopy.

TEST RESULTS AND DISCUSSION 119
Figure 53. Scanning electron photomicrograph (BSEI) of the interface between lightweight aggregate and cement paste. Concrete sample 211.
Figure 54. Scanning electron photomicrograph (BSEI) of the interface between lightweight aggregateand cement paste. Concrete sample 212.

120 TEST RESULTS AND DISCUSSION
Figure 55. Scanning electron photomicrograph (BSEI) of the interface between lightweight aggregate and cement paste. Concrete sample 221.
Figure 56. Scanning electron photomicrograph (BSEI) of the interface between lightweight aggregateand cement paste. Concrete sample 222.

TEST RESULTS AND DISCUSSION 121
Figure 57. Scanning electron photomicrograph (BSEI) of the interface between lightweight aggregate and cement paste. Concrete sample 111.
Figure 58. Scanning electron photomicrograph (BSEI) of the interface between normal weightaggregate and cement paste. Concrete sample 214.

122 TEST RESULTS AND DISCUSSION
The results of the scanning electron microscopy also indicate that all the concretes had a very dense microstructure. No special concentrations of calcium hydroxide were observed. Also the x-ray line scannings showed very sharp interfaces. The predominant element in the cement paste was calcium and in the lightweight aggregate it was silicon. A poor transition zone would have caused peaks in the calcium content and possibly also in sulfur content. No such peaks were observed. The content of unhydrous cement particles was also suprisingly low both levels of water-cement ratio. As expected, it was distinctly higher in the cement paste type 1 (Figure 57). The content of unhydrous particles was also lower near the interface than in the bulk paste.
The microstructure was dense also when prewetted lightweight aggregate was used. However, for this moisture condition, more porous areas near the interface were observed (see Figures 55 and 56). In some cases, also a clear gap near the aggregate surface was observed.
5.5.4 Concluding remarks
All the concrete samples were high-strength concrete, with effective water- cement ratio (60 min after mixing) varying from 0.32 to 0.42 and final compressive strength varying from 73.5 to 114.8 MPa. Therefore, as expected, all the concrete samples showed a very good and dense microstructure.
The capillary suction tests indicated that the quality of the pore structure was primarily controlled by the effective water-cement ratio. However, also the moisture condition of the aggregate played a significant role. Use of prewetted lightweight aggregate coarsened the pore structure of the cement paste. Use of prewetted aggregate also appeared to form more porous areas locally around the aggregate surface. These porous areas were observed both in the optical and scanning electron microscope.
Dry lightweight aggregate appered to improve the microstructure compared to that of both prewetted aggregate and normal weight aggregate. It appears that the water absorption by the dry aggregate reduces the effective water-cement ratio of the lightweight aggregate concrete compared with that of concrete based on both prewetted aggregate and normal weight aggregate.
6
CONCLUSIONS
While in Norway and most of Europe, the production of high-strength lightweight aggregate concrete is normally based on dry lightweight aggregate, prewetted aggregate is normally used in North America. Different moisture condition, and thus different water absorption by the aggregate, may affect both the fresh and the hardened concrete properties differently. Based on the present experimental program, where the effect of water absorption by three different types of lightweight aggregate was investigated, the following conclusions can be drawn.
1. One type of lightweight aggregate did not show any water absorption ability at all, and did therefore not represent any problem to the concrete production. For the two other more conventional types of high-strength aggregate, the water absorption by the aggregate did not only depend on the aggregate properties, but also on the concrete mixing procedure and the properties of the fresh cement paste. For one of these aggregates which had a very fine pore structure, the ratio of water absorption in fresh concrete to that in pure was practically constant equal 0.6, while for the other type of aggregate having a more coarse pore system, the ratio varied from 0.2 to 0.8 depending on the concrete mixing procedure, the cement paste properties and the time after mixing. When prewetted lightweight aggregate was used, the results indicate that a small amount of water moved out from the aggregate already when the cement paste was in a fresh state.

124 CONCLUSIONS
2. When dry, water absorbing lightweight aggregate was used, the water absorption by the aggregate significantly increased the loss of concrete workability. When prewetted aggregate was used, this effect was eliminated.
3. The water absorption by the lightweight aggregate also affected the early compressive strength of concrete. Thus, after one day, the use of dry aggregate gave on the average 10 MPa higher compressive strength than that of prewetted aggregate. The strength-density ratio was affected by the moisture condition of the aggregate. Thus, dry lightweight aggregate gave 9 MPa higher compressive strength at a density of 2000 kg/m3 compared to that of prewetted aggregate.
4. The water absorption by the lightweight also affected the microstructure of the hardened concrete. Dry lightweight aggregate gave a slightly better microstructure compared to that of normal weight aggregate. When prewetted aggregate was used, a more poor microstructure was obtained compared to that of normal weight aggregate. In particular, the results indicate that the use of prewetted aggregate harmfully affected the transition zone between the aggregate and the cement paste. This effect was more pronounced when the type of aggregate with the finer pore structure was used.
5. By testing the water absorption characteristics of lightweight aggregate, the present investigation clearly demontrates that a simple submersion type of test in pure water does not reflect the actual water absorption taking place by the aggregate in the fresh concrete mixture.
REFERENCES 125
ACI 211.2. 1991. Standard Practice for Selecting Proportions for Structural Lightweight Concrete. Detroit. American Concrete Institute. 14 p.
ACI 213R-87. 1987. Guide for Structural Lightweight Aggregate Concrete. Detroit. American Concrete Institute. 27 p.
ASTM C 173 - 78. 1978. Standard Test Method for Air Content of Freshly Mixed Concrete by the Volumetric Method. The American Society for Testing Materials. 2p.
Anttila, V. and Penttala, V. 1989. Effects of the addition time of the super- plasticizer on the properties of high-strength concrete (in Finnish). Espoo. Helsinki University of Technology, Department of Structural Engineering, Report 102. 128 p.
Bentz, D.P., Garboczi, E.J. and Stutzman, P.E. 1992. Computer Modelling of the Interfacial Zone in Concrete. In: Maso, J.C. (ed.) Interfaces in Cementitious Composites. RILEM Proceedings 18. London. E & FN Spon. pp. 107-116.
Berge, O. 1981. Armerade konstruktioner i lattballastbetong. Doctoral thesis. Goteborg. Chalmers University of Technology, Division of Concrete Structures. Publ. 81:3. 370 p.
Bilodeau, A., Chevrier, R., Malhotra, M. and Hoff, G.C. 1995. Mechanical Properties, Durability and Fire Resistance of High-Strength Lightweight Concrete. In: Third International Symposium on Utilization of High Strength Concrete, Lillehammer. Norwegian Concrete Association. Pp. 744-751. Pp. 432-443.
Bomberg, M. 1974. Moisture flow through porous building materials. Lund. Tekniska hogskolan Lund. 188 p.
Bremner, T.W. and Newman, J.B. 1982. Microstructure of low density concrete aggregate. In: Proceedings of the Ninth Congress of the Federation Internationale de la Precontrainte, volume 3. FIB. Stockholm. Pp. 24-31.
Bremner, T.W. and Holm, T.A. 1986. Elastic Compatibility and the Behavior of Concrete. ACI Journal, March-April, pp. 244-250.
Chiocchio, G. and Paolini, A.E. 1985. Optimum Time for Adding Superplasticizers to Portland Cement Pastes. Cement and Concrete Research 15, pp. 901-908.
Danielsen, S.W. and Ronning, T.F. 1989. Samvirket tilslag - Pasta i herdet belong. Materialutvikling hbyfast belong, Rapport nr 1.2. Trondheim. SINTEF, STF65 A90047. 100 p.
126 REFERENCES
Danielsen, U. 1989. Marine concrete structures exposed to hydrocarbon fires. In: (ed.) Jensen, J.J., Fire Resistance of Concrete. Trondheim. SINTEF. Report STF65 A89036. Pp 56-76.
Diamond, S. 1986. The Microstructure of Cement Paste in Concrete. In: 8th International Congress on the Chemistry of Cement. Rio de Janeiro. Vol. I, pp. 122-147.
Dodson, V.H. 1990. Concrete Admixtures. New York. Van Nostrand Reinhold.211 p.
Fagerlund, G. 1972. Studier av fasgranser ballastkorn - cementpasta i ce- mentbruk och betong. Lund. Tekniska Hogskolen, Lund, Institutionen for Byggnadsteknik, Report 29.
Fagerlund, G. 1982. On the capillarity of concrete. In: Nordic Concrete Research. Oslo. The Nordic Concrete Federation. Publication No. 1. 20 p.
FIP Manual of LWAC. 1983. FIP Manual of Lightweight Aggregate Concrete, Second Edition. Glasgow, Surrey University Press. 259 p.
Goldstein, Takowitz, Newbury, Lifshin, Colby and Coleman. 1975. Practical Scanning Electron Microscopy. London. Plenum Press.
Hammer, T.A. 1990. Marine concrete structures exposed to hydrocarbon fire. Spalling resistance of LWA concrete. Trondheim. SINTEF. Report STF25 A90009. 8 p.
Hammer, T.A., Narum, T. and Smeplass, S. 1991. Bestemmelse av virkelig materialsammensetning. Materialutvikling heyfast betong, Rapport nr 2.6. Trondheim. SINTEF. Report STF65 F91037. 36 p. + 37 app.
Helene, P.R.L., Quinones, J., Monteiro, P.J.M., Trejo, D. and Wang, K. 1992. Performance Analysis of Lightweight Mortar. Berkeley. University of California, Department of Civil Engineering, Report NO. UCB/SEMM-92/10, 90 p.
Helland, S. and Maage, M. 1994. Strength Loss in Unremixed LWA-Concrete. In: Third International Symposium on Utilization of High Strength Concrete, Lillehammer. Norwegian Concrete Association. Pp. 744-751.
Jacobsen, S., Hammer, T.A. and Sellevold, E.J. 1995. Frost Testing High Strength Lightweight Aggregate Concrete: Internal Cracking vs. Scaling. In: International Symposium on Structural Lightweight Aggregate Concrete, Proceedings. Sandefjord. Norwegian Concrete Association. Pp. 541-554.
Johnston, C.D. and Malhotra, V.M. 1987. High-Strength Semi-Lightweight Concrete With Up to 50% Fly Ash by Weight of Cement. Cement, Concrete and Aggregates, Vol. 9, No. 2, pp.101-112.
REFERENCES 127
Khokhrin, N.K. 1973. The durability of lightweight concrete structural members. Kuibyshev, U.S.S.R.
Klieger, P. and Hanson, J.A. 1961. Freezing and thawing tests of lightweight aggregate concrete. AC I Journal, January, pp. 779-796.
LaFraugh, R.W. 1987. Design and Placement of High Strength Lightweight and Normalweight Concrete for Glomar Beaufort Sea I. In: International Symposium on Utilization of High Strength Concrete. Stavanger. Pp. 497-508.
Lydon, F.D. 1969. The problem of water absorption by lightweight aggregates. Magazine of Concrete Research 21, 68, pp. 131-140.
Mailvaganam, N.P. 1979. Factors Influencing Slump Loss in Flowing Concrete. In: Superplasticizers in concrete, Publication SP-62. Detroit. American Concrete Institute. Pp. 389-403.
Malhotra, V.M. 1981. Superplasticizers: Their effect on fresh and hardened concrete. Concrete International 3, 5, pp. 61-88.
Mannonen, R., Penttala, V. and Sihvonen, M.-L. 1995. Efficiency of SNF-Type Superplasticizer in Different Portland Cement Pastes. Helsinki University of Technology. Manuscript.
Milton, J.S. and Arnold, J.C. 1986. Probability and Statistics in the Engineering and Computing Sciences. Singapore. McGraw-Hill Book Company. 643 p.
Mehta, P.K. and Monteiro, P.J.M. 1993. Concrete: Structure, Properties and Materials. Second Edition. Englewood Cliffs. Prentice-Hall, Inc. 548 p.
Monteiro, P.J.M. 1985. Microstructure of Concrete and its Influence on the Mechanical Properties. Berkeley. Ph.D. Thesis, University of California at Berkeley, Department of Civil Engineering. 153 p.
Monteiro, P.J.M., Maso, J.C. and Olliver, J.P. 1985. The Aggregate-Mortar Interface. Cement and Concrete Research 15, pp. 953-958.
Monteiro, P.J.M. and Mehta, P.K. 1986a. Improvent of the Aggregate-Cement Paste Transition Zone by Grain Refinement of Hydration Products. In: 8th International Congress on the Chemistry of Cement. Rio de Janeiro. Vol. Ill, pp. 433-437.
Monteiro, P.J.M. and Mehta, P.K. 1986b. Interaction Between Carbonate Rock and Cement Paste. Cement and Concrete Research 16, 2, pp. 127-134.
Mork, J.H. 1994. Effekt av sementens forhold mellom gips og hemihydrat pa den ferske betongens reologi. Dr.ing. thesis. Trondheim. The Norwegian Institute of Technology, Division of Building Materials. 286 p.
128 REFERENCES
M Oller-Rochholz, J. 1979. Investigation of the absorption of water by lightweight aggregate from cement paste. Journal of Lightweight Concrete 1, 1, pp. 39-41.
Penttala, V. 1990. Possibilities of increasing the workability time of high strength concretes. In: Wierig, H.-J. Properties of Fresh Concrete, RILEM Proceedings. London, pp. 92-100.
Penttala, V. 1993. Effects of Delayed Dosage of Superplasticizer on High- Performance Concrete. In: Third International Symposium on Utilization of High Strength Concrete. Lillehammer. Norwegian Concrete Association. Pp. 874-881.
Perenchio, W.F., Whiting, D A. and Kantro, D.L. 1979. In: Superplasticizers in concrete, Publication SP-62. Detroit. American Concrete Institute. Pp. 137-155.
Punkki, J. 1992. Crushed lightweight aggregate in concrete. Espoo. Helsinki University of Technology, Faculty of Civil Engineering and Surveying. Concrete Technology, Report 1. 123 p. + app. 18 p.
Punkki, J. 1993. Water Absorption by Lightweight Aggregate. Trondheim. The Norwegian Institute of Technology, Division of Building Materials. Report BML 93.502. 64 p. + 89 app.
Punkki, J. and Gjgrv, O.E. 1993. Water Absorption by High-Strength Lightweight Aggregate. In: Third International Symposium on Utilization of High Strength Concrete, Lillehammer. Norwegian Concrete Association. Pp. 713-721.
Punkki, J. and Sellevold, E.J. 1994. Capillary Suction on Concrete: Effects of Drying Procedure. In: Nordic Concrete Research. Oslo. The Nordic Concrete Federation. Publication No. 15. 2/1994. pp. 59-74.
Punkki, J., Golaszewski, J. and Gjgrv, O.E. 1995. Workability Loss of High- Strength Concrete. AC I Material Journal. To be published.
Ramachandran, V.S., Feldman, R.F. and Beaudoin, J.J. 1981. Concrete Science. London. Heyden & Son Ltd. 427 p.
Reichard, T.W. 1964. Creep and Drying Shrinkage of Lightweight and Normal- Weight Concretes. Washington, D C. National Bureau of Standard Monograph 74, 30 p.
Schneider, U. and Chen, S. 1992. The Interface Zone Around Expanded Shale Grain in Hardened Cement Paste. In: Maso, J.C. Interfaces in Cementitious Composites, RILEM Proceedings. London. Pp. 149-156.
Scrivener, K.L., Bentur, A. and Pratt, P.L. 1988. Quantitative characterization of the transition zone in high strength concretes. Advances in Concrete Research 1, 4, pp. 230-237.
REFERENCES 129
Sellevold, E.J. 1986. Bestemmenlse av luft/makro og gel/kapillaer por0sitet samt relativt bindemiddelinnhold. Oslo. Norges byggforskningsinstitutt, Report 01731. 17 p.
Sellevold, E.J. 1987. Rapport om Leca poremalinger. Oslo. Norges byggforskningsinstitutt, Report 01399.
Skarendahl, A. 1973. Lattballast och lattballastbetong. Stockholm. Swedish Cement and Concrete Research Institute at the Royal Institute of Technology, Stockholm, Proceeding NR 47. 110 p.
Slate, F.O., Nilson, A.H. and Martinez, S. 1986. Mechanical Properties of High- Strength Lightweight Concrete. Journal of the American Institute 83, July-August, pp. 606-613.
Smeplass, S., Hammer, T.A. and Narum, T. 1992. Determination of the Effective Composition of LWA Concretes. In: Nordic Concrete Research, Publication No. 11. Oslo. The Nordic Concrete Federation, pp. 153-161.
Smeplass, S. 1995. Effekt av masseforholdet pa lettbetongens trykkfasthet. LICHTCON, Delprosjekt: DP 2 Materialegenskaper, Delrapport: 2.9. Trondheim. SINTEF Konstruksjoner og belong. 26 p.
Smeplass, S., Hammer, T.A. and Sandvik, M. 1995. Production of Structural High Strength LWAC with Initially Dry Aggregates. In: International Symposium on Structural Lightweight Aggregate Concrete, Proceedings. Sandefjord. Norwegian Concrete Association. Pp. 390-396.
STRUBLE, L. and Midness, S. 1983. Morphology of the Cement-Aggregate Bond. International Journal of Cement Composites and Lightweight Concrete 5, 2, pp. 79-86.
Tachibana, D., Kishitani, K., Kimura, K., Shinozaki, A. and Omori, Y. 1994. High- Strength Lightweight Concrete Using High-Performance Artificial Lightweight Aggregate. In: Third International Symposium on Utilization of High Strength Concrete, Proceeding. Lillehammer. Norwegian Concrete Association. Pp. 972- 979.
Tattersal, G.H. 1991. Workability and Quality Control of Concrete. London. E & F.N. Spon Ltd.
Taylor, H.F.W. 1992. Cement Chemistry. London. Academic Press Limited. 475 P
Wallevik, O.H. and Gjorv, O.E. 1990. Development of a coaxial cylinders viscometer for fresh concrete. In: Wiegrig, H.-J. Proceedings of the RILEM Colloquim on Properties of Fresh Concrete. London. Chapman and Hall. Pp. 213-224.
130 REFERENCES
Weber, S. and Reinhardt, H.W. 1995. A Blend of Aggregates to Support Curing of Concrete. In: International Symposium on Structural Lightweight Aggregate Concrete, Proceedings. Sandefjord. Norwegian Concrete Association. Pp. 660- 671.
Wilson, H.S. and Malhotra, V.M. 1988. Development of high strength lightweight concrete for structural applications. The International Journal of Cement Composites and Lightweight Concrete 10, 2, pp. 79-90.
Zhang, M.-H. 1989. Microstructure and Properties of High Strength Lightweight Concrete. Dr.ing. thesis. Trondheim. The Norwegian Institute of Technology, Division of Building Materials. 193 p.
Zhang, M.-H. and Gjorv, O.E. 1990a. Penetration of Cement Paste into Lightweight Aggregate. Bestemmelse av virkelig materialsammensetning. Material- utvikling heyfast betong, Rapport nr 2.6. Trondheim. SINTEF, STF65 F91037.10 P
Zhang, M.-H. and Gjgrv, O.E. 1990b. Microstructure of the Interfacial Zone Between Lightweight Aggregate and Cement Paste. Cement and Concrete Research 20, pp. 610-618.

APPENDICES

APPENDIX A
Table. Corrected proportioning of test concretes.
Test Cement[kg/m3]
Silicafume
[kg/m3]
Vol. of aggregate
[dm3]
Water[kg/m3]
SP[kg/m3]
Air[%]
Eff.w/c-ratio
Effect. Added
111 398 28 693 147 159 9.95 1.1 0.359
112 398 28 695 144 158 9.96 0.9 0.352
114 399 28 697 141 144 9.98 0.5 0.344
121 400 28 699 140 137 9.99 1.1 0.341
122 396 28 696 143 134 9.91 0.8 0.351
131 398 28 695 144 150 9.94 1.1 0.352
132 398 28 699 140 153 9.95 0.9 0.342
211 399 - 681 166 183 3.99 1.5 0.422
212 398 - 682 166 181 3.98 1.9 0.423
214 399 - 683 164 166 3.99 1.1 0.417
221 398 - 683 164 157 3.98 1.4 0.418
222 399 - 684 164 158 3.99 1.3 0.417
231 399 - 682 166 179 3.99 1.5 0.422
232 398 - 679 169 182 3.98 1.6 0.430
Test: Codes see Chapter 4.1.Air: The average of two parallel batchesEff. w/c-ratio: Effective water-cement ratio immediately after mixing
= (effective water + liquid in SP) / (cement + silica fume)

APPENDIX B
Table. Water absorption in pure water. Results of three parallel tests.
Aggregate type Water absorption [wt %]
1 min 4 min 7 min 24 min 44 min 60 min 24 h
HS Leca 800, 3.89 4.63 4.79 5.80 6.41 6.86 9.908-12 mm 3.55 4.65 4.78 5.86 6.48 6.75 10.06
4.22 4.67 5.01 6.15 7.03 7.30 10.44avg 3.89 4.65 4.86 5.94 6.64 6.98 10.13
Liapor 8, 2.94 3.46 3.85 4.82 5.67 5.72 10.418-16 mm 3.01 3.52 3.87 4.85 5.72 5.67 10.44
2.97 3.48 3.94 4.83 5.71 5.77 10.65avg 2.98 3.49 3.89 4.84 5.70 5.72 10.50
HLA, 0.35 0.375-15 mm 0.34 0.37
0.37 0.38avg 0.35 0.37
Nenseth, 0.58 0.584-8 mm 0.57 0.56
0.58 0.58avg 0.58 0.57

APPENDIX C
Table. Water absorption in concrete. Results of three parallel tests.
Water absorption [wt %] Regression analysisTest 3 min 20 min 40 min 57 min Constant
[%]Coefficient
[%/min]R2
1.55 3.53 3.66 4.06 1.93 0.0417 0.761111 2.04 3.30 3.58 4.61 2.06 0.0435 0.937
2.47 2.14 3.43 3.97 2.02 0.0322 0.801
2.59 2.75 3.98 3.25 2.60 0.0182 0.467112 2.19 3.06 3.07 3.57 2.30 0.0225 0.853
2.05 2.85 3.10 3.25 2.18 0.0210 0.857
0.12 0.63 0.42 0.20 0.34 0 0114 0.06 0.22 0.29 0.45 0.05 0.0068 0.969
0.18 0.31 0.21 -0.01 0.28 -0.0037 0.422
-0.70 -0.73 -0.78 -0.89 -0.67 -0.0034 0.915121 -0.31 -0.20 -1.73 -1.29 -0.13 -0.0252 0.627
-0.75 -0.62 -0.90 -1.47 -0.53 -0.0134 0.709
-1.50 -1.68 -2.39 -0.10 -1.97 0.0185 0.206122 -2.39 -1.12 -1.34 -1.74 -1.93 0.0093 0.152
-0.72 -1.41 -0.51 -0.83 -0.98 0.0036 0.049
0.94 1.97 1.95 3.18 0.92 0.0364 0.870131 0.94 1.86 2.14 3.63 0.78 0.0455 0.918
0.98 1.62 1.94 2.43 0.98 0.0255 0.976
1.90 2.87 2.74 2.43 2.25 0.0078 0.183132 1.91 2.58 2.85 2.62 2.09 0.0132 0.588
2.12 2.44 2.39 3.01 2.06 0.0142 0.795
2.97 4.09 5.65 5.63 3.00 0.0527 0.907211 2.37 3.97 5.38 5.92 2.42 0.0663 0.962
2.91 3.45 4.61 4.96 2.77 0.0404 0.971
2.45 2.96 4.60 3.73 2.51 0.0307 0.593212 2.39 3.43 3.60 3.91 2.56 0.0258 0.846
2.76 3.12 3.67 4.37 2.59 0.0295 0.980
0.04 0.12 0.27 0.50 -0.02 0.0084 0.46214 0.04 0.40 0.43 0.03 0.22 0 0
0.28 0.20 0.33 0.67 0.16 0.0071 0.39
-1.17 -1.45 -1.42 -0.60 -1.44 0.0095 0.319221 -0.63 -2.06 -1.01 -1.02 -1.18 0 0
-1.26 -0.45 -0.98 -1.21 -0.90 0.0230 0.023
-1.35 -1.41 -1.47 -2.10 -1.21 -0.0126 0.720222 -0.63 -0.52 -1.26 -1.81 -0.34 -0.0237 0.862
-0.91 -0.46 -0.38 0.72 -1.07 0.027 0.843
2.14 2.88 3.86 3.77 2.19 0.0325 0.882231 2.62 3.52 3.82 4.90 2.54 0.0390 0.949
1.72 3.15 3.15 3.57 1.99 0.0300 0.766
2.53 2.84 3.28 3.28 2.54 0.0149 0.911232 2.01 2.71 3.16 3.44 2.05 0.0260 0.960
2.45 2.88 3.16 4.50 2.20 0.0351 0.869
Test: Codes see Chapter 4.1.

APPENDIX D
Table. Results of slump tests. Results of three parallel tests.
TestSlump [mm] Slump
difference[mm]
Slumpratio[%]
Slumphalf-live
[min]1 min 15 min 30 min 45 min 60 min
220 190 185 115 85 135 39 48111 225 190 160 125 65 160 29 48
215 185 175 115 105 110 49 56
240 210 145 115 30 210 13 43112 245 230 185 120 105 140 43 44
235 175 130 40 30 205 13 32
210 200 195 190 180 30 86 173114 210 215 210 190 175 35 83 130
210 210 190 175 145 65 69 80
230 205 190 185 165 65 72 98121 215 195 190 185 160 55 74 92
200 210 190 180 160 40 80 105
235 240 195 170 150 85 64 83122 240 235 215 200 180 60 75 105
240 225 210 200 140 100 58 65
210 185 120 90 20 190 10 38131 230 185 115 90 25 205 11 30
220 180 135 90 15 205 7 38
250 180 135 100 25 225 10 33132 245 225 200 120 120 125 49 45
220 175 135 45 25 195 11 34
190 20 20 5 5 185 3 9211 195 125 10 5 5 190 3 19
190 145 35 5 5 185 3 22
150 75 45 15 10 140 7 15212 175 130 55 25 20 155 11 24
180 135 25 20 10 170 6 21
175 130 80 50 45 130 26 28214 190 135 95 80 55 135 29 30
185 125 70 55 35 150 19 24
190 145 120 55 25 165 13 38221 200 150 130 120 30 170 15 48
175 120 95 35 30 145 17 32
185 165 135 110 55 130 30 50222 200 160 145 50 55 145 28 27
180 125 135 55 40 140 22 38
170 130 35 10 5 165 3 22231 170 130 35 5 5 165 3 22
165 125 15 5 5 160 3 21
145 100 40 20 10 135 7 22232 150 135 70 25 15 135 10 29
150 45 20 10 5 145 3 11
Test:Slump difference: Slump ratio: Slump half-live:
Codes see Chapter 4.1.Slump (1 min) - Slump (60 min)Slump (60 min) Z Slump (1 min) * 100 % See Chapter 4.4.2
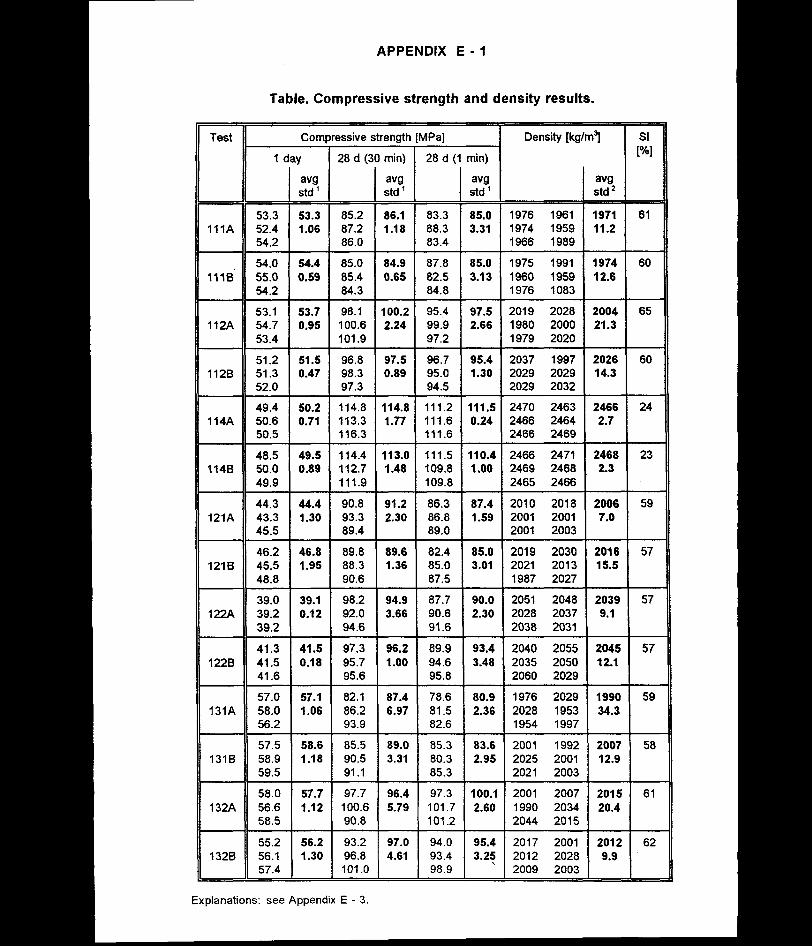
APPENDIX E - 1
Table. Compressive strength and density results.
Test Compressive strength [MPa] Density [kg/m3] SI[%]
1 day
avgstd1
28 d (3(3 min)
avgstd1
28 d (1 min)
avg std1
avgstd2
53.3 53.3 85.2 86.1 83.3 85.0 1976 1961 1971 61111A 52.4 1.06 87.2 1.18 88.3 3.31 1974 1959 11.2
54.2 86.0 83.4 1966 1989
54.0 54.4 85.0 84.9 87.8 85.0 1975 1991 1974 60111B 55.0 0.59 85.4 0.65 82.5 3.13 1960 1959 12.6
54.2 84.3 84.8 1976 1083
53.1 53.7 98.1 100.2 95.4 97.5 2019 2028 2004 65112A 54.7 0.95 100.6 2.24 99.9 2.66 1980 2000 21.3
53.4 101.9 97.2 1979 2020
51.2 51.5 96.8 97.5 96.7 95.4 2037 1997 2026 60112B 51.3 0.47 98.3 0.89 95.0 1.30 2029 2029 14.3
52.0 97.3 94.5 2029 2032
49.4 50.2 114.8 114.8 111.2 111.5 2470 2463 2466 24114A 50.6 0.71 113.3 1.77 111.6 0.24 2466 2464 2.7
50.5 116.3 111.6 2466 2469
48.5 49.5 114.4 113.0 111.5 110.4 2466 2471 2468 23114B 50.0 0.89 112.7 1.48 109.8 1.00 2469 2468 2.3
49.9 111.9 109.8 2465 2466
44.3 44.4 90.8 91.2 86.3 87.4 2010 2018 2006 59121A 43.3 1.30 93.3 2.30 86.8 1.59 2001 2001 7.0
45.5 89.4 89.0 2001 2003
46.2 46.8 89.8 89.6 82.4 85.0 2019 2030 2016 57121B 45.5 1.95 88.3 1.36 85.0 3.01 2021 2013 15.5
48.8 90.6 87.5 1987 2027
39.0 39.1 98.2 94.9 87.7 90.0 2051 2048 2039 57122A 39.2 0.12 92.0 3.66 90.6 2.30 2028 2037 9.1
39.2 94.6 91.6 2038 2031
41.3 41.5 97.3 96.2 89.9 93.4 2040 2055 2045 57122B 41.5 0.18 95.7 1.00 94.6 3.48 2035 2050 12.1
41.6 95.6 95.8 2060 2029
57.0 57.1 82.1 87.4 78.6 80.9 1976 2029 1990 59131A 58.0 1.06 86.2 6.97 81.5 2.36 2028 1953 34.3
56.2 93.9 82.6 1954 1997
57.5 58.6 85.5 89.0 85.3 83.6 2001 1992 2007 58131B 58.9 1.18 90.5 3.31 80.3 2.95 2025 2001 12.9
59.5 91.1 85.3 2021 2003
58.0 57.7 97.7 96.4 97.3 100.1 2001 2007 2015 61132A 56.6 1.12 100.6 5.79 101.7 2.60 1990 2034 20.4
58.5 90.8 101.2 2044 2015
55.2 56.2 93.2 97.0 94.0 95.4 2017 2001 2012 62132B 56.1 1.30 96.8 4.61 93.4 3.25 2012 2028 9.9
57.4 101.0 98.9 2009 2003
Explanations: see Appendix E - 3.

APPENDIX E - 2
Table. Compressive strength and density results.
Test Compressive strength MPa] Density [kg/m3] SI[%]1 d ay
avg std1
28 d (3( min)
avg std1
28 d (1 min)
avgstd'
avgstd2
48.7 48.7 81.4 80.4 77.1 79.5 1941 1959 1951 60211A 48.5 0.18 79.3 1.24 82.1 2.95 1946 1948 7.7
48.8 80.4 79.4 1961 1950
46.9 47.3 81.2 79.9 78.5 78.7 1929 1958 1945 60211B 47.4 0.47 79.1 1.24 74.0 5.73 1968 1933 16.8
47.7 79.4 83.7 1929 1952
38.2 38.0 79.0 79.2 76.3 76.7 1956 1946 1951 59212A 38.0 0.18 79.2 0.24 77.7 1.00 1959 1951 5.9
37.9 79.4 76.0 1944 1948
38.6 38.7 81.2 82.2 81.0 81.3 1968 1962 1977 57212B 38.8 0.12 82.7 0.89 80.5 1.18 1950 2008 21.1
38.8 82.7 82.5 1986 1989
33.6 33.8 81.6 81.1 84.8 84.1 2434 2440 2432 18214A 33.4 0.53 80.6 0.59 84.1 0.77 2430 2428 4.3
34.3 81.1 83.5 2430 2432
31.5 31.8 81.9 81.5 82.5 82.5 2436 2431 2433 18214B 32.3 0.47 80.6 0.89 81.8 0.77 2430 2436 3.2
31.5 82.1 83.1 2435 2429
35.6 35.6 76.5 75.1 77.7 75.4 1967 1977 1970 53221A 35.3 0.29 74.8 1.54 74.6 2.19 1966 1982 9.3
35.8 73.9 74.0 1956 1974
36.4 36.5 72.0 73.5 74.6 73.7 1955 1981 1971 52221B 35.9 0.77 74.8 1.65 71.6 2.01 1966 1981 10.3
37.2 73.8 75.0 1977 1967
26.2 26.1 76.5 75.8 74.8 74.4 2019 1998 2008 49222A 25.4 0.71 76.5 1.18 72.8 1.71 2021 1983 17.8
26.6 74.5 75.7 2029 1997
28.5 28.3 74.7 74.7 72.0 74.1 1991 1989 1991 50222B 28.1 0.24 73.5 1.36 74.2 2.48 1981 1999 9.3
28.3 75.8 76.2 1980 2003
47.8 47.7 84.2 83.3 76.8 78.0 1963 1971 1965 60231A 46.5 1.30 84.7 2.24 80.2 2.01 1965 1972 10.9
48.7 80.9 77.1 1944 1973
44.4 45.1 78.8 79.0 80.6 78.7 1944 1954 1947 59231B 45.5 0.65 78.0 1.24 78.8 2.30 1937 1958 7.9
45.5 80.1 76.7 1946 1941
36.7 35.9 81.5 79.3 75.6 76.0 1952 1953 1961 57232A 35.6 0.77 78.4 2.01 74.6 1.89 1954 1968 10.6
35.4 78.1 77.8 1979 1961
37.0 36.2 80.3 81.8 80.9 79.4 1975 1957 1977 57232B 36.0 0.83 80.4 2.66 76.4 2.66 1987 1985 10.8
35.6 84.8 80.9 1981 1979
Explanations: see Appendix E - 3.

APPENDIX E - 3
Explanations:
Test:avg:std:
Codes; see Chapter 4.1. A and B: two parallel batches AverageStandard deviation
28 d (30 min):28 d (1 min):SI:
std1 : Equation 15 std2 : Equation 16Specimens cast 30 min after mixingSpecimens cast 1 min after mixingStrength index (see Chapter 4.4.3)

APPENDIX F - 1
Table. Analysis of variance for the compressive strength of 1 day. Normal density concretes are not included. R2 = 0.991.
Source DF SS F P Significancy
Cement paste (A) 1 940.00 609.40 0.0000 significant
Moisture condition (B) 2 706.46 229.00 0.0000 significant
Aggregate type (C) 1 219.61 142.38 0.0000 significant
A * B 2 41.776 13.54 0.0008 significant
O<
1 76.327 49.48 0.0000 sigfinicant
B ‘ C 2 3.1825 1.03 0.3860 insignificant
A* B * C 2 9.9058 3.21 0.0764 insignificant
Error 12 18.510 - - -
Total 23 2015.8 - - -
Table. Analysis of variance for the compressive strength of 28 days (specimens prepared 30 min after mixing). Normal density concretes are not included. R2 = 0.983.
Source DF SS F P Significancy
Cement paste (A) 1 1170.4 534.64 0.0000 significant
Moisture condition (B) 2 41.560 9.49 0.0034 significant
Aggregate type (C) 1 123.31 56.33 0.0000 significant
A * B 2 63.043 14.40 0.0006 significant
A* C 1 119.71 54.68 0.0000 sigfinicant
B * C 2 19.083 4.36 0.0378 significant
A * B * C 2 15.623 3.57 0.0608 insignificant
Error 12 26.270 „ - -
Total 23 1579.0 - - -

APPENDIX F - 2
Table. Analysis of variance for the compressive strength of 28 days (specimens prepared 1 min after mixing). Normal density concretes are not included. R2 = 0.967.
Source DF SS F P Significancy
Cement paste (A) 1 955.08 252.61 0.0000 significant
Moisture condition (6) 2 39.116 5.17 0.0240 significant
Aggregate type (C) 1 171.73 45.42 0.0000 significant
A* B 2 7.6108 1.01 0.3944 insignificant
O<
1 179.31 47.43 0.0000 sigfinicant
B * C 2 20.342 2.69 0.1083 insignificant
A * B * C 2 30.811 4.07 0.0446 significant
Error 12 45.370 - - -
Total 23 1449.4 - - -
Table. Analysis of variance for the difference between the compressive strength of the specimens prepared 30 min and 1 min after mixing (28 days compressive strength). Normal density concretes are not included. R2 = 0.729.
Source DF SS F P Significancy
Cement paste (A) 1 7.4817 2.75 0.1231 insignificant
Moisture condition (B) 2 6.1658 1.13 0.3540 insignificant
Aggregate type (C) 1 2.0417 0.75 0.4032 insignificant
A * B 2 19.456 3.58 0.0604 insignificant
A * C 1 9.1267 3.36 0.0919 insigfinicant
CD O 2 25.766 4.74 0.0304 significant
> CO o 2 17.786 3.27 0.0735 insignificant
Error 12 32.630 - - -
Total 23 120.45 - - -
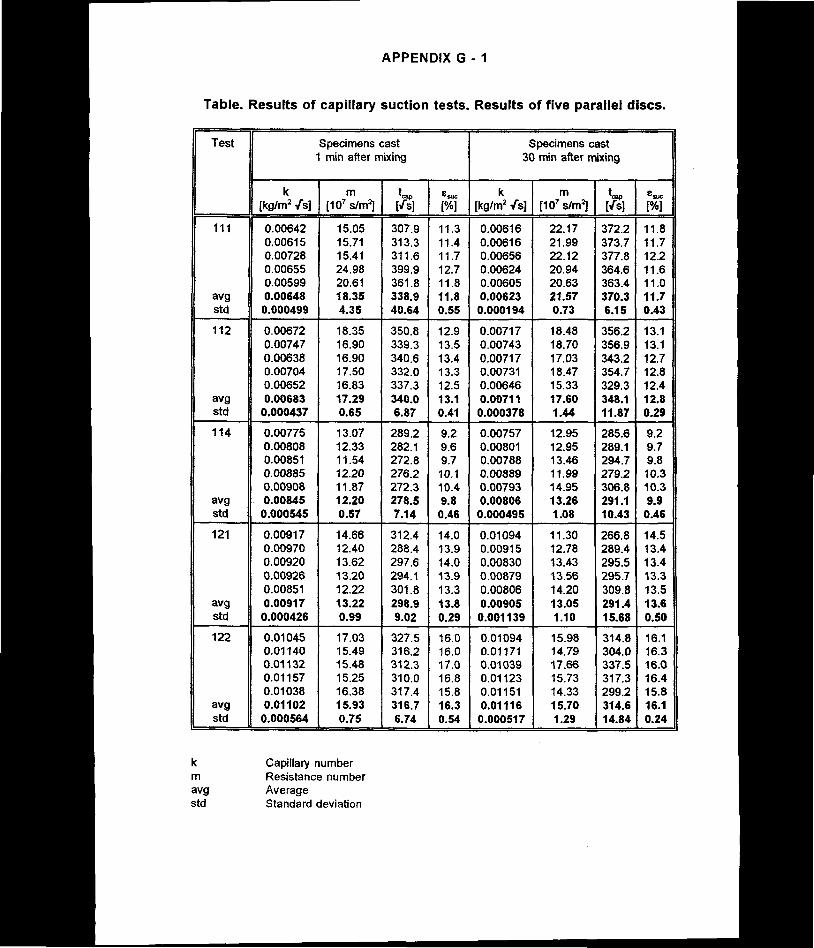
APPENDIX G - 1
Table. Results of capillary suction tests. Results of five parallel discs.
Test Specimens cast1 min after mixing
Specimens cast30 min after mixing
k m V Csuc k m ‘-p ®SUC
[kg/m2 /s] [107 s/m2] [Vs] [%] [kg/m2 Vs] [107 s/m2] [Vs] [%]
111 0.00642 15.05 307.9 11.3 0.00616 22.17 372.2 11.80.00615 15.71 313.3 11.4 0.00616 21.99 373.7 11.70.00728 15.41 311.6 11.7 0.00656 22.12 377.8 12.20.00655 24.98 399.9 12.7 0.00624 20.94 364.6 11.60.00599 20.61 361.8 11.8 0.00605 20.63 363.4 11.0
avg 0.00648 18.35 338.9 11.8 0.00623 21.57 370.3 11.7std 0.000499 4.35 40.64 0.55 0.000194 0.73 6.15 0.43
112 0.00672 18.35 350.8 12.9 0.00717 18.48 356.2 13.10.00747 16.90 339.3 13.5 0.00743 18.70 356.9 13.10.00638 16.90 340.6 13.4 0.00717 17.03 343.2 12.70.00704 17.50 332.0 13.3 0.00731 18.47 354.7 12.80.00652 16.83 337.3 12.5 0.00646 15.33 329.3 12.4
avg 0.00683 17.29 340.0 13.1 0.00711 17.60 348.1 12.8std 0.000437 0.65 6.87 0.41 0.000378 1.44 11.87 0.29
114 0.00775 13.07 289.2 9.2 0.00757 12.95 285.6 9.20.00808 12.33 282.1 9.6 0.00801 12.95 289.1 9.70.00851 11.54 272.8 9.7 0.00788 13.46 294.7 9.80.00885 12.20 276.2 10.1 0.00889 11.99 279.2 10.30.00908 11.87 272.3 10.4 0.00793 14.95 306.8 10.3
avg 0.00845 12.20 278.5 9.8 0.00806 13.26 291.1 9.9std 0.000545 0.57 7.14 0.46 0.000495 1.08 10.43 0.46
121 0.00917 14.66 312.4 14.0 0.01094 11.30 266.8 14.50.00970 12.40 288.4 13.9 0.00915 12.78 289.4 13.40.00920 13.62 297.6 14.0 0.00830 13.43 295.5 13.40.00926 13.20 294.1 13.9 0.00879 13.56 295.7 13.30.00851 12.22 301.8 13.3 0.00806 14.20 309.8 13.5
avg 0.00917 13.22 298.9 13.8 0.00905 13.05 291.4 13.6std 0.000426 0.99 9.02 0.29 0.001139 1.10 15.68 0.50
122 0.01045 17.03 327.5 16.0 0.01094 15.98 314.8 16.10.01140 15.49 316.2 16.0 0.01171 14.79 304.0 16.30.01132 15.48 312.3 17.0 0.01039 17.66 337.5 16.00.01157 15.25 310.0 16.8 0.01123 15.73 317.3 16.40.01038 16.38 317.4 15.8 0.01151 14.33 299.2 15.8
avg 0.01102 15.93 316.7 16.3 0.01116 15.70 314.6 16.1std 0.000564 0.75 6.74 0.54 0.000517 1.29 14.84 0.24
k Capillary numberm Resistance numberavg Averagestd Standard deviation
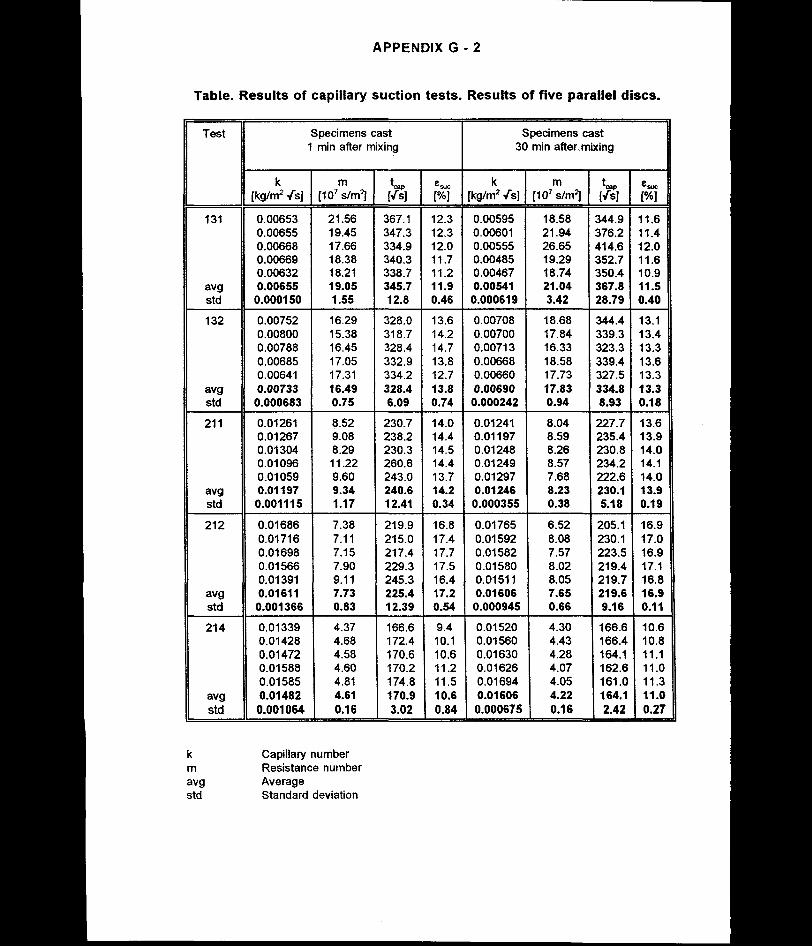
APPENDIX G - 2
Table. Results of capillary suction tests. Results of five parallel discs.
Test Specimens cast1 min after mixing
Specimens cast30 min after mixing
k m w ®suc k m ‘cap 8ajc[kg/m2 Vs] [107 s/m2] [Vs] [%] [kg/m2 Vs] [107 s/m2] [Vs] [%]
131 0.00653 21.56 367.1 12.3 0.00595 18.58 344.9 11.60.00655 19.45 347.3 12.3 0.00601 21.94 376.2 11.40.00668 17.66 334.9 12.0 0.00555 26.65 414.6 12.00.00669 18.38 340.3 11.7 0.00485 19.29 352.7 11.60.00632 18.21 338.7 11.2 0.00467 18.74 350.4 10.9
avg 0.00655 19.05 345.7 11.9 0.00541 21.04 367.8 11.5std 0.000150 1.55 12.8 0.46 0.000619 3.42 28.79 0.40
132 0.00752 16.29 328.0 13.6 0.00708 18.68 344.4 13.10.00800 15.38 318.7 14.2 0.00700 17.84 339.3 13.40.00788 16.45 328.4 14.7 0.00713 16.33 323.3 13.30.00685 17.05 332.9 13.8 0.00668 18.58 339.4 13.60.00641 17.31 334.2 12.7 0.00660 17.73 327.5 13.3
avg 0.00733 16.49 328.4 13.8 0.00690 17.83 334.8 13.3std 0.000683 0.75 6.09 0.74 0.000242 0.94 8.93 0.18
211 0.01261 8.52 230.7 14.0 0.01241 8.04 227.7 13.60.01267 9.08 238.2 14.4 0.01197 8.59 235.4 13.90.01304 8.29 230.3 14.5 0.01248 8.26 230.8 14.00.01096 11.22 260.6 14.4 0.01249 8.57 234.2 14.10.01059 9.60 243.0 13.7 0.01297 7.68 222.6 14.0
avg 0.01197 9.34 240.6 14.2 0.01246 8.23 230.1 13.9std 0.001115 1.17 12.41 0.34 0.000355 0.38 5.18 0.19
212 0.01686 7.38 219.9 16.8 0.01765 6.52 205.1 16.90.01716 7.11 215.0 17.4 0.01592 8.08 230.1 17.00.01698 7.15 217.4 17.7 0.01582 7.57 223.5 16.90.01566 7.90 229.3 17.5 0.01580 8.02 219.4 17.10.01391 9.11 245.3 16.4 0.01511 8.05 219.7 16.8
avg 0.01611 7.73 225.4 17.2 0.01606 7.65 219.6 16.9std 0.001366 0.83 12.39 0.54 0.000945 0.66 9.16 0.11
214 0.01339 4.37 166.6 9.4 0.01520 4.30 166.6 10.60.01428 4.68 172.4 10.1 0.01560 4.43 166.4 10.80.01472 4.58 170.6 10.6 0.01630 4.28 164.1 11.10.01588 4.60 170.2 11.2 0.01626 4.07 162.6 11.00.01585 4.81 174.8 11.5 0.01694 4.05 161.0 11.3
avg 0.01482 4.61 170.9 10.6 0.01606 4.22 164.1 11.0std 0.001064 0.16 3.02 0.84 0.000675 0.16 2.42 0.27
k Capillary numberm Resistance numberavg Averagestd Standard deviation
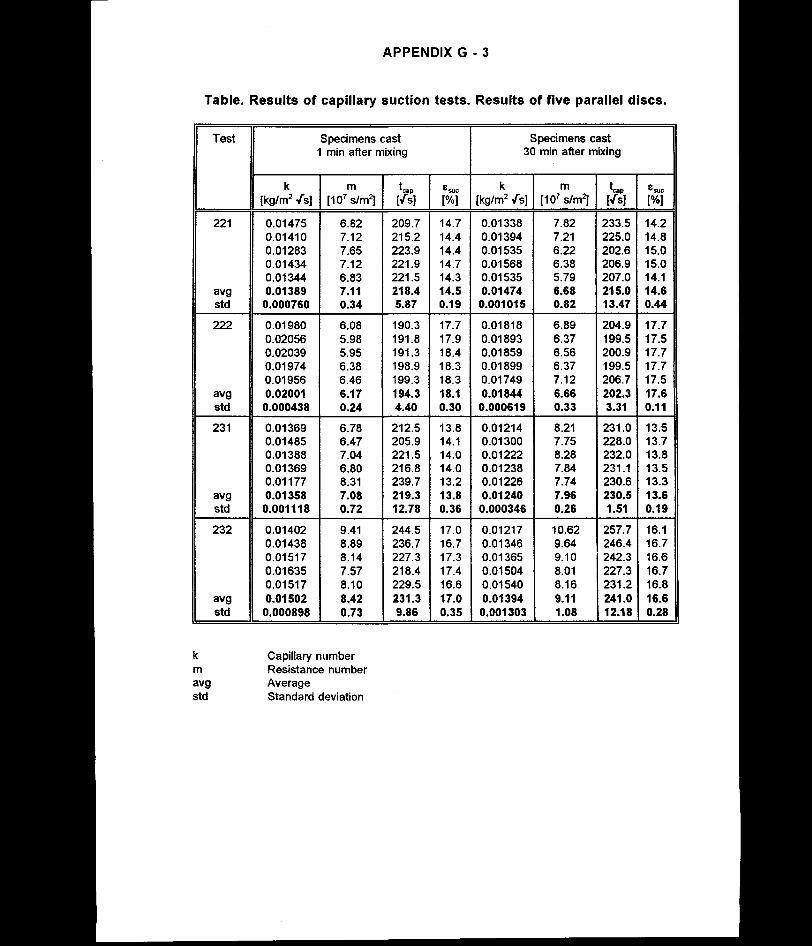
APPENDIX G - 3
Table. Results of capillary suction tests. Results of five parallel discs.
Test Specimens cast1 min after mixing
Specimens cast30 min after mixing
k m u ®SUC k m v ®sue[kg/m2 /s] [107 s/m2] [Vs] [%] [kg/m2 Vs] [10' s/m2] [Vs] [%]
221 0.01475 6.82 209.7 14.7 0.01338 7.82 233.5 14.20.01410 7.12 215.2 14.4 0.01394 7.21 225.0 14.80.01283 7.65 223.9 14.4 0.01535 6.22 202.6 15.00.01434 7.12 221.9 14.7 0.01568 6.38 206.9 15.00.01344 6.83 221.5 14.3 0.01535 5.79 207.0 14.1
avg 0.01389 7.11 218.4 14.5 0.01474 6.68 215.0 14.6std 0.000760 0.34 5.87 0.19 0.001015 0.82 13.47 0.44
222 0.01980 6.08 190.3 17.7 0.01818 6.89 204.9 17.70.02056 5.98 191.8 17.9 0.01893 6.37 199.5 17.50.02039 5.95 191.3 18.4 0.01859 6.56 200.9 17.70.01974 6.38 198.9 18.3 0.01899 6.37 199.5 17.70.01956 6.46 199.3 18.3 0.01749 7.12 206.7 17.5
avg 0.02001 6.17 194.3 18.1 0.01844 6.66 202.3 17.6std 0.000438 0.24 4.40 0.30 0.000619 0.33 3.31 0.11
231 0.01369 6.78 212.5 13.8 0.01214 8.21 231.0 13.50.01485 6.47 205.9 14.1 0.01300 7.75 228.0 13.70.01388 7.04 221.5 14.0 0.01222 8.28 232.0 13.80.01369 6.80 216.8 14.0 0.01238 7.84 231.1 13.50.01177 8.31 239.7 13.2 0.01226 7.74 230.6 13.3
avg 0.01358 7.08 219.3 13.8 0.01240 7.96 230.5 13.6std 0.001118 0.72 12.78 0.36 0.000346 0.26 1.51 0.19
232 0.01402 9.41 244.5 17.0 0.01217 10.62 257.7 16.10.01438 8.89 236.7 16.7 0.01346 9.64 246.4 16.70.01517 8.14 227.3 17.3 0.01365 9.10 242.3 16.60.01635 7.57 218.4 17.4 0.01504 8.01 227.3 16.70.01517 8.10 229.5 16.6 0.01540 8.16 231.2 16.8
avg 0.01502 8.42 231.3 17.0 0.01394 9.11 241.0 16.6std 0.000898 0.73 9.86 0.35 0.001303 1.08 12.18 0.28
k Capillary numberm Resistance numberavg Averagestd Standard deviation