effect of washing water ph on color and lipid oxidation of mince and surimi
TRANSCRIPT
EFFECT OF WASHING WATER pH ON COLOR AND LIPIDOXIDATION OF MINCE AND SURIMI MADE FROM GULF MENHADEN
J. L. Silva1, R. Eddari-Lynn, M. Jahncke2
and J. O. Hearnsberger3
1Department of Food Science and Technology, Box 9805,Mississippi State Univ., Miss. State, MS 39762;
and 2National Seafood Inspection Laboratory,National Marine Fisheries Service, Pascagoula, MS.
3Deceased
INTRODUCTION
The period 1975-1987 witnessed a market growth in the consumption and/Oracceptance. Of surimi, minced and water-washed fish muscle tissues, in the form ofmanufactured items such as shellfish analogs. The estimated U.S. supply of surimi products increased from 2.7 to over 45.4 million kg during this same period(Vondruska, 1987).
Diverse species of fish have been used as raw material for surimi. Alaskapollock (Theragra chalcogrumma ) has been the primary fish used for crableg analogs but recently access to U.S. fishermen has been limited by the U.S. declarationof a 200-mile fisheries conservation zone. In addition, due to fishing pressure,alternative species such as Atlantic and Gulf menhaden (Brevoortia patronus and B.tyrannus, respectively) and Pacific whiting (Merluccius productus) have beeninvestigated for surimi production. A growing interest in the use of dark-fleshed fishspecies for mince and surimi has developed during the so-called “Age of EngineeredSeafoods”. Dark-fleshed, oily fish have been traditionally used for feed, oil andfertilizer production. With the increasing realization of the potential health benefitsof engineered seafoods, red-fleshed, oily fish species are now regarded as possiblesources of omega-3 unsaturated fatty acids in the diet (Lanier et al., 1988).
U.S. commercial fisheries landings for Gulf menhaden were 539,200 mt in1993 (NMFS, 1993). Gulf menhaden are regarded as an industrial fish species.Before these fish can be utilized for human consumption, various problems need tobe addressed For instance, the improper on-board handling and storage of these fish,the lack of processing equipment suitable for heading and eviscerating small-sizedfish, and the fact that these fish are fatty and dark-fleshed fish make themunacceptable for direct human consumption (Babbitt, 1986). However, due to itsgood gelling properties (Anonymous, 1989), menhaden has a potential as a protein
matrix in which other seafoods could be combined to formulate various seafoodproducts if flavor and color of the mince could be improved.
This work was to evaluate the effects of various pH buffered water-washingtreatments on the Hunter color, hematin content, carotenoid content, TBA and,carbonyl values of menhaden mince and on moisture content of the gel.
MATERIALS AND METHODS
Preparation of Fish Mince
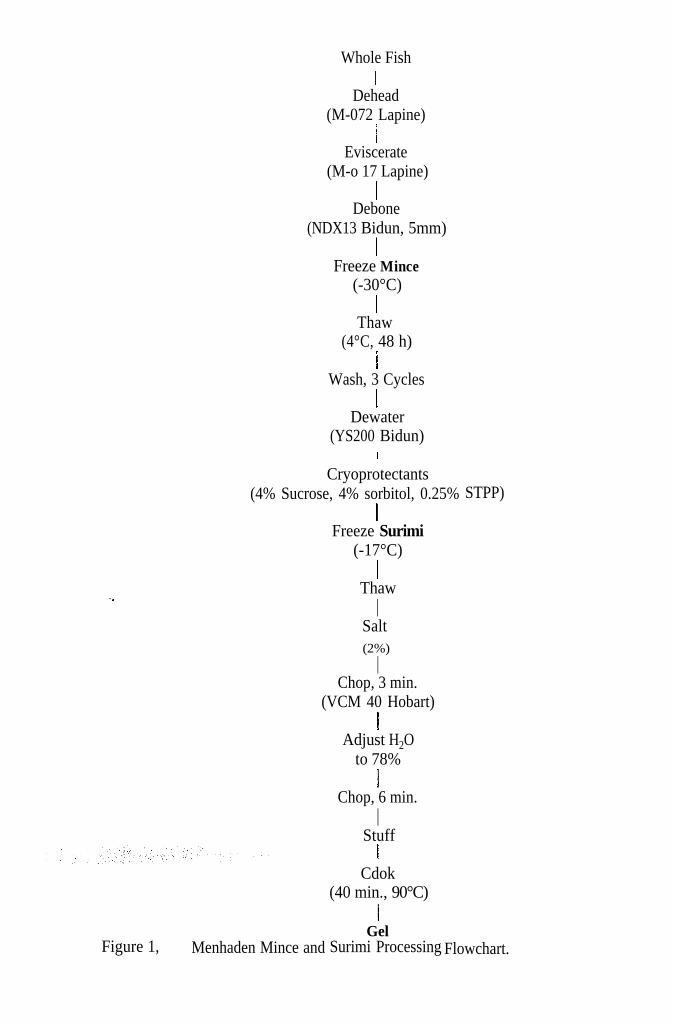
Gulf menhaden were caught off the Florida coast, chilled and held in slush ice(1 to 3°C) on the boat until processed (< 48h). The fish were transported to theMississippi State University (MSU)/National Marine Fisheries (NMFS) ExperimentalSeafood Processing Laboratory at the Coastal Research and Extension Center,Pascagoula, MS. About 113 kg of fish were processed (Fig. 1) in June 9, July 23, andJuly 28, 1992 using commercial equipment: a Model M-072 Lapine Fish HeadingMachine and a Model M-017 Lapine Fish Gutting Machine (Pisces Industries, Ltd.,Wells, MI).
The dressed fish exited the cutting area to enter a Model NDX13 deboner with5-mm holes (Bidun Machine Construction Co., Ltd., Japan) to separate fish flesh frombones, skin and scales. The deboning process is also called a mincing process. Aportion of the nonrefmed menhaden mince recovered from the dressed fish (about14kg for each replication) was placed in wax coated storage boxes. The boxes (1.6to 1.65kg) were stored in the walk-in freezer (-30°C) until they were shippedovernight on dry ice to the MSU Food Processing Laboratory, Miss. State, MS. Theboxes were then stored in a walk-in freezer (-17°C) upon arrival on campus.
pH Washing Treatments
The mechanically deboned fish muscle (MDFM) was thawed at 4°C for 48 hbefore use.
Buffer PreparationPhosphate buffers of pH 5.0, 6.0, 7.0, 8.0, 9.0, and 10.0, ± 0.2 and same ionic
strength were prepared with analytical grade NaH2PO4.H2O and Na2HPO4, (FisherScientific, Fair Lawn, NJ) by the procedures of Gomori (1955). Chilled distilledwater was used to make the different buffer solutions which were then stored at 4°Cuntil used.
Buffer and Water WashingsThere were seven pH treatments, including a control (potable water, pH =
6.8). The washing process called for a batch wash system as follows:- First cycle (4 parts of water to 1 part of mince): One kilogram of MDFM was
Whole FishI
Dehead(M-072 Lapine)
IEviscerate
(M-o 17 Lapine)I
Debone(NDX13 Bidun, 5mm)
IFreeze Mince
(-30°C)I
Thaw(4°C, 48 h)
IWash, 3 Cycles
1I
Dewater(YS200 Bidun)
STPP)Cryoprotectants
(4% Sucrose, 4% sorbitol, 0.25%I
Freeze Surimi(-17°C)
IThaw
ISalt(2%)
IChop, 3 min.
(VCM 40 Hobart)I
Adjust H2Oto 78%
IChop, 6 min.
IStuff
Cdok(40 min., 90°C)
Figure 1,Gel
Menhaden Mince and Surimi Processing Flowchart.
washed with four liters of phosphate buffer at different pHs at 4°C. The mixture wasmanually stirred for 3 min, allowed to settle for 15 min and filtered through a doublelayer of fine cheese cloth. The water was pressed out by hand and floating particlesof fat were removed.
- Second and third cycles (5 parts of water to 1 part of mince): The fish paste fromthe first cycle was washed with five liters of potable water at 4°C. In the 3rd cycle,0.15% (w/w) of NaCl was added. After each cycle, the mixture was hand stirred for3 min, allowed to settle for 5 mm and then filtered through a double layer of finecheese cloth. The fish paste was further pressed using a Model YS200 ScrewDehydrator (Bidun Machine Construction Co., Ltd., Japan) to reduce the moisturecontent. Washed meat was weighed to separate samples used for different chemicalanalyses from the one used for the preparation of the gels.
Preparation of Surimi Gels
The fish paste was mixed with 4% sucrose (commercial granulated refmedsugar), 4% sorbitol (Neosorb 20/60, Roqueete Corporation, Gurnee, IL) and 0.25%sodium tripolyphosphate (BK-Landenburg, Corp., Cresskill, NJ) on a w/w basis in ahousehold mixer (Kitchenaid, Hobart Manufacturing Company, Troy, OH) (Fig. 1).The total mixing time was 3 min at speed 4; subsequently, the surimi was stored in a0.076-mm polyethylene bag at -20°C until used.
The surimi was thawed overnight in a refrigerator then chopped with 2%(w/w) NaCl in a silent cutter (Model VCM40, Hobart Manufacutring Company, Troy,OH) for 3 min. An additional 6 min of chopping was performed with a sufficientamount of ice-chilled water (2 ± 1 “C) to adjust the moisture content to 78%. Thechopped paste was stuffed into 3cm diameter cellulose casings, and cooked at 90°Cfor 40 min in a water bath. The heat induced surimi gels were cooled in running tapwater for 20 min. The prepared gels were allowed to equilibrate to room temperatureovernight and then cut into 3 cm dia. and 2 cm long cylindrical shapes for colormeasurements_
Chemical Analvsis
The fish paste saved for chemical studies was stored for 24 h at 4°C prior toanalysis.
Total carotenoid pigments were determined calorimetrically (OD,) afterextraction on 25g of fish paste, as described by Saito and Regier (1970). The OD at460 nm was multiplied by a factor of 2 to express the results as µg carotenoids/gsample. The concentration of the carotenoids were determined at pH 5.0, 6.0,7-0,8.0, 9-0, 10.0 and control.
The hematin content of the menhaden fish was determined on 5g of fish pasteby the alkaline hematin method as described by Karlsson and Lundstrom (1991).
138
Hematin concentration, expressed as ppm hematin/g sample, was calculated using thefollowing equation: ppm=(5/50)[97.261(OD700) - 0.0751
Oxidative deterioration of the lipid components (rancidity) was evaluated onlog sample using the 2-thiobarbituric acid test of Tarladgis et al. (1960). The opticaldensity was read at 538 nm and readings multiplied by a factor of 7.8 to express theTBA reactive substances (TBARs) results as mg of malonaldehyde/kg sample(Sinnhuber and Yu, 1958).
The carbonyl content (moles/g) was determined by the method for tracequantities of carbonyl compounds as described by Siggia (1963). Results wereconverted to µmole/g by multiplying by 106.
Moisture content of unwashed menhaden mince, pH treated menhaden pasteand the control were determined by method 950.46, drying under vacuum at 95 to100°C (AOAC, 1990). Values were reported as percent moisture on a wet weightbasis.
Color Measurement
Hunter "L" (lightness), "a" ("+" indicating redness) and "b" ("+" indicatingyellowness) values were measured by a Hunter Labscan 6000 0/45°Spectrocolorimeter (Hunter Associates Laboratory Inc., Reston, VA). The instrumentwas calibrated using a white Hunterlab color standard tile no. LS- 13601 (L,=90, a 0 =0.16 and b0=0.48). The fish samples (at room temperature) were placed on to a60x15mm (dia x ht) clear Pyrex© culture petri dish cover and over a 2 in. port.Hunter "I", "a", and "b" values were recorded for all pH treatments of both menhadenpaste and heat-induced surimi gel.
The hue angle, tan-1(b/a) and total color difference AE=[L-L0)2+(a-a0)2+(-b0)2]1/2 were calculated for menhaden mince.
Statistical Analysis
All data were analyzed using a randomized complete block design with threereplications (blocks). Blocks consisted of three batches of menhaden fish processedJune 9, July 23 and July 28 1992, respectively. The treatments consisted of unwashedmince, paste/gel washed with tap water (control), and paste/gel washed withphosphate buffers at pH 5.0, 6.0, 7.0, 8.0, 9.0 and 10.0. Analyses were performedusing the GLM procedures of the Statistical Analysis System (SAS, 1985). Meanswere separated where significant differences were found using least significantdifferences (LSD) test (SAS, 1985) at the 5% level of significance.
RESULTS AND DISCUSSION
Chemical Analysis
There were no differences (P>0.05) in carotenoids content, on a dry basis, dueto wash treatments (Table 1). Due to their aliphatic and aliphatic-cyclic molecularstructure composed of carbon isoprene groups, carotenoids are fat-soluble pigments.Consequently, aqueous washing treatments do not extract these pigments.
Total heme pigment extraction was affected (P>0.05) by washing medium pH(Table 1). Washing with phosphate buffers of pH 8.0 or lower resulted in lower(P>0.05) hematin than unwashed products. The pigment content decreased by 74%,from 1.07 ppm in the unwashed fish mince to 0.27 ppm in the tap water washedsample. Dawson et al. (1988) reported that heme pigments are more soluble in lowsalt concentrations (Froning and Niemann, 1988), possibly facilitating their removalby the washing solution.
There were no differences (P>0.05) in TBARs due to wash treatments. TheTBARs varied between 8.40 for unwashed mince and 4.53 mg of malonaldehyde/kgfor mince washed with pH 5.0 water (Table 1). These values are considered to behigh for frozen seafoods (Sinnhuber and Yu, 1958) and may result in unacceptableproducts by consumers. Disruption of muscle membrane system caused by deboningwas postulated to increase the rate of lipid oxidation by exposing labile lipidconstituents to oxygen (Sato and Hegarty, 1971). Hall (1987) stated that a ruptureof the organized cellular structure brought together lipids, catalysts and enzymesinvolved in lipid oxidation.
Nakayarna and Yamamoto (1977) reported that rancidity was detected at TBAvalues of 1.50 and 3.00 in different fish species. However, malonaldehyde is not theonly end product of lipid peroxidation (Buege and Aust, 1978). Furthermore, Slabyjand True (1978) reported that high TBA values did not necessarily reflect rancidityin some samples.
There were differences (P<0.05) in carbonyl values due to wash treatments(Table 1). The application of water washing to raw fish mince decreased carbonylvalues in mince. Carbonyl values decreased by 50% from 0.463 in the unwashed rawfish mince to 0.233 µmole/g in the tap water-washed sample but were not different(P>0.05) among washed minces.
Carbonyl values reported in the fish mince washed with a pH 5.0 phosphatebuffer were usually higher than in those washed with alkaline pHs. This may beattributed to lipid oxidation by nonheme proteins (proteins associated with freeinorganic forms of iron, copper, or cobalt), which have been reported to beresponsible for about two-thirds of oxidation (Decker and Schanus, 1986) and foundto be pH sensitive; the catalytic effect of the iron being higher at acidic pH values.
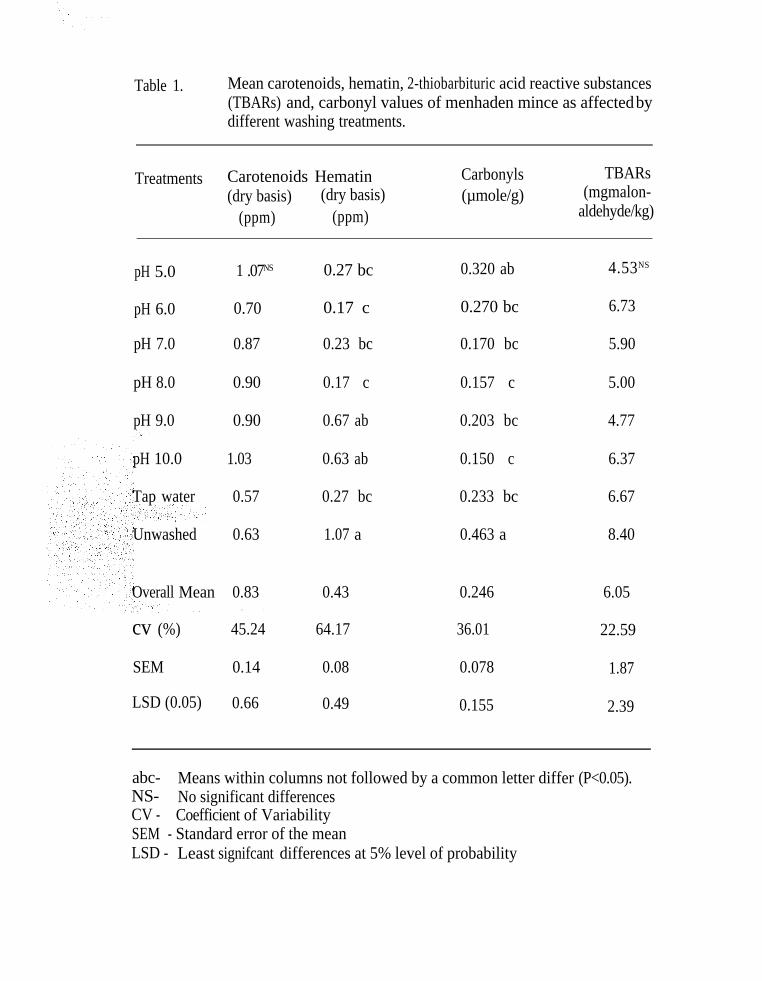
Table 1. Mean carotenoids, hematin, 2-thiobarbituric acid reactive substances(TBARs) and, carbonyl values of menhaden mince as affected bydifferent washing treatments.
Treatments Carotenoids Hematin Carbonyls TBARs(dry basis) (dry basis) (µmole/g) (mgmalon-
(ppm) (ppm) aldehyde/kg)
pH 5.0 1 .07NS 0.27 bc 0.320 ab 4.53NS
pH 6.0 0.70 0.17 c 0.270 bc 6.73
pH 7.0 0.87 0.23 bc 0.170 bc 5.90
pH 8.0 0.90 0.17 c 0.157 c 5.00
pH 9.0 0.90 0.67 ab 0.203 bc 4.77
pH 10.0 1.03 0.63 ab 0.150 c 6.37
Tap water 0.57 0.27 bc 0.233 bc 6.67
Unwashed 0.63 1.07 a 0.463 a 8.40
Overall Mean 0.83 0.43 0.246 6.05
cv (%) 45.24 64.17 36.01 22.59
SEM 0.14 0.08 0.078 1.87
LSD (0.05) 0.66 0.49 0.155 2.39
abc-NS-
Means within columns not followed by a common letter differ (P<0.05).No significant differences
CV - Coefficient of VariabilitySEM - Standard error of the meanLSD - Least signifcant differences at 5% level of probability
Labuza (1971) suggested that the protein part of hemoprotein molecules normallyhinders the catalytic function of the iron, and in the denaturation of the protein partof hemoprotein molecules could expose iron to lipids.
Mean moisture values of menhaden mince and menhaden gel as affected bydifferent washing treatments are shown in Table 2. Menhaden mince from meatwashed with water pH 8.0, 9.0 and 10.0 had higher (P<0.05) moisture than thosewashed with low pH buffer or tap water. Moisture content for any washed mincesample was higher (P<0.05) than for the unwashed mince sample. No differences(P>0.05) in gel moisture were found, since this was made to a target 78% moisture(Fig. 1).
It was noticed that water removal from the washed menhaden mince duringthe dewatering step was particularly difficult as the water pH increased (data notshown). Ball et al. (1984) reported a similar direct relationship between increasedwashing solution pH and increased moisture content in washed poultry meat. Theincrease of water binding properties of muscle proteins was attributed to anadjustment of pH away from the protein isoelectric point, in mechanically debonedpoultry meat (Dawson et al., 1988).Color
Hunter “L”, “a”, hue value, and, total color difference (AE) of menhadenmince of washed treatments was different (P<0.05) from the unwashed. The mostdramatic effect of water washings was a 84% reduction in redness (“a“ value), from4.49 to 0.72 (Table 3). The fish mince Hunter ‘L’ value was reduced by 10 units afterwashing, but wash pH did not have any effect.
Hue angle values (Table 3) increased from 68.74 in the unwashed fish minceto 86.97 in the tap water washed sample. There was no additional increase in the huevalues when different phosphate buffers were used. As the red color was removed,the fish mince decreased in darkness, and hues other than red tended to predominate.Total color difference (AE) values between untreated and treated samples decreased(P<0.05) with washing.
The changes in color of the washed mechanically deboned fish mince duringthe cooking step could be attributed to the denaturation of any remaining myoglobinto denatured metmyoglobin (Francis and Clydesdale, 1975). Fogg and Harrisson(1975) reported that myoglobin in pure solution denatured when heated to 85°C.Francis and Clydesdale (1975) stated that upon cooking, salmon flesh was lighter incolor and hue shifted from red to orange-red. Contamination of menhaden mince withskin, bone and scale indicated too high deboner belt pressure and an improper feedingof the deboner. Fish fed skin side down were used, forcing more bone and scalethrough the drum perforations along with the fish mince. This outcome could havebeen avoided by adjusting the belt pressure of the deboner and orienting the split fishso that the deboner perforated drum was in direct contact with the white muscle (bone
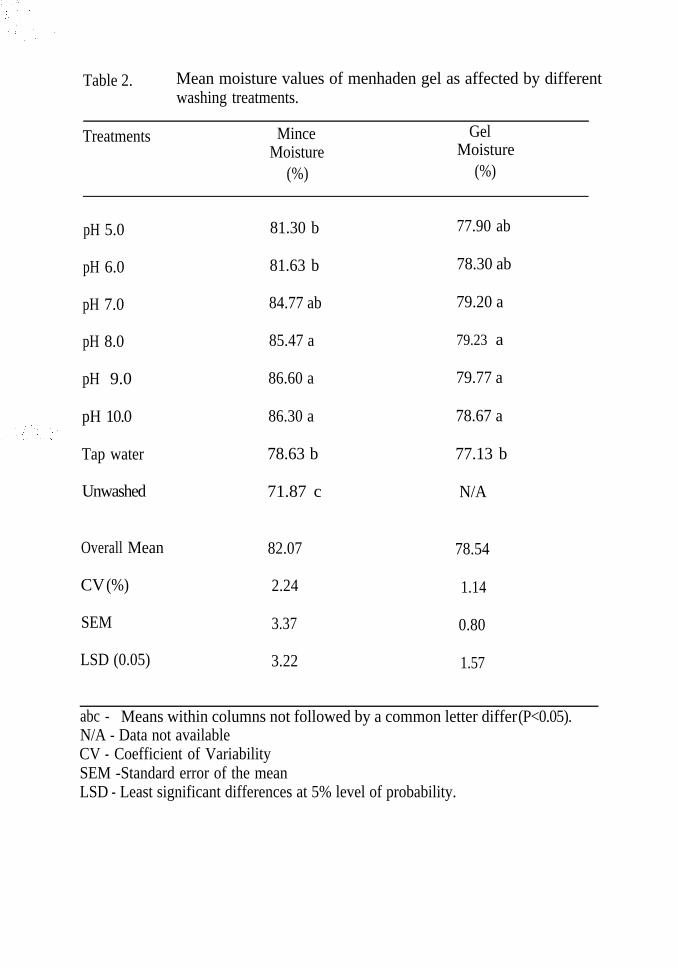
Table 2. Mean moisture values of menhaden gel as affected by differentwashing treatments.
Treatments MinceMoisture
(%)
GelMoisture
(%)
pH 5.0 81.30 b 77.90 ab
pH 6.0 81.63 b 78.30 ab
pH 7.0 84.77 ab 79.20 a
pH 8.0 85.47 a
pH 9.0
pH 10.0
Tap water
Unwashed
78.63 b
71.87 c
Overall Mean 82.07
CV (%) 2.24
SEM
LSD (0.05)
86.60 a
86.30 a
3.37
3.22
79.23 a
79.77 a
78.67 a
77.13 b
N/A
78.54
1.14
0.80
1.57
abc - Means within columns not followed by a common letter differ (P<0.05).N/A - Data not availableCV - Coefficient of VariabilitySEM -Standard error of the meanLSD - Least significant differences at 5% level of probability.
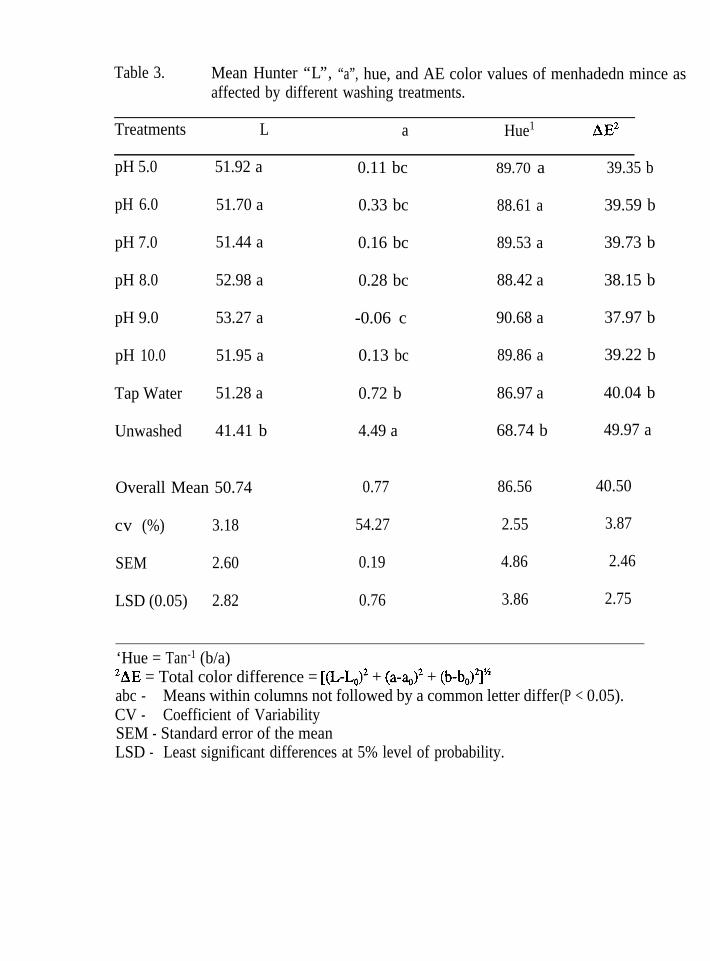
Table 3. Mean Hunter “L”, “a”, hue, and AE color values of menhadedn mince asaffected by different washing treatments.
Treatments L a Hue1 AE2
pH 5.0 51.92 a 0.11 bc 89.70 a 39.35 b
pH 6.0 51.70 a 0.33 bc 88.61 a 39.59 b
pH 7.0 51.44 a 0.16 bc 89.53 a 39.73 b
pH 8.0 52.98 a 0.28 bc 88.42 a 38.15 b
pH 9.0 53.27 a -0.06 c 90.68 a 37.97 b
pH 10.0 51.95 a 0.13 bc 89.86 a 39.22 b
Tap Water 51.28 a 0.72 b 86.97 a 40.04 b
Unwashed 41.41 b 4.49 a 68.74 b 49.97 a
Overall Mean 50.74
cv (%) 3.18
SEM 2.60
LSD (0.05) 2.82
0.77 86.56
54.27 2.55
0.19 4.86
0.76 3.86
40.50
3.87
2.46
2.75
‘Hue = Tan-1 (b/a)2AE = Total color difference = [(L-LJ2 + (a-h)’ + (b-b,)2]”abc - Means within columns not followed by a common letter differ (P < 0.05).CV - Coefficient of VariabilitySEM - Standard error of the meanLSD - Least significant differences at 5% level of probability.
side). These adjustments are essential to control the quantity of dark muscleincorporated as well as skin, bone and scale.
CONCLUSIONS
Washing with tap water or pH-buffered water (acid or alkaline) resulted in alighter (P<05) color mince than unwashed product. However, there were nodifferences (P>0.05) in washing treatment on color of mince and gel made frommenhaden. There was no effect (P>0.05) of washing treatment on carotenoids orTBARs, but there were (P<0.05) on hematin and carbonyl values of the mince.
ACKNOWLEDGMENTS
The authors would like to thank Mrs. Sabrina Hunt for her aid in typing andediting.
REFERENCES
Anonymous. 1989. Surimi production from Atlantic menhaden. Final report, Contr.50-EANF-6-00048, Zapata Haynie Corporation.
AOAC. 1990. “Official Methods of Analysis”, 15th ed. Association of OfficialAnalytical Chemists, Arlington, VA.
Babbitt, J. K. 1986. Suitability of seafood species as raw materials. Food Technol.40(3):97- 100.
Ball, H. R Jr., Sheldon, B. W. and Montejano, J. G. 1984. Evaluation of proceduresto remove meat pigments and flavor components from dark poultry meat.Final Report to the Southeastern Poultry and Egg Association, Decatur, GA.
Buege, J. A and Aust, S. D. 1978. Microsomal lipid peroxidation. In “Methods inEnzymology”, V o l 52, Ed. Fleischer, S. and Packer, L. Academic Press, NewYork.
Dawson, P. L., Sheldon, B. W. and Ball, H. R. Jr. 1988. Extraction of lipid andpigment components from mechanically deboned chicken meat. J. Food Sci.53:1615-1617.
Decker, E. A. and Schanus, E. G. 1986. Catalysis of linoleate oxidation bynoheme- and heme-soluble chicken muscle proteins. J. Agric. Food Chem.34:99l-994.
Fogg, N. E. and Harrison, D. L. 1975. Relation of electrophoretic patterns andselected characteristics of bovine skeletal muscle and internal temperature.J. Food Sci. 40:28-35.
Francis, F. J. and Clydesdale, F. M. 1975. “Food Colorimetry: Theory andApplication” (Ed.), p. 206. The AVI Publishing Company, Inc., Wesport,Connecticut.
Froning, G. W. and Niemann, L. M. 1988. Effect of washing of mechanicallydeboned chicken meat on composition and functional properties. Poult. Sci.67 (Supplement 1):87.
Gomori, G.. 1955. Preparation of buffers for use in enzyme studies, In “Methods inEnzymology” (Ed.), Vol. I, p. 138. Academic Press Inc., New York.
Hall, G. 1987. Interactions between products of lipid oxidation and proteins. FoodSci. Technol. Today, 1:155-158.
Karlsson, A. and Lundstrom, K. 1991. Meat pigment determination by a simple andnon-toxic alkaline hematin method (an alternative to the Homsey and thecyanometmyoglobin methods). Meat Sci. 29: 17-24.
Labuza, T. P. 1971. Kinetics of lipid oxidation in foods. CRC Crit. Rev. FoodTechnol. 2( ):355-405.
Lanier, T. C., Martin, R. E., and Bimbo, A. P. 1988. Nutritional implications ofincreased consumption of engineered seafoods. Food Technol. 42(5):162-._165.
Nakayama, T. and Yamamoto, M. 1977. Physical, chemical and sensory evaluationsof frozen-stored deboned (minced) fish flesh. J. Food Sci. 42:900-905.
NMFS. 1993. Fisheries of the United States, 1992. Current Fisheries Statistics.U.S. Department of Commerce, NOAA, National Marine Fisheries Service,Pascagoula, MS.
SAS. 1985. “SAS® User’s Guide: Statistics.“ Version 6.0 SAS Institute, Inc., Cary,NC.
Saito, A. and Regier, L. W. 1970. Determination of total carotenoid pigments introut and salmon flesh. New series circular no. 36. Fisheries Research Boardof Canada., Halifax, Nova Scotia, Canada.
Sato, K. and Hegarty, G. R. 1971. Warmed over flavor in cooked meats. J. FoodSci. 36: 1098- 1102.
S i g g i a S . 1963. Methods for trace quantities of carbonyl compounds in“Quantitative Organic Analysis via Functional Groups”, 3rd ed., p. 124. JohnWiley and Sons. Inc., New York.
Sinnhuber, R. 0. and Yu, T. C. 1958. 2-thiobarbituric acid method for themeasurement of rancidity in fishery products. II. The quantitativedetermination of malonaldehyde. Food Technol. 12( 1):9- 12.
Slabyj, B. M. and True, R. H . 1978. Effect of preprocess holding on the quality ofcanned Maine sardines. J. Food Sci. 43:1172- 1176.
Tarladgis, B. G., Watts, B. M., Younathan, M. T. and Dugan, L., Jr. 1960. Adistillation method for the quantitative determination of malonaldehyde inrancid foods. J. Amer. Oil Chem. Soc. 37:44-48.
Vorrdruska, J. 1987. Symposium on markets for seafood and aquacultural products.
14
EXTENDED SHELF-LIFE OF CATFISH FILLETS TREATED WITHSODIUM ACETATE, MONOPOTASSIUM PHOSPHATE, AND
BIFIDOBACTERIA
Douglas L. Marshall, Chang R. Kim, andJames 0. Heamsberger (deceased)
Department of Food Science and Technology, Mississippi Agricultureand Forestry Experiment Station, Mississippi State University,
Box 9805, Mississippi State, MS 39762
The shelf life and safety of refrigerated fish and fish products are dictated bythe presence of food spoilage and pathogenic microorganisms (Vilemure et al., 1986;Ingham, 1989; Harrison et al., 1991; Kim and Heamsberger, 1994). Temperatureabuse during handling, transportation, and storage of fish without additionalpreservation methods allows for proliferation of these microorganisms (Barnett et al.,1982; Fey and Regenstein, 1982; Josephson et al., 1985; Scott et al., 1986; Baker etal., 1990). Growth of undesirable spoilage bacteria in refrigerated fish causesdeterioration of keeping quality and reduces consumer acceptance.
Efforts to enhance the quality and safety of refrigerated foods have beenprimarily directed to preventing the growth of or to destroy aerobic spoilage bacteriaand foodbome pathogens during storage and handling by using combinations of foodadditives and/or biopreservatives (Gilliland and Ewell, 1983; Lindgren andDobrogosz, 1989). Several researchers have suggested that biopreservatives such aslactic acid bacteria or their metabolites in refrigerated foods have the ability tosuppress aerobic bacteria that cause food spoilage (Raccach and Baker, 1978;Schaack and Marth, 1988; Laroia and Martin, 1990; Modler et al., 1990; Hughes andHoover, 1991; Ray, 1992).
Phosphates have broad spectrum antimicrobial activity and are used forimproving the microbiological quality of muscle foods and to improve shelf life(Molins, 1991). Molins (1991) reported that changes in pH induced by phosphateaddition may play an important role in the ability of these compounds to chelate metalions essential in bacterial metabolism and growth. He suggested that, in general,gram-positive bacteria are more susceptible to inhibition by various pyro- andpolyphosphates than are gram-negative bacteria Although there has been limited
work on combining acetates and phosphates in meat products (Mendonca et al., 1989)as antimicrobial surface treatments, this has not been studied with fish.
Lindgren and Dobrogosz (1989) observed that a combination of Lactobacillusleuteri and 250 mM glycerol inhibited aerobic spoilage bacteria in herring fillets storedin N2 at 5°C for 6 d. Raccach et al. (1979) and Schaack and Marth (1988) showedsimilar effects with lactic acid bacteria on food spoilage bacteria and pathogens inpoultry meat and skim milk, respectively. Use of Pediococcus cerevisiae (AccelR) andLactobacillus plantarum (LactacelR) in refrigerated deboned poultry meat decreasedthe microbial population, reduced off-odor, and extended shelf-life by 2 d (Raccachet al., 1979). Kim and Heamsberger (1994) reported that combination ofLactococcus lactis ssp. cremoris ATCC 19257 with sodium acetate and potassiumsorbate effectively inhibited growth of gram-negative bacteria on refrigerated catfishfillets. Bifidobacteria may control food spoilage bacteria and foodbome pathogensthrough production of lactic and acetic acids as well as other antibiotic substances(Laroia and Martin, 1990; Modler et al., 1990; Hughes and Hoover, 1991; Ray,1992). Previous work in our laboratories has shown that sodium acetate is effectivein suppressing the growth of aerobic spoilage bacteria on refrigerated catfish fillets(Kim and Hearnsberger, 1994). Because there are no studies on the combined effectof sodium acetate with phosphates or bifidobacteria as an antimicrobial treatment offish or fish products, the present study was designed to evaluate shelf-life ofrefrigerated (4°C) channel catfish fillets surface-treated with sodium acetate,monopotassium phosphate and/or selected bifidobacteria.
MATERIALS & METHODS
Preparation of bifidobacteria culturesBifidobacterium infantis ATCC 15697 and B. longum ATCC 15707 were
obtained from the American Type Culture Collection (Rockville, MD). B.adolescentis 9H Martin was obtained from the culture collection of Dr. J. H. Martin,Mississippi State University. Stock cultures were maintained in sterile skim milkmedium (SM; 10% skim milk, 0.5% yeast extract, and 0.5% glucose) at 37°C for 24h in an anaerobic jar (Gas-Pak; BBL). For fish inoculation, the cultures wereprepared by three successive 1: 10 transfers at 24-h intervals into fresh SM incubatedas above. Bifidobacteria cultures in SM (6.0 x 10⁷ to 1.0 x l08 CFU/ml) were addedat a given percentage (V/W) to fresh catfish fillets as described below. Final SM pHwas 4.4-4.8.
Catfish preparation and treatmentFresh channel catfish (Ictalurus punctatus) fillets were obtained from a
commercial source, transported to MSU on ice, and used within 3 h. For eachtreatment, 2 kg of fillets (average weight of 110 g per fillet) were placed in aprecleaned (Jettson General Purpose Cleaner, Diversy Group, Cincinnati, OH) andsanitized (hot water at 88°C) tumbler (Polymaid Model SS 350, Lax-go, FL) at roomtemperature. Food preservatives were added to the tumbler and fillets were tumbled
for 15 min at 18 r-pm. Untreated controls were tumbled without preservatives. Thetumbler was cleaned and sanitized between treatments. Duplicate experimental trialsconsisted of the following treatments: (a) 0.0, 0.25, 0.5, 0.75, or 1 .0% (W/W) sodiumacetate (SA; Fisher Scientific Co., Norcross, GA), (b) 0.0, 0.25, 0.5, 0.75, or 1.0%(W/W) monopotassium phosphate (MKP; FMC Corp. Philadelphia, PA), (c) 0 or2.5% (V/W) B. adolescentis, B. infantis, or B. longum (V/W), (d) 0.5% SA and 0.1,0.2, 0.3, or 0.4% MKP, (e) 0.4% MKP and 0.3, 0.5, or 0.7% SA, (f) 0 or 2.5% of B.adolescentis, B. infantis, or B. longum combined with 0 or 0.5% SA, (g) 0 or 0.5%SA combined with 1.5%, 2.5%, 3.5% or 4.5% B. infantis, and (h) 0 or 0.5% SAcombined with 2.5% B. infantis incubated for 24, 48, or 72 h before addition.Treated catfish fillets were removed from the tumbler and stored individually in“ZiplocR” (DowBrands L.P., Indianapolis, IN) bags at 4°C. Storage bag gastransmission rate is 1.65 cc/cm2 per mil in 24 h at 1 atm. Microbiological analysis wasperformed for each treatment over a 12 d storage period. Selected treatments werescheduled for pH measurements and sensory evaluations during storage.
Microbiological analysesEach fillet was weighed and 0.1% sterile peptone water was added to make
a 1:1 dilution (W/V). A Stomacher Lab Blender 400 (Tekmar, Cincinnati, OH) wasused to homogenize the specimen for 2 min and then appropriate serial dilutions weremade for spiral plating. Total aerobic plate counts (APC) were determined byduplicate spiral-platings (Spiral System, Inc., Bethesda, MD) on standard plate countagar (Difco Detroit, MI) incubated at 30°C for 2 d before counting (Swanson et al.,1992). APC values were expressed as mean log,, CFU/g for 2 fillets per treatmentper sampling day. Generation times were calculated as described elsewhere (Marshalland Schmidt, 1988).
Bifidobacteria were enumerated by pour plating appropriate serial dilutionsin 0.1% peptone water with neomycin-paromomycin- nalidixic acid-lithium chlorideagar Teraguchi et al , 1978; Laroia and Martin, 1991) followed by incubation at 37°Cfor 48 h in an anaerobic jar (Gas-Pak; BBL) prior to counting colonies.
Measurement of pHFillet pH was measured with a standardized pH meter (AccumetR, Model 50,
Fisher) by placing a surface electrode directly onto the fillet surface. Mean pH valueswere reported as the average of quadruplicate readings for each duplicate fillet.
Sensorv evaluationSensory evaluation of samples was performed by an eight member untrained
panel. Uncooked odor and appearance of treated fillets were evaluated every 3 dduring storage at 4°C. Samples were warmed to room temperature prior to analyses.Treated samples were judged against a fresh control (fresh fillets were used eachanalysis day) which was assigned a score of 5. Samples liked less than the controlwere scored 1 to 4, where 1 = most disliked. Samples liked more than the controlwere scored 6 to 9, where 9 = most liked. Untreated fillets also were compared with
untreated fresh fillets and treated fillets. Two fillets per treatment per sampling daywere analyzed.
Statistical analysesAPC, pH, and sensory data were analyzed using ANOVA, and means were
separated by the least significant difference test (SAS, 1992).
RESULTS & DISCUSSION
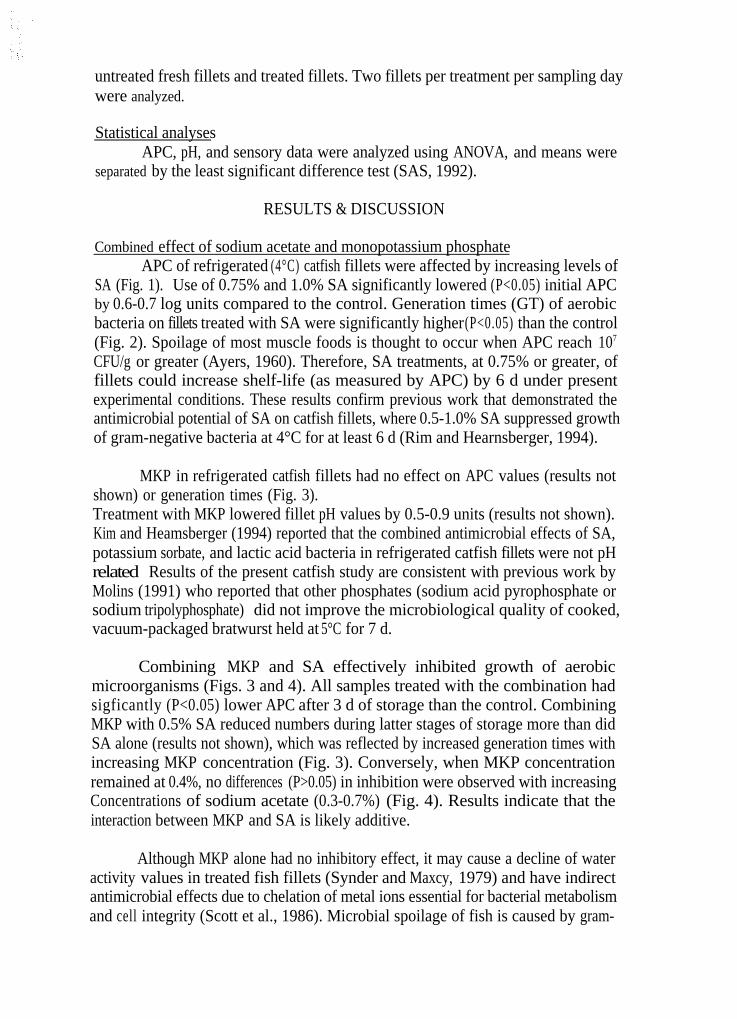
Combined effect of sodium acetate and monopotassium phosphateAPC of refrigerated (4°C) catfish fillets were affected by increasing levels of
SA (Fig. 1). Use of 0.75% and 1.0% SA significantly lowered (P<0.05) initial APCby 0.6-0.7 log units compared to the control. Generation times (GT) of aerobicbacteria on fillets treated with SA were significantly higher (P<0.05) than the control(Fig. 2). Spoilage of most muscle foods is thought to occur when APC reach 107
CFU/g or greater (Ayers, 1960). Therefore, SA treatments, at 0.75% or greater, offillets could increase shelf-life (as measured by APC) by 6 d under presentexperimental conditions. These results confirm previous work that demonstrated theantimicrobial potential of SA on catfish fillets, where 0.5-1.0% SA suppressed growthof gram-negative bacteria at 4°C for at least 6 d (Rim and Hearnsberger, 1994).
MKP in refrigerated catfish fillets had no effect on APC values (results notshown) or generation times (Fig. 3).Treatment with MKP lowered fillet pH values by 0.5-0.9 units (results not shown).Kim and Heamsberger (1994) reported that the combined antimicrobial effects of SA,potassium sorbate, and lactic acid bacteria in refrigerated catfish fillets were not pHrelated. Results of the present catfish study are consistent with previous work byMolins (1991) who reported that other phosphates (sodium acid pyrophosphate orsodium tripolyphosphate) did not improve the microbiological quality of cooked,vacuum-packaged bratwurst held at 5°C for 7 d.
Combining MKP and SA effectively inhibited growth of aerobicmicroorganisms (Figs. 3 and 4). All samples treated with the combination hadsigficantly (P<0.05) lower APC after 3 d of storage than the control. CombiningMKP with 0.5% SA reduced numbers during latter stages of storage more than didSA alone (results not shown), which was reflected by increased generation times withincreasing MKP concentration (Fig. 3). Conversely, when MKP concentrationremained at 0.4%, no differences (P>0.05) in inhibition were observed with increasingConcentrations of sodium acetate (0.3-0.7%) (Fig. 4). Results indicate that theinteraction between MKP and SA is likely additive.
Although MKP alone had no inhibitory effect, it may cause a decline of wateractivity values in treated fish fillets (Synder and Maxcy, 1979) and have indirectantimicrobial effects due to chelation of metal ions essential for bacterial metabolismand cell integrity (Scott et al., 1986). Microbial spoilage of fish is caused by gram-
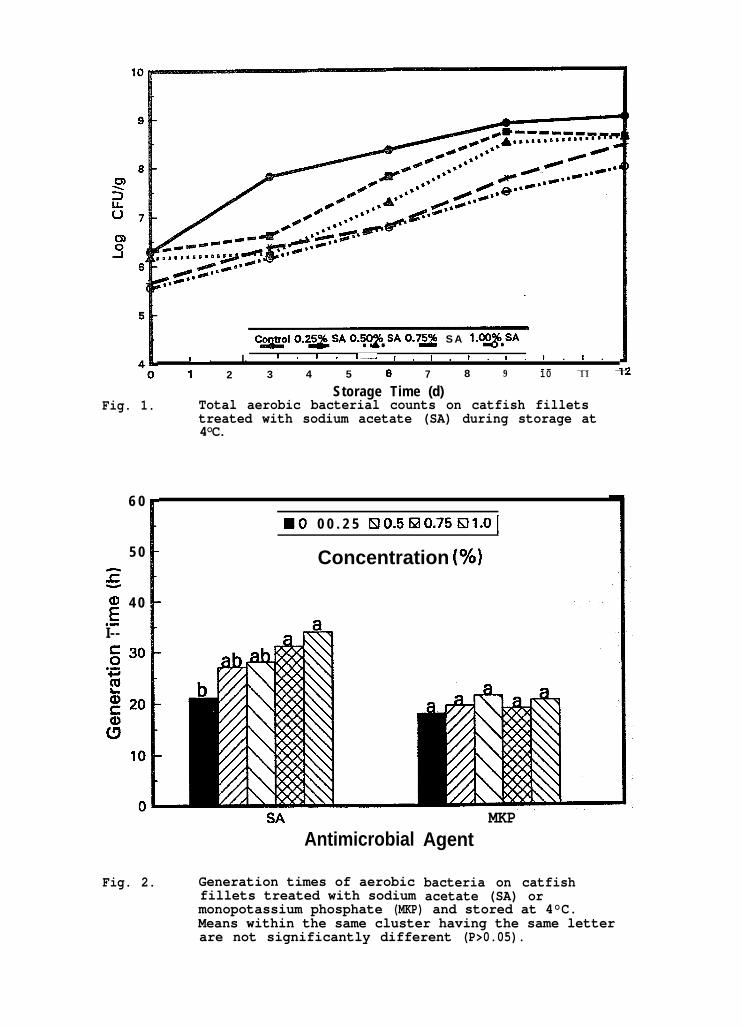
Fig. 1.
6 0
5 0
s0 4 0E.-
I--
COIJ$ o.Z!J&SA O.qOz,SA 0.73 S A l.ma,SA
1, I. I . I. I. I. I. 1. 1. 1.1._- __ __
1 2 3 4 5 0 7 8 9 10 11
Storage Time (d)Total aerobic bacterial counts on catfish filletstreated with sodium acetate (SA) during storage at4°C.
HO 0 0 . 2 5 ElO.5 f90.75 6Il.O 1
Concentration (%I
Antimicrobial
Fig. 2. Generation times of aerobic bacteria on catfishfillets treated with sodium acetate (SA) or
MKPAgent
monopotassium phosphate (MKP) and stored at 4°C.Means within the same cluster having the same letterare not significantly different (P>0.05).
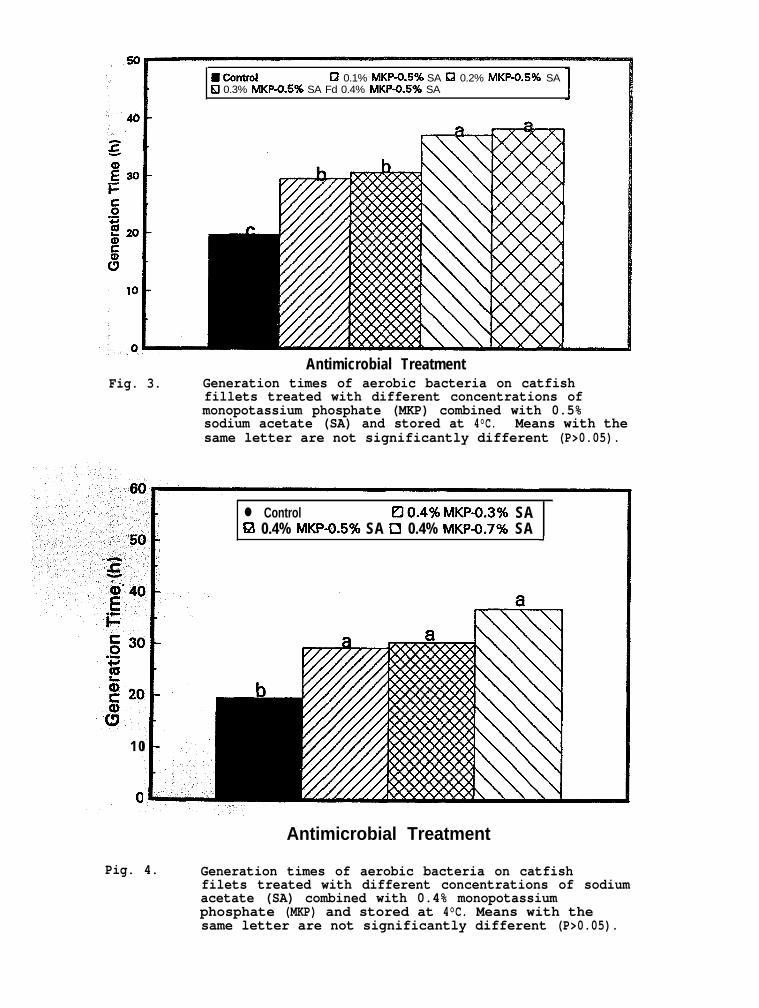
Fig. 3.
m control tJ 0.1% MKP-O.B% SA KJ 0.2% MKP-O.5% SAQ 0.3% MKP-O.S% SA Fd 0.4% tvlKP-O.B% SA
Antimicrobial TreatmentGeneration times of aerobic bacteria on catfishfillets treated with different concentrations ofmonopotassium phosphate (MKP) combined with 0.5%sodium acetate (SA) and stored at 4°C. Means with thesame letter are not significantly different (P>0.05).
10
0
Antimicrobial Treatment
Pig. 4. Generation times of aerobic bacteria on catfishfilets treated with different concentrations of sodiumacetate (SA) combined with 0.4% monopotassiumphosphate (MKP) and stored at 4°C. Means with thesame letter are not significantly different (P>0.05).
l Control elO.4% MKP-O.3% SABI 0.4% MUP-O.5% SA Cl 0.4% MKPO.‘I% SA d
”
Storage Time (d)9 12
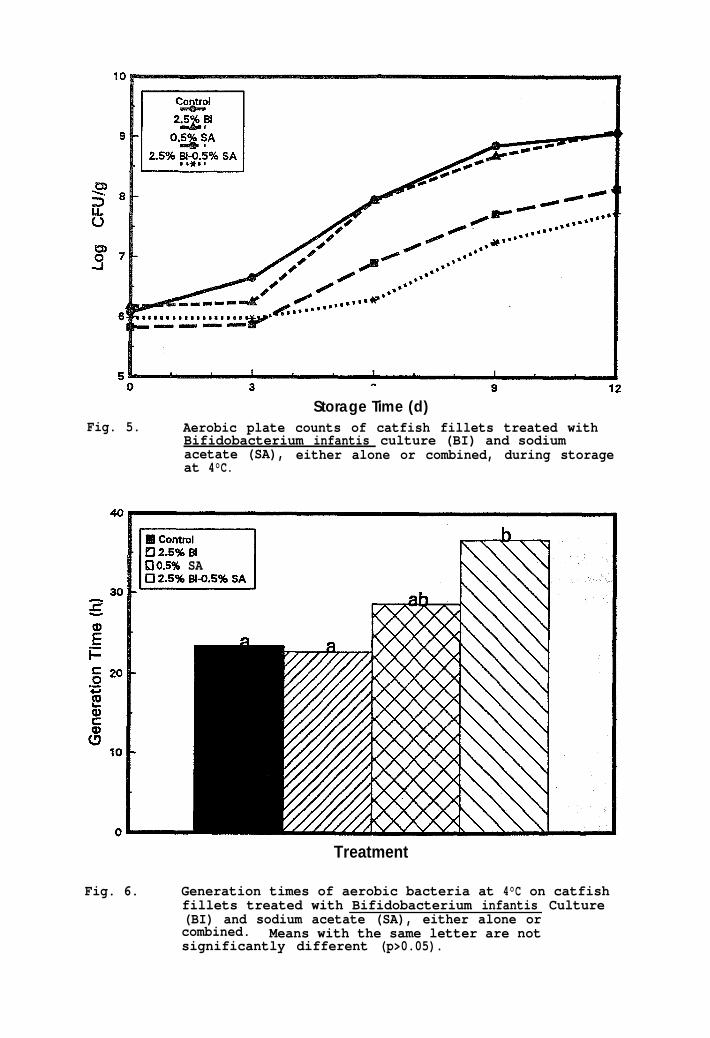
Fig. 5. Aerobic plate counts of catfish fillets treated withBifidobacterium infantis culture (BI) and sodiumacetate (SA), either alone or combined, during storageat 4°C.
610.5% SA
Treatment
Fig. 6. Generation times of aerobic bacteria at 4°C on catfishfillets treated with Bifidobacterium infantis Culture(BI) and sodium acetate (SA), either alone orcombined. Means with the same letter are notsignificantly different (p>0.05).
negative bacteria such as Pseudomonas spp. (Herbert et al., 1971; Herbert andShewan, 1976). SA inhibits growth of gram-negative bacteria on refrigerated (4°C)catfish fillets (Kim and Hearnsberger, 1994), while gram-positive bacteria are moresusceptible to inhibition by MKP than are gram-negative bacteria (Molins, 1991).This microbial specificity demonstrates that SA is a better chemical treatment thanMKP to extend shelf-life of catfish. However, results indicate that a combination ofSA and MKP may prolong the microbiological shelf life of catfish at 4°C by keepingcounts below 107 CFU/g.
Combined effect of sodium acetate and bifidobacteriaThe effects of various concentrations and species of BIF and SA on the shelf-
life of refrigerated catfish fillets were studied on the basis of aerobic plate counts(APC) and sensory data. When a 2.5% culture of B. infantis was used alone, littleimpact on APC was noted with the exception of a significant (P<0.05) extension ofthe lag phase (Fig. 5). Once growth began, GT of aerobic microorganisms on filletstreated with B. infantis were not significantly different (P>0.05) from control fillets(Fig. 6). Similar (P>0.05) extended lag phases and GT were noted for fillets treatedwith 2.5% cultures of B. adolescentis or B. longum (results not shown). Hence,further results only will report data from B. infantis treatments. Lag phase increasesof psychrotrophic populations were observed in ground poultry treated withLactobacillus plantarum or Pediococcus cerevisiae (Raccach et al., 1979). It wasassumed that inoculated BIF do not grow on refrigerated fish fillets and the extensionof lag phase may be due to compounds produced during culturing, i.e. acetic and/orlactic acid, that were inhibitory to aerobic spoilage bacteria (Gilliland and Speck,1975; Ray, 1992). Other reasons for inhibited aerobic growth might include nutrientcompetition, unfavorable changes in oxidation reduction potential, or production of
other antimicrobial compounds.
Fillets treated with 0.5% SA had APC significantly lower and GT significantlyhigher (P<0.05) than control or BE-treated fillets (Fig. 5 & 6). The microbiologicalshelf-life (i.e. time to reach APC of 107 CFU/g or greater (Ayers, 1960)) of SA-treated fillets was prolonged by 3 d compared to untreated and BIF-treated fillets.Combining 2.5% BIF with 0.3% SA resulted in significant (P<0.05) lag phaseextension and increased GT values approximately 8 h higher than controls (results notshown). No differences (P>0.05) among species was noted. When 2.5% B. infantiswas combined with 0.5% SA, significant (P<0.05) decreases in APC and increases inGT were observed (Fig. 5 & 6). No significant difference (P>0.05) in GT was seenbetween this treatment and 0.5% SA alone, resulting in a 3d microbiological shelf-lifeextension. B. infantis behaved similarly (P>0.05) as the other two cultures whencombined with 0.5% SA (results not shown). The combined treatments couldincrease GT by approximately 20 h. A previous report on SA combined withpotassium sorbate or lactic acid culture has attributed antimicrobial effects primarilyto SA (Kim and Hearnsberger, 1994). The present study shows that an additiveinteraction occurs when BIF are combined with SA.
Efforts to increase antimicrobial activity of the BIF-SA treatment provedunsuccessful. Increasing the amount of B. infantis culture had no influence (P>0.05)on APC (results not shown). Likewise, increasing the amount of time the B. infantisculture was incubated prior to application had no influence (P>0.05) on APC (resultsnot shown). Reddy et al. (1970) reported that addition of 10% cultures ofLeuconostoc citrovurum was effective in inhibiting the growth of aerobic spoilagebacteria in ground beef stored at 7°C for 7 days. In a later study, Reddy et al. (1983)found that when cultivation was prolonged from 24 to 48 h, growth and antibioticproduction of Lactobacillus bulgaricus in skim milk was enhanced.
Catfish pH and sensory scoresAddition of SA decreased pH of fillets by 0.2-0.3 units (results not shown).
Fillets treated with both SA and MKP had initial pH values 0.25-0.3 units lower thanthe control (Table 1).
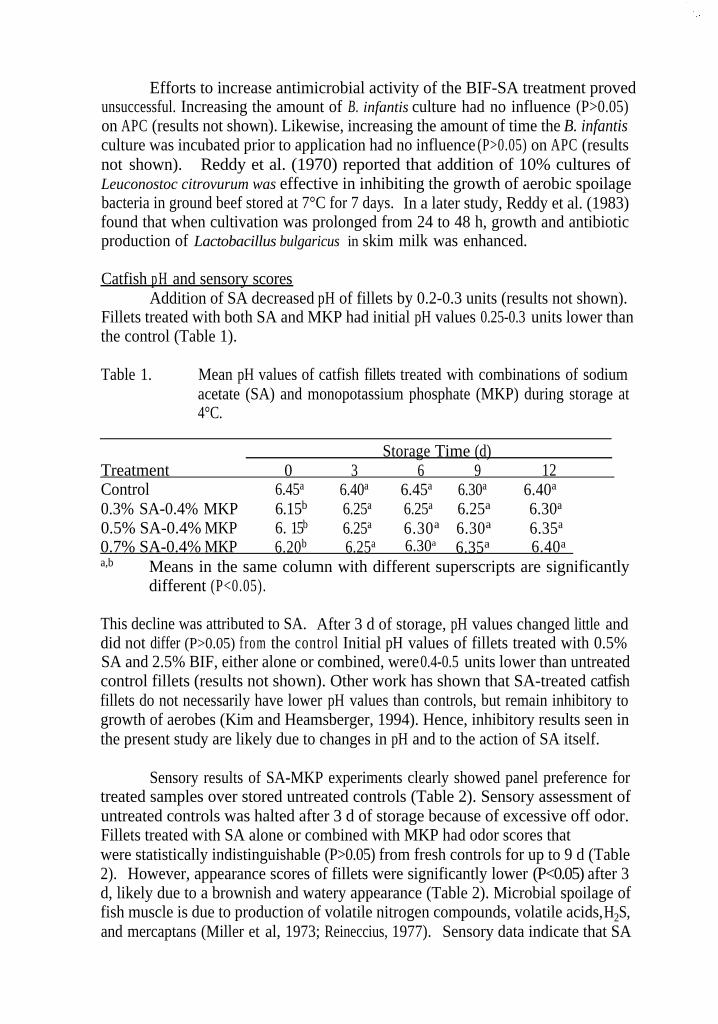
Table 1. Mean pH values of catfish fillets treated with combinations of sodiumacetate (SA) and monopotassium phosphate (MKP) during storage at4°C.
Storage Time (d)Treatment 0 3 6 9 12Control 6.45a 6.40a 6.45a 6.30a 6.40a
0.3% SA-0.4% MKP 6.15b 6.25a 6.25a 6.25a 6.30a
0.5% SA-0.4% MKP 6. 15b 6.25a 6.30a 6.30a 6.35a
0.7% SA-0.4% MKP 6.20b 6.25a 6.30a 6.35a 6.40aa,b Means in the same column with different superscripts are significantly
different (P<0.05).
This decline was attributed to SA. After 3 d of storage, pH values changed little anddid not differ (P>0.05) from the control Initial pH values of fillets treated with 0.5%SA and 2.5% BIF, either alone or combined, were 0.4-0.5 units lower than untreatedcontrol fillets (results not shown). Other work has shown that SA-treated catfishfillets do not necessarily have lower pH values than controls, but remain inhibitory togrowth of aerobes (Kim and Heamsberger, 1994). Hence, inhibitory results seen inthe present study are likely due to changes in pH and to the action of SA itself.
Sensory results of SA-MKP experiments clearly showed panel preference fortreated samples over stored untreated controls (Table 2). Sensory assessment ofuntreated controls was halted after 3 d of storage because of excessive off odor.Fillets treated with SA alone or combined with MKP had odor scores thatwere statistically indistinguishable (P>0.05) from fresh controls for up to 9 d (Table2). However, appearance scores of fillets were significantly lower (P<0.05) after 3d, likely due to a brownish and watery appearance (Table 2). Microbial spoilage offish muscle is due to production of volatile nitrogen compounds, volatile acids, H2S,and mercaptans (Miller et al, 1973; Reineccius, 1977). Sensory data indicate that SA
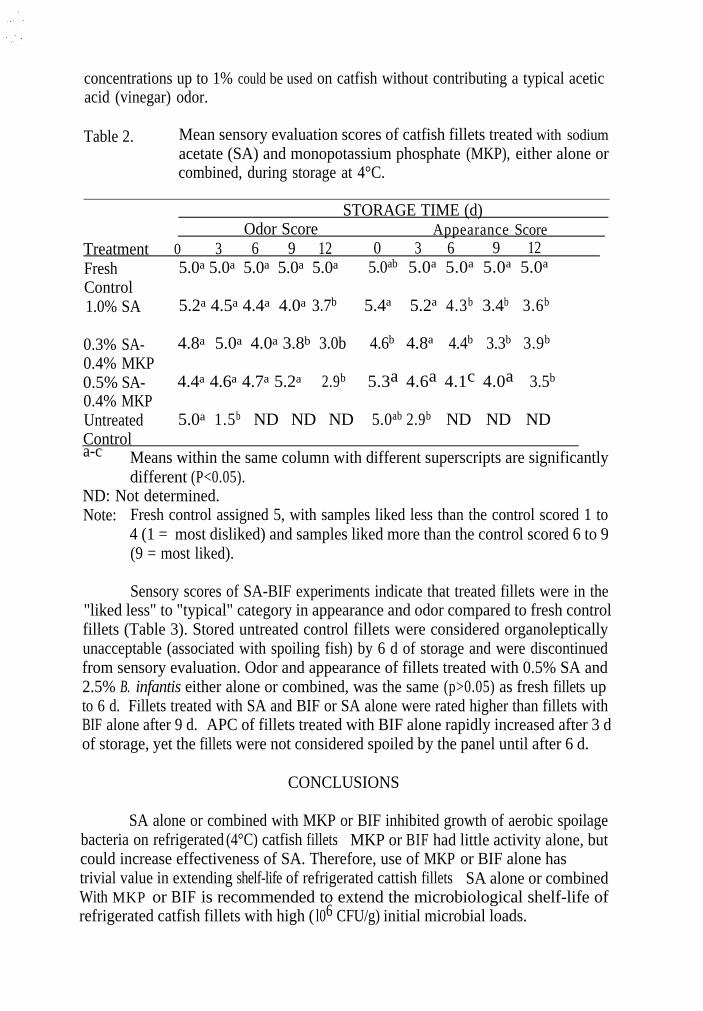
concentrations up to 1% could be used on catfish without contributing a typical aceticacid (vinegar) odor.
Table 2. Mean sensory evaluation scores of catfish fillets treated with sodiumacetate (SA) and monopotassium phosphate (MKP), either alone orcombined, during storage at 4°C.
STORAGE TIME (d)Odor Score Appearance Score
Treatment 0 3 6 9 12 0 3 6 9 12Fresh 5.0a 5.0a 5.0a 5.0a 5.0a 5.0ab 5.0a 5.0a 5.0a 5.0a
Control1.0% SA 5.2a 4.5a 4.4a 4.0a 3.7b 5.4a 5.2a 4.3b 3.4b 3.6b
0.3% SA- 4.8a 5.0a 4.0a 3.8b 3.0b 4.6b 4.8a 4.4b 3.3b 3.9b
0.4% MKP0.5% SA- 4.4a 4.6a 4.7a 5.2a 2.9b 5.3a 4.6a 4.1c 4.0a 3.5b
0.4% MKPUntreated 5.0a 1.5b ND ND ND 5.0ab 2.9b ND ND NDControla-c Means within the same column with different superscripts are significantly
different (P<0.05).ND: Not determined.Note: Fresh control assigned 5, with samples liked less than the control scored 1 to
4 (1 = most disliked) and samples liked more than the control scored 6 to 9(9 = most liked).
Sensory scores of SA-BIF experiments indicate that treated fillets were in the"liked less" to "typical" category in appearance and odor compared to fresh controlfillets (Table 3). Stored untreated control fillets were considered organolepticallyunacceptable (associated with spoiling fish) by 6 d of storage and were discontinuedfrom sensory evaluation. Odor and appearance of fillets treated with 0.5% SA and2.5% B. infantis either alone or combined, was the same (p>0.05) as fresh fillets upto 6 d. Fillets treated with SA and BIF or SA alone were rated higher than fillets withBIF alone after 9 d. APC of fillets treated with BIF alone rapidly increased after 3 dof storage, yet the fillets were not considered spoiled by the panel until after 6 d.
CONCLUSIONS
SA alone or combined with MKP or BIF inhibited growth of aerobic spoilagebacteria on refrigerated (4°C) catfish fillets. MKP or BIF had little activity alone, butcould increase effectiveness of SA. Therefore, use of MKP or BIF alone hastrivial value in extending shelf-life of refrigerated cattish fillets. SA alone or combinedWith MKP or BIF is recommended to extend the microbiological shelf-life ofrefrigerated catfish fillets with high ( l06 CFU/g) initial microbial loads.
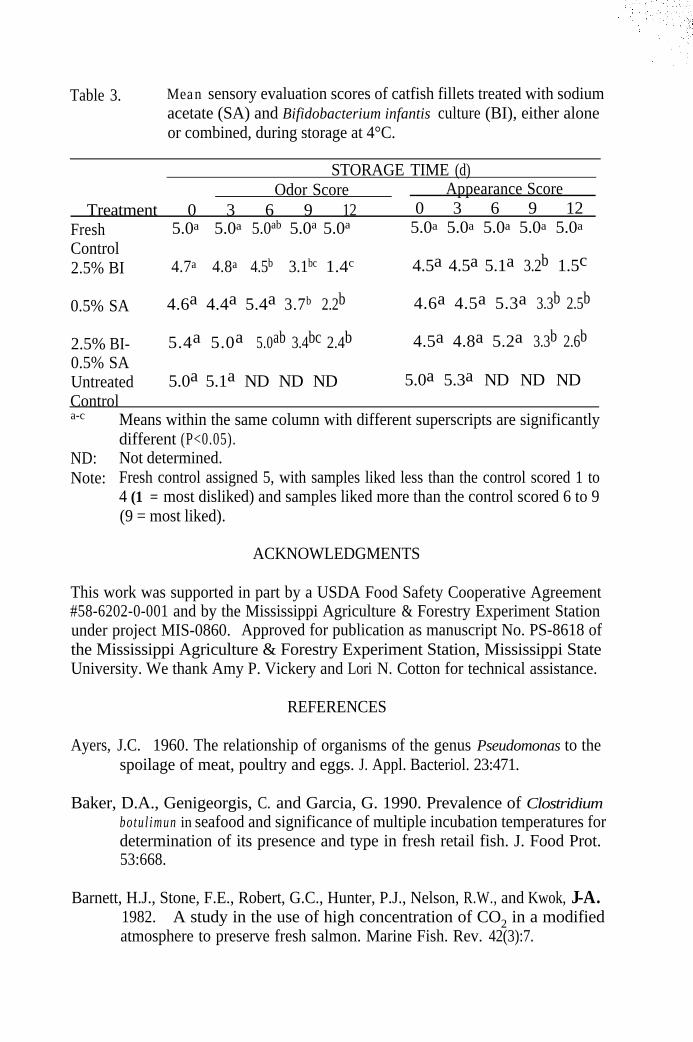
Table 3. Mean sensory evaluation scores of catfish fillets treated with sodiumacetate (SA) and Bifidobacterium infantis culture (BI), either aloneor combined, during storage at 4°C.
STORAGE TIME (d)Odor Score Appearance Score
Treatment 0 3 6 9 12 0 3 6 9 12Fresh 5.0a 5.0a 5.0ab 5.0a 5.0a 5.0a 5.0a 5.0a 5.0a 5.0a
Control2.5% BI 4.7a 4.8a 4.5b 3.1bc 1.4c 4.5a 4.5a 5.1a 3.2b 1.5c
0.5% SA 4.6a 4.4a 5.4a 3.7b 2.2b 4.6a 4.5a 5.3a 3.3b 2.5b
2.5% BI-0.5% SAUntreated
5.4a 5.0a 5.0ab 3.4bc 2.4b 4.5a 4.8a 5.2a 3.3b 2.6b
5.0a 5.1a ND ND ND 5.0a 5.3a ND ND NDControla-c
ND:Note:
Means within the same column with different superscripts are significantlydifferent (P<0.05).Not determined.Fresh control assigned 5, with samples liked less than the control scored 1 to4 (1 = most disliked) and samples liked more than the control scored 6 to 9(9 = most liked).
ACKNOWLEDGMENTS
This work was supported in part by a USDA Food Safety Cooperative Agreement#58-6202-0-001 and by the Mississippi Agriculture & Forestry Experiment Stationunder project MIS-0860. Approved for publication as manuscript No. PS-8618 ofthe Mississippi Agriculture & Forestry Experiment Station, Mississippi StateUniversity. We thank Amy P. Vickery and Lori N. Cotton for technical assistance.
REFERENCES
Ayers, J.C. 1960. The relationship of organisms of the genus Pseudomonas to thespoilage of meat, poultry and eggs. J. Appl. Bacteriol. 23:471.
Baker, D.A., Genigeorgis, C. and Garcia, G. 1990. Prevalence of Clostridiumbotul imun in seafood and significance of multiple incubation temperatures fordetermination of its presence and type in fresh retail fish. J. Food Prot.53:668.
Barnett, H.J., Stone, F.E., Robert, G.C., Hunter, P.J., Nelson, R.W., and Kwok, J-A.1982. A study in the use of high concentration of CO2 in a modifiedatmosphere to preserve fresh salmon. Marine Fish. Rev. 42(3):7.
Fey, M.S., and Regenstein, J.M. 1982. Extending shelf-life of fresh wet red hake andsalmon using CO2-O2 modified atmosphere and potassium sorbate ice at 1°C.J. Food Sci. 47:1048.
Gilliland, S.E., and Ewell, H.R. 1983. Influence of combinations of L a c t o b a c i l l u sl a c t i s and potassium sorbate on growth of psychrotrophs in raw milk. J.Dairy Sci. 66:974.
Gilliland, S.E., and Speck, M.L. 1975. Inhibition of psychrotrophic bacteria,Jactobacilli, and pediococci in nonfermented refrigerated foods. J. Food Sci.40:903.
Harrison, M.A., Huang, Y.-W., Chao, C.-H., and Shineman, T. 1991. Fate ofListeria monocytogenes on packaged, refrigerated, and frozen seafood. J.Food Prot. 54:524.
Herbert, R.A., and Shewan, J.M. 1976. Roles played by bacterial and autolyticenzymes in the production of volatile sulphides in spoiling North Cod (Gadusmorhua). J. Sci. Food Agri. 27:89.
Herbert, R.A., Hendrie, M.S., Gilson, D.M., and Shewan, J.M. 197 1. Bacteriaactive in the spoilage of sea foods. J. Appl. Bacteriol. 34:41.
Hughes, D.B., and Hoover, D.G. 1991. Bifidobacteria and their potential for use inAmerican dairy products. Food Technol. 45(4):74.
Ingham, S.C. 1989. Lactic acid dipping for inhibiting microbial spoilage ofrefrigerated catfish fillet pieces. J. Food Quality 12:433.
Josephson, D.B., Lindsay, R.C., and Stuiber, D.A. 1985. Effect of handling andpackaging on the quality of frozen whitefish. J. Food Sci. 50: 1.
Kim, CR., and Hearnsberger, J.O. 1994. Gram negative bacteria inhibition by lacticacid culture and food preservatives on catfish fillets during refrigeratedstorage. J. Food Sci. 59:513.
Laroia, S., and Martin, J.H. 1990. Bifidobacteria as possible dietary adjuncts incultured dairy products - A review. Cult. Dairy Prod. J. 25(4): 18.
Laroia, S., and Martin, J.H. 1991. Methods for enumeration and propagatingbifidobacteria. Cult. Dairy Prod. J. 26(2):32.
Lindgren, S.E., and Dobrogosz, W.J. 1989. Antagonistic activities of lactic acidbacteria in food and feed fermentations. FEMS Microbiol. Rev. 87: 149.
Marshall D.L., and Schmidt, R.H. 1988. Growth of Listeria monocytogenes at 10°Cin milk preincubated with selected pseudomonads. J. Food Prot. 51:277.
Mendonca, A.F., Molins, R.A., Kraft, A.A., and Walker, H.W. 1989, Effects ofpotassium sorbate, sodium acetate, phosphates and sodium chloride alone orin combination on shelf life of vacuum-packaged pork chops. J. Food Sci.54:302.
Miller, AR., Scanlan, R.A., Lee, J.S., and Libbey, L.M. 1973. Volatile compoundsproduced in sterile fish muscle (Sebastes melanops) by Pseudomonasparolens. Appl. Microbiol. 25:257.
Modler, H.W., McKellar, R.C., Goff, H.D., and Mackie, D.A. 1990. Using ice creamas a mechanism to incorporate bifidobacteria and fructooligosaccharides intothe human diet Cult. Dairy Prod. J. 25(3):4.
Molins, R.A. 1991. Antimicrobial Uses of Food Preservatives. In Phosphates inFood, 207-234. CRC Press, Inc., Boca Raton, FL.
Raccach, M., and Baker, R.C. 1978. Lactic acid bacteria as an antispoilage andsafety factor in cooked, mechanically deboned poultry meat. J. Food Prot.41:703.
Raccach, M., Baker, R.C, Regenstein, J.M., and Mulnix E.J. 1979. Potentialapplication of microbial antagonism to extended storage stability of a fleshtype food. J. Food Sci. 44:43.
Ray, B. 1992. Cells of Lactic Acid Bacteria as Food Preservatives. In FoodBiopreservatives of Microbial Origin . B. Ray and M. Daeschel (Ed.), 81-101. CRC Press, Inc., Boca Raton, FL.
Reddy, S.G., Henrickson, R.L., and Olson, H.C. 1970. The influence of lacticcultures on ground beef quality. J. Food Sci. 35:787.
Reddy, G.V., Shahani, K.M., Friend, B.A., and Chandan, R.C. 1983. Naturalantibiotic activity of Lactobacillus acidophilus and bulgaricus. III.Production and partial purification of bulgarican from Lactobacillusbulgaricus. Cult. Dairy Prod. J. 18(2): 15,
Reineccius, G.A. 1977. Symposium on meat flavor. Off-flavors in meat and fish.A review. J. Food Sci. 44:12.
SAS. 1992. SAS User’s Guide: Statistics. SAS Institute Inc., Cary, NC.
Schaack, M.M., and Marth E.H. 1988. Behavior of Listeria monocytogenes in skimmilk during fermentation with mesophilic lactic starter cultures. J. Food Prot.5 1:600.
Scott, D.N., Fletcher, G.C., and Hogg, M.G. 1986. Storage of snapper fillets inmodified atmospheres at -1°C. Food Technol. Aust. 38:234.
Swanson, K.M.J., Busta, F.F., Peterson, E.H., and Johnson, M.G. 1992. ColonyCount Methods. In Compendium of Methods for the MicrobiologicalExamination of Foods, 3rd ed. C. Vanderzant and D.F. Splittstoesser (Eds.),75-95. Am. Publ. Hlth. Assoc., Washington, DC.
Synder, L.D., and Maxcy, R.B. 1979. Effect of A w of meat products on growth ofradiation resistant Moraxella-Acinetobacter. J. Food Sci. 44:33.
Teraguchi, S., Uehara, M., Ogasa, K., and Mitsuoka, T. 1978. Enumeration ofbifidobacteria in dairy products. Jpn. J. Bacterial. 33:753.
Villemure, G., Simard, R.E., and Picard, G. 1986. BuIk storage of cod fillets andgutted cod (Gadus morhua) under carbon dioxide atmosphere. J. Food Sci.51:317.
Effect of Tray Design and Packaging Type onMicrobial Growth, Surface pH and Sensory Ratings
of Refrigerated Channel Catfish Fillets
J. L. Silvaa, B. Wannapee, C. Handumrongkul and J. KooDepartment of Food Science and Technology
Mississippi State UniversityMississippi State, MS 39762
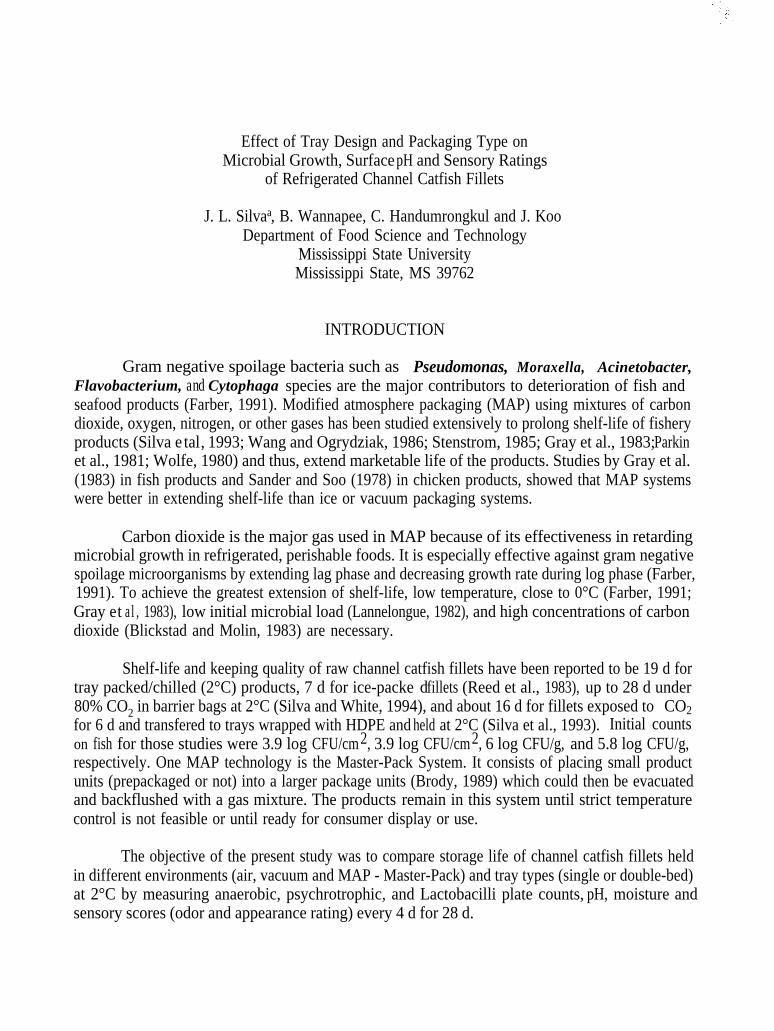
Gram negative spoilage bacteria such as Pseudomonas, Moraxella, Acinetobacter,Flavobacterium, and Cytophaga species are the major contributors to deterioration of fish and
INTRODUCTION
seafood products (Farber, 1991). Modified atmosphere packaging (MAP) using mixtures of carbondioxide, oxygen, nitrogen, or other gases has been studied extensively to prolong shelf-life of fisheryproducts (Silva e t al, 1993; Wang and Ogrydziak, 1986; Stenstrom, 1985; Gray et al., 1983; Parkinet al., 1981; Wolfe, 1980) and thus, extend marketable life of the products. Studies by Gray et al.(1983) in fish products and Sander and Soo (1978) in chicken products, showed that MAP systemswere better in extending shelf-life than ice or vacuum packaging systems.
Carbon dioxide is the major gas used in MAP because of its effectiveness in retardingmicrobial growth in refrigerated, perishable foods. It is especially effective against gram negativespoilage microorganisms by extending lag phase and decreasing growth rate during log phase (Farber,1991). To achieve the greatest extension of shelf-life, low temperature, close to 0°C (Farber, 1991;Gray et a l , 1983), low initial microbial load (Lannelongue, 1982), and high concentrations of carbondioxide (Blickstad and Molin, 1983) are necessary.
Shelf-life and keeping quality of raw channel catfish fillets have been reported to be 19 d fortray packed/chilled (2°C) products, 7 d for ice-packe d fillets (Reed et al., 1983), up to 28 d under80% CO2 in barrier bags at 2°C (Silva and White, 1994), and about 16 d for fillets exposed to CO2for 6 d and transfered to trays wrapped with HDPE and held at 2°C (Silva et al., 1993). Initial countson fish for those studies were 3.9 log CFU/cm2, 3.9 log CFU/cm2, 6 log CFU/g, and 5.8 log CFU/g,respectively. One MAP technology is the Master-Pack System. It consists of placing small productunits (prepackaged or not) into a larger package units (Brody, 1989) which could then be evacuatedand backflushed with a gas mixture. The products remain in this system until strict temperaturecontrol is not feasible or until ready for consumer display or use.
The objective of the present study was to compare storage life of channel catfish fillets heldin different environments (air, vacuum and MAP - Master-Pack) and tray types (single or double-bed)at 2°C by measuring anaerobic, psychrotrophic, and Lactobacilli plate counts, pH, moisture andsensory scores (odor and appearance rating) every 4 d for 28 d.
MATERIALS AND METHODSMaterials
Live channel catfish Ictalurus punctatus were processed into fillets at a commercial catfishprocessing operation and packed in a walk-in cooler at 2°C in single-(S) or double-(D) bed Styrofoamtrays with a moisture absorbant pad. The tray-packed fillets (2 per tray) were wrapped with a 2.7 milpolyethylene (HDPE) film and heat-sealed. The trays were packed in ice chests and covered with iceuntil further treatment at the Mississippi State University Food Science laboratories (not more than6 h).
One third of the trays were stored as packed (AIR); one third were unwrapped and placedindividually in permeable ETM bags (Cryovac Corp., Duncan, SC), vacuumized, and heat-sealed(VAC); and the other third were packed 5 trays to a bag in a barrier B700TM Master-Bag, airevacuated, and back flushed with CO2 to reach 90% CO2, 3% 0, and 7% N2 (MAP). The propertiesof each of the films are given in Table 1. All products were held at 2°C for up to 28 d and sampledp e r i o d i c a l l y .
Each treatment was replicated twice and analyses were performed in duplicates. Treatmentswere tray-type (D or S), gas environment (AIR , VAC, or MAP), and storage time (up to 28 d) at2°C.
Anaerobic (AnPC), psychrotrophic (PPC) and lactobacillii (LAC) plate counts were performedfollowing AOAC methods (FDA, 1992). Standard plate count agar (DIFCO Labs.) was used forAnPC (pour plates) and PPC (spread plates) with plates incubated at 25°C for 72 h in an anaerobicchamber and 21 °C for 72 h in a temperature controlled chamber for AnPC and PPC, respectively.Rogosa agar (DIFC O Labs) was used for LAC, using pour plating technique and incubatingaerobically at 25°C for 72 h.
Surface pH was measured using a flat-head electrode on the fish flesh as outlined by Silva andwhite (1994). Moisture was measured by shredding 5 g of fillet and heating at 100°C for 18 h(AOAC, 1990).
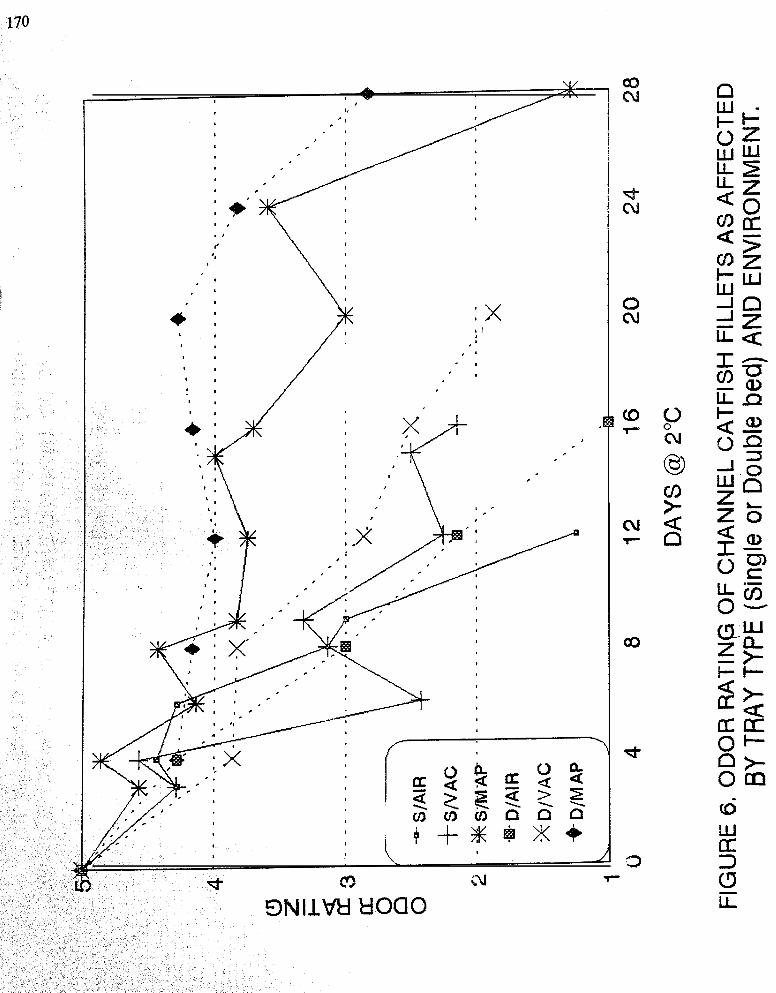
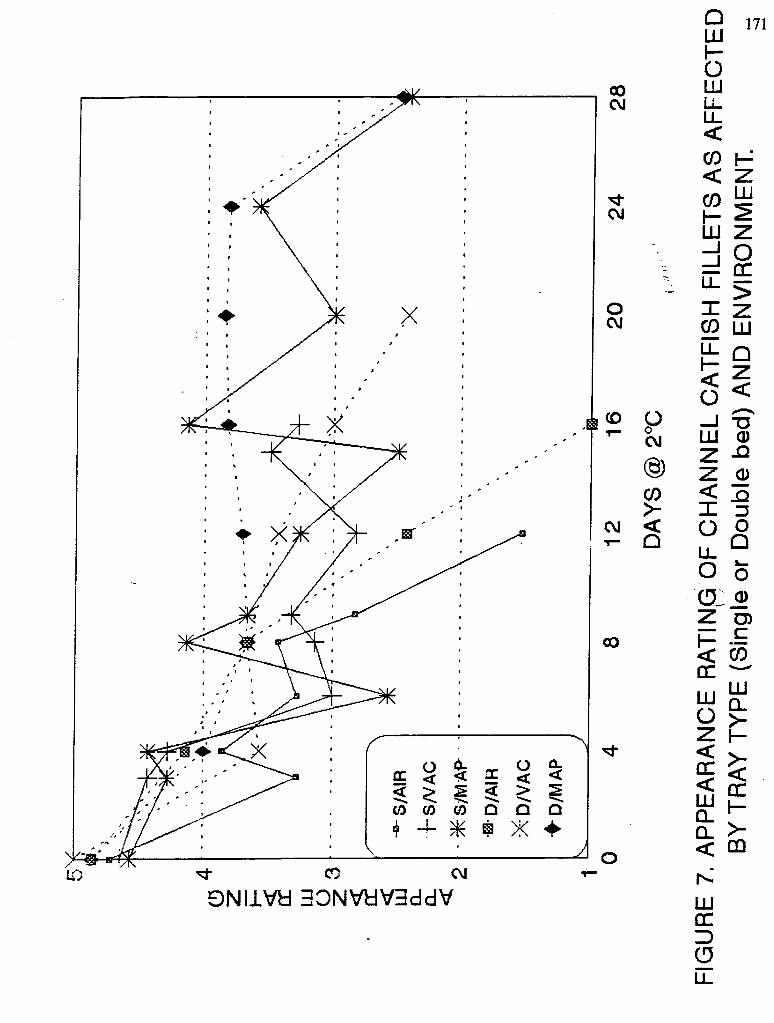
Appearance and odor ratings were conducted on the packaged products after sampling formicrobial counts, by seven trained panelists. A 5-point rating scale for appearance and odor was usedas follows: Appearance: 5 - fresh appearance 3 - slightly dry or slimy surface, 1 - slimy and off-colored surface , Odor: 5 - fresh, sweet odor, 3 - slightly spoiled (spoilage threshold rating), and 1 -totally spoiled/putrid.
RESULTS AND DISCUSSION
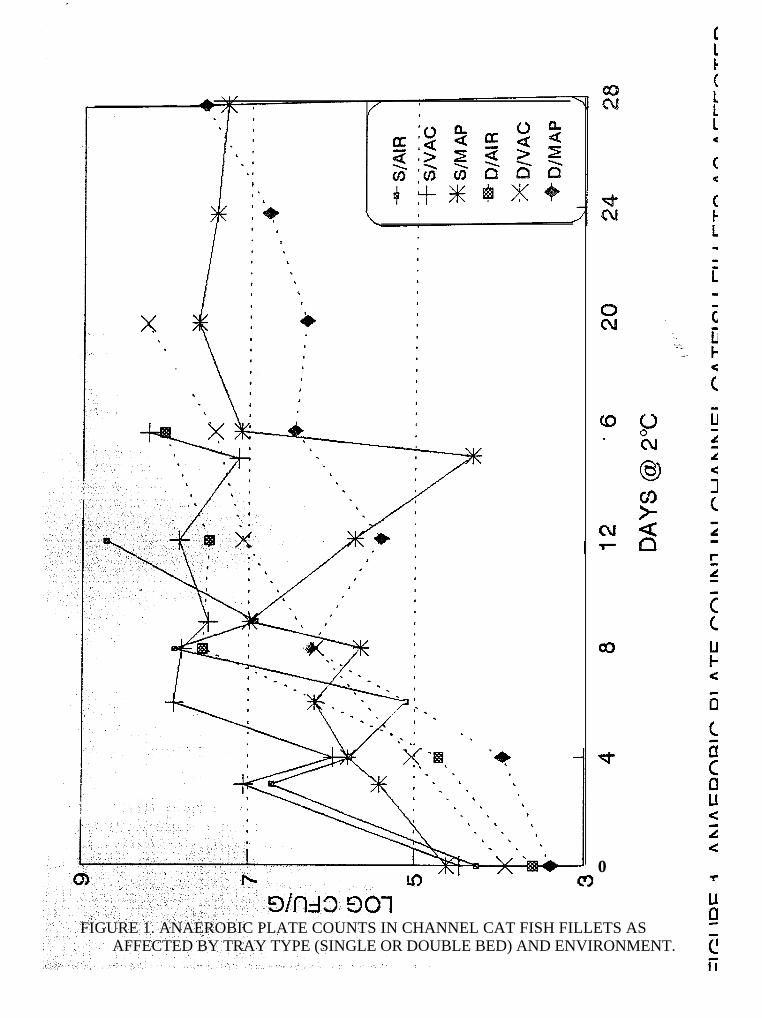
Initial anaerobic counts (AnPC) of fillets in double-(D) bed trays were lower than in single-(S)bed trays regardless of environment (Fig. 1). By the eighth day, AnPC were above 7 log CFU/g forall treatments except S/MAP, D/VAC, and D/MAP. By the 12 d, D/VAC products exceeded 7 logCFU/g, thus the product had spoiled (Handumrongkul and Silva, 1993; Martin and Hearnsberger,1993; Anonymous, 1992). Products packed under 90% CO2 in single-bed trays (S/MAP) exceeded7 log CFU/g after 16 d, whereas those packed in double-bed trays (D/MAP) did not exceed 7 logCFU/g until after 24 d.
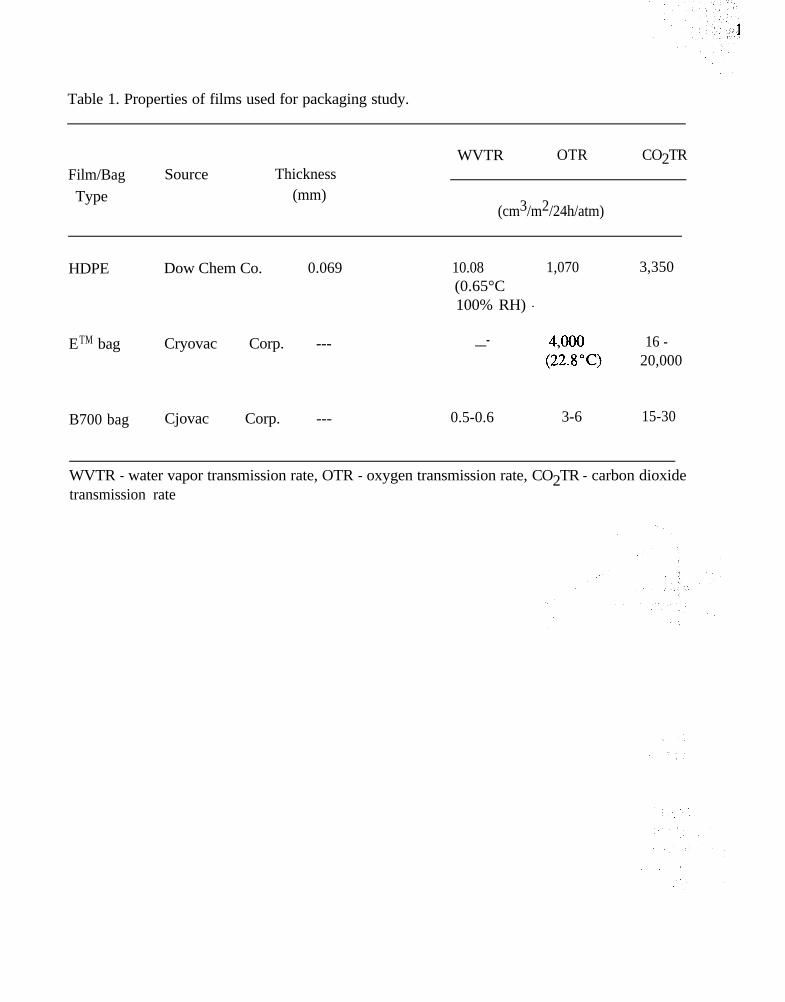
Table 1. Properties of films used for packaging study.
Film/BagType
Source Thickness(mm)
WVTR OTR
(cm3/m2/24h/atm)
CO2TR
HDPE Dow Chem Co. 0.069 10.08 1,070 3,350(0.65°C100% RH) -
ETM bag Cryovac Corp. --- __- 16 -20,000
B700 bag Cjovac Corp. --- 0.5-0.6 3-6 15-30
WVTR - water vapor transmission rate, OTR - oxygen transmission rate, CO2TR - carbon dioxidetransmission rate
.
AFFECTED BY TRAY TYPE (SINGLE OR DOUBLE BED) AND ENVIRONMENT.
,
. .
FIGURE 1. ANAEROBIC PLATE COUNTS IN CHANNEL CAT FISH FILLETS AS
Ei
co.
cu
a3
d-
0
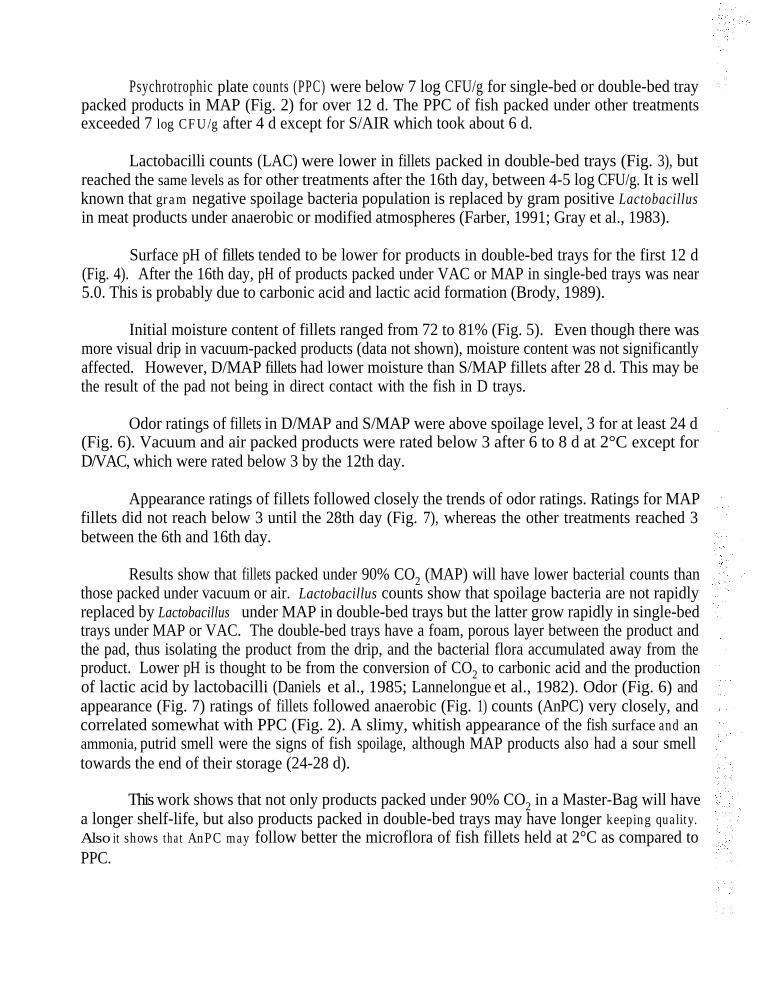
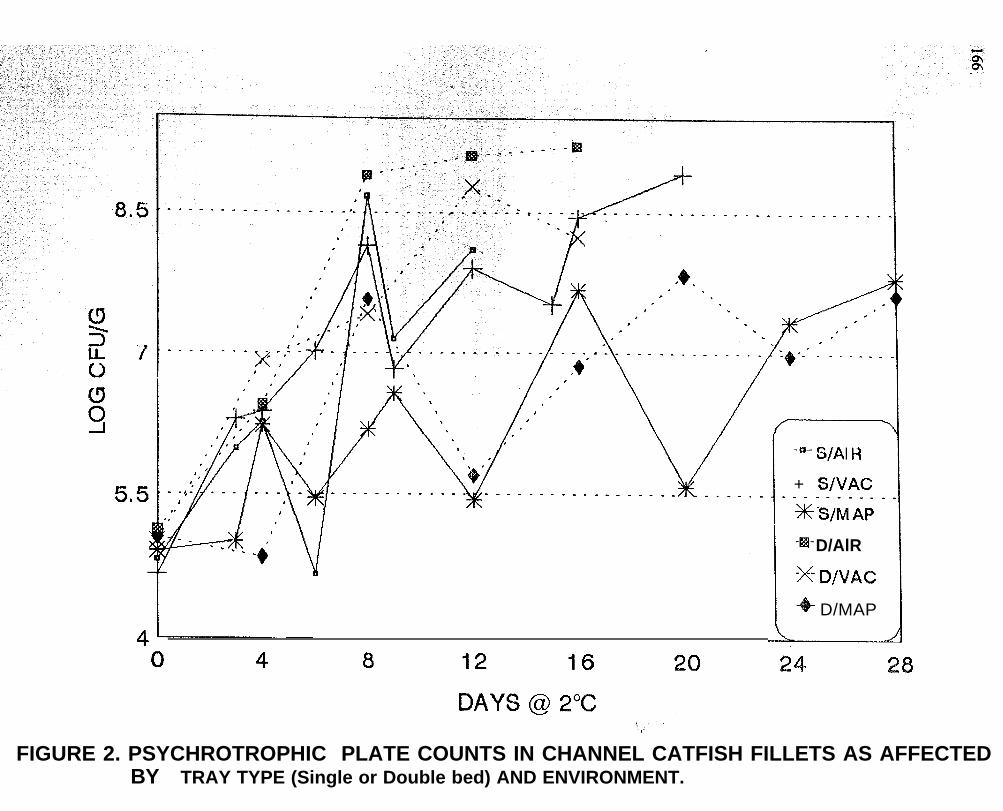
Psychrotrophic plate counts (PPC) were below 7 log CFU/g for single-bed or double-bed traypacked products in MAP (Fig. 2) for over 12 d. The PPC of fish packed under other treatmentsexceeded 7 log CFU/g after 4 d except for S/AIR which took about 6 d.
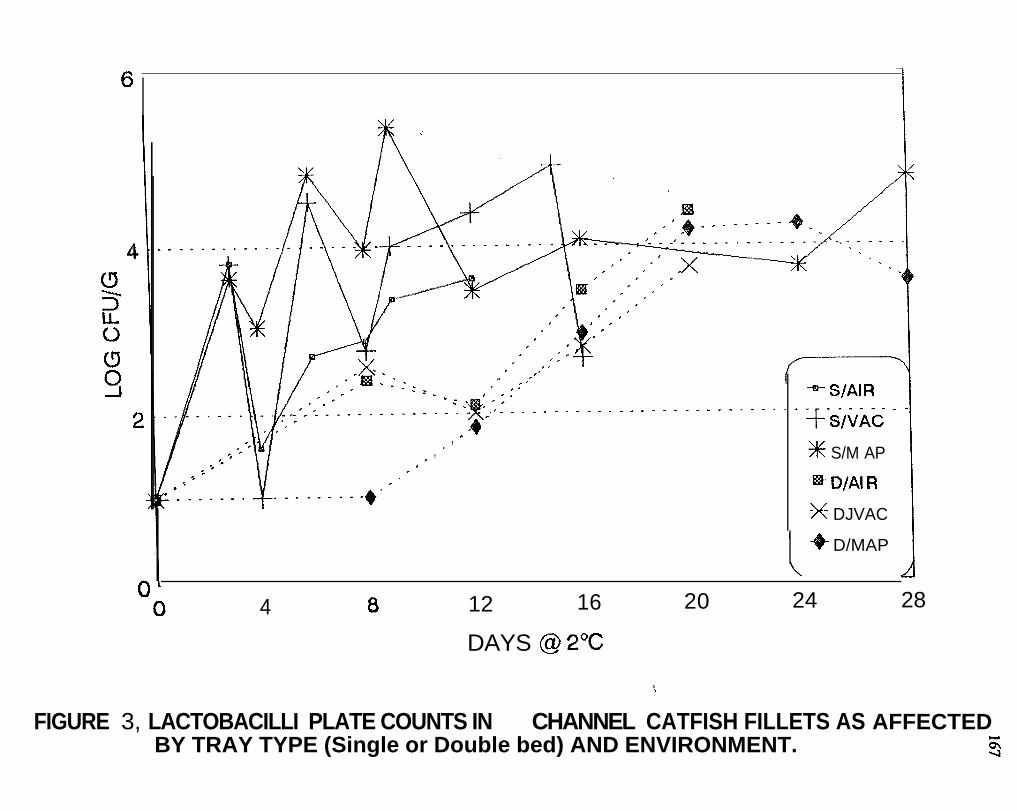
Lactobacilli counts (LAC) were lower in fillets packed in double-bed trays (Fig. 3), butreached the same levels as for other treatments after the 16th day, between 4-5 log CFU/g. It is wellknown that gram negative spoilage bacteria population is replaced by gram positive Lactobacillusin meat products under anaerobic or modified atmospheres (Farber, 1991; Gray et al., 1983).
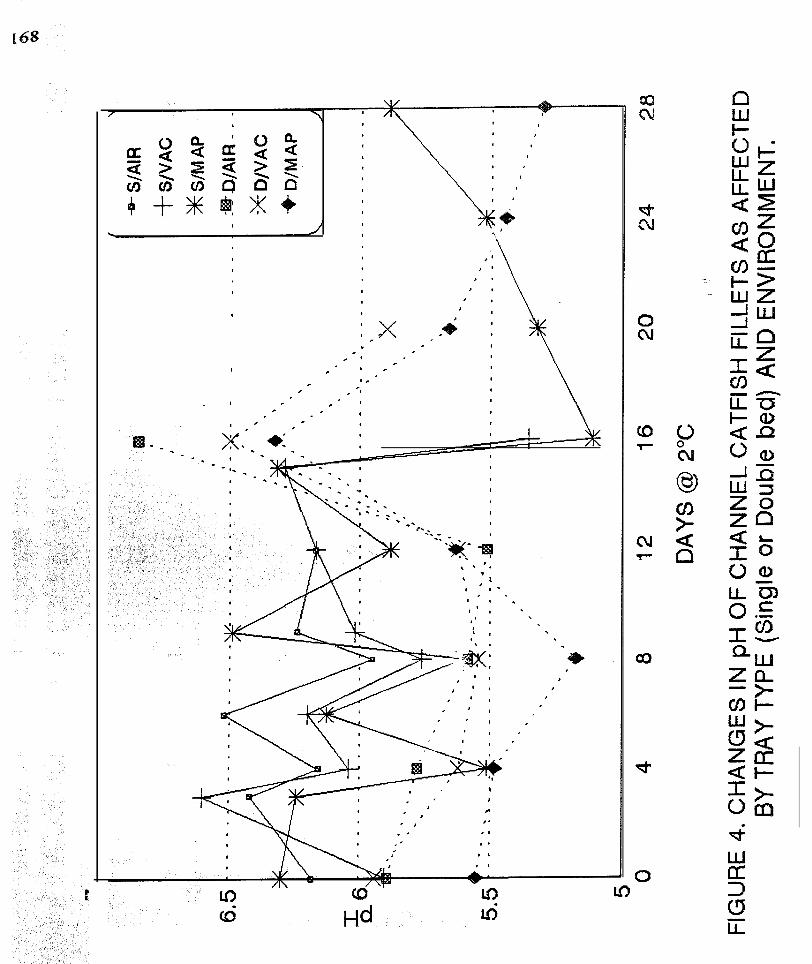
Surface pH of fillets tended to be lower for products in double-bed trays for the first 12 d(Fig. 4). After the 16th day, pH of products packed under VAC or MAP in single-bed trays was near5.0. This is probably due to carbonic acid and lactic acid formation (Brody, 1989).
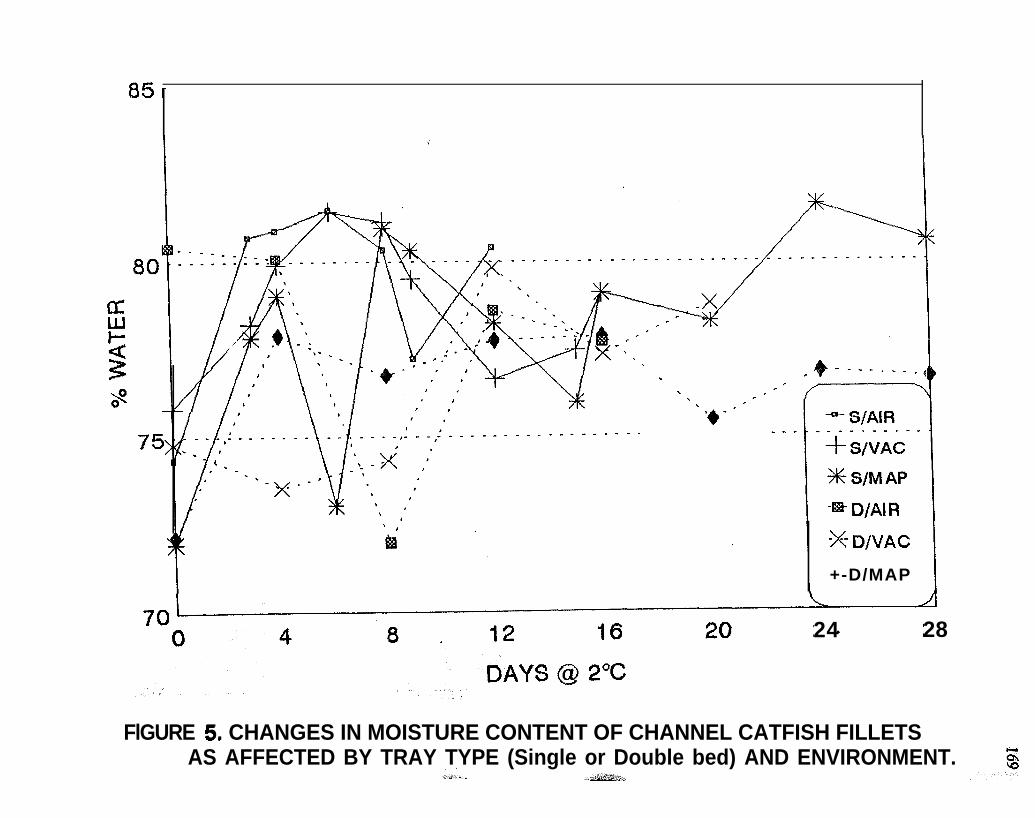
Initial moisture content of fillets ranged from 72 to 81% (Fig. 5). Even though there wasmore visual drip in vacuum-packed products (data not shown), moisture content was not significantlyaffected. However, D/MAP fillets had lower moisture than S/MAP fillets after 28 d. This may bethe result of the pad not being in direct contact with the fish in D trays.
Odor ratings of fillets in D/MAP and S/MAP were above spoilage level, 3 for at least 24 d(Fig. 6). Vacuum and air packed products were rated below 3 after 6 to 8 d at 2°C except forD/VAC, which were rated below 3 by the 12th day.
Appearance ratings of fillets followed closely the trends of odor ratings. Ratings for MAPfillets did not reach below 3 until the 28th day (Fig. 7), whereas the other treatments reached 3between the 6th and 16th day.
Results show that fillets packed under 90% CO2 (MAP) will have lower bacterial counts thanthose packed under vacuum or air. Lactobacillus counts show that spoilage bacteria are not rapidlyreplaced by Lactobacillus under MAP in double-bed trays but the latter grow rapidly in single-bedtrays under MAP or VAC. The double-bed trays have a foam, porous layer between the product andthe pad, thus isolating the product from the drip, and the bacterial flora accumulated away from theproduct. Lower pH is thought to be from the conversion of CO2 to carbonic acid and the productionof lactic acid by lactobacilli (Daniels et al., 1985; Lannelongue et al., 1982). Odor (Fig. 6) andappearance (Fig. 7) ratings of fillets followed anaerobic (Fig. 1) counts (AnPC) very closely, andcorrelated somewhat with PPC (Fig. 2). A slimy, whitish appearance of the fish surface and anammonia, putrid smell were the signs of fish spoilage, although MAP products also had a sour smelltowards the end of their storage (24-28 d).
This work shows that not only products packed under 90% CO2 in a Master-Bag will havea longer shelf-life, but also products packed in double-bed trays may have longer keeping quality.Also it shows that AnPC may follow better the microflora of fish fillets held at 2°C as compared toPPC.
.--.-_._ 1+_- _- : _ _ _ _ _
/:
-=- S/AI H
+ S/VAC______-__._ _~S/M_AP -
-a- D/AlR il I -x- B/VAC
D/MAP
FIGURE 2. PSYCHROTROPHIC PLATE COUNTS IN CHANNEL CATFISH FILLETS AS AFFECTEDBY TRAY TYPE (Single or Double bed) AND ENVIRONMENT.
6
12
D/MAP\
1.c 4 8 16 20 24 28
DAYS @ 2%
/\
FIGURE 3, LACTOBACILLI PLATE COUNTS IN CHANNEL CATFISH FILLETS AS AFFECTEDBY TRAY TYPE (Single or Double bed) AND ENVIRONMENT. 5
-S/AIR________.__._ - _+___ _
,.,c +# S/M AP
-ii+ D/Al R
-x- DJVAC
_-_ -
,
I c t cI
I,r, , -1,
. ‘ r ’ Icc , ‘. .
49 \ I
0 \
‘,*_ ‘.’. _ . -
--.-_._. . 4
+-D/MAP
24 28
FlGURE 5. CHANGES IN MOISTURE CONTENT OF CHANNEL CATFISH FILLETSAS AFFECTED BY TRAY TYPE (Single or Double bed) AND ENVIRONMENT. zu3
.*_ -
I
I ’, ’
. I
* : :X: ,
I ’I 1
* I
’ II
(I
,
cc
ACKNOWLEDGMENTS
The authors would like to express their sincere appreciation to America’s Catch (Itta Bena,MS) for providing the fish, trays, wrapping labor and technical assistance (especially Mr. TerryYoung and Mr. Phil Craft); to CRYOVAC Corp., a division of W. R. Grace and Company forproviding the barrier bags and technical assistance (especially Mr. Mitchell Coats), and to Ms. DonnaBland for the typing and editing of the manuscript.
REFERENCES
Anonymous. 1992. Is our fish fit to eat? Consumer reports, Vol. Pp. 102-l l4.AOAC. 1990.Official Methods of Analysis, 15th ed. Association of Official Analytical Chemists,Washington, DC.
Blickstad, E., and G. Molin. 1983. Carbon dioxide as a controller of the spoilage flora of pork, withspecial reference to temperature and sodium chloride. J. Food Prot. 46:756-763.
Brody, A L. 1989. Controlled/modified atmosphere/vacuum packaging of foods. Food and Nutr.Press, TrumbulI, CT.
Daniels, J. A., R. Krishnamurthi, and S. S. Rizvi. 1985. A review of effects of carbon dioxide onmicrobial growth and food quality. J. Food Prot. 48:532-537.
Farber, J, M. 199 1. Microbiological aspects of modified atmosphere packaging technology: Areview. J. Food Prot. 54:58-70.
FDA. 1992. Bacteriological Analytical Methods. 7th ed. AOAC, Washington, DC.
Gray, R. J. H., D. G. Hoover, and A M. Muir. 1983. Attenuation of microbial growth on modifiedatmosphere-packaged fish. J. Food Prot. 46:610-613.
Handumrongkul, C., and J. L. Silva. 1993. Aerobic counts, color and adenine nucleotide changesin CO2-packed refrigerated striped bass strips. J. Food Sci. 59:67-69.
Lannelongue, M., M. 0. Hanna, G. Finne, R. Nickelson, II, and C. Vanderzant. 1982. Storagecharacteristics of fish fillets (Archosargus probatocephalus) packaged in modified gasatmospheres containing carbon dioxide. J. Food Prot. 45:440-444.
Martin, J., and J. 0. Heamsberger. 1994. Evaluation of impedance microbiology for rapidassessment of shelf-life and quality of processed channel catfish, Ictalurus punctatus. J. Appl.Aquac. 3:353-362.
Parkin, K L., M. J. Wells, and W. D. Brown.J. Food Sci. 47:181-184.
1981. Modified atmosphere storage of rockfiih fillets.
173
Reed, R. J., G. R. Ammerman, and T. C. Chen. 1983. Chillpack studies on farm-raised channelcatfish. J. Food Sci. 48:311-312.
Sander, E. H., and H. Soo. 1978. Increasing shelf-life by carbon dioxide treatment and lowtemperature storage of bulk pack fresh chickens packaged in nylon/surlyn film. J. Food Sci.43:1519-1527.
Silva, J. L., and T. D. White. 1994. Bacteriological and color changes in modified atmospherepackaged refrigerated channel catfish. J . Food Prot. 57:7 15-7 19.
Silva, J. L., E . Harkness, and T. D. White. 1993. Residual effect of CO2 on bacterial counts andsurface pH of channel catfish. J. Food Prot. 56: 105 l-1053.
Stenstrom, I . 1985. Microbial flora of cod fillets (Gadus morhua) stored at 2°C in differentmixtures of carbon dioxide and nitrogen/oxygen. J. Food Prot. 48:585-589.
Wang, M. Y., and.D . M. Ogrydziak . 1986. Residual effect of storage in an elevated carbon dioxideatmosphere on the microbial flora of rock cod (Sebastes spp.) . Appl. Environ. Microbial.52:727-732.
Wolfe, S. K1980. Use of CO- and CO2, enriched atmospheres for meats, fish, and produce. FoodTechnol. 34(3):55-58,63.