effect of vapor wall loss in laboratory chambers on yields ... · pdf file"effect of...
TRANSCRIPT

1
Final Report to the California Air Resources Board
Contract 13-321
"Effect of Vapor Wall Loss in Laboratory Chambers on Yields of Secondary Organic Aerosols"
Prepared by: Dr. John H. Seinfeld
California Institute of Technology
Pasadena, CA 91125
Prepared for the California Air Resources Board and the California Environmental Protection Agency
November 2015

2
Disclaimer This report was prepared by the California Institute of Technology (Contractor) as an account of work sponsored by the California Air Resources Board (CARB) under contract # 13-321. T he statements and conclusions in this report are those of the contractor, and not necessarily those of CARB. The mention of any commercial products, their source, or their use in conjunction with material reported herein is not to be construed as an actual or implied endorsement of such products.
3
Acknowledgements This study was supported by State of California Air Resources Board agreement 13-321 and NOAA Climate Program Office AC4 program, award # NA13OAR4310058. We wish to acknowledge Rebecca Schwantes, Renee McVay, Hanna Lignell, Matthew Coggon, and Richard C. Flagan for contributions to this work. F inally, we wish to thank Dr. Nehzat Motallebi for many helpful comments during the course of this work.
4
Table of Contents List of Tables ...............................................................................................................................5 List of Figures ..............................................................................................................................6 Abstract ........................................................................................................................................8 Executive Summary ....................................................................................................................9 1. Introduction ...................................................................................................................12 2. Materials and Methods .................................................................................................13 2.1 Vapor flux arriving from the gas phase (Jv,i) ..........................................13 2.2 Vapor flux leaving from the wall due to evaporation (Jw,i) ....................15 3. Results ............................................................................................................................16 3.1 Absorbing organic mass on the chamber wall (Cw) ...............................18 3.2 Vapor sorption rate into FEP Teflon films .............................................20 3.3 Accommodation coefficient on the chamber wall (αw,i) ........................21 3.4 Characterizing chamber vapor wall deposition rate ................................23 4. Discussion.......................................................................................................................24 5. Joint Experiments with Georgia Institute of Technology Chamber ........................26 6. Summary and Conclusions ..........................................................................................28 7. Recommendations .........................................................................................................28 References ..................................................................................................................................30 List of Symbols ..........................................................................................................................33

5
List of Tables 1. Experimental conditions for production of oxidized organic vapors............................... 34 2. Best-fit values of vapor–wall accommodation coefficient (αw, i) and calculated equivalent absorbing organic mass (Cw) on the chamber wall for vapors with structure proposed based on the CIMS measurement ................................................ 35–38 3. Experiments conducted in the Georgia Tech chamber .................................................... 39

6
List of Figures 1. Theoretical framework representing the vapor-wall interactions. Concentrations of
organic vapor i in the well-mixed core, in the boundary layer, over the surface of the chamber wall, and in the chamber wall are denoted by , Cv,i, C0,i, and , respectively. Vapor fluxes at the gas-wall interface are denoted by Jv,i and Jw,i. ........... 40
2. Example of the experimental procedure to assess vapor wall deposition using 3-nitrooxy-6-dodecanol (m/z = (–) 332): Period (1) organic oxidation product generation; Period (2) vapor wall deposition at 298 K in the dark; Period (3) chamber
temperature ramp from 298 K to 318 K; and Period (4) temperature held at 318 K in the dark............................................................................................................................. 41 3. CIMS traces of oxidized organic vapors generated from the photooxidation of isoprene, toluene, α-pinene and dodecane under high/low-NO conditions over the four chamber periods in Figure 2. Colored circles represent CIMS measured normalized
signals during background, vapor generation, vapor wall deposition at 298 K, temperature ramp (yellow), and vapor re-evaporation at 318 K. Black dashed lines and gray solid lines represent the simulated deposition rates generated from reversible and irreversible, respectively .................................................................... 42–44 4. Comparison of vapor-wall interactions for α-pinene + OH products under controlled
experimental conditions in used (triangle) vs. unused (circle) Teflon chambers. 30-min averaged data are shown here for clarity. Bands at the bottom of each figure
denote successive experimental periods: vapor generation (first), vapor wall deposition at 298 K (second), temperature ramp (third), and vapor re-evaporation at 318 K (fourth) .............................................................................................................. 45 5. Inferred total amount of (a) equivalent absorbing organic mass on the chamber wall, Cw (g m-3), and (b) dimensionless Henry’s law constants, Hi, as a function of saturation
concentration, Ci* (µg m-3). Estimated vapor pressures of organic compounds studied
here are obtained from the average of predictions from the two group contribution methods, ‘SIMPOL.1’ (Pankow and Asher, 2008) and ‘EVAPORATION’ (Compernolle et al., 2011). The uncertainty bars give the upper and lower limits of Cw values derived from Eq (12), together with Eqs. (16) and (17), when either ‘EVAPORATION’ or ‘SIMPOL.1’ is used to estimate vapor pressures ............................................................. 46
6. Inferred accommodation coefficients of organic oxidation products on the chamber wall
(log10(αw,i)) as a function of saturation concentrations (log10(Ci*)) and average carbon
oxidation state (OSC). Filled circles represent the best-fit αw,i assuming irreversible gas-wall partitioning. The black solid line represents the linear regression
of log10(αw,i) vs. log10(Ci*) for all compounds ............................................................... 47
7. Predicted vapor wall deposition rate (kw,i / s-1) of organic compounds in a Teflon chamber as a function of carbon number (nC) and oxygen number (nO) ........................ 48

7
8. Comparison of estimated gas-particle equilibration timescale (τg/p,i) as a function of the gas-particle mass accommodation coefficient (αp,i, lower x-axis) and the ratio of total particle surface area to the chamber wall area (Ra, color bar), and vapor wall deposition timescale (τg/w,i) as a function of gas-wall mass accommo- dation coefficient (αw,i, upper x-axis). The grey solid straight line represents the gas-
particle equilibration time for a typical chamber experiment with seed surface area of ~ 1 × 10⁻³ µm2 cm-3. White solid and dashed lines define the region where τg/p,i ≅ τg/w,i.
For example, the top dashed white line is a collection of data points for which the equality τg/p,i = τg/w,i = 1.3 × 10³ min holds. τg/w,i is calculated by substituting
αw,i = 10-7 into Eqs (22), (23), and (24). τg/p,i is calculated from Eq (27) by varying αp,i (10-4–10-3) and Ra (0.01–0.02) ..................................................................... 49 9. Reaction profiles of the α-pinene ozonolysis experiments during which 100 ppb O3 is used. Panels (a), (c) and (e) show nucleation, "low AS-seed" and "medium AS-seed" experiments conducted in the Caltech chamber, respectively. Panels (b), (d) and (f) show the nucleation, "low AS-seed" and "medium AS-seed" experiments conducted in the Georgia Tech chamber, respectively................................ 50 10. Reaction profiles of the α-pinene ozonolysis experiments during which 500 ppb O3 is used. Panels (a), (c) and (e) show nucleation, "low AS-seed" and "medium AS-seed" experiments conducted in the Caltech chamber, respectively. Panels (b), (d) and (f) show the nucleation, "low AS-seed" and "medium AS-seed" experiments conducted in the Georgia Tech chamber, respectively................................ 51 11. Time-dependent growth curves for the α-pinene ozonolysis experiments during which (a) 100 ppb O3, and (b) 500 ppb O3 are used ....................................................... 52

8
Abstract Teflon chambers are ubiquitous in studies of atmospheric chemistry. Secondary organic aerosol (SOA) formation can be underestimated, owing to deposition of SOA-forming vapors to the chamber wall. We present here an experimental protocol and a model framework to constrain the vapor–wall interactions in Teflon chambers. W e measured the wall deposition rates of 25 oxidized organic compounds generated from the photooxidation of isoprene, toluene, α-pinene, and dodecane in two chambers that had been extensively used and in two new unused chambers. We found that the extent of prior use of the chamber did not significantly affect the sorption behavior of the Teflon films. Among the 25 compounds studied, the maximum wall deposition rate is exhibited by the most highly oxygenated and least volatile compounds. B y optimizing the model output to the observed vapor decay profiles, we identified that the dominant parameter governing the extent of wall deposition of a compound is its wall accommodation coefficient (αw,i), which can be correlated through its volatility with the number of carbons and oxygens in the molecule. B y doing so, the wall-induced deposition rate of intermediate/semi-volatile organic vapors can be reasonably predicted based on their molecular constituency. However, it needs to be noted that vapor wall vapor deposition rates observed by Paul Ziemann and his group are larger than those measured here. At present, there is no consistent explanation for this discrepancy. R econciliations of these differing experimental results is of high priority. O ne approach is to conduct matched experiments in different chambers. In this regard, we initiated a joint experiment between Caltech and Georgia Institute of Technology, in which matched chamber experiments were carried out in each laboratory. The goal of the experiments is to understand any differences in chamber performance for seemingly identical experiments of secondary organic aerosol formation in the dark ozone-alpha-pinene system. Initial analysis of the experiments carried out in the two chambers reveal significant differences in the amount and timing of SOA formation. Such experiments are of great value, as it is apparent that reconciliation and explanation of the data require analysis of all aspects of chamber operation, including chamber size, mixing, particle wall loss, and vapor wall loss, as well as the performance of the key instrumentation. This matched chamber study, the first of its type, to our knowledge, points to the potential importance of such inter-laboratory studies in diagnosing chamber results. As a result of this, we recommend that the CARB place a high priority on supporting future studies of this type. Completion of the analysis and preparation of an appropriate publication from the joint Caltech-Georgia Tech study will occur after the official termination of the present contract. Any publication will acknowledge support of the State of California Air Resources Board.

9
Executive Summary Atmospheric aerosols consist of from 50% to 90% organic material. Most of that organic material is converted from the gas phase to the particle phase, and is termed Secondary Organic Aerosol (SOA). Many measurements of organic aerosol levels around the world exist. Atmospheric models predict organic aerosol levels based on presumed mechanisms by which gas-phase organics are converted to the particle phase. Such models emerged into use about a decade ago. The first comprehensive comparisons of predicted vs. observed organic aerosol levels, carried out in locations like Mexico City and the eastern U.S., revealed that the predicted levels fall considerably below the observed levels, in some cases by a factor of five. This has sometimes been called the "missing carbon." A number of explanations were advanced to explain this model-measurement mismatch. One is that there is a pool of volatile organic compounds (VOCs) in the atmosphere, the conversion of which to SOA is not accounted for in models. The so-called "unresolved complex mixture" arising largely from motor vehicle emissions is a prime example. Another explanation advanced was that the models do not adequately account for the aging of VOCs by progressive oxidation, thereby leading to less volatile products more prone to form SOA. While both of these explanations were found to produce small, incremental increases in predicted SOA, neither of these explanations could account for the magnitude of the "missing carbon". The breakthrough came in in CalNex, when several groups examined carefully the comparison between predicted and observed organic aerosol levels based on motor vehicle emissions inventories in California. In particular, Ensberg et al. at Caltech compared observed and predicted organic aerosol levels based on motor vehicle emissions inventories. The only explanation that emerged that could explain the mismatch was that the laboratory chamber data upon w hich all models of SOA formation are based was, somehow, understating the yield of SOA from VOC oxidation. While loss of particles to chamber walls occurs in chambers, that process has been accounted for in chamber experiments for some time. A laboratory study by Paul Ziemann at University of California, Riverside revealed that gas-phase VOC oxidation products can deposit onto the Teflon walls of the chambers widely used to generate the basic data on S OA formation. The Caltech group, in collaboration with Chris Cappa at University of California, Davis, set out to quantify the effect of vapor wall deposition on measured SOA yields in chambers (Zhang et al., 2014a). By varying the amount of seed aerosol, and thereby the competition for vapor between the suspended growing aerosol and the chamber walls, they demonstrated conclusively that not properly accounting for the wall loss of VOC oxidation products could lead to SOA yields understated by the levels that model-measurement comparisons show. This study, published in PNAS, was the "smoking gun."
The extent to which vapors and the chamber wall interact is reflected by properties such as the gas-phase transport rate of organic molecules, affinity of the wall for various organic molecules, the degree of reversibility of the vapor–wall partitioning, and the equilibrium solubility of organic vapors in the wall. Organic materials generated in chamber experiments can deposit on the chamber wall to form a coating that can act as the primary absorbing medium, or the Teflon film itself could act as the absorbing medium, in a process akin to the sorption of small molecules by organic polymers. While measurement of vapor wall deposition rates for the thousands of organic molecules that are produced from the oxidation of SOA precursor VOCs is

10
not presently possible, empirical expressions that represent the deposition rates of organic vapors as a function of general molecular properties would be highly useful.
A prime goal of characterizing vapor wall deposition in a chamber is to understand its impact on SOA formation and evolution. We present here an experimental protocol to constrain the nature of organic vapor wall deposition in Teflon chambers. We measured wall-induced dark decay rates of 25 intermediate/semi-volatility organic vapors, which span a range of volatilities and oxidation states, in both unused and previously used chambers constructed with FEP Teflon film. A temperature ramping program (298–318 K) was implemented to study the reversibility of vapor–wall partitioning. A model framework is developed to describe interactions between organic vapors and the chamber wall following the theories for particle wall deposition and gas-particle partitioning. We address the following questions in the present study. (1) What is the physicochemical nature of the chamber wall? (2) What are the key parameters that characterize the vapor–wall interactions and how can these values be determined? (3) How can one predict the wall deposition rate of a specific compound based on its molecular properties?
The wall-induced decay of organic vapors is the result of coupled physical processes involving transport of organic vapors from the well-mixed core of a chamber to its wall by molecular and turbulent diffusion, uptake of organic molecules by the Teflon film, and re-evaporation from the wall. T he wall-induced dark decay of 25 intermediate/semi-volatility organic compounds generated from the photochemistry of four parent hydrocarbons was monitored in the Caltech dual 24 m3 FEP Teflon chambers. The extent to which organic vapors and the chamber wall interact was found to be similar in used vs. unused Teflon chambers. Based on this observation, one concludes that the Teflon film itself acts as an effective sorption medium, and organic materials deposited from past chamber experiments, if they indeed exist, do not significantly impact the sorption behavior of organic molecules. Reversibility in gas–wall partitioning was observed: e vaporation of all 25 compounds that had deposited on t he wall during an 18 h deposition period occurred when the chamber temperature was increased from 25 to 45°C. Based on a derived model that describes the dynamics of vapor deposition on the chamber wall, a single parameter, the accommodation coefficient ( ), emerges to govern the extent of the vapor–wall mass transfer process. Moreover, exhibits a strong dependence on the molecular properties, such as vapor pressure and oxidation state, of the 25 organics studied. We present an empirical expression for as a function of the compound vapor pressure, thus affording the possibility to predict the wall deposition rate of intermediate/semi/non-volatility compounds in a Teflon chamber based on their molecular constituency.
Quantifying the impact of vapor wall deposition on the chamber-derived SOA yield is the next step in assessing the effect of vapor wall deposition of SOA formation and evolution. To interpret chamber data with respect to the influence of vapor wall deposition on the formation of SOA it w ill be necessary to have a chamber model that simulates the competition between growing particles and the chamber wall for the low volatility VOC oxidation products. Deposition of vapors on particles and chamber walls is characterized by separate accommodation coefficients. As in the present project, accommodation coefficients for vapor molecules on t he chamber wall can be measured by injecting individual vapor species in the chamber and following their decay as a f unction of time in the absence of any chemical

11
reactions. As we have shown, the wall accommodation coefficients can be related to the volatility of the organic molecules. One area that still remains to be studied with respect to wall deposition of organic vapors is for extremely low volatility organic compounds (ELVOCs), which have been shown to contribute strongly to SOA formation. ELVOCs are difficult to measure in the gas phase and require very special instrumentation. This is the area in which further experiments to determine the accommodation coefficients of organic vapors on chamber walls need to be carried out. Determination of accommodation coefficients of vapor molecules on gr owing organic particles can only be made in the context of a full chamber experiment. This determination requires a state-of-art SOA predictive model that describes the dynamics of vapor–wall and vapor–particle interactions to estimate the fraction of organic vapor fluxes transported to the suspended particles vs. the chamber wall. The study reported by Zhang et al. (2014b) on toluene SOA employed a dynamic model that includes these features, but that model needs to be further developed to include aerosol size distribution dynamics. In addition, the model needs to be applied to experiments carried out on other important SOA systems, such as isoprene and alpha-pinene. We have to determine if there is consistency among the inferred values of the vapor-particle accommodation coefficients for various SOA systems; for example, is volatility the principal determinant or is molecular constituency influential?
In this project, we initiated a joint experiment between Caltech and Georgia Institute of Technology, in which matched chamber experiments were carried out in each laboratory. The goal of the experiments was to understand any differences in chamber performance for otherwise identical experiments of secondary organic aerosol formation in the ozone-alpha-pinene system. Preliminary data from the experiments reveal important differences in observed SOA formation. It is evident that all aspects of chamber operations contribute to the extent of SOA formation. Moreover, by performing matched experiments in different chambers, one can examine the extent to which behavior can be translated from chamber to chamber. A future high priority recommendation from the present project is that CARB consider supporting a comprehensive series of matched chamber experiments at Caltech and UC Riverside (Georgia Tech would also be interested to be a participant, affording three different chambers spanning sizes from small, medium, and large.)

12
1. Introduction Understanding of the mechanism and extent of secondary organic aerosol (SOA) formation from oxidation of volatile organic compounds (VOCs) has been derived largely from experiments in Teflon chambers. Chamber-measured SOA yields (mass of SOA formed per mass of VOC reacted) have been widely parameterized into regional/global atmospheric models, and chemical mechanisms leading to SOA formation and aging have been derived based on the gas/particle-phase identification of intermediate/semi/low-volatility compounds generated in controlled chamber experiments. An unavoidable consequence of the use of an environmental chamber is interaction of vapors and particles with the chamber wall. It has been recently established that SOA formation can be substantially underestimated due to deposition of SOA-forming vapors to the chamber wall rather than growing particles (Zhang et al., 2014a).
Chamber-wall-induced decay of organic vapors was reported 30 years ago. Grosjean (1985) and McMurry and Grosjean (1985) measured wall deposition rates of several volatile organic compounds in a chamber constructed from Fluorinated ethylene propylene (FEP) Teflon film. The lifetime of the VOCs, with respect to wall deposition, was found generally to exceed ~ 15 h. Loza et al. (2010) found that deposition of the isoprene oxidation product surrogate, 2,3-epoxy-1,4-butanediol (BEPOX), and glyoxal to the FEP Teflon chamber wall is reversible on sufficiently long timescales. On the contrary, rapid reversible gas–wall partitioning of n-alkanes, 1-alkenes, 2-alcohols, 2-ketones, monoacids, and 1,2-diols was universally observed by Matsunaga and Ziemann (2010) and Yeh and Ziemann (2014). Following the same experimental protocol, Kokkola et al. (2014) measured that the equilibrium fractions of nopinone and pinanediol on the wall of a 4 m3 FEP Teflon chamber are on average 0.4 and 0.8, respectively.
The extent to which vapors and the chamber wall interact is reflected by properties such as the gas-phase transport rate of organic molecules, affinity of the wall for various organic molecules, the degree of reversibility of the vapor–wall partitioning, and the equilibrium solubility of organic vapors in the wall. Organic materials generated in chamber experiments can deposit on the chamber wall to form a coating that can act as the primary absorbing medium, or the Teflon film itself could act as the absorbing medium, in a process akin to the sorption of small molecules by organic polymers. While measurement of vapor wall deposition rates for the thousands of organic molecules that are produced from the oxidation of SOA precursor VOCs is not presently possible, empirical expressions that represent the deposition rates of organic vapors as a function of general molecular properties would be highly useful.
A prime goal of characterizing vapor wall deposition in a chamber is to understand its impact on SOA formation and evolution. We present here an experimental protocol to constrain the nature of organic vapor wall deposition in Teflon chambers. We measured wall-induced dark decay rates of 25 intermediate/semi-volatility organic vapors, which span a range of volatilities and oxidation states, in both unused and previously used chambers constructed with FEP Teflon film. A temperature ramping program (298–318 K) was implemented to study the reversibility of vapor–wall partitioning. A model framework is developed to describe interactions between organic vapors and the chamber wall following the theories for particle wall deposition and gas-particle partitioning. We address the following questions in the present study. (1) What is the physicochemical nature of the chamber wall? (2) What are the key parameters that characterize the vapor–wall interactions and how can these values be determined? (3) How can one predict the wall deposition rate of a specific compound based on its molecular properties?

13
2. Materials and Methods Figure 1 depicts the steady-state concentration profiles of an organic compound i in the well-mixed core of the chamber , in the boundary layer adjacent to the wall , at the
wall surface , and in the chamber wall . Vapor molecules in the well-mixed core of a chamber are transported through a boundary layer adjacent to the wall by a combination of molecular and turbulent diffusion. The transport rate depends on both the molecular properties of the individual organic compound (as characterized by the molecular diffusion coefficient, Di), as well as the extent of turbulent mixing in the chamber (as characterized by the coefficient of eddy diffusion, Ke). As vapor molecules encounter the chamber wall, the fraction of those encounters that lead to uptake is represented by the accommodation coefficient , and
molecules rebound with a probability of . The accommodation coefficient depends, in principle, on the nature of the wall surface as well as the compound chemical composition. It is worth emphasizing that characterizes imperfect wall accommodation of the gas–wall interface. Molecules deposited on t he wall may re-evaporate at a rate that depends on t heir concentration in the wall. In order to represent this process, we note that, at equilibrium, the flux arriving from the gas phase and the evaporation flux from the wall are equal. Thus,
the evaporative flux from the wall can be expressed as a function of the accommodation
coefficient , as described in Eqs. (7)–(9) later.
A conservation balance on , the concentration of vapor i in the well-mixed core of a chamber that is subject only to the deposition process, is given by
, (1)
where is the deposition rate coefficient to the wall, is the evaporation
rate coefficient from the wall, and is the concentration of vapor i that has accumulated on
the chamber wall. The dynamic behavior of is described by a corresponding balance:
. (2)
Note that is assumed to be zero at the onset of vapor i generation, ultimately reaching
equilibrium with .
2.1 Vapor flux arriving from the gas phase
For a chamber that is relatively well mixed, transport to the wall occurs by molecular and turbulent diffusion across a thin boundary layer, of thickness δ, adjacent to the chamber wall.
14
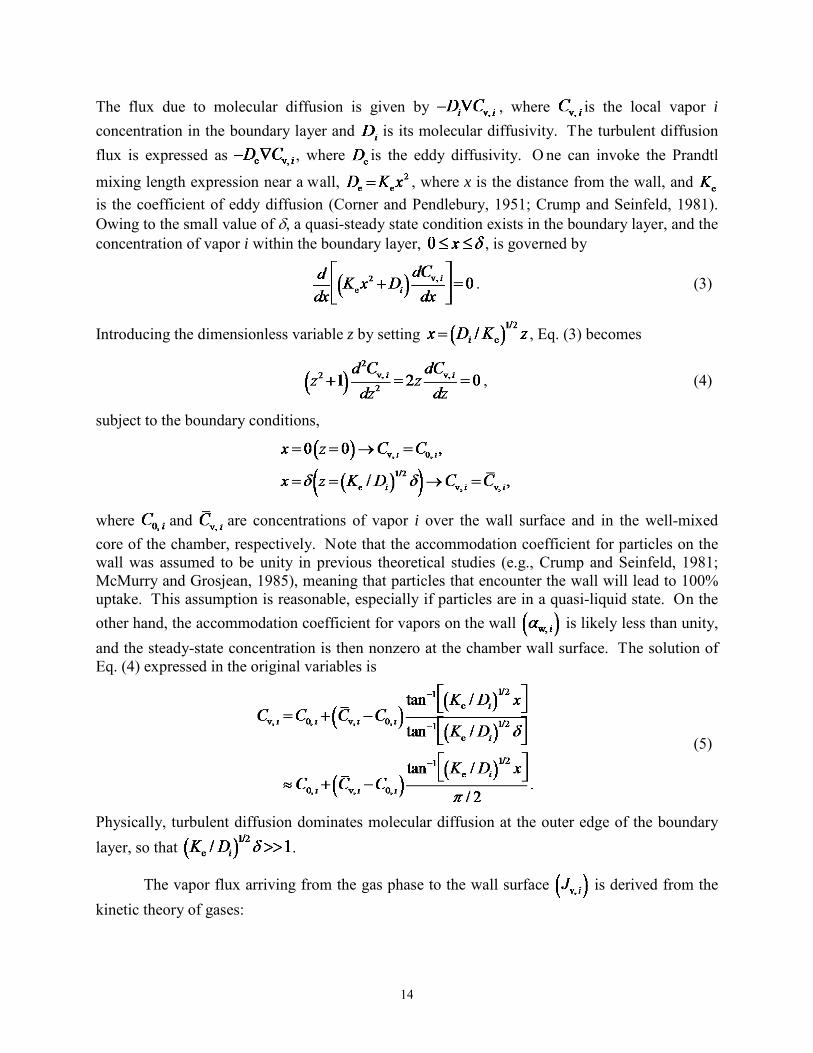
The flux due to molecular diffusion is given by , where is the local vapor i concentration in the boundary layer and is its molecular diffusivity. The turbulent diffusion flux is expressed as , where is the eddy diffusivity. O ne can invoke the Prandtl
mixing length expression near a wall, , where x is the distance from the wall, and is the coefficient of eddy diffusion (Corner and Pendlebury, 1951; Crump and Seinfeld, 1981). Owing to the small value of δ, a quasi-steady state condition exists in the boundary layer, and the concentration of vapor i within the boundary layer, , is governed by
. (3)
Introducing the dimensionless variable z by setting , Eq. (3) becomes
, (4)
subject to the boundary conditions,
where and are concentrations of vapor i over the wall surface and in the well-mixed core of the chamber, respectively. Note that the accommodation coefficient for particles on the wall was assumed to be unity in previous theoretical studies (e.g., Crump and Seinfeld, 1981; McMurry and Grosjean, 1985), meaning that particles that encounter the wall will lead to 100% uptake. This assumption is reasonable, especially if particles are in a quasi-liquid state. On the other hand, the accommodation coefficient for vapors on the wall is likely less than unity, and the steady-state concentration is then nonzero at the chamber wall surface. The solution of Eq. (4) expressed in the original variables is
(5)
Physically, turbulent diffusion dominates molecular diffusion at the outer edge of the boundary layer, so that .
The vapor flux arriving from the gas phase to the wall surface is derived from the kinetic theory of gases:

15
, (6)
where is the species mean thermal speed.
2.2 Vapor flux leaving from the wall due to evaporation
Without loss of generality, vapor wall deposition can be assumed to be reversible. The flux of molecules i that evaporate from the wall back to the gas phase depends on t he
concentration of i in the wall . So we can write as a function of :
, (7)
where λ is simply a quantity that reflects the positive correlation between and . If the gas and wall phases are at equilibrium, then
. (8)
Therefore,
, (9)
where Hi is the Henry's law constant of organic species i. Substitution of Eq. (9) into Eq. (7) gives
. (10)
If applying vapor–particle partitioning theory here, Eq. (10) can be rewritten as
, (11)
where is vapor–wall partition coefficient (Matsunaga and Ziemann, 2010):
, (12)
and where is the vapor pressure of compound i as a liquid. W e calculate by the average of two group contribution methods, "SIMPOL.1" developed by Pankow and Asher (2008) and "EVAPORATION" developed by Compernolle et al. (2011). , the activity coefficient in the wall layer on a mole fraction basis, is assumed to be unity here, R is the gas

16
constant, T is temperature, and is the average molecular weight of the absorbing organic material on the wall, which, following Matsunaga and Ziemann (2010), is assumed to be 250 g mol–1. (g m–3) is an assumed equivalent mass of absorbing organic material on the chamber wall (Matsunaga and Ziemann, 2010). It can be regarded as characterizing the equilibrium solubility of individual organic molecules in FEP Teflon polymer and, possibly, in other organic materials deposited on t he wall. W hen , the wall presents essentially an absorbing medium of infinite extent, and vapor wall deposition is ultimately an irreversible process. Note, however, that the concept of an “equivalent absorbing organic mass” does not necessarily imply that an actual layer of organic material exists on the chamber wall. might well represent the accumulation of deposited organic material from previous chamber experiments, or it could reflect the absorption properties of FEP film itself. We will return to the nature of shortly.
Since the gas–wall interface is presumed to have no t hickness, the net flux across the interface results from the concentration gradient,
. (13)
Note that when equilibrium is established, the net flux becomes zero and the concentration gradient no longer exists at the gas–wall interface. The LHS of Eq. (13) is based on Fick’s law of diffusion and leads to Eq. (5). In this way, the quantity is expressed as a function of
and . Therefore, the conservation equation for the change in the concentration of vapor i in the well-mixed core of the chamber owing to wall deposition is given by
, (14)
where A and V are the surface area and volume of the chamber, respectively. A rewrite of Eq. (14) gives
, (15a)
. (15b)
3. Results Experiments were conducted in the Caltech dual 24 m 3 Fluorinated ethylene propylene (FEP) Teflon chambers that are suitable for pristine (low-NO) and polluted (high-NO) conditions (Zhang and Seinfeld, 2013; Fahnestock et al., 2014; Loza et al., 2014). F igure 2 s hows a schematic of the experimental protocol used to measure deposition of organic vapors to the chamber wall. Oxidized organic va pors were generated via photooxidation of four parent VOCs, isoprene, toluene, α-pinene, and dodecane, in the absence of seed aerosol. O nce a

17
sufficient amount of oxidized products is formed with none or limited aerosol formation via nucleation, irradiation is ceased, and the ensuing wall-induced dark decay of the array of oxidation products is monitored by chemical ionization mass spectrometry (CIMS). Following this period, the chambers were heated to investigate the extent to which vapor–wall partitioning is reversible. These experiments were carried out in two chambers that had been used in past SOA studies. T wo control experiments were also conducted in two unused 24 m3 Teflon chambers using identical experimental protocols, see Table 1.
Vapor molecules representing SOA products were generated directly via VOC photooxidation, as opposed to the external injection of commercially available chemical standards. In this manner, uncertainly in the initial vapor concentration due to filling and mixing is avoided. In order to generate a spectrum of oxidized compounds characterized by a combination of different carbon numbers and types of functional groups, isoprene, toluene, α-pinene, and dodecane were chosen as the parent VOCs. P rior to each experiment, the Teflon chambers were flushed with purified dry air for 12 h at 45°C, then "conditioned" by UV irradiation for 24 h in the presence of 2 ppm H2O2, followed by purging with purified dry air for ~ 4 days at 25°C. Experiments were carried out under conditions in which the peroxy radicals formed from the initial OH reaction with the parent hydrocarbon react either primarily with NO (so-called high-NO) or HO2 and RO2 (so-called low-NO). F or low-NO conditions hydrogen peroxide (H2O2) was used as the OH source by evaporating 120 µl of 50% wt aqueous solution into the chamber with 5 L min–1 of purified air for ~ 110 min, resulting in an approximate starting H2O2 mixing ratio of 2.0 ppm. For high-NO conditions, nitrous acid (HONO) was used as the OH source by dropwise addition of 15 mL of 1 wt% NaNO2 into 30 mL of 10 wt% H2SO4 in a glass bulb and introduced into the chambers with 5 L min–1 of purified air for ~ 40 min. Ozone formation is substantially limited in the presence of a high concentration of HONO, and NO3 formation is negligible. A measured volume of hydrocarbon (isoprene/toluene/α-pinene/dodecane) was injected via a syringe into a glass bulb, which was connected to the Teflon chamber. Heated 5 L min–1 of purified air flowed through the glass bulb into the chamber for 20 min, introducing 25–200 ppb of hydrocarbon into the chamber. After ~ 60 m in mixing, photooxidation was initiated by irradiating the chamber with black lights with output wavelength ranging from 300 to 400 nm. Over the course of the irradiation period, the maximum particle mass concentration formed via nucleation ranged from 0.3 t o 2 µg m–3, corresponding to a particle surface area to chamber wall area ratio of < 10–5. Under these conditions, the surface area of particle present in the chamber is sufficiently low that partitioning of organic vapors onto particles is negligible. After ~ 1–7 h of reaction, UV lights were turned off and the decay of oxidation products due to wall deposition was monitored for ~ 13–16 h at 25°C. The chamber temperature was then ramped up to 45°C during the remaining ~ 4–6 h of the experiment with other conditions held constant.
Gas-phase organic compounds were monitored using a custom-modified Varian 1200 triple-quadrupole CIMS (Crounse et al., 2006; Paulot et al., 2009). In negative-mode operation, CF3O– was used as the reagent ion to cluster with analytes [R] with strong fluorine affinity such as hydroperoxide, producing [R•CF3O]– or m/z = [M + 85]–, where M is the molecular weight of the analyte. For more strongly acidic species [X], the transfer product, [X[H]•HF]– or m/z = [M + 19]–, is formed during ionization. Carboxylic acids tend to have contributions to both the transfer and cluster products, in which case the trace with higher signal-to-noise ratio is considered. Prior to each experiment, the purified air in the chamber was sampled, and this is
18
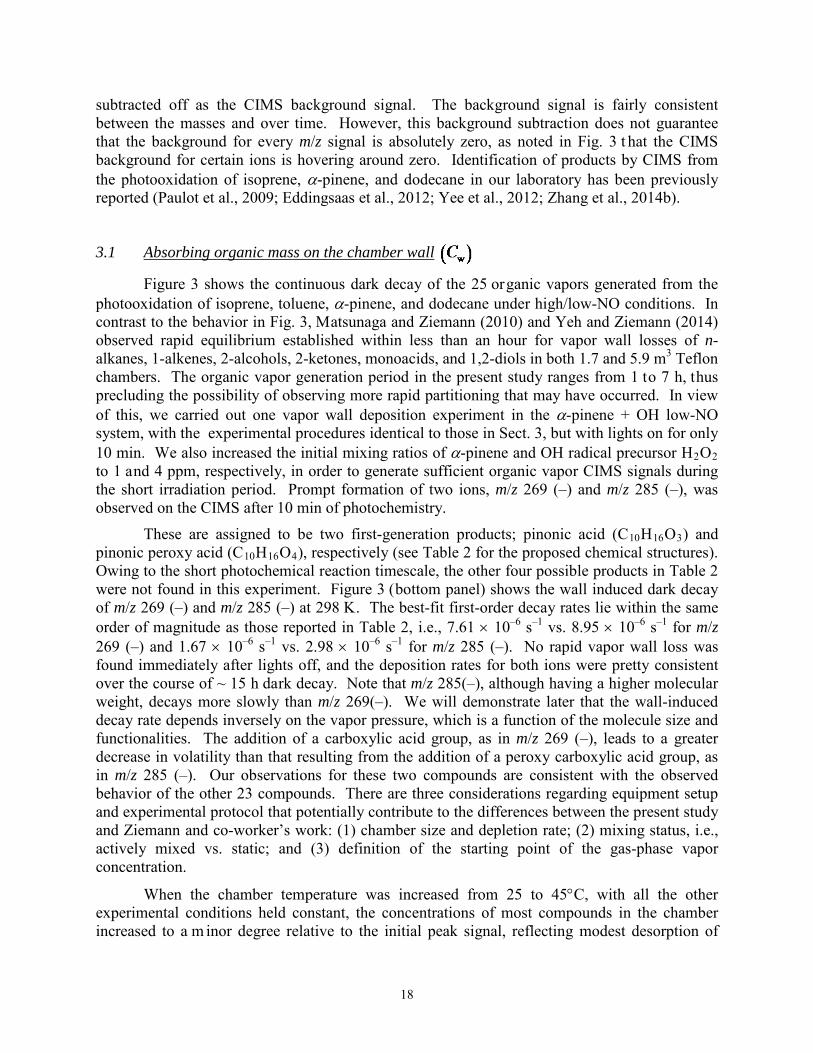
subtracted off as the CIMS background signal. The background signal is fairly consistent between the masses and over time. However, this background subtraction does not guarantee that the background for every m/z signal is absolutely zero, as noted in Fig. 3 t hat the CIMS background for certain ions is hovering around zero. Identification of products by CIMS from the photooxidation of isoprene, α-pinene, and dodecane in our laboratory has been previously reported (Paulot et al., 2009; Eddingsaas et al., 2012; Yee et al., 2012; Zhang et al., 2014b).
3.1 Absorbing organic mass on the chamber wall
Figure 3 shows the continuous dark decay of the 25 organic vapors generated from the photooxidation of isoprene, toluene, α-pinene, and dodecane under high/low-NO conditions. In contrast to the behavior in Fig. 3, Matsunaga and Ziemann (2010) and Yeh and Ziemann (2014) observed rapid equilibrium established within less than an hour for vapor wall losses of n-alkanes, 1-alkenes, 2-alcohols, 2-ketones, monoacids, and 1,2-diols in both 1.7 and 5.9 m3 Teflon chambers. The organic vapor generation period in the present study ranges from 1 to 7 h, thus precluding the possibility of observing more rapid partitioning that may have occurred. In view of this, we carried out one vapor wall deposition experiment in the α-pinene + OH low-NO system, with the experimental procedures identical to those in Sect. 3, but with lights on for only 10 min. We also increased the initial mixing ratios of α-pinene and OH radical precursor H2O2 to 1 and 4 ppm, respectively, in order to generate sufficient organic vapor CIMS signals during the short irradiation period. Prompt formation of two ions, m/z 269 (–) and m/z 285 (–), was observed on the CIMS after 10 min of photochemistry.
These are assigned to be two first-generation products; pinonic acid (C10H16O3) and pinonic peroxy acid (C10H16O4), respectively (see Table 2 for the proposed chemical structures). Owing to the short photochemical reaction timescale, the other four possible products in Table 2 were not found in this experiment. Figure 3 (bottom panel) shows the wall induced dark decay of m/z 269 (–) and m/z 285 (–) at 298 K. The best-fit first-order decay rates lie within the same order of magnitude as those reported in Table 2, i.e., 7.61 × 10⁻⁶ s–1 vs. 8.95 × 10⁻⁶ s–1 for m/z 269 (–) and 1.67 × 10⁻⁶ s–1 vs. 2.98 × 10⁻⁶ s–1 for m/z 285 (–). No rapid vapor wall loss was found immediately after lights off, and the deposition rates for both ions were pretty consistent over the course of ~ 15 h dark decay. Note that m/z 285(–), although having a higher molecular weight, decays more slowly than m/z 269(–). We will demonstrate later that the wall-induced decay rate depends inversely on the vapor pressure, which is a function of the molecule size and functionalities. The addition of a carboxylic acid group, as in m/z 269 (–), leads to a greater decrease in volatility than that resulting from the addition of a peroxy carboxylic acid group, as in m/z 285 (–). Our observations for these two compounds are consistent with the observed behavior of the other 23 compounds. There are three considerations regarding equipment setup and experimental protocol that potentially contribute to the differences between the present study and Ziemann and co-worker’s work: (1) chamber size and depletion rate; (2) mixing status, i.e., actively mixed vs. static; and (3) definition of the starting point of the gas-phase vapor concentration.
When the chamber temperature was increased from 25 to 45°C, with all the other experimental conditions held constant, the concentrations of most compounds in the chamber increased to a m inor degree relative to the initial peak signal, reflecting modest desorption of
19
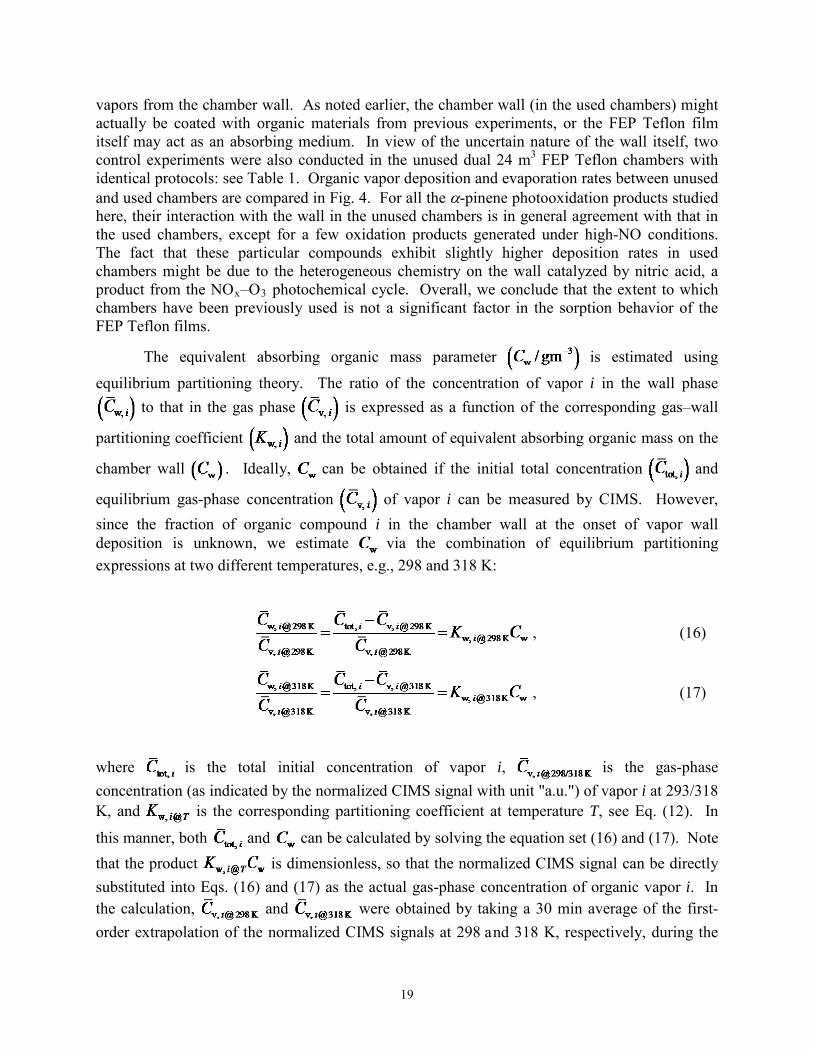
vapors from the chamber wall. As noted earlier, the chamber wall (in the used chambers) might actually be coated with organic materials from previous experiments, or the FEP Teflon film itself may act as an absorbing medium. In view of the uncertain nature of the wall itself, two control experiments were also conducted in the unused dual 24 m3 FEP Teflon chambers with identical protocols: see Table 1. Organic vapor deposition and evaporation rates between unused and used chambers are compared in Fig. 4. For all the α-pinene photooxidation products studied here, their interaction with the wall in the unused chambers is in general agreement with that in the used chambers, except for a few oxidation products generated under high-NO conditions. The fact that these particular compounds exhibit slightly higher deposition rates in used chambers might be due to the heterogeneous chemistry on the wall catalyzed by nitric acid, a product from the NOx–O3 photochemical cycle. Overall, we conclude that the extent to which chambers have been previously used is not a significant factor in the sorption behavior of the FEP Teflon films.
The equivalent absorbing organic mass parameter is estimated using
equilibrium partitioning theory. The ratio of the concentration of vapor i in the wall phase to that in the gas phase is expressed as a function of the corresponding gas–wall
partitioning coefficient and the total amount of equivalent absorbing organic mass on the
chamber wall . Ideally, can be obtained if the initial total concentration and
equilibrium gas-phase concentration of vapor i can be measured by CIMS. However, since the fraction of organic compound i in the chamber wall at the onset of vapor wall deposition is unknown, we estimate via the combination of equilibrium partitioning expressions at two different temperatures, e.g., 298 and 318 K:
, (16)
, (17)
where is the total initial concentration of vapor i, is the gas-phase concentration (as indicated by the normalized CIMS signal with unit "a.u.") of vapor i at 293/318 K, and is the corresponding partitioning coefficient at temperature T, see Eq. (12). In
this manner, both and can be calculated by solving the equation set (16) and (17). Note that the product is dimensionless, so that the normalized CIMS signal can be directly substituted into Eqs. (16) and (17) as the actual gas-phase concentration of organic vapor i. In the calculation, and were obtained by taking a 30 min average of the first-order extrapolation of the normalized CIMS signals at 298 and 318 K, respectively, during the

20
temperature ramping period. The estimated values vary by approximately 5 orders of magnitude and exhibit a strong dependence on the volatility of the organics, as shown in Table 2 and Fig. 5a. We will address subsequently why the values span such a wide range.
3.2 Vapor sorption into FEP Teflon films
It is instructive to consider possible mechanisms of organic vapor interactions with Teflon films. Dual sorption mechanisms in glassy polymers have been identified: ordinary dissolution and microvoid-filling (Meares, 1954; Paul, 1979; Paterson et al., 1999; Tsujita, 2003; Kanehashi and Nagai, 2005). From the point of view of solubility behavior, organic polymers such as FEP Teflon may be idealized as high molecular weight organic liquids (Vieth et al., 1966). The polymer rubbery state is hypothesized to represent a thermodynamic equilibrium liquid state within which gas solubility obeys Henry’s law. The glassy state, on the other hand, is considered to comprise two components: a hypothetical liquid state and a solid state, the latter containing a distribution of microvoids/holes that act to immobilize a portion of the penetrant molecules when the polymer is below its glass transition temperature (Tg = 339K for FEP, Kim and Smith, 1990). The overall solubility of a gas molecule in a glassy polymer has been expressed by (Barrer et al., 1958; Michaels et al., 1963; Vieth et al., 1966; Kanehashi and Nagai, 2005):
, (18)
where C is the total vapor concentration in the glassy polymer, is the concentration based on Henry's law dissolution, is the concentration based on Langmuir sorption, is the Henry's law constant, p is the partial pressure in the gas phase, is the hole saturation constant, and b is the hole affinity constant. If bp << 1, Eq. (18) reduces to
. (19)
The condition of bp << 1 holds in the present situation because the partial pressures of organic vapors generated in the chamber are < 10–7 atm, and the derived hole affinity constants for small organic molecules are < 1 atm–1 in glassy polymers (Vieth et al., 1966; Sada et al., 1988; Kanehashi and Nagai, 2005). If Eq. (18) holds for the equilibrium sorption behavior of organic vapors by FEP films, then the dimensionless form of the effective Henry’s law constant
can be expressed as a function of the partitioning coefficient of vapor i and total
absorbing organic mass on the chamber wall :
. (20)
21
As shown in Fig. 5b, the derived Henry’s law constants for the organic oxidation products span approximately 2 orders of magnitude and depend inversely on s aturation concentrations
. This behavior suggests that organic vapor solubility in FEP films increases with
decreasing volatility, i.e., increasing carbon number and functionalization. This behavior provides a qualitative explanation for the wide range of values calculated for the 25 organic vapors studied here. Although the solubility of low volatility vapors in the FEP Teflon film is relatively high (large ), the total equivalent absorbing organic mass on the wall required for gas–wall partitioning can still be low (small ) because low volatility compounds tend to partition preferentially in the wall phase (large ). As illustrated in Fig. 5b, the dimensionless Henry’s law constant of m/z = (–)303, a product from α-pinene low-NO photochemistry, is ~ 20 times larger than that of m/z = (–)185, a product from isoprene + OH under high-NO conditions. The vapor pressure of m/z = (–)303, however, is ~ 6 orders of magnitude lower than that of m/z = (–)185. As a result, the value for m/z = (–)303 is ~ 5 orders of magnitude smaller than that for m/z = (–)185. One infers that the equivalent absorbing organic mass on the chamber wall derived earlier is not constant but specific to individual organic compounds, i.e., a function of volatility and solubility in FEP Teflon polymer. We will show that is not the most dominant parameter, so the assumption of a single value for does not invalidate the usefulness of the theory.
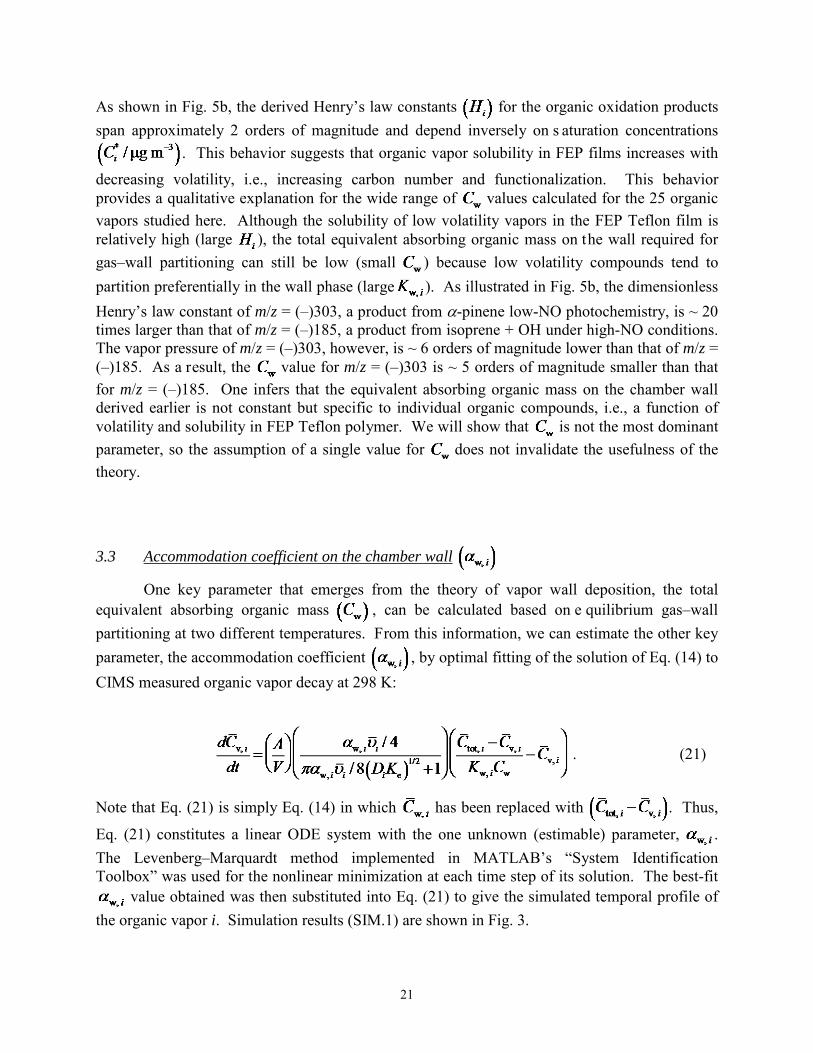
3.3 Accommodation coefficient on the chamber wall
One key parameter that emerges from the theory of vapor wall deposition, the total equivalent absorbing organic mass , can be calculated based on e quilibrium gas–wall partitioning at two different temperatures. From this information, we can estimate the other key parameter, the accommodation coefficient , by optimal fitting of the solution of Eq. (14) to CIMS measured organic vapor decay at 298 K:
. (21)
Note that Eq. (21) is simply Eq. (14) in which has been replaced with . Thus,
Eq. (21) constitutes a linear ODE system with the one unknown (estimable) parameter, . The Levenberg–Marquardt method implemented in MATLAB’s “System Identification Toolbox” was used for the nonlinear minimization at each time step of its solution. The best-fit
value obtained was then substituted into Eq. (21) to give the simulated temporal profile of the organic vapor i. Simulation results (SIM.1) are shown in Fig. 3.

22
The other limit of wall behavior is that of irreversible gas–wall partitioning . In this case, the accommodation coefficient is the sole governing parameter and Eq. (14) can be simplified as
. (22a)
The overall wall loss rate of organic vapor i is therefore
. (22b)
Results for irreversible gas–wall partitioning (SIM.2) are shown in Fig. 3.
Simulations using both reversible (SIM.1) and irreversible (SIM.2) vapor wall deposition expressions match the experimental data. Outputs from SIM.1 tend to level off, whereas those from SIM.2 exhibit a continuous decreasing trend at the end of ~ 18 h of vapor decay. The extent of agreement between observations and simulations depends on the nature of vapor wall deposition: most organic vapors in the Caltech Teflon chambers exhibit a continuous decay. The agreement between SIM.1 and SIM.2 indicates that the estimated values are sufficiently large so that the wall-induced vapor deposition in the Caltech chamber can be treated as an irreversible process within a relatively long timescale (< 18 h).
Overall, results from the two simulations indicate that is the more influential parameter than in describing the wall-induced deposition of semi-volatile organic vapors. The significance of is 2-fold: first, the accommodation coefficient for the desorption of organic molecules from the gas–wall interface equals that for the adsorption/uptake process, which together influence the time needed to establish equilibrium; and second, diffusion in the chamber wall is not considered in the theoretical framework; consequently, the best-fit will reflect the mass transfer resistance in both the gas–wall interface and the chamber wall layer. We suggest that the vapor wall deposition of individual compounds can be adequately parameterized through the accommodation coefficient as the single dominant variable. As shown in Table 2 a nd Fig. 6, f or the compounds studied here, estimated values of span approximately 2 or ders of magnitude (10–8–10–6) and depend inversely on volatility, implying that more highly functionalized compounds dissolve more easily in FEP Teflon film. The correlation of with the average carbon oxidation state (OSC), however, is not strong due to the fact that vapor pressures of molecules, although highly oxidized, are not necessarily low.

23
3.4 Characterizing chamber vapor wall deposition rate
The wall-induced deposition of the 25 or ganic compounds investigated in the present study can be sufficiently represented by a single parameter, the wall accommodation coefficient
, which is observed to exhibit a strong inverse dependence on (Fig. 6). It is possible to
formulate an empirical expression for as a function of , a p arameter that can be estimated by vapor pressure prediction models.
Linear regression was performed on vs. for the 25 organic vapors studied:
. (23)
We employ a group-contribution expression for as a function of carbon number and oxygen number developed by Donahue et al. (2011):
. (24)
where is the carbon number of 1 µ g–3 alkane ( = 28.0483), bC is the carbon–carbon interaction term (bC = 0.4015), bO is the oxygen–oxygen interaction term (bO = 2.3335), and bCO is the carbon–oxygen nonideality term (bCO = –0.4709). Best-fit values of , bC, bO, and bCO are obtained by optimal fitting Eq. (24) to the saturation concentrations of 110 species, including C5–C14 n-alkanes, C5–C14 carbonyls, C5–C14 di-carbonyls, C5–C14 alcohols, C5–C14 diols, C5–C14 carboxylic acids, C5–C14 di-carboxylic acids, C5–C14 peroxides, C5–C14 di-peroxides, C5–C14 nitrates, and C5–C14 di-nitrates. Vapor pressures of these species are estimated by taking the average of predictions from the two group contribution methods, "SIMPOL.1" and "EVAPORATION".
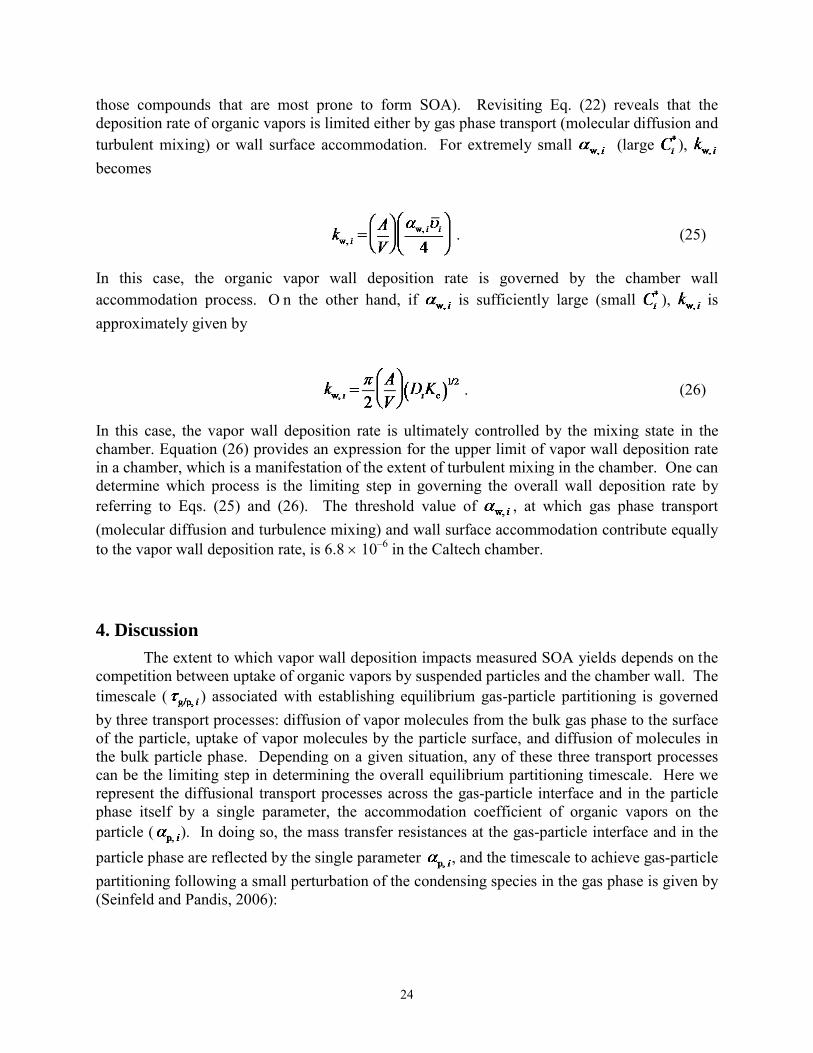
Combining Eqs. (22), (23), and (24), the vapor wall deposition rate of any intermediate/semi/low-volatility compound ( ) can be ultimately related to its carbon and oxygen numbers. This vapor wall loss rate estimation approach, although simplified, proves to be quite useful considering the limited knowledge of the chemical structures of the thousands of ions detected by mass spectrometry during an experiment. The proper guess of a molecular formula would be able to constrain the wall-induced decay rate of each ion, and thus provide information to better understand its formation and removal dynamics. In this way, one can reasonably constrain the wall-induced organic vapor deposition rate based on only two measurable or predictable properties, volatility and the extent of oxygenation.
As shown in Fig. 7, within a certain volatility range, increases with decreasing , implying that highly functionalized compounds tend to deposit on t he chamber wall more efficiently. The maximum value of vapor wall deposition rate is eventually approached for highly oxygenated and extremely low-volatility compounds (which, of course, are precisely
24
those compounds that are most prone to form SOA). Revisiting Eq. (22) reveals that the deposition rate of organic vapors is limited either by gas phase transport (molecular diffusion and turbulent mixing) or wall surface accommodation. For extremely small (large ), becomes
. (25)
In this case, the organic vapor wall deposition rate is governed by the chamber wall accommodation process. O n the other hand, if is sufficiently large (small ), is approximately given by
. (26)
In this case, the vapor wall deposition rate is ultimately controlled by the mixing state in the chamber. Equation (26) provides an expression for the upper limit of vapor wall deposition rate in a chamber, which is a manifestation of the extent of turbulent mixing in the chamber. One can determine which process is the limiting step in governing the overall wall deposition rate by referring to Eqs. (25) and (26). The threshold value of , at which gas phase transport (molecular diffusion and turbulence mixing) and wall surface accommodation contribute equally to the vapor wall deposition rate, is 6.8 × 10⁻⁶ in the Caltech chamber.
4. Discussion The extent to which vapor wall deposition impacts measured SOA yields depends on the competition between uptake of organic vapors by suspended particles and the chamber wall. The timescale ( ) associated with establishing equilibrium gas-particle partitioning is governed by three transport processes: diffusion of vapor molecules from the bulk gas phase to the surface of the particle, uptake of vapor molecules by the particle surface, and diffusion of molecules in the bulk particle phase. Depending on a given situation, any of these three transport processes can be the limiting step in determining the overall equilibrium partitioning timescale. Here we represent the diffusional transport processes across the gas-particle interface and in the particle phase itself by a single parameter, the accommodation coefficient of organic vapors on the particle ( ). In doing so, the mass transfer resistances at the gas-particle interface and in the particle phase are reflected by the single parameter , and the timescale to achieve gas-particle partitioning following a small perturbation of the condensing species in the gas phase is given by (Seinfeld and Pandis, 2006):

25
, (27)
where Np is the total number concentration of suspended particles, is the number mean
particle diameter, is the Knudsen number, and is the correction factor for noncontinuum diffusion and imperfect accommodation (Seinfeld and Pandis, 2006).
Figure 8 shows the predicted as a function of: (1) the ratio of total particle surface area to chamber wall area (Ra) and (2) . T he diagonal straight line represents for a typical chamber experiment with seed surface area of ~ 1000 µm2 cm–3. In this case, equilibrium vapor–particle partitioning is established within a few minutes in the presence of perfect accommodation of organic vapors onto particles ( ) or when a sufficiently large concentration of suspended particles is present (e.g., COA = 105 µg m–3 when < 10–4).
By analogy with the treatment of gas-particle partitioning, the time scale associated with vapor–wall interactions is presumably governed by gas-phase diffusion of vapor molecules to the wall through a boundary layer adjacent to the wall, uptake of vapor molecules at the wall surface, and, potentially, diffusion of molecules in the wall. Again, a s ingle parameter, the accommodation coefficient on the wall ( ), is employed to represent the latter two processes. Thus, the vapor wall deposition timescale is given by
. (28)
The white solid line in Fig. 8 represents the predicted , covering a range of several minutes to several hours, as a function of the vapor accommodation coefficient on t he chamber wall
. T he region to the left of the white solid line is that in which and are
competitive. For low (e.g., < 10–8), is comparable to only if the vapor has a low
accommodation coefficient on the particles ( ) or if a relatively small concentration of
particles is present in the chamber . For , is estimated to be of the
order of several minutes and, as a result, vapor transport to particles is suppressed by competition with the chamber wall, even with the perfect particle accommodation ( ) or high particle
concentrations .
Overall, in the region (confined by the white solid and dash lines in Fig. 8) where gas–wall partitioning is competitive with gas-particle partitioning, it is necessary to account for vapor wall deposition when deriving SOA yields from chamber experiments. T he theoretical framework developed in this study suggests that the area of this region is ultimately controlled by the accommodation coefficient of organic vapors on pa rticles vs. the chamber wall
.
26
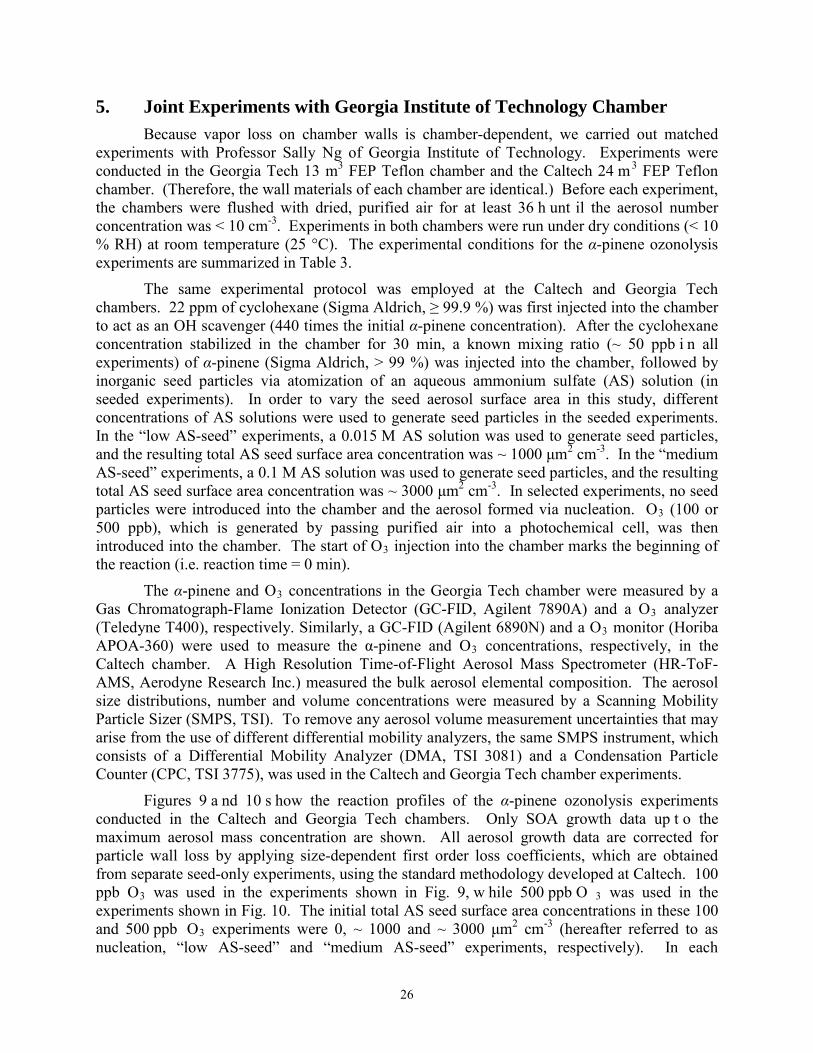
5. Joint Experiments with Georgia Institute of Technology Chamber Because vapor loss on chamber walls is chamber-dependent, we carried out matched experiments with Professor Sally Ng of Georgia Institute of Technology. Experiments were conducted in the Georgia Tech 13 m3 FEP Teflon chamber and the Caltech 24 m3 FEP Teflon chamber. (Therefore, the wall materials of each chamber are identical.) Before each experiment, the chambers were flushed with dried, purified air for at least 36 h unt il the aerosol number concentration was < 10 cm-3. Experiments in both chambers were run under dry conditions (< 10 % RH) at room temperature (25 °C). The experimental conditions for the α-pinene ozonolysis experiments are summarized in Table 3.
The same experimental protocol was employed at the Caltech and Georgia Tech chambers. 22 ppm of cyclohexane (Sigma Aldrich, ≥ 99.9 %) was first injected into the chamber to act as an OH scavenger (440 times the initial α-pinene concentration). After the cyclohexane concentration stabilized in the chamber for 30 min, a known mixing ratio (~ 50 ppb i n all experiments) of α-pinene (Sigma Aldrich, > 99 %) was injected into the chamber, followed by inorganic seed particles via atomization of an aqueous ammonium sulfate (AS) solution (in seeded experiments). In order to vary the seed aerosol surface area in this study, different concentrations of AS solutions were used to generate seed particles in the seeded experiments. In the “low AS-seed” experiments, a 0.015 M AS solution was used to generate seed particles, and the resulting total AS seed surface area concentration was ~ 1000 μm2 cm-3. In the “medium AS-seed” experiments, a 0.1 M AS solution was used to generate seed particles, and the resulting total AS seed surface area concentration was ~ 3000 μm2 cm-3. In selected experiments, no seed particles were introduced into the chamber and the aerosol formed via nucleation. O3 (100 or 500 ppb), which is generated by passing purified air into a photochemical cell, was then introduced into the chamber. The start of O3 injection into the chamber marks the beginning of the reaction (i.e. reaction time = 0 min).
The α-pinene and O3 concentrations in the Georgia Tech chamber were measured by a Gas Chromatograph-Flame Ionization Detector (GC-FID, Agilent 7890A) and a O3 analyzer (Teledyne T400), respectively. Similarly, a GC-FID (Agilent 6890N) and a O3 monitor (Horiba APOA-360) were used to measure the α-pinene and O3 concentrations, respectively, in the Caltech chamber. A High Resolution Time-of-Flight Aerosol Mass Spectrometer (HR-ToF-AMS, Aerodyne Research Inc.) measured the bulk aerosol elemental composition. The aerosol size distributions, number and volume concentrations were measured by a Scanning Mobility Particle Sizer (SMPS, TSI). To remove any aerosol volume measurement uncertainties that may arise from the use of different differential mobility analyzers, the same SMPS instrument, which consists of a Differential Mobility Analyzer (DMA, TSI 3081) and a Condensation Particle Counter (CPC, TSI 3775), was used in the Caltech and Georgia Tech chamber experiments.
Figures 9 a nd 10 s how the reaction profiles of the α-pinene ozonolysis experiments conducted in the Caltech and Georgia Tech chambers. Only SOA growth data up t o the maximum aerosol mass concentration are shown. All aerosol growth data are corrected for particle wall loss by applying size-dependent first order loss coefficients, which are obtained from separate seed-only experiments, using the standard methodology developed at Caltech. 100 ppb O3 was used in the experiments shown in Fig. 9, w hile 500 ppb O 3 was used in the experiments shown in Fig. 10. The initial total AS seed surface area concentrations in these 100 and 500 ppb O3 experiments were 0, ~ 1000 and ~ 3000 μm2 cm-3 (hereafter referred to as nucleation, “low AS-seed” and “medium AS-seed” experiments, respectively). In each

27
experiment, SOA growth typically began within 20 min of the start of the reaction. The aerosol mass concentration is obtained by multiplying the wall-loss corrected aerosol volume concentration by the aerosol density. The aerosol density is calculated from the ratio of the vacuum aerodynamic diameter (measured by the HR-ToF-MAS) and the mobility diameter (measured by the SMPS) of aerosol generated during nucleation experiments in the Georgia Tech chamber. The densities of the α-pinene SOA are 1.39 and 1.37 g cm-3 for the 100 and 500 ppb O3 experiments, respectively, and are within the range (i.e. 1.19 to 1.52 g cm-3) measured in previous α-pinene ozonolysis studies. The aerosol mass yield (Y) is obtained by dividing the aerosol mass concentration (ΔM0) by the reacted hydrocarbon mass concentration (ΔHC), Y = ΔM0/ΔHC.
In each α-pinene ozonolysis experiment, the α-pinene concentration decays once O3 is injected in to the chamber. The α-pinene GC-FID measurements were taken ~ 10 min apart, and were fitted using an exponential function as shown in Figs. 9 and 10. Regardless of the O3 concentration used in the experiment, the molar ratio of O3 reacted to α-pinene reacted is 1:1 (i.e. 50 ppb α-pinene reacted with 50 ppb O3), which indicates that O3 only reacts with α-pinene and not its oxidation products. This indicates that the first step of α-pinene ozonolysis is rate-limiting. Figure 3 shows that the presence of seed particles has a negligible effect on the rate of α-pinene oxidation for each O3 concentration in both chambers, since the decay rates of α-pinene (from reaction with O3) are approximately the same regardless the concentration of AS seed present in the chamber. The observation that the presence of seed particles does not influence the oxidation rate of the hydrocarbon is consistent with previous studies on SOA formation.
The rates of α-pinene oxidation in the 100 ppb O3 experiments were significantly slower than those measured in the 500 ppb O3 experiments in both the Caltech and Georgia Tech chambers. The reaction profiles for the 100 ppb O3 experiments show that peak SOA growth typically occurs at reaction time = 300 to 400 min in both chambers, during which ~ 90 to 95 % of the injected α-pinene has reacted (Fig. 9). After maximum SOA mass yield is reached, the α-pinene continues to decay slowly but there is little or no SOA growth. In contrast, all the α-pinene reacted within 80 to 100 min of the start of reaction during the 500 ppb O3 experiments in both chambers, and peak SOA growth is typically achieved at reaction time = 100 to 300 min (Fig. 10). Therefore, these results demonstrate that the α-pinene reaction rate and SOA formation rate become faster when higher concentrations of O3 are used. This suggests that the O3 concentration dictates both the rate of α-pinene oxidation and the time it takes to achieve peak SOA growth.
That particles deposit on c hamber walls is well established. O wing to differences in chamber shape, size, degree of mixing, particle deposition rates are determined for each chamber. The rate of particle loss affects every aspect of an SOA formation experiment, so it is necessary to establish the effect of particle wall deposition on SOA formation and, by extension, vapor wall deposition. Figure 11 shows the time-dependent growth curves (aerosol mass concentration ΔM0 vs. α-pinene reacted ΔHC) from the 100 and 500 ppb O 3 experiments conducted in the Caltech and Georgia Tech chambers. Only SOA growth data up to the point when all the α-pinene reacted are shown. The growth curves of the nucleation, “low AS-seed” and “medium AS-seed” experiments overlap for each O3 concentration in both chambers. This indicates that the chamber seed concentration does not influence the SOA growth rate regardless the O3 concentration. However, the peak SOA mass loadings achieved in the Caltech chamber are significantly smaller than those achieved in the Georgia Tech chamber for both the 100 and

28
500 ppb O3 experiments. This result was unexpected. It is necessary to evaluate systematically all the factors that differ between the two chambers. T hese include: ( 1) chamber size and mixing time; (2) seed surface areas reached; (3) rate of particle deposition on the chamber walls; (4) rate of vapor deposition on the chamber walls. This analysis will be aided by modeling on the experiments in each chamber.
6. Summary and Conclusions The wall-induced decay of organic vapors is the result of coupled physical processes involving transport of organic vapors from the well-mixed core of a chamber to its wall by molecular and turbulent diffusion, uptake of organic molecules by the Teflon film, and re-evaporation from the wall. T he wall-induced dark decay of 25 intermediate/semi-volatility organic compounds generated from the photochemistry of four parent hydrocarbons was monitored in the Caltech dual 24 m3 FEP Teflon chambers. The extent to which organic vapors and the chamber wall interact was found to be similar in used vs. unused Teflon chambers. Based on this observation, one concludes that the Teflon film itself acts as an effective sorption medium, and organic materials deposited from past chamber experiments, if they indeed exist, do not significantly impact the sorption behavior of organic molecules. Reversibility in gas–wall partitioning was observed: e vaporation of all 25 compounds that had deposited on t he wall during an 18 h deposition period occurred when the chamber temperature was increased from 25 to 45°C. Based on a derived model that describes the dynamics of vapor deposition on the chamber wall, a single parameter, the accommodation coefficient ( ), emerges to govern the extent of the vapor–wall mass transfer process. Moreover, exhibits a strong dependence on the molecular properties, such as vapor pressure and oxidation state, of the 25 organics studied. We present an empirical expression for as a function of the compound vapor pressure, thus affording the possibility to predict the wall deposition rate of intermediate/semi/non-volatility compounds in a Teflon chamber based on their molecular constituency.
Previous studies have observed the chemical transformation of δ-hydroxycarbonyls to substituted dihydrofurans on t he chamber wall (Lim and Ziemann, 2005, 2009; Zhang et al., 2014b), suggesting the potential occurrence of heterogeneous reactions on t he chamber wall surface. While the extent to which heterogeneous transformations proceed can be potentially represented through the accommodation coefficient, the occurrence of wall-induced chemistry adds another dimension of complexity in predicting vapor wall deposition rates.
7. Recommendations Future studies aimed at quantifying the impact of vapor wall deposition on the chamber-derived SOA yield include (1) experiments to determine the accommodation coefficients of organic vapors on pa rticles for a variety of SOA systems, and (2) state-of-art SOA predictive models that describe the dynamics of vapor–wall and vapor–particle interactions to estimate the fraction of organic vapor fluxes transported to the suspended particles vs. the chamber wall.

29
To interpret chamber data with respect to the influence of vapor wall deposition on the formation of SOA it will be necessary to have a chamber model that simulates the competition between growing particles and the chamber wall for the low volatility VOC oxidation products. Deposition of vapors on particles and chamber walls is characterized by separate accommodation coefficients. As in the present project, accommodation coefficients for vapor molecules on t he chamber wall can be measured by injecting individual vapor species in the chamber and following their decay as a f unction of time in the absence of any chemical reactions. As we have shown, the wall accommodation coefficients can be related to the volatility of the organic molecules. One area that still remains to be studied with respect to wall deposition of organic vapors is for extremely low volatility organic compounds (ELVOCs), which have been shown to contribute strongly to SOA formation. ELVOCs are difficult to measure in the gas phase and require very special instrumentation. This is the area in which further experiments to determine the accommodation coefficients of organic vapors on chamber walls need to be carried out. Determination of accommodation coefficients of vapor molecules on gr owing organic particles can only be made in the context of a f ull chamber experiment. This determination requires a state-of-art SOA predictive model that describes the dynamics of vapor–wall and vapor–particle interactions to estimate the fraction of organic vapor fluxes transported to the suspended particles vs. the chamber wall. The study reported by Zhang et al. (2014b) on toluene SOA employed a dynamic model that includes these features, but that model needs to be further developed to include aerosol size distribution dynamics. In addition, the model needs to be applied to experiments carried out on other important SOA systems, such as isoprene and alpha-pinene. We have to determine if there is consistency among the inferred values of the vapor-particle accommodation coefficients for various SOA systems; for example, is volatility the principal determinant or is molecular constituency influential?
The initial matched study performed here between the Caltech and Georgia Tech chambers raises a number of key issues. A high priority recommendaiton is that CARB consider supporting matched chamber experiments at Caltech and UC Riverside to deterimine the extent to which behavior can be translated from chamber to chamber and the important factors governing SOA formation in chambers. (Georgia Tech has expressed interest in being involved as well. This could afford studies across the scale of small, medium, and large chambers.)

30
References Barrer, R. M., Barrie, J. A., and Slater, J.: Sorption and diffusion in ethyl cellulose. Part III.
Comparison between ethyl cellulose and rubber, J. Polym. Sci., 27, 177–197, 1958.
Compernolle, S., Ceulemans, K., and Müller, J.-F.: EVAPORATION: a new vapour pressure estimation method for organic molecules including non-additivity and intramolecular interactions, Atmos. Chem. Phys., 11, 9431–9450, doi:10.5194/acp-11-9431-2011, 2011.
Corner, J. and Pendlebury, E. D.: The coagulation and deposition of a stirred aerosol, P. Phys. Soc. Lond. B., 64, 645–654, 1951.
Crounse, J. D., McKinney, K. A., Kwan, A. J., and Wennberg, P. O.: Measurement of gas-phase hydroperoxides by chemical ionization mass spectrometry, Anal. Chem., 78, 6726–6732, 2006.
Crump, J. G. and Seinfeld, J. H.: Turbulent deposition and gravitational sedimentation of an aerosol in a vessel of arbitrary shape, J. Aerosol. Sci., 12, 405–415, 1981.
Donahue, N. M., Epstein, S. A., Pandis, S. N., and Robinson, A. L.: A two-dimensional volatility basis set: 1. or ganic-aerosol mixing thermodynamics, Atmos. Chem. Phys., 11, 3303–3318, doi:10.5194/acp-11-3303-2011, 2011.
Eddingsaas, N. C., Loza, C. L., Yee, L. D., Seinfeld, J. H., and Wennberg, P. O.: α-pinene photooxidation under controlled chemical conditions – Part 1: Gas-phase composition in low- and high-NOx environments, Atmos. Chem. Phys., 12, 6489–6504, doi:10.5194/acp-12-6489-2012, 2012.
Fahnestock, K. A. S., Yee, L. D., Loza, C. L., Coggon, M. M., Schwantes, R., Zhang, X., Dalleska, N. F., and Seinfeld, J. H.: Secondary Organic Aerosol Composition from C12 Alkanes, J. Phys. Chem. A., published online, doi:10.1021/jp501779w, 2014.
Grosjean, D.: Wall loss of gaseous-pollutants in outdoor Teflon chambers, Environ. Sci. Technol., 19, 1059–1065, 1985.
Kanehashi, S. and Nagai, K.: Analysis of dual-mode model parameters for gas sorption in glassy polymers, J. Membrane Sci., 253, 117–138, 2005.
Kim, C. S. and Smith, T. L.: An improved method for measuring the thermal coefficient of linear expansion of flexible polymer-films, J. Polym. Sci. Pol. Phys., 28, 2119–2126, 1990.
Kokkola, H., Yli-Pirilä, P., Vesterinen, M., Korhonen, H., Keskinen, H., Romakkaniemi, S., Hao, L., Kortelainen, A., Joutsensaari, J., Worsnop, D. R., Virtanen, A., and Lehtinen, K. E. J.: The role of low volatile organics on secondary organic aerosol formation, Atmos. Chem. Phys., 14, 1689–1700, doi:10.5194/acp-14-1689-2014, 2014.
Lim, Y. B. and Ziemann, P. J.: Products and mechanism of secondary organic aerosol formation from reactions of n-alkanes with OH radicals in the presence of NOx, Environ. Sci. Technol., 39, 9229–9236, 2005.
Lim, Y. B. and Ziemann, P. J.: Effects of molecular structure on aerosol yields from OH radical-initiated reactions of linear, branched, and cyclic alkanes in the presence of NOx, Environ. Sci. Technol., 43, 2328–2334, 2009.

31
Loza, C. L., Chan, A. W. H., Galloway, M. M., Keutsch, F. N., Flagan, R. C., and Seinfeld, J. H.: Characterization of vapor wall loss in laboratory chambers, Environ. Sci. Technol., 44, 5074–5078, 2010.
Loza, C. L., Craven, J. S., Yee, L. D., Coggon, M. M., Schwantes, R. H., Shiraiwa, M., Zhang, X., Schilling, K. A., Ng, N. L., Canagaratna, M. R., Ziemann, P. J., Flagan, R. C., and Seinfeld, J. H.: Secondary organic aerosol yields of 12-carbon alkanes, Atmos. Chem. Phys., 14, 1423–1439, doi:10.5194/acp-14-1423-2014, 2014.
Matsunaga, A. and Ziemann, P. J.: Gas-wall partitioning of organic compounds in a Teflon film chamber and potential effects on reaction product and aerosol yield measurements, Aerosol. Sci. Tech., 44, 881–892, 2010.
McMurry, P. H. and Grosjean, D.: Gas and aerosol wall losses in Teflon film smog chambers, Environ. Sci. Technol., 19, 1176–1182, 1985.
Meares, P.: The diffusion of gases through polyvinyl acetate, J. Am. Chem. Soc., 76, 3415–3422, 1954.
Michaels, A. S., Barrie, J. A., and Vieth, W. R.: Solution of gases in polyethylene terephthalate, J. Appl. Phys., 34, 1–13, 1963.
Pankow, J. F. and Asher, W. E.: SIMPOL.1: a simple group contribution method for predicting vapor pressures and enthalpies of vaporization of multifunctional organic compounds, Atmos. Chem. Phys., 8, 2773–2796, doi:10.5194/acp-8-2773-2008, 2008.
Paterson, R., Yampol’skii, Y., Fogg, P. G. T., Bokarev, A., Bondar, V., Ilinich, O., and Shishatskii, S.: IUPAC-NIST solubility data series 70. S olubility of gases in glassy polymers, J. Phys. Chem. Ref. Data, 28, 1255–1450, 1999.
Paul, D. R.: Gas sorption and transport in glassy-polymers, Ber. Bunsen. Phys. Chem., 83, 294–302, 1979.
Paulot, F., Crounse, J. D., Kjaergaard, H. G., Kroll, J. H., Seinfeld, J. H., and Wennberg, P. O.: Isoprene photooxidation: new insights into the production of acids and organic nitrates, Atmos. Chem. Phys., 9, 1479–1501, doi:10.5194/acp-9-1479-2009, 2009.
Sada, E., Kumazawa, H., Xu, P., and Nishigaki, M.: Mechanism of gas permeation through glassy polymer-films, J. Membrane Sci., 37, 165–179, 1988.
Seinfeld, J. H. and Pandis, S. N.: Atmospheric chemistry and physics: from air pollution to climate change (2nd Edn.), John Wiley & Sons, Inc., Hoboken, NJ, 2006.
Tsujita, Y.: Gas sorption and permeation of glassy polymers with microvoids, Prog. Polym. Sci., 28, 1377–1401, 2003.
Vieth, W. R., Tam, P. M., and Michaels, A. S.: Dual sorption mechanisms in glassy polystyrene, J. Colloid Interf. Sci., 22, 360–370, 1966.
Yee, L. D., Craven, J. S., Loza, C. L., Schilling, K. A., Ng, N. L., Canagaratna, M. R., Ziemann, P. J., Flagan, R. C., and Seinfeld, J. H.: Secondary organic aerosol formation from low-NOx photooxidation of dodecane: Evolution of multigeneration gas-phase chemistry and aerosol composition. J. Phys. Chem. A, 116, 6211–6230, 2012.

32
Yeh, G. K. and Ziemann, P. J.: Alkyl nitrate formation from the reactions of C8-C14 n-alkanes with OH radicals in the presence of NOx: measured yields with essential corections for gas-wall partitioning, J. Phys. Chem. A, 118, 8147–8157, 2014.
Zhang, X. and Seinfeld, J. H.: A functional group oxidation model (FGOM) for SOA formation and aging, Atmos. Chem. Phys., 13, 5907–5926, doi:10.5194/acp-13-5907-2013, 2013.
Zhang, X., Cappa, C. D., Jathar, S. H., McVay, R. C., Ensberg, J. J., Kleeman, M. J., and Seinfeld, J. H.: Influence of vapor wall loss in laboratory chambers on yields of secondary organic aerosol, Proc. Natl. Acad. Sci. USA, 111, 5802–5807, 2014a.
Zhang, X., Schwantes, R. H., Coggon, M. M., Loza, C. L., Schilling, K. A., Flagan, R. C., and Seinfeld, J. H.: Role of ozone in SOA formation from alkane photooxidation, Atmos. Chem. Phys., 14, 1733–1753, doi:10.5194/acp-14-1733-2014, 2014b.

33
List of Symbols
(m2) Total surface area of the chamber wall (dimensionless) Accommodation coefficient of organic vapor i on particles (dimensionless) Accommodation coefficient of organic vapor i on the chamber wall (g m–3) Concentration of organic vapor i over the gas–wall interface
(g m–3) Saturation concentration of organic vapor i (g m–3) total concentration of organic vapor i in the chamber
(g m–3) Concentration of organic vapor i in the well-mixed core of the chamber (g m–3) Local concentration of organic vapor i in the boundary layer adjacent to
the wall (g m–3) Concentration of organic vapor i that has accumulated on the chamber
wall (g m–3) Equivalent mass of absorbing organic material on the chamber wall (m) Number mean particle diameter (m2 s–1) Eddy diffusivity (m2 s–1) Molecular diffusivity of organic vapor i
(m) Thickness of the boundary layer adjacent to the wall (dimensionless) Henry's law constant of organic compound i (g m–2 s–1) Vapor flux arriving at the gas–wall interface (g m–2 s–1) Vapor flux evaporating from the wall
(s–1) Eddy diffusion coefficient (m3 g–1) Gas–wall partitioning coefficient
(s–1) Deposition rate coefficient to the wall (s–1) Evaporation rate coefficient from the wall
(g mol–1) Average molecular weight of the absorbing organic material on the wall (m–3) Total number concentration of suspended particles
(atm) Vapor pressure of organic compound i as a liquid (dimensionless) Activity coefficient in the wall layer on a mole fraction basis (m s–1) Mean thermal speed
V (m3) Total volume of the chamber λ (m) Mean free path

34
Table 1. Experimental conditions for production of oxidized organic vapors.
Exp.# Lights on (h)
Lights off (h)
T program a (K [h−h])
OH source VOC HC0
(ppb) (NO)0 (ppb)
(NO2)0 (ppb)
Maximum Particle conc. (µg m-‐3)
FEP Bag condition
high-‐NO
1 ~ 1 ~ 24.2 298 [0−17.6]
318 [19.9−25.2] HONO α-‐pinene ~ 30 242 458 ~ 0.4 used
2 ~ 1 ~ 24.2 298 [0−17.6]
318 [19.9−25.2] HONO α-‐pinene ~ 30 229 371 ~ 0.3 unused
3 ~ 1 ~ 23.8 298 [0−17.3]
318 [20.9−24.8] HONO dodecane ~ 50 275 556 ~ 2.1 used
4 ~ 2 ~ 23 298 [0−17.3] 318 [20.8−25]
HONO isoprene ~ 200 243 460 ~ 0.2 used
low-‐NO
5 ~ 1 ~ 24.2 298 [0−17.8]
318 [20.3−25.2] H2O2 α-‐pinene ~ 30 < DL < DL ~ 1.2 used
6 ~ 1 ~ 24.2 298 [0−17.8]
318 [20.3−25.2] H2O2 α-‐pinene ~ 30 < DL < DL ~ 1.1 unused
7 ~ 7 ~ 21.6 298 [0−20.6] 318 [22−28.6]
H2O2 dodecane ~ 50 < DL < DL ~ 0.0 used
8 ~ 5 ~ 24.7 298 [0−21.3]
318 [24.7−29.7] H2O2 toluene ~ 100 < DL < DL ~ 0.1 used
a The temperature is controlled at 298 K for the first ~ 20 h of the experiment, including ~ 1 - 7 h irradiation and ~ 13 - 16 h darkness, and then ramped up to 318 K within ~ 3 h and held for ~ 4–6 hours.

35
Table 2. Best-fit values of vapor wall accommodation coefficient (αw, i) and calculated equivalent absorbing organic mass (Cw) on the chamber wall for vapors with structure proposed based on the CIMS measurement.
Observed m/z
Molecular Weight
Chemical Formula
Proposed Structure
Vapor pressure (atm @ 298 K)a
Vapor wall deposition rate
kw,i (s-‐1) b αw,i c Cw (g m-‐3) d Formation
Mechanism
269 (-‐) 184 C10H16O3
9.64×10-‐8 (8.95±2.55)×10-‐6 (9.15±2.63)×10-‐8 (6.59±3.43)×10-‐4
α-‐pinene + OH
(low-‐NOx)
Eddingsaas et al., (2012)
285 (-‐) 200 C10H16O4
1.05×10-‐6 (2.98±1.14)×10-‐6 (3.24±1.20)×10-‐8 (5.90±3.65)×10-‐3
253 (-‐) 168 C10H16O2
6.79×10-‐6 (4.40±0.70)×10-‐6 (4.31±0.68)×10-‐8 (4.57±2.45)×10-‐3
257 (-‐) 172 C9H16O3
2.65×10-‐6 (3.19±3.13)×10-‐6 (3.12±3.07)×10-‐8 (6.31±4.98)×10-‐3
271 (-‐) 186 C10H18O3
5.14×10-‐8 (1.09±0.06)×10-‐5 (1.15±0.07)×10-‐7 (5.56±3.86)×10-‐5
303 (-‐) 218 C10H18O5
1.56×10-‐10 (1.32±0.19)×10-‐5 (1.49±0.22)×10-‐7 (1.12±1.19)×10-‐6
227 (-‐) 142 C7H10O3
1.24×10-‐5 (1.63±0.50)×10-‐5 (1.52±0.15)×10-‐7 (1.01±0.91)×10-‐2

36
269 (-‐) 184 C10H16O3
3.48×10-‐9 (1.94±0.30)×10-‐5 (1.97±0.32)×10-‐7 (2.80±1.02)×10-‐5
α-‐pinene + OH
(high-‐NOx)
Eddingsaas et al., (2012)
285 (-‐) 200 C10H16O4
6.32×10-‐11 (1.51±0.15)×10-‐5 (1.62±0.16)×10-‐7 (3.83±3.11)×10-‐7
300 (-‐) 215 C10H17O4N
1.53×10-‐7 (1.19±0.13)×10-‐5 (1.34±0.14)×10-‐7 (1.79±0.06)×10-‐4
314 (-‐) 229 C10H15O5N
1.52×10-‐7 (2.31±0.21)×10-‐5 (2.94±0.26)×10-‐7 (1.14±0.10)×10-‐3
316 (-‐) 231 C10H17O5N
9.03×10-‐10 (1.85±0.14)×10-‐5 (2.19±0.17)×10-‐7 (5.36±9.85)×10-‐6
215 (-‐) 130 C7H14O2
1.98×10-‐5 (5.27±1.74)×10-‐6 (4.50±1.49)×10-‐8 (3.10±0.55)×10-‐2
Dodecane + OH
(low-‐NOx)
Yee et al., (2012)
285 (-‐) 200 C12H24O2
3.58×10-‐7 (1.32±0.44)×10-‐5 (1.42±0.46)×10-‐7 (3.50±0.81)×10-‐3
287 (-‐) 202 C12H26O2
1.21×10-‐6 (8.25±0.67)×10-‐6 (8.79±0.73)×10-‐8 (2.81±1.92)×10-‐3
301 (-‐) 216 C12H24O3
1.30×10-‐7 (1.19±0.13)×10-‐5 (1.35±0.15)×10-‐7 (8.39±7.24)×10-‐4
315 (-‐) 230 C12H22O4
1.56×10-‐8 (2.68±0.49)×10-‐5 (3.17±0.61)×10-‐7 (1.79±2.15)×10-‐4

37
332 (-‐) 247 C12H25O4N
2.17×10-‐8 (1.55±0.07)×10-‐5 (1.86±0.09)×10-‐7 (3.93±0.46)×10-‐4 Dodecane + OH
(high-‐NOx)
Zhang et al., (2012)
346 (-‐) 261 C12H23O5N
4.46×10-‐9 (2.33±0.25)×10-‐5 (2.91±0.33)×10-‐7 (1.87±0.21)×10-‐5
141 (-‐) 122 C7H6O2
5.30×10-‐6 (2.04±1.88)×10-‐6 (1.68±1.35)×10-‐8 (1.13±0.07)×10-‐2
toluene + OH
(low-‐NOx)
MCM v3.2
209 (-‐) 124 C7H8O2
4.89×10-‐5 (5.78±1.93)×10-‐6 (4.82±1.62)×10-‐8 (7.03±1.42)×10-‐2
241 (-‐) 156 C7H8O4
4.00×10-‐6 (2.04±0.40)×10-‐5 (1.95±0.39)×10-‐7 (2.66±0.71)×10-‐2
175 (-‐) 90 C3H6O3
2.21×10-‐4 (9.68±1.51)×10-‐6 (6.90±1.08)×10-‐8 (3.03±1.10)×10-‐1
isoprene + OH
(high-‐NOx)
Paulot et al., (2009)
185 (-‐) 100 C5H8O2
1.73×10-‐4 (6.58±0.30)×10-‐6 (4.93±0.22)×10-‐8 (7.70±2.01)×10-‐2
199 (-‐) 114 C5H6O3
8.17×10-‐6 (2.46±0.81)×10-‐6 (1.96±0.64)×10-‐8 (1.23±0.31)×10-‐2
217 (-‐) 132 C5H8O4
2.70×10-‐7 (1.40±0.11)×10-‐5 (1.22±0.10)×10-‐7 (1.15±0.60)×10-‐4

38
232 (-‐) 147 C5H9O4N
2.34×10-‐5 (5.24±0.24)×10-‐6 (4.76±0.22)×10-‐8 (1.78±0.42)×10-‐3
234 (-‐) 149 C4H7O5N
3.93×10-‐6 (3.23±1.30)×10-‐6 (2.97±0.28)×10-‐8 (5.16±1.36)×10-‐4
311 (-‐) 226 C5H10O8N2
1.15×10-‐9 (3.10±0.45)×10-‐5 (3.66±0.54)×10-‐7 (8.27±1.24)×10-‐6
a Vapor pressures are estimated from the average of predictions from the two group contribution methods, ‘SIMPOL.1’ (Pankow and Asher, 2008) and ‘EVAPORATION’ (Compernolle et al., 2011). b The vapor wall deposition rate (kw,i) is calculated by Eq (22b). c The accommodation coefficient (αw,i) is calculated via optimal fitting of Eq. (22b) to the CIMS measured vapor decay rate assuming first-order kinetics and irreversible gas-wall partitioning. d Cw is calculated from the combination of Eqs (13) and (14) as an equation set.

39
Table 3. Experiments conducted in the Georgia Tech chamber.
expt α-‐pinene (ppb) O3 (ppb) Seed Surface Area
(µm2/cm3) 1 50 500 0 2 50 500 1000 3 50 500 3000 4 50 100 0 5 50 100 1000 6 50 100 3000

40
Figure 1. Theoretical framework representing the vapor-wall interactions. Concentrations of organic vapor i in the well-mixed core, in the boundary layer, over the surface of the chamber wall, and in the chamber wall are denoted by Cv, i , Cv,i, C0,i, and Cw, i , respectively. Vapor fluxes at the gas-wall interface are denoted by Jv,i and Jw,i.

41
Figure 2. Example of the experimental procedure to assess vapor wall deposition using 3-nitrooxy-6-dodecanol (m/z = (–) 332): Period (1) organic oxidation product generation; Period (2) vapor wall deposition at 298 K in the dark; Period (3) chamber temperature ramp from 298 K to 318 K; and Period (4) temperature held at 318 K in the dark.

42
Figure 3. CIMS traces of oxidized organic vapors generated from the photooxidation of isoprene, toluene, α-pinene and dodecane under high/low-NO conditions over the four chamber periods in Figure 2. Colored circles represent CIMS measured normalized signals during background, vapor generation, vapor wall deposition at 298 K, temperature ramp, and vapor re-evaporation at 318 K. Black dashed lines and gray solid lines represent the simulated deposition rates generated from reversible and irreversible, respectively.
0 9 18 270.00
0.02
0.04
0.06
Time (h)
Sign
al (a
.u.)
m/z 175 (−)
0 9 18 270.0
0.3
0.6
0.9
Time (h)
Sign
al (a
.u.)
m/z 185 (−)
0 9 18 270.00
0.05
0.10
0.15
Time (h)
Sign
al (a
.u.)
m/z 199 (−)
0 9 18 270.00
0.04
0.08
0.12
Time (h)
Sign
al (a
.u.)
m/z 217 (−)
0 9 18 270.0
0.7
1.4
2.1
Time (h)
Sign
al (a
.u.)
m/z 232 (−)
0 9 18 270.00
0.25
0.50
0.75
Time (h)
Sign
al (a
.u.)
m/z 234 (−)
0 9 18 270.00
0.01
0.02
0.03
Time (h)
Sign
al (a
.u.)
m/z 311 (−)
0 11 22 330.00
0.01
0.02
0.03
Time (h)
Sign
al (a
.u.)
m/z 141 (−)
0 11 22 330.00
0.02
0.04
0.06
Time (h)
Sign
al (a
.u.)
m/z 209 (−)
0 11 22 330.00
0.02
0.04
0.06
Time (h)
Sign
al (a
.u.)
m/z 241 (−)
0 9 18 270.0
0.1
0.2
0.3
Time (h)
Sign
al (a
.u.)
m/z 332 (−)
0 9 18 270.00
0.02
0.04
0.06
Time (h)
Sign
al (a
.u.)
m/z 346 (−)

43
0 9 18 270.00
0.02
0.04
0.06
Time (h)
Sign
al (a
.u.)
m/z 215 (−)
0 9 18 270.0
0.1
0.2
0.3
Time (h)
Sign
al (a
.u.)
m/z 287 (−)
0 9 18 270.00
0.03
0.06
0.09
Time (h)
Sign
al (a
.u.)
m/z 301 (−)
0 9 18 270.00
0.01
0.02
0.03
Time (h)
Sign
al (a
.u.)
m/z 315 (−)
0 9 18 270.00
0.01
0.02
0.03
Time (h)
Sign
al (a
.u.)
m/z 269 (−)
0 9 18 270.00
0.04
0.08
0.12
Time (h)
Sign
al (a
.u.)
m/z 253 (−)
0 9 18 270.00
0.07
0.14
0.21
Time (h)
Sign
al (a
.u.)
m/z 271 (−)
0 9 18 270.00
0.02
0.04
0.06
Time (h)
Sign
al (a
.u.)
m/z 303 (−)
0 9 18 270.00
0.01
0.02
0.03
Time (h)
Sign
al (a
.u.)
m/z 269 (−)
0 9 18 270.00
0.02
0.04
0.06
Time (h)
Sign
al (a
.u.)
m/z 285 (−)
0 9 18 270.00
0.04
0.08
0.12
Time (h)
Sign
al (a
.u.)
m/z 300 (−)
0 9 18 270.00
0.02
0.04
0.06
Time (h)
Sign
al (a
.u.)
m/z 314 (−)

44
0 9 18 270.00
0.04
0.08
0.12
Time (h)
Sign
al (a
.u.)
m/z 316 (−)
BackgroundLights onDark vapor wall interation at 298 KDark vapor wall interation at 318 KDark temperature rampReversible (SIM.1)Irreversible (SIM.2)
0 9 18 270.00
0.08
0.16
0.24
Time (h)
Sign
al (a
.u.)
m/z 269 (−)
0 9 18 270.00
0.12
0.24
0.36
Time (h)
Sign
al (a
.u.)
m/z 285 (−)

45
Figure 4. Comparison of vapor-wall interactions for α-pinene + OH products under controlled experimental conditions in used (triangle) vs. unused (circle) Teflon chambers. 30-min averaged data are shown here for clarity. Bands at the bottom of each figure denote successive experimental periods: vapor generation, vapor wall deposition at 298 K, temperature ramp, and vapor re-evaporation at 318 K.
0 9 18 270.00
0.01
0.02
0.03
Sign
al (a
.u.)
LNOx m/z 269 (−)
0.00
0.03
0.06
0.09
0 9 18 270.00
0.04
0.08
0.12LNOx m/z 253 (−)
0.00
0.06
0.12
0.18
0 9 18 270.00
0.09
0.18
0.27LNOx m/z 271 (−)
0.0
0.3
0.6
0.9
0 9 18 270.00
0.02
0.04
0.06
Sign
al (a
.u.)
LNOx m/z 303 (−)
0.00
0.06
0.12
0.18
0 9 18 270.00
0.02
0.04
0.06HNOx m/z 227 (−)
0.00
0.05
0.10
0.15
0 9 18 270.00
0.02
0.04
0.06HNOx m/z 285 (−)
0.00
0.05
0.10
0.15
0 9 18 270.00
0.03
0.06
0.09
Time (h)
Sign
al (a
.u.)
HNOx m/z 300 (−)
0.00
0.07
0.14
0.21
0 9 18 270.00
0.02
0.04
0.06
Time (h)
HNOx m/z 314 (−)
0.00
0.07
0.14
0.21
0 9 18 270.00
0.04
0.08
0.12
Time (h)
HNOx m/z 316 (−)
0.0
0.1
0.2
0.3

46
Figure 5. Inferred total amount of (a) equivalent absorbing organic mass on the chamber wall, Cw (g m-3), and (b) dimensionless Henry’s law constants, Hi, as a function of saturation concentration, Ci* (µg m-3). Estimated vapor pressures of organic compounds studied here are obtained from the average of predictions from the two group contribution methods, ‘SIMPOL.1’ (Pankow and Asher, 2008) and ‘EVAPORATION’ (Compernolle et al., 2011). The uncertainty bars give the upper and lower limits of Cw values derived from Eq (12), together with Eqs. (16) and (17), when either ‘EVAPORATION’ or ‘SIMPOL.1’ is used to estimate vapor pressures.
100 102 104 10610−8
10−7
10−6
10−5
10−4
10−3
10−2
10−1
100
Ci* (µg/m3)
C w (g/m
3 )
(a)
α−pinene (LNO)α−pinene (HNO)dodecane (LNO)dodecane (HNO)toluene (LNO)isoprene (HNO)
100 102 104 10610−3
10−2
10−1
100
101
Ci* (µg/m3)
H i
(b)
α−pinene (LNO)α−pinene (HNO)dodecane (LNO)dodecane (HNO)toluene (LNO)isoprene (HNO)

47
Figure 6. Inferred accommodation coefficients of organic oxidation products on the chamber wall (log10(αw,i)) as a function of saturation concentrations (log10(Ci*)) and average carbon oxidation state (OSC). Filled circles represent the best-fit αw,i assuming irreversible gas-wall partitioning. The black solid line represents the linear regression of log10(αw,i) vs. log10(Ci*) for all compounds.
−1 0 1 2 3 4 5 6 7−8.5
−8.0
−7.5
−7.0
−6.5
−6.0
log10(Ci*) (µg/m3)
log 10
(αw,
i)
−1.5 −1 −0.5 0 0.5 1
IVOCSVOC
Oxidation State (OSc)

48
Figure 7. Predicted vapor wall deposition rate (kw,i / s-1) of organic compounds in a Teflon chamber as a function of carbon number (nC) and oxygen number (nO).
5 10 15 20 25 300
5
10
15
20
25
nC
n O
k w,i (s
−1)
0
1
2
3
4
5
x 10−4
VOCIVOC
ELVOC
LVOC
SVOC

49
Figure 8. Comparison of estimated gas-particle equilibration timescale (τg/p,i) as a function of the gas-particle mass accommodation coefficient (αp,i, lower x-axis) and the ratio of total particle surface area to the chamber wall area (Ra, color bar), and vapor wall deposition timescale (τg/w,i) as a function of gas-wall mass accommodation coefficient (αw,i, upper x-axis). The grey solid straight line represents the gas-particle equilibration time for a typical chamber experiment with seed surface area of ~ 1 × 10⁻³ µm2 cm-3. White solid and dashed lines define the region where τg/p,i ≅ τg/w,i. For example, the top dashed white line is a collection of data points for which the equality τg/p,i = τg/w,i = 1.3 × 10³ min holds. τg/w,i is calculated by substituting αw,i = 10-7 into Eqs (22), (23), and (24). τg/p,i is calculated from Eq (27) by varying αp,i (10-4–10-3) and Ra (0.01–0.02).
10−4 10−3 10−2 10−1 100101
102
103
104
105
αp,i
τ i (min
)
R a
0.02
0.04
0.06
0.08
0.1
0.12
10−8 10−7 10−6 10−5 10−4
101
102
103
104
105
αw,i

50
Figure 9. Reaction profiles of the α-pinene ozonolysis experiments during which 100 ppb O3 is used. Panels (a), (c) and (e) show nucleation, "low AS-seed" and "medium AS-seed" experiments conducted in the Caltech chamber, respectively. Panels (b), (d) and (f) show the nucleation, "low AS-seed" and "medium AS-seed" experiments conducted in the Georgia Tech chamber, respectively.

51
Figure 10. Reaction profiles of the α-pinene ozonolysis experiments during which 500 ppb O3 is used. Panels (a), (c) and (e) show nucleation, "low AS-seed" and "medium AS-seed" experiments conducted in the Caltech chamber, respectively. Panels (b), (d) and (f) show the nucleation, "low AS-seed" and "medium AS-seed" experiments conducted in the Georgia Tech chamber, respectively.

52
Figure 11. Time-dependent growth curves for the α-pinene ozonolysis experiments during which (a) 100 ppb O3, and (b) 500 ppb O3 are used.