effect of using spreadsheet in teaching quadratic ... · effect of using spreadsheet in teaching...
TRANSCRIPT

International Journal of Education, Learning and Development
Vol.4, No.1, pp.11-29, February 2016
___Published by European Centre for Research Training and Development UK (www.eajournals.org)
11
ISSN 2054-6297(Print), ISSN 2054-6300(Online)
EFFECT OF USING SPREADSHEET IN TEACHING QUADRATIC FUNCTIONS
ON THE PERFORMANCE OF SENIOR HIGH SCHOOL STUDENTS
Isaac Benning1 and Douglas Darko Agyei2
1Aburaman Senior High School, Abura Dunkwa, Ghana.
2Department of Science and Mathematics Education, College of Education Studies,
University of Cape Coast.
ABSTRACT: The study employed a quasi-experiment design to evaluate the effect of using
Spreadsheet Instructional Method as compared to a Conventional Method on students’
performance in quadratic functions. Lessons delivered with both approaches employed a
guided discovery; a mix of direct instruction and hands-on activities in a context in which
mathematics learning have been deep-rooted in teacher-centred approaches of teaching.
Interviews and teacher made achievement test were used to collect data from senior high
school students in Ghana. Data was analysed using paired sample t-test and analysis of
covariance for the achievement test whereas interviews were transcribed and coded using
data reduction technique. The study showed that the Spreadsheet Instructional Method served
a useful pedagogical approach, impacted more on the students’ performance and has the
potential of improving teaching and learning mathematics in Senior High schools. The use of
the spreadsheet made lessons more practical and interesting; gave students greater
opportunities to verify results and make links between spreadsheet formula, quadratic
functions and graphs. In spite of its potential, the study recognized that for spreadsheet to be
effective in teaching mathematical concepts, a mix of direct instruction and hands-on
activities should guide the lesson development and delivery.
KEYWORDS: Spreadsheet, Teaching, Education, Students, Quadratic Functions
INTRODUCTION
The importance of mathematics in the development of a country cannot be underestimated as
it plays a major role in the economy and the social life of its people. Due to its importance the
government of Ghana is committed to ensuring the provision of high quality mathematics
education. In spite of government efforts, learning mathematics has not undergone much
change in terms of how it is structured and presented and among other reasons has resulted in
consistently low achievement levels among mathematics students in high schools (e.g. see
Mullis, Martin, & Foy 2008; Ottevanger, Van den Akker, & de Feiter, 2007). Ottevanger et
al. (2007) indicated that the most frequently used strategy in mathematics classrooms is the
teacher-centred (i.e chalk and talk) approach in which teachers do most of the talking and
intellectual work, while students are passive receptacles of the information provided.
According to Ottevanger et al. (2007) this type of teaching is heavily dominated by teachers
(while students are silent), involves whole class teaching, lots of notes being copied, and
hardly any hands-on activities. In most instances, teachers rush to cover all the topics
mechanically in order to finish on time for examinations rather than striving for in-depth
student learning (Ottevanger et al., 2007). Such teacher-centred instructional methods have
been criticized for failing to prepare students to attain high achievement levels in
mathematics (Hartsell, Herron, Fang, & Rathod, 2009). For example in Ghana, this approach

International Journal of Education, Learning and Development
Vol.4, No.1, pp.11-29, February 2016
___Published by European Centre for Research Training and Development UK (www.eajournals.org)
12
ISSN 2054-6297(Print), ISSN 2054-6300(Online)
has resulted in general detest for mathematics by most students leading to their poor
performance both in the national (e.g. West African Senior Secondary Examination,
WASSCE) and international (Trends in International Mathematics and Science Study,
TIMSS) examinations (Anamuah-Mensah, Mereku & Asabere-Ameyaw, 2006; Anku, 2005-
2006; Djangmah & Addae-Mensah, 2012; UNESCO, 2004). Fletcher (2005) referred to this
teaching approach as the transmission model of learning in which teachers view learners as
empty vessels easily filled with knowledge, as opposed to a teaching approach that
appreciates that students are much more actively involved in constructing their own
knowledge.
Consequently, the emphasis on teaching mathematics in a way that is understandable to both
mathematics educators and students has been on the rise in the recent past. Numerous studies
reiterate the impact of ICT use on the development of mathematical concepts in students and
on their’ achievements (Beauchamp & Parkinson, 2008; Bottino & Robotti, 2007; So & Kim,
2009). This study has a focus in this direction; to determine the effect of teaching
mathematics with ICT in the context of Senior High Schools (SHSs) in Ghana. In particular,
the study will compare using spreadsheet as an instructional tool as against the conventional
approach in teaching quadratic functions to evaluate their effectiveness on the performance of
students. The technology used in this context was spreadsheet application software for
mathematics since it is readily available in SHSs (Agyei & Voogt, 2011), user friendly and
has the potential of supporting students’ higher-order thinking skills in mathematics (Niess,
Sadri & Lee, 2007). The choice to focus on quadratic functions among other topics in
mathematics was also informed by literature; several studies have shown that students have
learning difficulties when it comes to teaching and learning of functions particularly
quadratic functions ( Clement, 2001; Dubinsky and Harel, 1992; Eraslan 2005; Looney,
2004; Maharaj, 2008; Zazkis, Liljedahl & Gadowsky 2003).
Some Conceptual Difficulties Students Encounter Learning Functions
One topic in mathematics in which students have learning difficulty which results from poor
methods of teaching is quadratic functions (Dubinsky & Harel, 1992; Eraslan, 2005). These
students’ learning difficulties in quadratic function are reported in numerous studies.
Eraslan (2005) for example identified fours cognitive obstacles students face in learning of
quadratic functions. These cognitive obstacles are: (1) lack of making and investigating
mathematical connections between algebraic and graphical aspects of the concepts, (2) the
need to make an unfamiliar idea more familiar, (3) disequilibrium between algebraic and
graphical thinking, and (4) the image of the quadratic formula or absolute value function.
Eraslan remarked that students lack the ability to make and investigate mathematical
connections between algebraic and graphical aspects of the quadratic functions.
Clement (2001) identified that definitions and images of function and the relationship
between them transferred from graphical to algebraic form are perhaps most difficult for
students (Clement, 2001). Different studies have shown that both in the algebraic and the
graphical form, the concept and representation of images and pre-images are only partially
understood (Dubinsky & Harel, 1992; Eraslan 2005; Looney, 2004; Maharaj, 2008). The
studies (Dubinsky & Harel, 1992; Eraslan 2005; Looney, 2004; Maharaj, 2008) reiterate that
students find sketching graphs of quadratic functions difficult and confusing though graphing
of functions is an essential component of the study of quadratic functions. Eraslan, (2005)
therefore reported that in teaching quadratic functions, students must open up to linked

International Journal of Education, Learning and Development
Vol.4, No.1, pp.11-29, February 2016
___Published by European Centre for Research Training and Development UK (www.eajournals.org)
13
ISSN 2054-6297(Print), ISSN 2054-6300(Online)
-10
0
10
20
-5 -4 -3 -2 -1 0 1 2 3 4 5 6 7 8 9 10
y = x2y = (x-3)2
y -axis
x-axis
concepts such as turning points, intercepts, and the effects of the parameters of the quadratic
functions.
In their study, Zazkis, Liljedahl and Gadowsky (2003) examined secondary school students
and secondary school teachers (practicing and pre-service teachers) explanations regarding a
task on translation of a function, focusing on the example of the parabola y = (x - 3)2 and its
relationship to y = x2. The participants’ explanations focused on attending to patterns,
locating the zero of the function, and the point-wise calculation of function values. The
results confirmed that the horizontal shift of the parabola is inconsistent with expectations
and counterintuitive to most participants. Zazkis, Liljedahl and Gadowsky (2003) found that
students who have been taught quadratic function prior to the study indicated that the graph
of y = (x - 3)2 will appear three units to the left of graph y = x2 instead of three units right of y
= x2 as shown in Figure 1.
Figure 1: Graph showing the translation of y = (x - 3)2.
Some of the teachers in the study expressed similar conceptual difficulty. For example
Zazkis, Liljedahl and Gadowsky reported that:
All the teachers participating in this study have sketched the graph of y =
(x−3)2 correctly. However, for the practicing teachers it was an immediate
and effortless recall from memory, the way one would recall, rather than
derive, a basic multiplication fact. Pre-service teachers needed a few
minutes of thinking and checking. It was evident that for some pre-service
teachers the horizontal translation of a parabola was not in their immediate
repertoire of knowledge, but the location of the graph was derived correctly
and without major effort (Zazkis, Liljedahl&Gadowsky, 2003, p. 441).
Such similar problems can be distinguished in the Ghanaian SHS context. Instances of these
are found in the national exams explained in the West African Senior School Certificate
Examination (WASSCE) Chief Reports (West African Examinations Council (WAEC),
2007; 2008). For example in 2007, the Chief Examiners’ Report stated that while students
showed improvement in handling questions on topics such as series, binary operations and

International Journal of Education, Learning and Development
Vol.4, No.1, pp.11-29, February 2016
___Published by European Centre for Research Training and Development UK (www.eajournals.org)
14
ISSN 2054-6297(Print), ISSN 2054-6300(Online)
binomial theorem, the students showed weakness in handling questions on factorizing
quadratic equations of the form 02 cbxax where 0a . Further, it was reported that an
appreciable number of students could not use basic concept on equal roots (i.e. 042 acb )
of a quadratic function to solve quadratic equations. An example was when students were
asked the following question:
The roots of the quadratic equation: x2 -2(3k+1)x+7, where k is a
constant, are equal. Find the values of k (WAEC, 2007, p. 60).
The report indicated that many students exhibited different difficulties in solving this
problem. The 2008 report further reiterated that students had conceptual difficulties in
sketching quadratic graphs and determining the roots of quadratic equations using the
graphical method (WAEC, 2008).
The discussion above seems to suggest that one underlying premise contributing to the
learners’ difficulty in developing their conceptual understanding well in quadratic functions
is the way the topic is structured and presented. Thus, the emphasis on teaching functions in a
way that is understandable to students should be a concern to mathematics educators.
Monaghan (2005) identified that the use of technological software aids to represent the
concept of functions in terms of the strong linkage among the representational ‘trinity’ of
functions: “numerical, symbolic and graphical” representation. In this study, Excel-specific
spreadsheet application software has been adopted as an Instructional tool to explore the
effect of teaching quadratic functions with technology on performance of SHS students.
Potential of spreadsheet for teaching mathematics
Spreadsheets have been around since the early 1980s and, although not designed as an
educational tool, have been used in mathematics classrooms since they first became available
(Jones, 2005). Tubbs (2012) described that of all the technological tools, spreadsheets
probably have the most uses in the mathematics classroom. Niess, Sadri and Lee (2007)
recognized advantages of using spreadsheets for solving complicated problems, motivating
students, and providing opportunities for students to extend problems to additional
hypothetical situations. According to Niess (2005), spreadsheets offer dynamic modeling
capabilities that lead toward their use as a mathematical problem solving tool with the
capacity for engaging students in higher-order thinking skills that supports them in exploring
beyond initial solutions. Agyei (2013) pointed out that spreadsheet instructional approaches
has the tendency to support constructivist pedagogical approach where students explore and
reach an understanding of mathematical concepts by concentrating on problems solving
process rather than on calculations related to the problems as a result. According to Niess et
al. (2007) teachers who are able to design and enact spreadsheet lessons engage their students
in critical thinking to explore mathematical concepts and processes for accurate analysis.
Jones (2005) indicated that one way to help learners move from a non-algebraic to an
algebraic approach is through work with spreadsheets. He explained that in using such a tool,
learners appear to be able to learn more readily to express general mathematical relationships
using the symbolic language in the spreadsheet environment as compared to using paper and
pencil. Dettori, Garuti and Lemut (2001) suggested that while the use of spreadsheet may
lead learners to solve problems using “trial and improvement” under the guidance of the
teacher, they can come to understand what it means to solve an equation even before being

International Journal of Education, Learning and Development
Vol.4, No.1, pp.11-29, February 2016
___Published by European Centre for Research Training and Development UK (www.eajournals.org)
15
ISSN 2054-6297(Print), ISSN 2054-6300(Online)
able to handle equations. Rojano (1996) showed more evidence of how the judicious use of
spreadsheets can lead to algebraic understanding of learners.
Liang and Martin (2008) reported on how Excel spreadsheet was used to enhance SHS
students’ understanding of some difficult and important calculus-based mathematical
principles. They reported that Excel spreadsheet can greatly simplify the interpretation of
pure calculus principles and can substantially reduce students’ misunderstanding in applying
calculus principles in solving quantitative business problems.
In spite of spreadsheets’ potential to support higher-order thinking skills and the strong
advocacy to integrate it in the teaching, teachers in Ghana do not make use of this tool to
guide students in learning mathematics. Classrooms in Ghana are still characterised by the
talk and chalkboard illustrations (also referred to as the traditional method) which have
received lots of criticism because of its heavy emphasis on the teacher. With the
preponderance of this ‘traditional’ method of mathematics instruction in Ghana coupled with
students learning difficulty in quadratic functions, one possible contemporary strategy for
improving instruction and student learning could be adopting empirical instructional practices
such as the use of ICT. This study sought to explore the potential of spreadsheet as an
instructional tool on students’ learning outcomes in quadratic functions. In the study,
spreadsheet instructional method was compared to the conventional method (defined as the
‘traditional’ existing approach with less direct instruction by teacher and active student
learning engagement opportunities) to evaluate the effect of the approaches on students’
performance.
The authors preferred to use the conventional method in this paper to help tradeoff the
numerous disadvantages of using the traditional method. In doing so, it would be easier to
ascertain the impact of the spreadsheet approach in the study.
The Research Approach and Question/ Hypothesis
The study was conducted in the context of the two different SHSs in Ghana and adopted a
non-randomised quasi-experimental research design in which both quantitative and
qualitative data were used. To investigate the impact of the spreadsheet-supported lessons on
students’ outcomes, a pre-post test experimental control group design was used. Two intact
classes from the two schools were employed because randomisation was practically
impossible since all the lessons were conducted during the schools’ regular instructional time.
Therefore, randomly selecting some students from the class while leaving others out was
unethical; it was important to ensure that the entire students in the class benefited from the
lessons. The choice of the class which had the spreadsheet supported lessons treatment was
guided by the scores of an achievement test conducted for both classes in quadratic functions
before the study. The class which showed a relatively low significant score was purposefully
selected to receive the spreadsheet-supported treatment. This was to help in evaluating the
effectiveness of the treatments.
The main research question that guided the study was: What is the impact of using
spreadsheet as an instructional tool on senior high school students’ performance in quadratics
functions? In answering the question, the following Null Hypotheses were addressed:
International Journal of Education, Learning and Development
Vol.4, No.1, pp.11-29, February 2016
___Published by European Centre for Research Training and Development UK (www.eajournals.org)
16
ISSN 2054-6297(Print), ISSN 2054-6300(Online)
H0: Spreadsheet as instructional tool has no effect on the performance of students in
quadratic function.
H0: The conventional method approach of instruction has no effect on the
performance of students in quadratic functions.
H0: There is no significant difference between the performance in quadratic
functions of students taught with spreadsheet method and those taught with
conventional method.
The lesson delivery for both groups spanned a period of 6 weeks and required the researchers
to teach students once in one and a half hour- lesson per week. The lessons were meant to
update the students conceptual understanding of some topics on quadratic function including:
properties of quadratic functions in polynomial form, sketching quadratic curves,
increasing/decreasing and positive/negative parts of quadratic functions, quadratic in factored
form, quadratic in the vertex form and nature of the roots of quadratic equations. The guided
discovery, a mix of direct instruction and hands on activity teaching approach was used to
deliver the lessons for both groups of students. Hmelo-Silver, Duncan and Chinn (2008)
indicated that such guided inquiry approaches do not substitute content for practices; rather
they advocate that content and practices are central learning goals.This means that the lessons
taught in this study were less teacher-centred as they made use of students’ worksheets to
promote hands-on activities, small group exercises to promote healthy interactions among
students, interactive discussions on readings, class assignments and projects. The striking
difference that existed in the approaches between the two groups had to do with the use of
ICT tools- LCD projector, desktop computers and a laptop (PC). Whereas in the experimental
group (spreadsheet method group), lessons were executed with ‘interactive demonstrations’
in a spreadsheet environment in which the technology was used as a tool to help students
explore mathematical concepts and perform authentic tasks, the control group (conventional
method group) made use of the talk and chalkboard illustrations to provide explanations and
examples without the support of any ICT tool. In all, the same 6 lessons were taught for each
of the two groups. Lessons for both the control and experimental group were facilitated by
the same instructor. One of authors of the paper acted as the instructor while the other acted
mainly as a coach and observer.
METHODOLOGY
Participants
Seventy four (74) students of average age 16 years in SHS 1 who participated in the study,
were from 2 different high schools. The schools were purposively selected for the study to
ensure that they belonged to the same category based on rankings by the Ghana Education
Service. This was to ensure that all other factors that could affect the result of this study,
except for the approach of teaching were held constant. One intact class consisting of 32
students (16 males and 16 females) participated in quadratic spreadsheet supported lesson,
while the other intact class consisting of 42 (25 males and 17 females) were taught the same
lessons with the conventional approach and served as the control group.

International Journal of Education, Learning and Development
Vol.4, No.1, pp.11-29, February 2016
___Published by European Centre for Research Training and Development UK (www.eajournals.org)
17
ISSN 2054-6297(Print), ISSN 2054-6300(Online)
Instruments
Teacher-made Achievement Test
For each of the two groups taught, a test was developed by the authors to determine student
learning outcomes. The items on the teacher-made achievement test were constructed based
on the lessons taught and the learning objectives of the SHS mathematics curriculum. The
test was tailored to emphasize useful information about the students' knowledge of the
learning objectives and the quadratic lessons taught in the given instructions. The test
contained thirty multiple choice questions and five essay-type questions. The test was
reviewed by an expert and based on suggestions; items were revised accordingly to improve
the face and content validity of the instrument. The Kuder-Richardson 20 formula (K-R 20)
reliability coefficient of the multiple choice items was 0.809 while Cronbachs’ alpha
reliability coefficient for the essay test items was 0.762. The same test was administered
twice (before the first lesson and after the last lesson) for both the experimental and control
groups to help ascertain the impact of the Instructional approaches. Thus, the scores of the
test was meant to provide not only evaluations of the knowledge levels of individual students,
but also information about how students in the different groups compare mastery or non-
mastery of the full range of the specific lessons taught during the instruction.
Interview
To explore students’ experiences with the use of spreadsheet in learning quadratics functions,
interviews were conducted after the spreadsheet supported lesson. Eight of the students who
took part in the spreadsheet supported lessons were involved in the interviews. This was done
mainly after the post-test. Interview data was meant to provide in-depth elaborations for data
collected through the achievement test.
Researcher’s Logbook
The researchers’ log book was used to maintain a record of activities and events occurring
during the classroom implementation of lessons.
Data Collection and Data Analysis Procedures
To analyse the data, descriptive statistics, paired sample t-test and analysis of covariance
(ANCOVA) were used for the achievement test whereas interviews were transcribed and
coded using data reduction technique (Miles & Huberman, 1994). In-depth analysis of items
from the achievement test was also done by the researchers. Information recorded in the
logbook was analyzed qualitatively using data reduction technique (Miles & Huberman,
1994).
RESULTS
Students Learning Outcomes
A major question dealt with in the study was weather the different Instructional methods had
any impact on students’ learning outcomes. Students’ responses in the pre-post achievement
test delineated the impact of each of the instructional method on students learning outcomes.

International Journal of Education, Learning and Development
Vol.4, No.1, pp.11-29, February 2016
___Published by European Centre for Research Training and Development UK (www.eajournals.org)
18
ISSN 2054-6297(Print), ISSN 2054-6300(Online)
Mean Gains of the Students Taught with Spreadsheet Instructional Method (SIM)
Table 1 shows that out of a score of 45, the mean scores of the achievement test before and
after the use of the spreadsheet were 9.812 (SD = 4.610) and 27.094 (SD = 3.325)
respectively. The results also showed that an overall significant product - moment correlation
(r = 0.55, p = 0.001< 0.05) was strong indicating that students’ pre- test score had a strong
correlation with their post test scores.
Table 1: Pre-post Test Scores of Students Taught with SIM (N = 32)
Test Min. score Max. score Mean SD
Pre-test 4 15 9.182 4.610
Post-test 18 38 27.094 3.325
In spite of the strong positive correlation, differences exist between the pre-post-tests scores.
Figure 2 shows the difference between the scores in terms of distance travelled.
Figure 2: Box plot of pre-post test scores of students taught with SIM
The substantial difference observed seems to suggest how much impact the SIM might have
had on the students’ learning. Although this is expected, it is worth knowing whether this
distance travelled was significant. A paired sample t-test was therefore used to test the null
hypothesis at 5% significance level that H0: Spreadsheet as instructional tool has no effect on
the performance of the students. The results revealed that the difference in performance was
significant [sig. (0.0001) < 05.0 ]. The eta square statistic (0.956) indicated a large effect
size.

International Journal of Education, Learning and Development
Vol.4, No.1, pp.11-29, February 2016
___Published by European Centre for Research Training and Development UK (www.eajournals.org)
19
ISSN 2054-6297(Print), ISSN 2054-6300(Online)
This is a clear indication that students progressed in their understanding of quadratic
functions after the lessons. Apparently, the use of the spreadsheet instructional approach gave
students greater opportunity to explore quadratic concepts better by helping them to make
links between spreadsheet formula, algebraic functions and graphs. Pre-post analysis of items
from the achievement test confirmed this. For example it was observed that most students
were unable to plot quadratic functions during the pre-test. In the post-test assessment
however, most student sketched the graphs accurately. What was intriguing was that the
students sketched these graphs without plotting them in the traditional way (that is merely
using a series of calculations to generate the shape of the graph). Thus, they demonstrated an
understanding of the effects of the various parameters on the behaviour of the graphical
representation. Not only did the students demonstrate understanding in the graphing of
quadratic functions but they answered the multiple choice questions that involved higher
order thinking which prior to the lesson they were unable to do. Responses from their
interview questions also reiterated that the spreadsheet method helped them to learn better.
The following were some of the responses provided when they were asked to enumerate how
spreadsheet helped them to explore properties of a quadratic function:
…I see the shape of the graph as I drag the slider. I noticed that when the
coefficient of x2 is negative the graph is a maximum curve and when it is
positive the graph is a minimum. Sir, it also helped me know that when the
value of a is zero the graph become a straight line (S1).
It helps me to picture the graph. In the examination, when I am given a
function like 242 xxy , I can picture it in my mind before I draw it
on graph sheet (S2)
The analyses here seem to suggest that hands-on activities alongside the spreadsheet
demonstrations helped the students to construct and reconstruct concepts of quadratic
functions. This made them to reach deeper understanding of the concepts of quadratic
functions.
Mean Gains of the Students Taught with Conventional Method (CM)
A second Hypothesis explored the impact of the CM approach. The hypothesis was:
H0: There is no effect on the performance of students taught with the conventional
method. Table 2 shows the descriptive statistics of the scores for the students before
and after the use of the CM.
Table 2: Pre-post Test Scores of Students Taught with CM (N = 42)
Test Min. score Max. score Mean SD
Pre-test
Post- test
4 20 12.405 4.169
9 32 22.131 4.170

International Journal of Education, Learning and Development
Vol.4, No.1, pp.11-29, February 2016
___Published by European Centre for Research Training and Development UK (www.eajournals.org)
20
ISSN 2054-6297(Print), ISSN 2054-6300(Online)
The mean scores of the achievement test before and after using the CM to teach were 12.405
(SD = 4.169) and 22.131 (SD = 4.170) respectively indicating an increase in the achievement
test. Figure 3 shows the difference between the pre-post-tests scores of the distance travelled
for this group of students.
Figure 3: Box plot of pre-post test scores of students taught with CM
A paired sample t-test at 5% significant level indicated that the difference in performance was
significant [sig. (0.0001) < 05.0 ]. The eta squared statistic (0.812) indicates a large effect
size which suggests a substantial difference in the achievement test scores obtained. This is
an indication that the students’ performance had increased. Although this would be expected
in a normal lesson after instruction, the pronounced pre-post test difference is worth noting.
This result is an indication that a well-planned CM of teaching can improve students’
performance in learning quadratic functions.
The lessons made use of series of activities that students engaged in. In each lesson there was
a well-structured activities spelled out by the teacher on the students’ worksheet to be
executed in groups. Thus the delivery approach which involved a mix of teachers direct
instruction and appropriate learner scaffolding practices, promoted conceptualization and
construction of knowledge. This suggests that the teachers’ role is critical in designing and
enacting lessons to be student-centred. Their roles should include prompting and facilitating
discussion, focusing on guiding students by asking questions and designing activities that will
lead learners to develop their own conclusions on mathematical concepts.
International Journal of Education, Learning and Development
Vol.4, No.1, pp.11-29, February 2016
___Published by European Centre for Research Training and Development UK (www.eajournals.org)
21
ISSN 2054-6297(Print), ISSN 2054-6300(Online)
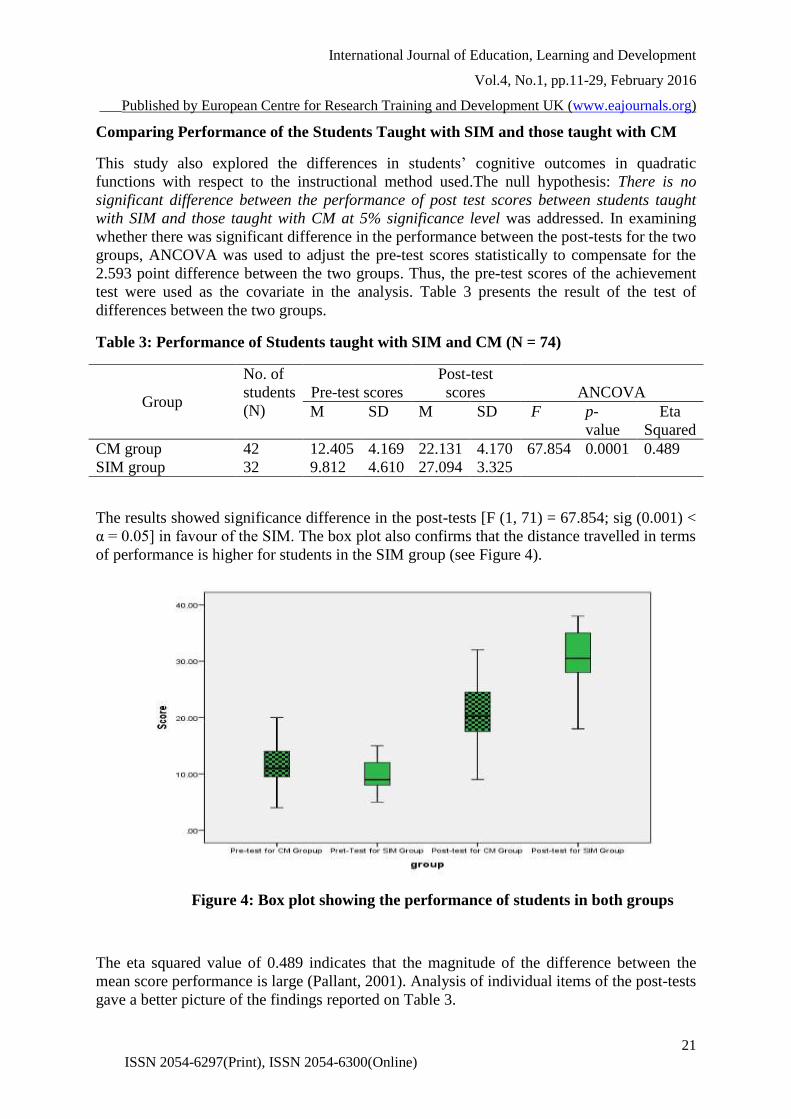
Comparing Performance of the Students Taught with SIM and those taught with CM
This study also explored the differences in students’ cognitive outcomes in quadratic
functions with respect to the instructional method used.The null hypothesis: There is no
significant difference between the performance of post test scores between students taught
with SIM and those taught with CM at 5% significance level was addressed. In examining
whether there was significant difference in the performance between the post-tests for the two
groups, ANCOVA was used to adjust the pre-test scores statistically to compensate for the
2.593 point difference between the two groups. Thus, the pre-test scores of the achievement
test were used as the covariate in the analysis. Table 3 presents the result of the test of
differences between the two groups.
Table 3: Performance of Students taught with SIM and CM (N = 74)
Group
No. of
students
(N)
Pre-test scores
Post-test
scores ANCOVA
M SD M SD F p-
value
Eta
Squared
CM group 42 12.405 4.169 22.131 4.170 67.854 0.0001 0.489
SIM group 32 9.812 4.610 27.094 3.325
The results showed significance difference in the post-tests [F (1, 71) = 67.854; sig (0.001) <
α = 0.05] in favour of the SIM. The box plot also confirms that the distance travelled in terms
of performance is higher for students in the SIM group (see Figure 4).
Figure 4: Box plot showing the performance of students in both groups
The eta squared value of 0.489 indicates that the magnitude of the difference between the
mean score performance is large (Pallant, 2001). Analysis of individual items of the post-tests
gave a better picture of the findings reported on Table 3.

International Journal of Education, Learning and Development
Vol.4, No.1, pp.11-29, February 2016
___Published by European Centre for Research Training and Development UK (www.eajournals.org)
22
ISSN 2054-6297(Print), ISSN 2054-6300(Online)
For example, the analyses give an indication that students who learned under the spreadsheet
environment were able to make connections between numeric, algebraic, and graphic
representations of quadratic functions better than their counterparts who used the CM
approach. This was revealed in the analyses of questions which required students to
demonstrate understanding of the effects of the parameters a, b and k on the quadratic
function, y = ax2 + bx + k. An example is reported on Question 9 of the achievement test:
Which of the following graphs is the graph of y = 0.5x2?
This question required students to transfer their knowledge of the nature of the parabola for
the algebraic function ( kbxaxy 2 ) to that of 25.0 xy . By comparing the two
functions, they were to use the given numeric values a=0.5, b=0 and k=0 to determine the
features of the parabola for the graph 25.0 xy and select the best option from the 4 given
graphical representations. Thus, based on the numeric values, students were expected to
determine the orientation of the parabola, determine the position of the vertex and the height
of the parabola. The results from the analysis showed that out of 32 students in the
experimental group who answered this question, 26 representing 81.3% were able to
determine the right answer from the list of options whiles 28 out of 42 (66.7%) of students in
the control group had it correct. Apparently, the use of the spreadsheet unlike the CM, gave
students greater opportunity to make links between spreadsheet formula, algebraic functions
and graphs, analyse and explore number patterns which promoted their concept formation
much better.
The analyses on the question 21 of the achievement test showed similar result.
21. Which of the functions is the final transformed graph of y = x2 if it moves
down 3 units and 2 units to the right.
A. y = (x – 2)2 + 3
B. y = (x – 2)2 - 3

International Journal of Education, Learning and Development
Vol.4, No.1, pp.11-29, February 2016
___Published by European Centre for Research Training and Development UK (www.eajournals.org)
23
ISSN 2054-6297(Print), ISSN 2054-6300(Online)
C. y = (x + 2)2 + 3
D. y = (x +2)2 – 3
Here the students were expected to compare the options to the quadratic function in the
vertex form, y = a(x – p)2 + q. They were to use the numerical values for the parameters a, p
and q to determine the appropriate algebraic function. In doing so, it was important for the
students to visualize how movements in the original graph y = x2 affect the behaviour of the
parabola and connect to the exact values of the parameters. Once students have this
understanding, they could easily link the resulting transformation (arising from movements in
the original function: y = x2) to the appropriate function that will be formed.
It appeared that most students in CM group experienced some difficulty integrating and
applying the appropriate knowledge in doing the task although this had been explained to
them during the lesson. Only 11 out of 42 (26.2%) of the students in that category answered
this question correctly while a majority of 26 out of 32 (81.3%) answered it successfully from
the SIM group. Consequently, the opportunity offered in the spreadsheet environment in
which students in that category explored and observed multiple representations of the graph y
= a(x – p)2 + q when the parameters were altered influenced their thinking and practices.
Thus, while students from the SIM group were able to fall on the spreadsheet experiences to
develop deeper connections between algebraic functions and their graphs, students from the
CM group did not enjoy this benefit.
Another observation made in the item analyses was the difficulty portrayed in solving
questions that applied to real life situations especially by students in the CM group. An
example is reported on the analyses of student performance on Question 16 of the
achievement test. The question was:
An athlete throws a javelin. The equation below describes the path that the
javelin takes: h = -4t2 + 30t + 2 where h is the height of the throw in metres and
t is the time taken in seconds. Calculate the time that it will take the javelin to
reach the maximum height.
A. 3.75 s
B. 2.55 s
C. 1.35 s
D. 0.45 s
The question required students to apply their knowledge of equation of the line of
symmetry,a
bx
2
, (which passes through the maximum height of the parabola) to determine
the time the javelin takes to reach the maximum height. Only 13 out of 42 (31.0%) of the
conventional method group could solve this problem correctly. Whiles more than 50% of the
students from the CM were unable to solve this question, 87.5% (28 out of 32) of the
spreadsheet instructional method group showed success in solving this problem. This seems
to suggest that the SIM group showed mastery of applying knowledge from lessons taught to
realistic settings as compared to their counterparts in the CM.

International Journal of Education, Learning and Development
Vol.4, No.1, pp.11-29, February 2016
___Published by European Centre for Research Training and Development UK (www.eajournals.org)
24
ISSN 2054-6297(Print), ISSN 2054-6300(Online)
Perceived Benefits of Spreadsheet Use
As was observed in the SIM lessons, the teacher used the spreadsheet to develop
mathematical concepts to support students’ understanding. For instance, while it was difficult
for the teacher in the CM class to demonstrate that as the absolute value of a (the coefficient
of x2 ) decreases, the graph of y = ax2 + bx + k widens and vice versa as the absolute value of
a decreases, it was easier for students to explore and conceptualize this in the SIM class. The
spreadsheet helped to demonstrate different values of a and their corresponding graphs on the
same spreadsheet at the same time, enhancing the conceptualization of the concept (see
Figure 5).
Figure 5: Snapshot of a SIM Lesson showing the graph of y = ax2.
Similarly, it was also easy for students in the SIM group to illustrate the nature of a quadratic
graph by altering the value of a (the coefficient of x2) to obtain a maximum (when a is less
than 0) or minimum (when a is greater than 0) as shown in Figure 5.
Interview data from the students supported the contention that, the spreadsheet use exhibited
the potential to improve teaching, learning and achievements in the mathematics lessons.
Most of the students explained that it was easier for them to observe the behaviour of
different graphs spontaneously. Thus, the spreadsheet made it very fast for them to toggle
among multiple graphs while exploring the properties of the quadratic functions. The
students also reiterated a number of other benefits they observed using the SIM. They
indicated that the spreadsheet provided an opportunity for them to work actively in their
small groups performing different activities; data entering, observing and recording the
changes the graphs and solving problems. They indicated that the SIM helped their teacher to
explain concepts much better and made lessons more practical and engaging.Table 4 below
enumerates various reasons that contributed to the usefulness of spreadsheet given by the
students.
International Journal of Education, Learning and Development
Vol.4, No.1, pp.11-29, February 2016
___Published by European Centre for Research Training and Development UK (www.eajournals.org)
25
ISSN 2054-6297(Print), ISSN 2054-6300(Online)
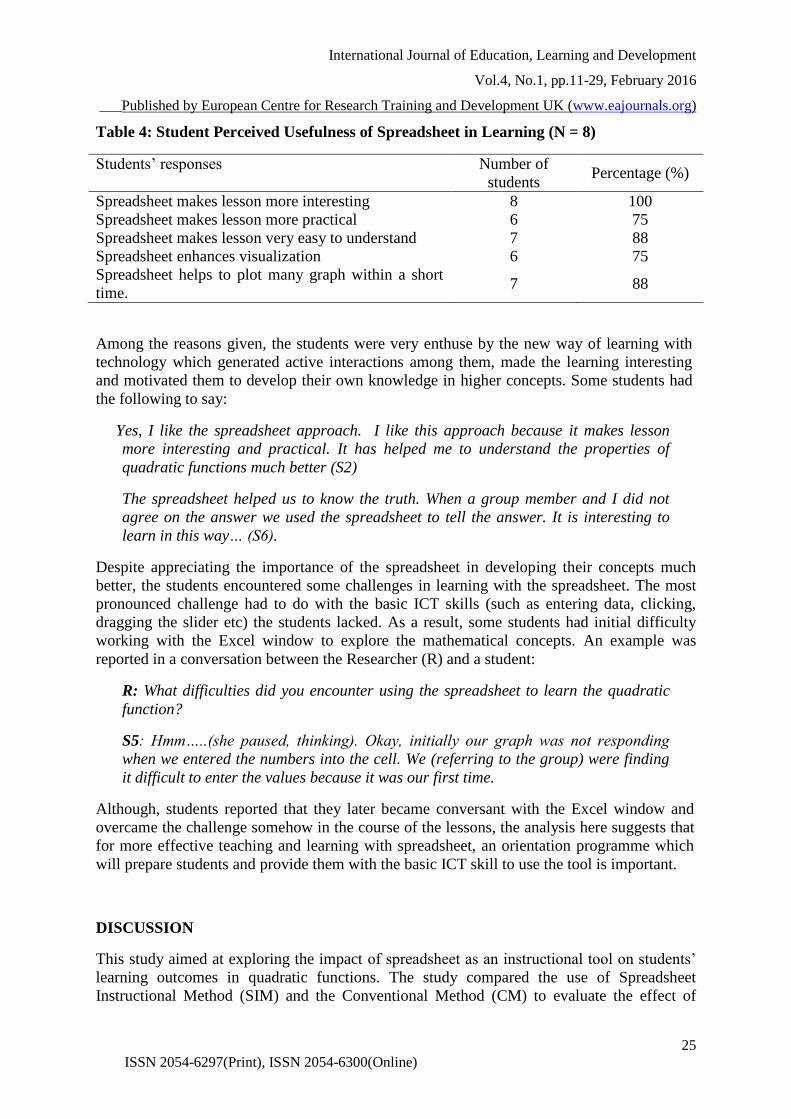
Table 4: Student Perceived Usefulness of Spreadsheet in Learning (N = 8)
Students’ responses Number of
students Percentage (%)
Spreadsheet makes lesson more interesting 8 100
Spreadsheet makes lesson more practical 6 75
Spreadsheet makes lesson very easy to understand 7 88
Spreadsheet enhances visualization 6 75
Spreadsheet helps to plot many graph within a short
time. 7 88
Among the reasons given, the students were very enthuse by the new way of learning with
technology which generated active interactions among them, made the learning interesting
and motivated them to develop their own knowledge in higher concepts. Some students had
the following to say:
Yes, I like the spreadsheet approach. I like this approach because it makes lesson
more interesting and practical. It has helped me to understand the properties of
quadratic functions much better (S2)
The spreadsheet helped us to know the truth. When a group member and I did not
agree on the answer we used the spreadsheet to tell the answer. It is interesting to
learn in this way… (S6).
Despite appreciating the importance of the spreadsheet in developing their concepts much
better, the students encountered some challenges in learning with the spreadsheet. The most
pronounced challenge had to do with the basic ICT skills (such as entering data, clicking,
dragging the slider etc) the students lacked. As a result, some students had initial difficulty
working with the Excel window to explore the mathematical concepts. An example was
reported in a conversation between the Researcher (R) and a student:
R: What difficulties did you encounter using the spreadsheet to learn the quadratic
function?
S5: Hmm…..(she paused, thinking). Okay, initially our graph was not responding
when we entered the numbers into the cell. We (referring to the group) were finding
it difficult to enter the values because it was our first time.
Although, students reported that they later became conversant with the Excel window and
overcame the challenge somehow in the course of the lessons, the analysis here suggests that
for more effective teaching and learning with spreadsheet, an orientation programme which
will prepare students and provide them with the basic ICT skill to use the tool is important.
DISCUSSION
This study aimed at exploring the impact of spreadsheet as an instructional tool on students’
learning outcomes in quadratic functions. The study compared the use of Spreadsheet
Instructional Method (SIM) and the Conventional Method (CM) to evaluate the effect of

International Journal of Education, Learning and Development
Vol.4, No.1, pp.11-29, February 2016
___Published by European Centre for Research Training and Development UK (www.eajournals.org)
26
ISSN 2054-6297(Print), ISSN 2054-6300(Online)
these approaches on students’ performance in quadratic functions in a context in which
mathematics learning have been deep-rooted in teacher-centred approaches of teaching. Both
approaches employed a mix of direct instruction and hands-on activities but with different
emphases.Whereas lessons were executed with ‘interactive demonstrations’ in a spreadsheet
environment for the SIM lessons, the CM made use of the talk and chalkboard illustrations to
provide explanations and examples without the support of any ICT tool.
The results of the study showed that the students reported significant levels of growth in
performances for both the SIM and CM; however, students involved in the SIM performed
much better than their counterparts in the CM. What was intriguing was that, most students in
the SIM lessons’ understanding shifted from viewing spreadsheet as a tool of reinforcement
to thinking and speaking about it as a tool for developing and constructing their own
mathematical knowledge. For instance, it was observed in the study that as the students
developed their knowledge and basic skill with spreadsheets, they were able to alter and vary
parameters of the quadratic functions within the cells of the spreadsheet window, motivating
them to experiment, discover and discuss among themselves the behaviour of the quadratic
function.
The results also showed that the spreadsheet allowed for easy investigations into the nature of
graphs of quadratic functions, providing a visual link between the graphs of quadratic
functions and their algebraic equations. This made it easy for students to match graphs of
quadratic functions to their respective algebraic equations on worksheet. Thus, just as
reported by Agyei (2012; 2013) and Agyei and Voogt (2014; 2015), using the spreadsheet
gave the students greater opportunity to verify results and consider general rules, make links
between spreadsheet formula, quadratic functions and graphs, analyse and explore number
patterns and graphs within a shorter time, allow for many numerical calculations
simultaneously, helping them explore mathematics concepts and apply knowledge from
lessons taught to realistic settings.
The study supported the contention (Agyei 2013; Liang and Martin, 2008 & Drier, 2001) that
when spreadsheet is fully utilised in classroom, it enhances effective teaching and learning,
promoting open-ended exploration of mathematical concepts to support constructivist
teaching and learning approach. Adoption of spreadsheets both as a tool for instruction and
learning mathematics content in this study was central to a successful intervention which
promoted better performance of students learning under this environment. The spreadsheet
environment appeared useful to engage the teacher in the design of learning activities to
support students in different learning related activities such as: viewing and discussing
presentations, collecting data (e.g. on orientation of graphs), making predictions of graph
locations, collaborating in teams to explore the properties of quadratic functions and
presenting work to peers for assessment. This variety of learning activities offered the
teacher opportunity to orchestrate student learning in various ways (cf. Drijvers, Doorman,
Boon, Reed & Gravemeijer, 2010). For instance the teachers’ visual representations of
mathematical functions allowed for immediate feedback, allowing learners to concentrate
more on mathematical relationships rather than on the mechanics of construction. Also the
teacher was able to demonstrate a wide range of examples of graphs by changing variables in
cells (on the spreadsheet) without having to draw them physically; learners were able to
explore many graphs in a shorter time, giving them greater opportunity to consider general
rules and test and reformulate hypotheses (Agyei 2013). This is the kind of pedagogical

International Journal of Education, Learning and Development
Vol.4, No.1, pp.11-29, February 2016
___Published by European Centre for Research Training and Development UK (www.eajournals.org)
27
ISSN 2054-6297(Print), ISSN 2054-6300(Online)
reasoning (cf. Webb & Cox, 2004) that teachers need to undertake in their planning and
teaching of ICT-enhanced lessons.
The results of the study seem to highlight the importance of the guided discovery technique
which was used in this study as a necessary contribution to students’ learning of quadratic
functions. This evidence is seen not only with the SIM approach (as reported in the
significant gains of their Pre-post test scores), but more so with the CM approach. The guided
discovery technique employed unlike the existing traditional method prompted clearly
defined roles for both students and teachers. Students worked collaboratively in groups, had
the opportunity to evaluate their own work and that of others sharing their evaluations. The
role of the teacher depicted him more as a facilitator than a dispenser of knowledge;
managing the context and setting and assisting students in developing mathematical concepts
through activities. This seems to have contributed to students learning and imparted on their
performance. Consequently, the study advocates that a guided discovery strategy is
significant in developing instruction to support mathematics lessons with technology.
According to Hmelo-Silver, et al. (2008), such an approach provides the learner with
opportunities to engage in scientific practices of questioning, investigation, and
argumentation as well as learning content in a relevant and motivating context.
CONCLUSION
In spite of the potential of Spreadsheet as an instructional tool to enhance mathematics
conceptual understanding as demonstrated in this study, the authors call attention to further
opportunities for teachers to develop their knowledge and skill about the affordances and use
of spreadsheet applications to explore mathematics concepts to improve teaching and
learning of the subject. Thus, the study contends that, if spreadsheet is to be included as tools
for learning mathematics, then teachers need opportunities to develop their personal
knowledge and skills in using spreadsheets for exploring and learning mathematics. They
need support in redesigning the mathematics curriculum to include spreadsheets as tools for
exploring mathematics while also guiding their students’ development of knowledge and
basic skills with spreadsheets (Niess et al., 2007). The study also calls attention to further
opportunities for students to experience learning about the affordances of spreadsheet
applications to explore further topics and concepts to improve teaching and learning of
mathematics.
REFERENCES
Agyei, D. D. (2012). Preparation of pre-service teachers in Ghana to integrate information
and communication technology in teaching mathematics. Doctoral Dissertation,
Enschede: University of Twente.
Agyei, D. D. (2013). The effect of using interactive spreadsheet as a demonstrative tool in the
teaching and learning of mathematics Concepts. International Journal of Educational
Planning and Administration, 3(1), 81-99.
Agyei, D. D., & Voogt, J. M. (2011). Exploring the potential of the will, skill, tool model in
Ghana: predicting prospective and practicing teachers’ use of technology. Computers &
Education, 56 (1), 91–100.

International Journal of Education, Learning and Development
Vol.4, No.1, pp.11-29, February 2016
___Published by European Centre for Research Training and Development UK (www.eajournals.org)
28
ISSN 2054-6297(Print), ISSN 2054-6300(Online)
Agyei, D. D., & Voogt, M. J. (2014). Pre-service mathematics teachers’ learning and
teaching of activity-based lessons supported with spreadsheets. Technology, Pedagogy
and Education, (online), 1-21.
Agyei, D. D., & Voogt, M. J. (2015). Pre-service teachers’ TPACK competencies for
spreadsheet integration: insights from a mathematics-specific instructional technology
course. Technology, Pedagogy and Education, 24(5), 605-625.
Anamuah-Mensah, J., Mereku, D. K., & Asabere-Ameyaw, A. (2006). The contexts for
learning and instruction influencing Ghanaian JSS 2 students’ dismal performance in
TIMSS-2003. African Journal of Educational Studies in Mathematics and Sciences, 4,
15-31.
Anku, S. (2005-2006). Wake up Mathematical Association of Ghana! Retrieved March 6,
2012, from http://www.mathned.org/
Beauchamp, G., & Parkinson, J. (2008). Pupils’ attitudes towards school science as they
transfer from an ICT-rich primary school to a secondary school with fewer ICT
resources: Does ICT matter? Education Information Technology, 13, 103-118.
Bottino, R. M., & Robotti, E. (2007). Transforming classroom teaching and learning through
technology: Analysis of a case study. Educational Technology & Society, 10(4), 174-
186.
Clement, L. L. (2001). What do students really know about functions? Mathematics Teacher,
94(9), 745-758.
Dettori, G., Garuti, R. & Lemut, E. (2001), From Arithmetic to Algebraic Thinking by Using
a Spreadsheet. In: R. Sutherland, T. Rojano, A. Bell & R. Lins (Eds.), Perspectives on
School Algebra. Dordrecht, The Netherlands: Kluwer.
Djangmah J. S., & Addae-Mensah, I. (2012). Four years of Senior High School in Ghana-
Why not three. African Echoe, “The Voice of Africa”, 83, Retrieved September, 6
2012, from http://www.africanecho.co.uk/africanechonews35-aug28sept14.shtml
Drier, H. S. (2001). Teaching and learning mathematics with interative spreadsheets. Schools
Science and Mathematics, 101(4), 170-179.
Drijvers, P., Doorman, M., Boon, P., Reed, H., & Gravemeijer, K. (2010). The teacher and
Dubinsky, E., & Harel, G. (1992).The concept of function: Aspects of epistemology and
pedagogy. Mathematical Association of America, 25, 261-289.
Eraslan, A. (2005). A qualitative study: algebra honor students' cognitive obstacles as they
explore concepts of quadratic functions. Retrieved June, 2013, from
http://diginole.lib.fsu.edu/etd/557.
Fletcher, J. A. (2005). Constructivism and mathematics education in Ghana. African Journals
Online, 5, 29-36.
Hartsell, T., Herron, S., Fang, H., & Rathod, A. (2009). Effectiveness of professional
development in teaching mathematics and technology applications. Journal of
Educational Technology Development and Exchange 2(1), 53-56.
Hmelo-Silver, C. E., Duncan, R. G., & Chinn, C. A. (2008). Scaffolding and achievement in
problem-based inquiry learning: A response to Kirschner, Sweller, and Clark (2006). .
Educational Psychologist, 42(2), 99-107.
Jones, K. (2005). Using Spreadsheets in the Teaching and Learning of Mathematics: a
research bibliography. MicroMath, 21(1), 30-31.
Liang, J., & Martin,L. (2008). An Excel-aided method for teaching calculusbased business
mathematics. College Teaching Methods & Styles Journal, 4 (11), 11-23.
Looney, S. C. (2004). A study of students’ understanding of patterns and functions in grades
3-5. Dissretation Abstract International, 65(03), 868. (UMI No: AAT3124854).

International Journal of Education, Learning and Development
Vol.4, No.1, pp.11-29, February 2016
___Published by European Centre for Research Training and Development UK (www.eajournals.org)
29
ISSN 2054-6297(Print), ISSN 2054-6300(Online)
Maharaj, A. (2008). Some insights from research literature for teaching and learning
mathematics. South African Journal of Education, 28, 401-414.
Miles, M. B., & Huberman, A. M. (1994). An Expanded Source book: qualitative Data
Analysis (2nd edn). London: Sage Publications.
Monaghan, J. (2005). Thinking Algebraically. In S. Johnston-Wilder, & D. Pimm (Ed.),
Teaching Secondary Mathematics with ICT. London: The Open University Press
Mullis, I. V. S., Martin, M. O., & Foy, P. (2008). International mathematics report: Findings
from IEA’s trends in International Mathematics and Science Study at the fourth and
eighth grades. Chestnut Hill: TIMSS & PIRLS International Study Center, Boston
College.
Niess, M. L. (2005). Preparing teachers to teach science and mathematics with technology:
Developing a technology pedagogical content knowledge. Teaching and Teacher
Education, 21, 509-523.
Niess, M. L., Sadri, P., & Lee, K. (2007). Dynamic spreadsheets as learning technology
tools: Developing teachers’ technology pedagogical content knowledge (TPCK). Paper
presented at the Paper presented at the meeting of the American Educational Research
Association Annual Conference, Chicago, IL.
Ottevanger, W., van den Akker, H., J. J., & de Feiter, L. (2007). Developing Science,
Mathematics and ICT education in Sub-Saharan Africa (SMICT): Patterns and
promising practices. Paper presented at the World Bank Working Paper.
Pallant, J. (2001). SPSS survival manual: A step by step guide to data analysis using SPSS for
windows (version 10 & 11). Australia: Glasgow, Bell and Bam Ltd.
Rojano, T. (1996), Developing Algebraic Aspects of Problem Solving within a Spreadsheet
Environment. In: N. Bednarz, C. Kieran, & L. Lee (Eds.), Approaches to Algebra:
perspectives for research and teaching (pp. 137-145). Dordrecht: Kluwer Academic
Publishers.
So, H. J., & Kim, B. (2009). Learning about problem based learning: Student teachers
integrating technology, pedagogy and content knowledge. Australasian Journal of
Educational Technology, 25(1), 101-116.
the tool: whole-class teaching behavior in the technology-rich mathematics classroom.
Educational Studies in Mathematics, 75 (2), 213-234.
Tubbs, J. (2012). Spreadsheet in classroom. Retrieved February 24, 2013 from
http://futureofmath.misterteacher.com/spreadsheets.html.
UNESCO. (2004). Teacher education. Retrieved March 22, 2012, from
http://portal.unesco.org/education/en/ev.php
Webb, M., & Cox, M. (2004). A review of pedagogy rated to information and
communications technology. Technology, Pedagogy and Education, 13(3), 235-286.
West African Examinations Council (2007). Chief Examiners’ Report on West African
Senior School Certificate Examination May/June 2007.
West African Examinations Council. (2008). Chief Examiners’ Report on West African
Senior School Certificate Examination May/June 2008.
Zazkis, R., Liljedahl, P., & Gadowsky, K. (2003). Conceptions of function translation:
Obstacles, intuitions, and rerouting. Journal of Mathematical Behavior. 22, 437–450.