effect of urbanization and hurricanes on the...
TRANSCRIPT

1
EFFECT OF URBANIZATION AND HURRICANES ON THE PROVISION OF ECOSYSTEM SERVICES IN THE LOWER SUWANNEE RIVER AND PENSACOLA
BAY WATERSHEDS, FLORIDA, USA
By
SONIA ELSA ROCIO DELPHIN PEREZ
A THESIS PRESENTED TO THE GRADUATE SCHOOL OF THE UNIVERSITY OF FLORIDA IN PARTIAL FULFILLMENT
OF THE REQUIREMENTS FOR THE DEGREE OF MASTER OF SCIENCE
UNIVERSITY OF FLORIDA
2012

2
© 2012 Sonia Elsa Rocio Delphin Perez

3
To my father and my mother

4
ACKNOWLEDGMENTS
I would like to thanks my mother for being by my side despite the distance. I would
also like to especially thank Dr. Francisco Escobedo for giving me the opportunity to
achieve my master’s dream. Without his help, advice, comprehension, dedication,
patience, support, and friendship this has not been possible. His valuable comments
were a key point for improving this thesis work. I would also want to thank Dr. Amr Abd-
Elrahman and Dr. Wendell Cropper who provided good contributions that improve this
study, and also for the time dedicated to read it. All the comments provided by my
committee were essential for improving this document; as well they will be very useful
for my future works. Special thanks to the Florida Forest Service and the School of
Forest Resources and Conservation-University of Florida for the financial support that
made this thesis possible. I would also like to thank Kimmel Chamat for being by my
side during this time, for supporting me in difficult times, for encouraging me to be better
every day, and for giving me the strength to keep moving forward. I also want to thank
Natalia Nequi for trusting me and being part of this stage. I thank my friends and family
in Gainesville: Martha Rosero, Claudia Penuela, Angelica Garcia, Oscar Murillo,
Gisselle Guerra, Ivelisse Ruiz, Silvia Marino, Ronald Cademus, Yin-Hsuen Chen, Li Bai,
Pinar Deliloğlu, Esli Suarez, Maria Mendes, and Cristobal Rodriguez, for all the support
and all the fun times we have together. I would like to thank Lucy Aquino for trusting me
and believing in me. I also want to thanks my best friends in Paraguay: Sandra Perrens,
Veronica Rivas, Irma Santacruz, and Mabel Torrico for the distance support. Thanks to
all people who joined me in this path.

5
TABLE OF CONTENTS page
ACKNOWLEDGMENTS .................................................................................................. 4
LIST OF TABLES ............................................................................................................ 7
LIST OF FIGURES .......................................................................................................... 9
ABSTRACT ................................................................................................................... 11
CHAPTER
1 INTRODUCTION .................................................................................................... 13
Conceptualizing Ecosystem Services ..................................................................... 13
Effect of Drivers on the Provision of Ecosystem Services ....................................... 17 Using Geographic Information Systems in Ecosystem Service Assessments ........ 18
Objectives ............................................................................................................... 20
2 EFFECTS OF URBANIZATION ON THE PROVISION OF ECOSYTEM SERVICES .............................................................................................................. 25
Background ............................................................................................................. 25
Carbon Storage and Urbanization .................................................................... 26 Timber and Urbanization .................................................................................. 28
Water Yield and Urbanization ........................................................................... 28 Ecosystem Services Models ............................................................................. 30
Methods .................................................................................................................. 31 Study Areas ...................................................................................................... 31
Quantification of Ecosystem Services .............................................................. 34 Carbon storage .......................................................................................... 34
Forest Inventory and Analysis Program data ............................................. 34 Carbon pools analysis ................................................................................ 35
InVEST carbon storage model ................................................................... 39 Timber volume ........................................................................................... 39
Water yield estimation ................................................................................ 40 Water model input data process ................................................................ 42
InVEST water model assessment .............................................................. 44 2060 land use and land cover map ............................................................ 44
Results .................................................................................................................... 46 Carbon Storage in 2003 and Urbanized 2060 .................................................. 46
Timber Volume in 2003 and Urbanized 2060 ................................................... 48 Water Yield in 2003 and Urbanized 2060 ......................................................... 49
Water Yield Assessment for the Lower Suwannee River Watershed ............... 50 Tradeoffs Between Carbon Storage, Timber Volume, Water Yield, and
Urbanization .................................................................................................. 51

6
Discussion .............................................................................................................. 51 Carbon Storage in 2003 and Urbanized 2060 .................................................. 52
Timber Volume in 2003 and Urbanized 2060 ................................................... 54 Water Yield in 2003 and Urbanized 2060 ......................................................... 54
Water Yield Assessment .................................................................................. 55 Tradeoffs Between Carbon Storage, Timber Volume, Water Yield, and
Urbanization .................................................................................................. 56 Concluding Remarks............................................................................................... 58
3 ASSESSING AND MAPPING POTENTIAL LOSS OF ABOVEGROUND CARBON STORAGE AND TIMBER VOLUME FROM HURRICANES ................... 82
Background ............................................................................................................. 82 Impacts of Hurricanes on Forests and Ecosystem Services ............................. 83
Factors Controlling Hurricane Damage on Forests .......................................... 85 Assessing and Mapping Hurricane Damage in Forests .................................... 87
Methods .................................................................................................................. 90 Study Areas ...................................................................................................... 90
Quantification of Aboveground Carbon Storage and Timber Volume ............... 92 Forest Inventory and Analysis Program Data ................................................... 92
Florida Vegetation and Land Cover 2003 ......................................................... 94 Decision-tree Framework ................................................................................. 95
Potential Loss of Aboveground Carbon Storage and Timber Volume .............. 99 Results .................................................................................................................... 99
Potential Loss of Aboveground Carbon Storage Due to Hurricanes ................. 99 Potential Loss of Timber Volume Due to Hurricanes ...................................... 101
Discussion ............................................................................................................ 102 Potential Loss of Aboveground Carbon Storage Due to Hurricanes ............... 103
Potential Loss of Timber Volume Due to Hurricanes ...................................... 104 Concluding Remarks............................................................................................. 105
4 CONCLUSIONS ................................................................................................... 119
Summary .............................................................................................................. 119
Effects of Urbanization on Carbon Storage, Timber Volume, and Water Yield ..... 119 Potential Loss of Aboveground Carbon Storage and Timber Volume from
Hurricanes ......................................................................................................... 120 Integrating the Concept of Ecosystem Services in Decisions ............................... 121
LIST OF REFERENCES ............................................................................................. 124
BIOGRAPHICAL SKETCH .......................................................................................... 139

7
LIST OF TABLES
Table page 1-1 Categories of ecosystem services ...................................................................... 22
1-2 Multiple Ecosystem Services assessment tools ................................................. 22
2-1 Land cover distribution in the Lower Suwannee River and Pensacola Bay watersheds, Florida based on the Florida Fish and Wildlife Conservation Commission ........................................................................................................ 61
2-2 Ecological subsection (Ecol. Subs.) descriptions................................................ 62
2-3 Description of the Forest Inventory and Analysis (FIA) attributes used in the carbon and timber analysis ................................................................................. 63
2-4 Forest tree species used in the carbon storage and timber volume analysis by Land cover type ............................................................................................. 64
2-5 Carbon pools aggregation based on the information available in the Forest Inventory and Analysis (FIA) Program database ................................................ 66
2-6 Reclassified land cover and carbon pools for the Pensacola Bay watershed ..... 66
2-7 Input data for the InVEST water yield model ...................................................... 69
2-8 Carbon storage descriptive statistics for the Lower Suwannee (LS) and Pensacola Bay (PB) Florida watersheds in Mg/ha .............................................. 71
2-9 Carbon storage in the four pools (Mg) for the Lower Suwannee River (LS) and Pensacola Bay (PB) watersheds, Florida .................................................... 71
2-10 Timber volume values for the Lower Suwannee (LS) and Pensacola Bay (PB) watersheds, year 2003-2060 ...................................................................... 71
2-11 Water yield for the Lower Suwannee (LS) and Pensacola Bay (PB) watersheds ......................................................................................................... 71
2-12 Average volume in m3 for the Gopher gage station and the InVEST water yield model ......................................................................................................... 72
2-13 Pearson Correlation coefficients between carbon storage, timber volume, water yield and percentage (%) of forest change for the Lower Suwannee River and Pensacola Bay watersheds at the sub-watershed level ..................... 72
3-1 Description of the Forest Inventory and Analysis (FIA) attributes used in the hurricane framework ......................................................................................... 108

8
3-2 Range of values for the two defined classes for tree diameter, tree height and basal area for the Lower Suwannee River and Pensacola Bay watersheds ..... 109
3-3 Expressions used in the Conditional function in ArcGIS® Spatial Analyst to
define the risk of forest damage by hurricanes ................................................. 109
3-4 Potential aboveground carbon, timber net volume, and timber in the sawlog portion in the forest damage risk zones for the Lower Suwannee watershed ... 109
3-5 Potential aboveground carbon, timber net volume, timber in the sawlog portion in the forest damage risk zones for the Pensacola Bay watershed ...... 109

9
LIST OF FIGURES
Figure page 1-1 Framework for linking ecosystems to human wellbeing ...................................... 24
2-1 Study area: Lower Suwannee River and Pensacola Bay watersheds ................ 73
2-2 Approach for the estimation of carbon pools and timber volume using the Forest Inventory and Analysis (FIA) program data ............................................. 73
2-3 Reclassification of the original land covers to include the ecological subsection and county data. ............................................................................... 74
2-4 Flow chart for estimating carbon and timber in the Lower Suwannee River and Pensacola Bay Florida watersheds to approximate the exact locations of the Forest Inventory and Analysis (FIA) plots ..................................................... 75
2-5 Conceptual framework for the InVEST water yield model .................................. 76
2-6 Total Carbon storage in the Lower Suwannee River, Florida. ............................ 77
2-7 Total carbon storage in the Pensacola Bay watershed ....................................... 78
2-8 Differences between 2060 and 2003 in the water yield per hectare for the Lower Suwannee River watershed ..................................................................... 79
2-9 Differences between 2060 and 2003 in the water yield (mean) and precipitation (ppt) for the Pensacola Bay watershed .......................................... 79
2-10 Normalized curves showing differences between average water yield volume from the InVEST model and the Gage station data (actual) for the Lower Suwannee River watershed ................................................................................ 80
2-11 Carbon storage, timber volume, and water yield in 2003 (current) and 2060 for the Lower Suwannee (LS) and Pensacola Bay (PS) watersheds .................. 81
3-1 Decision tree scenario for determining forest damage risk due to hurricanes .. 110
3-2 American Society Civil Engineer’s Standard (ASCE) 7-98 map with wind risks for the two watersheds: Lower Suwannee River and Pensacola Bay ............... 111
3-3 Flow chart for the decision tree analysis for determining forest damage risk zones ................................................................................................................ 112
3-4 Aboveground carbon storage in the Lower Suwannee River watershed in 2003 ................................................................................................................. 113

10
3-5 Risk of forest damage by hurricanes in the Lower Suwannee River watershed ......................................................................................................... 114
3-6 High risk of forest damage by hurricanes in the Lower Suwannee River watershed by sub-watersheds .......................................................................... 115
3-7 Aboveground carbon storage in the Pensacola Bay watershed in 2003 ........... 116
3-8 Risk of forest damage by hurricanes in the Pensacola Bay watershed ............ 117
3-9 High risk of forest damage by hurricanes in the Pensacola Bay watershed by sub-watersheds ................................................................................................ 118

11
Abstract of Thesis Presented to the Graduate School of the University of Florida in Partial Fulfillment of the
Requirements for the Degree of Master of Science
EFFECT OF URBANIZATION AND HURRICANES ON THE PROVISION OF ECOSYSTEM SERVICES IN THE LOWER SUWANNEE RIVER AND PENSACOLA
BAY WATERSHEDS, FLORIDA, USA
By
Sonia Elsa Rocio Delphin Perez
August 2012
Chair: Francisco Escobedo Cochair: Amr Abd-Elrahman Major: Forest Resources and Conservation
Ecosystems can be impacted by different drivers that can alter their functionality.
Thus, to understand the magnitude of these impacts to Ecosystem Service (ES)
provision, quantification of ES and the drivers is important. This study estimated the
effects of urbanization and hurricanes as direct drivers of carbon storage and timber
volume, as well as water yield in forest areas in the Lower Suwannee River and
Pensacola Bay watersheds, in Florida, USA. A current 2003 to 2060 urbanization
scenario using spatial data and modeling, analyzed the effects of urbanization on ES.
Results showed statistically significant differences at 95% confidence level between
2003 and 2060 in terms of provision of the three ES analyzed. For the hurricane
analysis, this study estimated the potential loss of aboveground carbon storage and
timber volume in high and low forest damage risk zones. Five factors were used in a
decision tree to determine potential for forest damage due to hurricanes. Results
showed that in the Lower Suwannee, 31% of the total aboveground carbon and 15% of
the total timber were located in the high forest damage risk (HD) zone while the
Pensacola Bay, had 0.5% of the total aboveground carbon and about the 0.7% of the

12
total timber in the HD zone. Knowledge on how different drivers impact ecosystems and
their services will provide a better understanding to landowners, policy makers, about
the consequences of land use change and natural disturbance on the benefits provided
by forests.

13
CHAPTER 1 INTRODUCTION
Conceptualizing Ecosystem Services
Ecosystem services is becoming a mainstream concept in natural resources and
environmental planning and management (Boyd and Banzhaf, 2007; Brown et al., 2007;
de Groot et al., 2010; Farley and Costanza, 2010). The concept of ecosystem services
has been increasingly used in the late 1990s (Costanza et al., 1997; Daily, 1997). There
are several definitions of ecosystem services. One of the first uses of the term
“ecosystem services” (ES), is by Daily (1997) who defined them as the natural
ecosystem’s processes that can sustain and benefit human life. These ecosystem
services provide biodiversity and ecosystem goods, such as food, timber, fuel wood,
among others. In addition to the production of goods, ES are based on ecological
functions, such as providing clean water, and aesthetic and cultural benefits.
Unfortunately, a coherent and integrated approach to practical applications of the
concept in ecosystem and landscape planning, management and decision-making is
lacking (Daily et al., 2009; de Groot et al., 2010; ICSU et al., 2008). Daily et al. (2009)
mentioned that finding a link between decisions and ecosystems is a huge challenge.
De Groot et al. (2010) discussed some alternatives to integrate ecosystem services and
values in planning, policy and decision making. One example is the communication
about ecosystem services and their values in a clear way with the objective of making
the concept accessible to policy makers (de Groot et al., 2010). Another alternative is to
make databases related to ecosystem services accessible to land use planners (de
Groot et al., 2010).

14
Brown et al. (2007) refers to Daily (1997) and makes a distinction between
ecosystem services and goods, and that both can produce benefits to human well-
being. Ecologists are likely to distinguish between ecosystem goods and services
(Brown et al., 2007; Daily, 1997; de Groot et al., 2010; European Commission, 2009),
however others are often combining both as ecosystem services and referring to
ecosystem goods as one category of ecosystem services named provisioning
ecosystem services (Costanza et al., 1997; de Groot et al., 2010; Millennium Ecosystem
Assessment, 2003). The concept of ecosystem services and goods are usually used as
synonymous with ecosystem functions or processes. However, ecosystem processes
determine ecosystem services and goods. Therefore, ecosystem processes are an
intermediate step, thus they often do not produce direct benefits to people; however,
they are necessary for human life and their values are included in the final values
(Figure 1-1) (Brown et al., 2007; Costanza et al., 1997; de Groot et al., 2010; Millennium
Ecosystem Assessment, 2003).
The most commonly cited concept for ecosystem services is the one developed by
the Millennium Ecosystem Assessment (2003), and is based on a combination of the
definitions of Daily (1997) and Costanza et al. (1997). According to the Millennium
Ecosystem Assessment (2003), ES are the services provided by ecosystems with a
direct influence on human well-being. There are different categories of ecosystem
services according to the Millennium Ecosystem Assessment (2003), these include
provisioning, regulating, cultural, and supporting services (Table 1-1). Provisioning
services are the products people can get from the ecosystem; these are the ecosystem
goods (e.g. food and timber). Regulating services refer to the benefits people receive

15
from the regulation of ecosystem processes (e.g. flooding regulation and clean air).
Cultural services are the nonmaterial benefits obtained from ecosystems (e.g. spiritual
enrichment and recreation). Supporting services are those necessary for the production
of other ecosystem services (e.g. primary production).
Natural ecosystems (e.g. forests, savannas, and prairies) and human-modified
ecosystems (e.g. croplands and urban areas) should also be considered when
assessing ecosystem services (Costanza et al., 1997; Millennium Ecosystem
Assessment, 2003). Also, the four previously mentioned categories should be analyzed
in order to have a more integrative approach because ecosystems can produce
services in several categories. In doing so, ecosystems generate benefits to humans;
some ecosystems provide more services than others. For example, forests provide a
variety of services (Nasi et al., 2002; Yonavjak et al., 2011) in different categories:
provisioning such as timber, pulpwood for paper, and non-timber forest products;
regulating such as climate, erosion, and water flow control, as well as, cultural services
such as recreation and tourism, and some supporting services such as nutrient and
water cycling, and primary production (Table 1-1).
Specifically, southern United States (U.S.) forests are one of the most biologically
diverse temperate forests in the world and consequently they produce a bundle of
ecosystem services (i.e. a set of ecosystem services that are provided together as ’co-
benefits’ to people) (Raudsepp-Hearne et al., 2010). Therefore, people can get multiple
ecosystem services; however they can decide which services are more relevant for
them depending of what specific benefit they want from these ecosystems. For
example, if a population wants to increase flood protection, or meet needs for supply of

16
water, or an increase in small farm production, different services will be considered
(McKenzie et al., 2011). So, the inclusion of the population in the process of knowing
about what ecosystem services is important for them and their region is key.
Additionally, these ecosystem services can be identified at different scales, such as
local (e.g. timber), regional (e.g. clean water), and global (e.g. climate regulation)
(Yonavjak et al., 2011), so this distinction in terms of scale is important for management
purposes.
Although the fact that ecosystems provide services to people is already known, yet
there are still several information gaps about ecosystem service dynamics, specifically
how the provision of ecosystem services will change with changes in ecosystems (de
Groot et al., 2010). Some aspects are still being studied, and especially those related to
the interactions between ecosystem services (i.e. tradeoffs) and the effects of land
cover change on the provision of these ES. As a result of this lack of information, some
land covers that are multifunctional (and consequently multiple ES provision) are
converted often to single-functional land covers (e.g. croplands). All ecosystems
constantly change over time, and many of these changes are due to human impacts
(e.g. urbanization) and natural processes (e.g. wildfire) (ICSU et al., 2008; Millennium
Ecosystem Assessment, 2003). Therefore, understanding the causes of these changes,
or drivers, is fundamental to minimize their impact on the provisioning of ecosystem
services (Millennium Ecosystem Assessment, 2003).
By definition, drivers are ecological or human factors that can affect ecosystem
composition, functioning, and processes, that then result in increasing or decreasing
provisioning of ecosystem services (Millennium Ecosystem Assessment, 2003). These

17
drivers can be classified as direct or indirect drivers. Direct drivers refer to those that
directly affect ecosystem processes; on the other hand, indirect drivers are those
affecting direct drivers. Examples of direct drivers are: land use change (e.g. forest to
agriculture conversions), climate change, hurricanes, pest and diseases, among others.
Indirect drivers can include: population growth, land use policies, land values, and
market values for provisioning services (ICSU et al., 2008; Millennium Ecosystem
Assessment, 2003; Yonavjak et al., 2011). One of the challenges about ecosystem
services is the identification of the main drivers of change, in other words, the drivers
that affect specific ecosystems, as well as their consequences on the provision of
ecosystem services (Millennium Ecosystem Assessment, 2003). The definition of the
key drivers for specific ecosystems will depend on several factors, such as historical
information. For example, the most important direct drivers of change in terrestrial
ecosystems over the past 50 years have been: land cover change (e.g. deforestation,
cropland conversion) (Nelson, 2005) and the type of ecosystem (e.g. terrestrial and
marine in that the main driver for marine ecosystems has been fishing). There are also
some regional differences that determine the key driver’s ecosystem, such as
economic, institutional, technological, cultural, and demographic factors.
Effect of Drivers on the Provision of Ecosystem Services
In general, human beings modify ecosystems to increase the productivity of
provisioning services such as food, timber, without paying attention to the tradeoffs, but
increasing the use of one ecosystem service is resulting in a decrease in the use of
another ecosystem service (Hancock, 2010; Millennium Ecosystem Assessment, 2003;
Rodriguez et al., 2006). To better understand the influence of drivers in the form of land
cover changes (e.g. forest to urban areas) and their effect on the provision of

18
ecosystem services, it is becoming important to link this as a direct consequence to
human wellbeing (ICSU et al., 2008), since human activities are producing changes in
ecosystems rapidly (Metzger et al., 2006). The Millennium Ecosystem Assessment
(2003) for example proposes a multi-sectorial approach for evaluating changes in
different ecosystem services (e.g. crop production versus water quality), as well as to
better understand the interactions between them and the impacts on people.
The future of ecosystems to provide ecosystem services will depend on socio-
economic, climate, and land use changes among others drivers (Metzger et al., 2006).
Various studies have been done to quantify the impact of land cover changes on the
provision of ecosystem services. Reyers et al. (2008) found that ecosystem services
experienced a decline ranging from 18%-44% as consequence of the land use change,
specifically to croplands and urban areas in the Little Karoo in South Africa. Zang et al.
(2011) quantified the decrease in ecosystem service values due to land use changes
(urbanization and croplands) in the HaDaQi industrial corridor in China, and they found
a decrease of 29% from 1990 to 2005. McNulty (2002) found that a single hurricane can
affect carbon sequestration in forests converting 10% of the total carbon sequestered by
U.S forests into dead biomass. According to Zhang and Nagubadi (2005), urbanization
has a negative impact on timberland use in general. However, there is still a need to do
more ecosystem service studies to assess the effects of land cover changes with more
effective and simple methods.
Using Geographic Information Systems in Ecosystem Service Assessments
Most of the works that quantify value and analyze trade-offs among ecosystem
services and land cover changes are based on Geographic Information Systems (GIS)
methods. Since ecosystem services and land cover changes can be quantified and

19
mapped using GIS (Boyd and Banzhaf, 2007; Metzger et al., 2006), this method is
becoming widely used because its simplicity for studies involved in evaluating and
mapping ecosystem services (Chen et al., 2009; Egoh et al., 2008; Troy and Wilson,
2006). Increasing interest in ecosystem services has derived the development of new
tools to perform a multi-ecosystem service assessments (Waage et al., 2008). Some
examples are presented by Waage et al. (2008) and include: (1) Artificial Intelligence for
Ecosystem Services-ARIES, (2) Ecosystem Services Review-ESR, (3) Integrated
Valuation of Ecosystem Services and Tradeoffs-InVEST, Multi-scale Integrated Models
of Ecosystem Services- MIMES, and (5) Natural Value Initiative-NVI (Table 1-2).
Models such as InVEST use spatial data to estimate and map the quantity of ES
(Tallis et al., 2011). The InVEST model is a GIS spatially explicit tool used for
quantifying and valuing ecosystem services based on ecological production functions
and economic valuation methods (Nelson et al., 2009; Tallis et al., 2011).The InVEST
model is characterized by its repeatability and simplicity and because not much data is
needed for running it; therefore it can be used in areas with poor data availability, and
adjusted to the needs of the research because scenario analyses can be done (Tallis et
al., 2011; Waage et al., 2008).
Even though GIS tools can help in the assessment of ecosystem services, a
combination of GIS and field data is recommended to improve accuracy in most
analyses (Zheng et al., 2012). Therefore, the U.S. Department of Agriculture (USDA)
Forest Service Inventory and Analysis (FIA) program data can be used for this type of
analysis of some ecosystem services. The FIA data set contains database for the forest
lands in all the U.S States including forest characteristics, such as extent, condition, and

20
volume. Several studies (Jenkins et al., 2003; Smith et al., 2004; Woodbury et al., 2007)
have used this database for calculating forest carbon stocks, for example.
Objectives
Given the above, this study aims to identify and quantify the effects of ecosystem
service drivers on land use and land cover change and the provision of ecosystem
services in undeveloped areas in two watersheds located in the State of Florida, the
Lower Suwannee River and the Pensacola Bay watershed. To determine the effects of
land cover change, two direct drivers were analyzed: urbanization and hurricanes,
which constitute threats to the state of Florida’s ecosystems (Leatherman and Defraene,
2006; Wear, 2002a). Urbanization through conversion of natural ecosystems
(Millennium Ecosystem Assessment, 2003), has been a key driver in the State, as a
result of population growth, and because new urban areas are needed to allocate this
new population. In Florida, according to Zwick & Carr (2006) between 2006 and 2060
the population of the State is projected to double. The second driver that will be
analyzed are hurricanes, since according to several authors, one of the main
consequences of climate change in Florida will be the increase of hurricane’s intensity
and frequency (Florida Oceans and Coastal Council, 2009; Stanton and Ackerman,
2007). Therefore, the importance of understanding the possible consequences of these
two drivers on the provision of forest ecosystem services is becoming crucial.
The following chapters addressed the two drivers previously mentioned:
urbanization and hurricanes in two watersheds in the state of Florida, the Lower
Suwannee River and the Pensacola Bay located in the Northeastern and Northwestern
Florida respectively. The 2nd chapter analyzed the effects of urbanization on the
provision of ecosystem services specifically carbon storage, timber volume and water

21
yield by using the GIS spatial model InVEST to quantify the ecosystem services in a
2003-land cover and then compared it to a 2060-population distribution scenario (Zwick
and Carr, 2006). The hypothesis and objectives were:
Hypothesis: Urbanization directly affects carbon storage, timber volume, and water yield. Carbon storage and timber volume are negatively correlated with urbanization and water yield is positively correlated.
Objective 1: Determine the effects of Land Use and Land Cover changes in undeveloped areas due to urbanization on the provision of ecosystem services such as carbon storage, timber volume, and water yield in the two watersheds before mentioned.
Objective 2: For the years 2003 and 2060, to estimate the amount of carbon storage, timber volume, and water yield in the two watersheds based on the InVEST model and the U.S.D.A Forest Inventory Data.
The 3rd chapter used a decision tree to develop a framework to identify the risk of
forest damage due to hurricanes and determined the potential loss of aboveground
carbon storage and timber volume in high and low forest damage risk zones. The map
was developed based on information from previous studies (McNulty, 2002; Oswalt and
Oswalt, 2008; Stanturf et al., 2007) that determined the main forest structure factors that
increase the risk of hurricane damage to forests. The objectives were:
Objective 1: Develop a hurricane framework based on a decision-tree analysis, to identify high and low forest damage risk zones due to hurricanes based on the tree diameter and height, species type (e.g. softwoods and hardwoods), and distance to landfall.
Objective 2: Assess and map the potential loss of aboveground carbon storage and timber volume due to hurricanes in the two watersheds previously mentioned, based on the InVEST model and the U.S.D.A Forest Inventory Data in the high and low forest damage risk zones due to hurricanes.
Finally, the 4th chapter presented general conclusions including an analysis of the
two drivers and their effects on ecosystem services, as well as alternatives to better
include ecosystem services in decision-making.

22
Table 1-1. Categories of ecosystem services. [Adapted from Millennium Ecosystem Assessment. 2003. Ecosystems and Human Well-being: A Framework for Assessment (Page 5, Figure 1). Island Press, Washington.]
Categories Definition Examples
Provisioning services Products obtained from ecosystems
Food, fresh water, fuel wood. Fiber. Biochemical, genetic resources
Regulating services Benefits obtained from regulation of ecosystem processes
Climate regulation, disease regulation, water regulation, water purification, pollination
Cultural services Non-material benefits obtained from ecosystems
Spiritual and religious, recreation and ecotourism, aesthetic, inspirational, educational, sense of place, cultural heritage
Supporting services Services for the production of all other ecosystem services
Soil formation, nutrient cycling, primary production
Table 1-2. Multiple Ecosystem Services assessment tools. [Adapted from Waage, S., Stewart, E., and K. Armstrong. 2008. Measuring Corporate Impact on Ecosystems: A Comprehensive Review of New Tools: Synthesis Report. Business for Social Responsibility, San Francisco, CA.]
Model name Description Developer Type of results
Artificial Intelligence for Ecosystem Services (ARIES)
A computer model uses for estimating and forecasting ecosystem services provision and economic values in a specific area
University of Vermont’s Ecoinformatics “Collaboratory” Conservation International, Earth Economics, and experts at Wageningen University
Spatially explicit maps
Ecosystem Services Review (ESR)
A sequence of questions that helps managers develop strategies to manage risks and opportunities arising from a company’s dependence on ecosystems
World Resources Institute (WRI), Meridian Institute, and World Business Council for Sustainable Development (WBCSD)
Risk and/or opportunity analysis

23
Table 1-2. Continued
Model name Description Developer Type of results
Integrated Valuation of Ecosystem Services and Tradeoffs (InVEST)
A decision-making aid to assess how distinct scenarios may lead to different ecosystem services and human-well-being related outcomes in particular geographic areas
Natural Capital Project, a joint venture among Stanford University’s Woods Institute for the Environment, The Nature Conservancy and World Wildlife Fund (WWF)
Spatially explicit maps
Multi-scale Integrated Models of Ecosystem Services (MIMES)
A multi-scale, integrated suite of models that assess the true value of ecosystem services, their linkages to human welfare, and how their function and value may change under various management scenarios
University of Vermont’s Gund Institute for Ecological Economics
Spatially explicit maps
Natural Value Initiative (NVI)
An evaluation benchmark methodology for assessing biodiversity and ecosystem services-related risks and opportunities in the food, beverage and tobacco sectors
Fauna & Flora International, Brazilian business school FGV, and the United Nations Environment Programme Finance Initiative
Risk and/or opportunity analysis

24
Figure 1-1. Framework for linking ecosystems to human wellbeing. [Adapted from de
Groot, R.S., Alkemade, R., Braat, L., Hein, L., and L. Willemen. 2010. Challenges in Integrating the Concept of Ecosystem Services and Values in Landscape Planning, Management and Decision Making (Page 264, Figure 2). Ecological Complexity.]

25
CHAPTER 2 EFFECTS OF URBANIZATION ON THE PROVISION OF ECOSYTEM SERVICES
Background
Land cover change affects ecosystem structure, processes and functions, and
consequently their capacity to deliver ecosystem services (Daily, 1997; European
Commission, 2009; Metzger et al., 2006; Millennium Ecosystem Assessment, 2003; Su
et al., 2012). The changes in land cover are increasingly important, as they are
projected to increase and accelerate in the next decades due to human activities (IPCC,
2001; Vitousek et al., 1997; Wear and Greis, 2002a). However, analyzing different land
cover change scenarios is not an easy task as land cover changes due to urbanization
are determined by a variety of factors including socio-economic and climate factors, that
can damage or modify natural ecosystems and determine their vulnerability to such
changes (Metzger et al., 2006).
One of the major threats to ecosystems is human population growth. World
population is rapidly increasing, and according to the U.S Department of Commerce,
Census Bureau (2002) the population by 2050 is projected to be 9 billion. The result of
this population rise will be more human influences on these ecosystem services such as
food, timber, and clean water, as well as changes in land cover (European Commission,
2009; Millennium Ecosystem Assessment, 2003; Vitousek et al., 1997). So, land cover
change, driven by urbanization as well as agricultural expansion, deforestation, over-
exploitation of natural resources, and climate change (European Commission, 2009;
Foley et al., 2005), have been identified as some of the most important drivers affecting
terrestrial ecosystems (Reyers et al., 2009; Vitousek et al., 1997). Although, land cover
change can contribute to economic development, it is normally accompanied by

26
degradation of ecosystem services due to unsustainable human practices resulting in a
reduction of the benefits for future generations (Millennium Ecosystem Assessment,
2003; Vitousek et al., 1997). The State of Florida is not an exception to this trend,
according to Zwick & Carr (2006) the population will double by 2060.
Urbanization, defined as the development of new urban areas from non-urban
lands, is one important human-induced disturbance that affects natural ecosystems
(Bengston et al., 2005; Zhang et al., 2012). More specifically, urbanization can alter the
structure, composition, processes and functions of the ecosystems, in doing so it can
deplete ecosystem services’ provision (Grimm et al., 2008; Xu et al., 2007).Urbanization
is also predicted to alter significant areas of forest and other natural systems as well as
agricultural areas in the next few years with forests being the most subject to
fragmentations (Alig et al., 2004; Smail and Lewis, 2009; Wear and Greis, 2002a).
According to Bengston et al. (2005), during the latter half of the 1990s there was an
increased concern in unplanned urbanization, especially because of the resulting
environmental impacts. This unplanned urbanization was identified as the most
significant factor affecting forest ecosystems in the southern U. S. (Wear, 2002b), since
45% of Florida’s forest area declined since 1992 (Wear and Greis, 2002a). Urbanization
can alter both biotic and abiotic ecosystem properties (Grimm et al., 2008) and have
significant impacts on a terrestrial ecosystem’s carbon cycle (Xu et al., 2007), as well as
other ecosystem services such as clean water by increasing point and non-point
pollutants (Grimm et al., 2008; Wear and Greis, 2002a; Zheng et al., 2012).
Carbon Storage and Urbanization
It is estimated that urbanization has emitted about 0.21 Pg carbon between 1945
through 2007 in the Southern U. S. (Zhang et al., 2012). However, urban areas can also

27
store carbon in planted and reforested trees and can reach the pre-urbanization
amounts in 70-100 years (Zhang et al., 2012). According to Zheng et al. (2012), forest
carbon sequestration can be reduced by 1.7-9.3% as a result of urbanization in the
forested wildland-urban interface areas in New England, USA. They also mentioned that
carbon sequestration can increase by 40% by 2030.
Carbon storage in ecosystems is of interest because of climate change mitigation
policies (Davies et al., 2011). The Kyoto Protocol for example proposes to take carbon
storage and sequestration as a valid mechanism for emission reduction to mitigate
global climate change (Gorte, 2009; Newell and Stavins, 2000; Stavins, 1999). Forests
are key for carbon storage and critical to the global carbon cycle as they comprise a
large amount of carbon comparing to other terrestrial ecosystems (Gorte, 2009;
Harmon, 2001; Jandl et al., 2007; Yonavjak et al., 2011). Of the total carbon stored in
terrestrial vegetation and soils (2,200 Giga tons-Gt), forests comprise over half (53%) of
this value (Braatz, 2001). Gorte (2009) presented a comparison of carbon stocks for
different land covers and the highest value corresponded to forests ranging from 68-182
tons per acre and the lowest to croplands with 37 tons per acre.
In forests, carbon can be stored in different “pools”, such as in the: soil, live tree,
standing dead tree, forest floor, down dead wood, and understory vegetation (Harmon,
2001; Smith et al., 2004; Tawil, 2007). However, in some cases, only forest and forest
products are considered relevant carbon pools (Harmon, 2001). Southern forests
represent 29% of the U.S. forests and play an important role in the sequestration of
carbon at a global scale. Approximately one-third of the carbon sequestered in U.S.
forests corresponds to Southern forests, hence they can help in mitigating the effect of

28
climate change (Hanson et al., 2010; Wear and Greis, 2002a).Therefore, when forests
are degraded or their area reduced, the carbon stored is directly affected (Hanson et al.,
2010) and when forests are degraded or converted; the carbon stored is directly
affected (Hanson et al., 2010).
Timber and Urbanization
Timber products are considered provisioning ecosystem service and are used to
meet a variety of needs (Millennium Ecosystem Assessment, 2005). To consider timber
as a provisioning ecosystem service, it should provide direct benefits to people (e.g.
wood for furniture or fuel) (Millennium Ecosystem Assessment, 2005), and hence
should be expressed in terms of production. The benefits of this ecosystem service are
widely recognized and are more easily valued than other ecosystem services because
market prices exist for timber and non-timber forest products (de Groot et al., 2010). US
Southern forests have an important potential for timber production (Prestemon and Abt,
2002a). The South produces more than 60% of the timber products in the U.S.
(Prestemon and Abt, 2002a) and according to Bystriakova et al. (2005), timber harvest
at the global scale has been increased by 60% in the last four decades and the trend is
to continue increasing but at a slower rate. Zhang & Nagubadi (2005) found that
urbanization is one the drivers generating the decline in timberland area. Cubbage et al.
(1995) also found that urbanization reduced the timber supply especially that of
softwoods. Additionally Hodges et al. (1998) found that in St. Tammany Parish in
Louisiana, forests were reduced by urban development.
Water Yield and Urbanization
Water is another important resource that provides services to human. Water
enters ecosystems through precipitation and leaves through evaporation and runoff

29
(Chapin III et al., 2002). Precipitation can be affected in different ways in terrestrial
ecosystems. It can be: (1) intercepted by vegetation, (2) stored in the soils where it can
be taken up by vegetation roots or discharged into the aquifer and surface streams, (3)
evaporated by soil and (4) transpired by vegetation. As water moves through the land,
human activities and land use/cover types determine its physical and biochemical
characteristics (Conte et al., 2011). Land use changes can alter water quantity and
quality (Foley et al., 2005; Sun et al., 2005). Therefore, determining the effect of land
use/cover on water yield and quality becomes important. Water yield, defined in this
study as all annual precipitation that does not evaporate from soil and water or
transpires from vegetation (Mendoza et al., 2011).
Forests can reduce runoff, as a result of increased evapotranspiration and
infiltration, as well as improve water quality and maintain stream levels thus minimizing
stormwater runoff (Hanson et al., 2010; Nasi et al., 2002). Several studies have
determined the relationship between water and forests (Bosch and Hewlett, 1982; Sun
et al., 2005) and urban areas. For example, water flow can change after urbanization
since Hollis (1977) found that the median flow was increased 0.057 m3 to 0.142 m3 per
second in the Canon’s Brook catchment in England. Arnold et al. (1987) also analyzed
the impact of urbanization on water yield in a Dallas, Texas, USA watershed, and found
that it changed from rural to about 77 percent urban. Based on a model called Simulator
of Water Resources in Rural Basins (SWRRB) they also calculated that annual surface
runoff with no increase in urbanized area would be 135 mm rather than 151 mm, about
10% increase. Boggs and Sun (2011) compared two areas in North Carolina, one more
urbanized and the other more forested, and concluded that urbanization can increase

30
annual discharge volumes due to the decrease in evapotranspiration. Some studies
were done in Florida, where Sun et al. (2008) found that land use and land cover
changes will have little effect on water quantity and the water demand relationship in
2020 in the southeastern U.S. They also mentioned that land use changes affects water
yield and evapotranspiration loss. Many studies in Florida have analyzed the effect of
urbanization on water quality (Cooley and Martin, 1979; Frick, 1998), and other
consequences on water such as impact on insect communities (Jones and Clark, 1987)
and water supply (Boggess, 1968). However more information about the impact of
urbanization on water yield is lacking in the State of Florida.
Ecosystem Services Models
The previously mentioned ecosystem services can be quantified and mapped
using Geographic Information Systems (GIS) models (Boyd and Banzhaf, 2007;
Metzger et al., 2006). Models such as the Integrated Valuation of Ecosystem Services
and Tradeoffs (InVEST) use spatial data to estimate and map the quantity of ES (Tallis
et al., 2011). The InVEST model is a GIS spatially explicit tool used for quantifying and
valuating ecosystem services based on ecological production functions and economic
valuation methods (Nelson et al., 2009; Tallis et al., 2011). The model can determine
the quantity of ecosystem services in a current land use/cover and how these
ecosystem services can change in the future with different scenarios such as new
policies, and programs. Model outputs are in biophysical terms (e.g. tons of carbon
stored) or economic terms (e.g. net present value of carbon sequestered) (Tallis et al.,
2011).
In this chapter, three ecosystem services were analyzed: two regulating services,
(1) carbon storage as an indicator of climate regulation and (2) water yield as an

31
indicator of flooding regulation, as well as one provisioning service, (3) timber volume,
as an indicator of timber production. The objectives were to determine the effects of
urbanization on these three ecosystem services (carbon storage, timber volume, and
water yield) in the Lower Suwannee River and Pensacola Bay watersheds in
Northwestern Florida, respectively. This specific study aim was to quantify three key ES
in a current and a modeled urbanized scenario using the InVEST model, the U.S.
Department of Agriculture (USDA) Forest Inventory and Analysis (FIA) field data, and
an urbanization land cover map for 2060 using the population distribution map produced
by the GeoPlan Center at the University of Florida. The hypothesis tested was that
urbanization directly affects carbon storage, timber volume, and water yield; carbon
storage and timber volume are negatively correlated with urbanization and water yield is
positively correlated. This quantification of ecosystem services can then contribute to
the valuation of ecosystems, as well as to understanding the magnitude of urban
development on ES in subtropical Florida, thus promoting better understanding by
landowners, urban planners and policy makers and for better assessments of ES
values.
Methods
Study Areas
The Lower Suwannee River and the Pensacola Bay watersheds in the State of
Florida were selected for this study. The Lower Suwannee River watershed is located in
Northeastern Florida and the Pensacola Bay in Northwestern Florida (Figure 2-1).
These two watersheds are different in terms of land use/cover characteristics with the
Lower Suwannee River watershed being more forested and the Pensacola Bay being
more urbanized (Table 2-1).

32
The Lower Suwannee watershed consists of an area of 408,828 ha, and is one of
five watersheds that comprise the Suwannee River watershed (Katz et al., 1997). The
Lower Suwannee watershed is roughly centered at 29° 51’ 34” North and 83° 0’ 22”
West and eight counties are within the watershed boundary: Columbia, Dixie, Gilchrist,
Lafayette, Levy, Madison, Suwannee, and Taylor. This watershed was chosen for the
analysis due to its hydrological nature as it comprises much of the Upper Floridian
aquifer springs and the highest concentration in the world of first magnitude springs
(Obreza and Means, 2006). The Suwannee River is the second largest river in Florida in
terms of average discharge (Light et al., 2002). Several studies have been done in the
Lower Suwannee, because in the past years the main threat to this area is the transition
from natural ecosystems to more intense land-use practices (Martin, 2007). This area is
defined by Obreza & Means (2006) as an area with unique biota and water resources
that need to be protected.
The Suwannee watershed area is characterized by the presence of karst features,
wetlands, lowland topography, and a small number of tributary streams (Katz et al.,
1997). Interactions between groundwater and surface water occur within the Suwannee
River watershed due to the presence of karst features. Five different ecological
subsections are within its boundaries: 232Jf, 232Bj, 232Ka, 232Lc, and 232Db (Table 2-
2). The land cover type in the watershed is predominantly forest, agriculture, and
wetlands (Katz et al., 1997). The Lower Suwannee River watershed is divided into 63
sub-watersheds. The watershed has subtropical climate with warm summers and
moderate winters (Katz et al., 1997). The average precipitation in the watershed is
1,270 mm per year (Obreza and Means, 2006).

33
The Pensacola Bay watershed comprises an area of 140,825 ha and is part of the
Pensacola Bay system that is composed by five watersheds(Schwenning et al., 2007).
The watershed is roughly centered at 30° 25’ 43” North and 86° 59’ 29” West. The
counties of Escambia, Okaloosa, and Santa Rosa are within the watershed boundaries.
This watershed includes the Pensacola Bay estuary and parts of four major rivers:
Escambia, Blackwater, Shoal and Yellow Rivers, and some small tributaries (Florida
Department of Environmental Protection, 2007; Thorpe et al., 1997). The watershed
was chosen because of its difference land cover characteristics compared to the Lower
Suwannee River watershed. The Pensacola Bay watershed is more urbanized than the
Lower Suwannee with around 30% of its area covered by urban areas. Three different
ecological subsections are within its boundaries: 232Bj, 232Bg, and 232Lb (Table 2-2).
The Pensacola Bay system has unique features such as its morphology and the
hydrodynamics that are considered key points for the natural ecosystems (Hays, 2009).
However, over the last decades it was impacted by human activities such as habitat
alteration, urban development, and point and non-point source pollution (Thorpe et al.,
1997) such as industrial and domestic waste and non-point sources from urban,
suburban, and agricultural areas (Thorpe et al., 1997; U.S. Environmental Protection
Agency, 2004).
The most pollution in the watershed occurs around urban areas (Thorpe et al.,
1997). Natural ecosystems such as wetlands and aquatic habitats have been affected
by deposition and sedimentation (Thorpe et al., 1997), as well as through conversion
and fragmentation (Northwest Florida Water Management District, 2006). Another threat
to the watershed are hurricanes, which occur approximately every 5 to 10 years (NOAA-

34
National Hurricane Center, 2012a). The Pensacola Bay watershed has humid
subtropical weather with warm temperatures. The annual precipitation ranges from 730
to 2,280 mm (Hays, 2009) with an average of 1,625 mm (Thorpe et al., 1997).
Quantification of Ecosystem Services
Carbon storage
Carbon storage was analyzed using two data sets: the USDA Forest Inventory and
Analysis (FIA) data and the Florida Vegetation and Land Cover 2003 (Florida Fish and
Wildlife Conservation Commission, 2004) in addition to modeled urbanized land cover
for the year 2060 (Zwick and Carr, 2006). Zheng et al. (2012) mentioned that the
combination of field data (e.g. FIA) and remote sensing products (e.g. land cover maps)
are necessary to improve carbon estimations accuracy. The InVEST model, developed
for the Natural Capital Project (Natural Capital Project, 2011), was used for analyzing
the amount of carbon storage in the 2003-land cover and the 2060-urbanized land
cover. These datasets were used as input data for the model, which estimates carbon
storage in Mega grams (Mg) per hectare (ha) for each land cover.
Forest Inventory and Analysis Program data
The U.S. Department of Agriculture (USDA) Forest Service Inventory and Analysis
(FIA) program data was used for analyzing forest carbon storage. The FIA characterizes
forest lands in all the U.S States including forest data and characteristics, such as
extent, condition, and volume. The FIA Program started in 1929 with periodic forest
inventories of nation-wide network of plots in all U.S. States. Since 1999, those
inventories are conducted annually (Jenkins et al., 2003; Woudenberg et al., 2010). The
plot-level information is based on the individual tree measurement.

35
One limitation with the FIA data is that exact geographic coordinates (latitude and
longitude) of the plots are not provided because of the “Privacy provision” enacted by
Congress in the Food Security Act of 1985 to ensure private landowners’ privacy and
plot integrity. However, the location of the plots is within a buffer of approximately 1 mile
or ½ mile from their true position. Moreover, 20% of the plots are swapped, which
means that some private plots are exchanged with other similar private plot in the same
county (Woudenberg et al., 2010). This situation creates an uncertainty when plots need
to be overlaid with other GIS data. Sabor et al. (2007) found that the potential error of
using the altered location of the plots in combination with other layers, for example for a
30 meters by 30 meter raster layer, results in plot misclassification that ranged from
32% to 66%. However, different approaches, based on other FIA attributes, can be
applied to better approximate true plot location. For example, only the 1-10 % of plots
are misclassified when analyzing for ecological subsection data (Sabor et al., 2007). As
such, including the ecological subsection strata, FIA survey unit and County attributes
can better help specify the true location of plots. For example in the case of county, only
the plots located within a specific county can be extracted from the FIA database (i.e.
Tree table or Condition table).
Carbon pools analysis
As mentioned before, carbon storage analyses were performed based on the
different forest types according to the 2003 Florida Vegetation and Land cover map
produced by the Florida Fish and Wildlife Conservation Commission (Florida Fish and
Wildlife Conservation Commission, 2004). This map was developed based on Landsat
Enhanced Thematic Mapper satellite imagery with a 30 meter spatial resolution and
detailed distinction between different ecosystems. It contains 43 classes of vegetation

36
and land cover, 26 being natural and semi-natural vegetation types, 16 types of
disturbed lands (e.g., agriculture and urban), and a single water class (Stys et al.,
2004). For the carbon pool analysis, 11 forest cover classes were analyzed. The
classes are shown in Table 2-1, as well as the presence or absence in each watershed.
To deal with the problem of the true FIA plot location, a different approach was
developed to try to approximate the carbon values for the different types of forests.
Some attributes available at the FIA database were considered, specifically the FIA
Survey Unit, ecological subsection, county, condition status, and stand age (Figure 2-2).
The description of each attribute is shown in Table 2-3. The original 11vegetation
classes in the map were reclassified using ArcGIS® Spatial Analyst (ESRI, 2011a) to
add new values to the raster file. New classes were created using the FIA attributes:
Ecological subsection (U.S.D.A Forest Service, ECOMAP Team, 2007) and County.
Both vector files were converted to raster format and combined using ArcGIS® Spatial
Analyst. The result was one raster file showing the unique combination of classes for
each forest ecosystem, ecological subsection and county (Figure 2-3). Once forest
ecosystems were identified for each watershed, the main forest tree species for each of
them were identified based on vegetation descriptions prepared by Gilbert and Stys
(2004) that contains the list of forest tree species observed in each forest ecosystem.
Then, the forest tree species found in the FIA database were considered and the
species codes were identified (Table 2-4).
The four carbon pools, measured in metric tons per hectare, were aboveground
biomass, belowground biomass, soil organic matter and dead biomass (Tallis et al.,
2011). Carbon aboveground biomass refers to all living materials above the soil (e.g.

37
bark, leaves, trunks), belowground biomass corresponds to the living root systems of
the aboveground biomass, soil organic matter comprises the organic component of the
soil, and dead biomass includes the litter, and downed and standing dead wood (Tallis
et al., 2011). Table 2-5 shows the FIA attributes used for each carbon pool calculation.
The FIA data corresponding to cycle 8 (2002-2007) were used in the analysis as they
correspond to the 2003 land cover classification. To extract the carbon aboveground
and belowground from the FIA data, the Tree table was used (Woudenberg et al.,
2010), which contained individual tree information. A tree expansion factor, which can
be found in the Tpa_unadj attribute in the Tree table was used. The expansion factor
was used to scale each tree on a plot to a per-acre basis, considering the number of
trees per acre (TPA) (Woudenberg et al., 2010). Per tree values for aboveground and
belowground carbon were multiplied by the corresponding Tpa_unadj to get the plot-
level information in pounds per acre.
Using the Pivot table function in Microsoft Excel® (Microsoft, 2010), these values
were summed by plot (PLT_CN) considering specie code (SPCD), FIA survey unit
(UNITCD), ecological subsection (ECOSUBCD), county (COUNTYCD), condition status
(COND_STATUS_CD), and stand age (STDAGE). The carbon value calculated was the
total carbon aboveground and belowground for each plot. The total values were
converted to tons per hectare then; the average was calculated using these plot values
to get the value for each species, considering the ecological subsection and county.
Only plots with the condition status defined as “forest land” and with a stand age
ranging from 1 to 72 years were considered in the analysis. Based on a previous study
where the exact locations of the FIA plots were obtained for the Forest Stewardship

38
Properties located in the State of Florida (Abd-Elrahman et al., 2012), the range of
stand ages were extracted. To assign the carbon values to a raster file (i.e. reclassified
land cover) from the FIA plot locations, the forest type were identified in both datasets,
so the carbon values in the FIA data for one specific forest type, one ecological
subsection, and one county were assigned to the each forest ecosystem in the raster
file that corresponded to the same attributes (i.e. ecological subsection and county).
The final carbon above and belowground for each forest ecosystem was the result of
the sum of all the species within that land cover type. No timber harvest effects were
considered in the analysis.
For the downed dead, standing dead, soil, understory aboveground, understory
belowground, and litter carbon the approach used was similar to the approach
described above. Since these C values are in the FIA Condition table that provides plot-
level information, the forest type attribute was used. The values for these carbon pools
are by plot and presented in tons per acre, which were then converted to tons per
hectare. Once all carbon values were calculated from the FIA data, the different values
were aggregated into the four pools (Table 2-5). In table 2-6 the resulting carbon pool
for the Pensacola Bay watershed are presented. The carbon pools for the urbanized
2060 scenario were estimated based on the assumption that the forest carbon pool in
2060 will be 5 percent less when compared to the pool in 2010 (Huggett et al., 2002).
Several authors refer to the uncertainty in the forest carbon projections, so this 5%
assumption was made (Heath and Smith, 2000; Huggett et al., 2002; Moore et al.,
2002).

39
InVEST carbon storage model
The InVEST carbon storage model summed the amount of carbon stored in the
four aforementioned pools based on the land cover map (Tallis et al., 2011). The carbon
values were estimated for each pixel considering the previously mentioned land cover
types. Model output is the total carbon storage, which sums the four pools. Intermediate
results are the carbon aboveground, belowground, dead, and soil (Tallis et al., 2011).
Model output is expressed in Mg of carbon per pixel units and then converted to Mg per
hectare. A flow chart illustrating the carbon estimation approach is shown in Figure 2-4.
Timber volume
The approach used for analyzing timber production is similar to the one used for
the carbon estimation. The timber volume and the timber in the sawlog portion were
calculated and are basically the potential timber available for harvesting. Timber volume
was processed using FIA survey unit, ecological subsection, and county. Only the
condition status defined as forest land and the stand age ranging from 1 to 72 years
were considered in the analysis. From the Tree table, two attributes were analyzed: the
net volume (volnet) and the net volume in the saw-log portion (volsaw). These attributes
contain tree-level information, so the expansion factor was used to convert to plot-level
data in cubic feet per acre. The final results were converted to cubic meter per hectare
and volume values were assigned to individual pixels in the map. Figure 2-4 presents
the timber estimation process flow chart adopted in this study. For the timber volume
projections for 2060, the volume values presented in Prestemon and Abt (2002b) based
on the Subregional Timber Supply Model (SRTS) of Abt et al. (2000) were used. An
average per-year increase in timber volume was used to determine the timber volume
for the year 2060.

40
Water yield estimation
The InVEST water purification model estimates the annual average runoff (water
yield) or the effect of land cover type on the annual water yield (Tallis et al., 2011). The
model was used to estimate the water yield from each pixel in the form of precipitation
minus the evapotranspiration fraction. The model sums the pixel water yield information
to get the sub-watershed level value, and then the sub-watershed values are summed
to get the watershed level value (Tallis et al., 2011). The model is for surface water and
does not account for groundwater (Mendoza et al., 2011). However, there is no
differentiation between surface, subsurface and baseflow water in the InVEST model
(Tallis et al., 2011). According to Zektser and Loaiciga (1993), groundwater comprises
on average 30% of the stream flow around the world and in some areas can reach up to
90% (Winter, 1999). Therefore, in areas where groundwater is influential, the InVEST
model can produce low water yield values when compared to observed stream flow
levels (Mendoza et al., 2011). Figure 2-5 shows the conceptual framework of the model.
This model is based on the Budyko curve and annual average precipitation (Tallis
et al., 2011). The Budyko curve describes the relationship between precipitation and
actual and potential evapotranspiration (Mendoza et al., 2011) . This approach for
calculating the evapotranspiration depends on water availability (i.e. precipitation) and
atmospheric demand (i.e. potential evapotranspiration (Mendoza et al., 2011; Zhang et
al., 1999; Zhang et al., 2001). The annual water yield is estimated based on
precipitation and actual evapotranspiration. The model analyzes each pixel considering
each land cover; Equation 2-1 shows the calculation.
∑ (
) (2-1)

41
where Yxj is the annual water yield, AETxj is the annual actual evapotranspiration on
pixel x with LULC j and Pxj is the annual precipitation in pixel x with LULC j, and Axj is
the area of x in LULC j.
The evapotranspiration partition of the water balance is also calculated. This is an
approximation of the Budyko curve presented by Zhang et al. (2001) who defined this
equation by using potential evapotranspiration and plant available water content. The
maximum difference in this ratio (AET/P) corresponds to forest cover areas, and in this
case trees will use more soil water storage (Zhang et al., 2001) and is described as:
(2-2)
where Rxj is the ratio of potential evapotranspiration to precipitation, named the Budyko
dryness ratio and wxj is a modified dimensionless ratio of plant accessible water storage
to expected precipitation during the year (Mendoza et al., 2011). Therefore, wxj is given
by Equation 2-3:
(
) (2-3)
where AWCx is the volumetric (mm) plant available water content, Z is the seasonality
factor showing the rainfall distribution (Mendoza et al., 2011).Finally, the ratio of
potential evapotranspiration to precipitation (Rxj) is calculated by
(2-4)
where ETox that is the reference evapotranspiration from pixel x and kxj is the
evapotranspiration coefficient associated with LULCj on pixel x.

42
Water model input data process
The input parameters for the InVEST water yield model are summarized in Table
2-7, as well as parameter descriptions, units of measure, and data sources. The
process to get the data for each of the inputs needed for the water yield model is
described in the next section, as well as the data source.
Precipitation. Annual precipitation data for the years 1998-2008, were obtained
from the PRISM Climate Group (formerly SCAS) at Oregon State University and an
average precipitation was calculated using the 10 year values. For the year 2060
precipitation data, the projections of Coulson et al. (2010) based on the Australian
Commonwealth Scientific and Industrial Research Organization-CSIRO Mk3 Climate
System, were used. The CSIRO Mk3 climate model is a representation of the
components of the climate system: atmosphere, land surface, oceans, and sea-ice with
the main objective of investigating the climate system to be able to develop predictions
(Gordon, 2002). Average values for the years 2055-2065 were used.
Soil depth. The source data was the U.S. General Soil Map (State Soil
Geographic-Statsgo2) developed by the USDA Natural Resources Conservation
Service. The Soil Data Viewer1 tool was used to produce the soil thematic maps. The
tool generated spatial information directly in a vector format that was converted to raster
format for use in the model. The maximum soil depth and water table depth were
generated using this tool and the final input is the combination of these two data sets.
Average annual potential evapotranspiration (PET). The original data
(organized by county in an ASCII format with 2 km spatial resolution) was obtained from
1 Soil Data Viewer is a tool built as an extension to ArcMap that allows a user to create soil-based thematic maps

43
U. S. Geological Survey's Florida Integrated Science Center (U.S.Geological Survey,
Florida Water Science Center, 2008) and converted to raster format. Preparing the PET
data involved the following steps: (a) getting the annual data for each cell (original data
is daily) for the years 1998-2008, (b) converting tabular data to spatial data using the
latitude and longitude coordinates of each data point, and (c) converting point data to a
raster format using the Inverse Distance Weighting (IDW) interpolation method. The
IDW interpolation used a weight to determine cell values, this weight is a function of
inverse distance, and so closer data points exert more influence than farther data points
(ESRI, 2012a). The annual raster layers were averaged to get the average annual
potential evaporation layer. For the 2060 PET, the projections of Coulson et al. (2010)
based on the CSIRO model were used. An average value for the years 2055-2065 was
used.
Plant available water content. The InVEST model requires a GIS raster dataset
with a plant available water content value for each cell. The source data is the General
Soil Map-STATSGO2 obtained from the USDA-NRCS. The Soil Data Viewer tool was
used to get the vector data set, which was converted to raster format and used in the
model.
Maximum root depth. Values for vegetated land cover types, except for wetlands
and grasslands species were collected from Canadell et al. (1996). To assign maximum
root depth values to each land use/land cover type the main species for each land cover
were identified. For the non-vegetative land use/land cover classes such as, urban,
extractive and Sand/Beach, a value of 1 was assigned as suggested by Tallis et al.
(2011).

44
Zhang constant. This is a factor used to characterize the seasonality of
precipitation in an area (Tallis et al., 2011). The Lower Suwannee River and Pensacola
Bay watersheds are located in a subtropical ecoregion, where most rainfall occurs
during the summer months similar to tropical ecoregions. According to Tallis et al.
(2011), the value for tropical or sub-tropical watersheds was 4; hence this value was
used.
Evapotranspiration coefficient. This coefficient is needed when the reference
evapotranspiration is used in the model; however if the PET is used, this coefficient is
not required (Eq. 2.4), thus a value of 1 was assigned to all land cover types.
InVEST water model assessment
An assessment of the water yield model was done based on the comparison of the
average annual water yield from the model and the average annual streamflow data
from the Gopher River gage station (Site 02323592) located at a downstream point in
the watershed. A 10 year average value should be used for the stream flow data (Tallis
et al., 2011). However, the streamflow data found at the U.S. Geological Service
(USGS) National Water Information System (NWIS) (http://waterdata.usgs.gov/nwis/),
had information for the period 2000 to 2008. NWIS has information about the stream
discharge for 8 sites along the Suwannee River (Nielsen and Norris, 2007). The
assessment was done only for the Lower Suwannee River watershed.
2060 land use and land cover map
The 2060 urbanization scenario -land use and land cover map was developed
based on the 2003-Florida Vegetation and Land Use map and the 2060-Florida
population distribution scenario (Zwick and Carr, 2006). The population distribution map
for 2060 is based on the population projections from the Bureau of Economic and

45
Business Research (BEBR) and GIS suitability analysis (Zwick and Carr, 2006). Based
on population projections, the amount of people that need to be allocated can be
identified, as well as the land area in hectares.
The Florida 2060 map was developed by combining spatial data to model land-use
suitability considering conservation (forest), urban and agricultural lands. Three main
concepts were considered in the analysis: suitability, preference, and conflict mapping
(Carr and Zwick, 2007). Suitability refers to the fitness of one specific use (e.g.
conservation, urban, and agricultural lands) in an area. Preference reflects the opinion
of the community, in other words, what the community wants. Conflictive areas are the
ones that cannot be urbanized for several reasons (e.g. forest conservation lands) (Carr
and Zwick, 2007). Based on these three concepts the most suitable areas for urban
development were identified by Zwick and Carr (2006). The final output was a raster file
with the predicted urban areas for 2060. The 2060-Population distribution map was
combined with the 2003-Florida vegetation map to update and produce the 2060
urbanization scenario-Land cover map using ArcGIS® Spatial Analyst. For the carbon
and timber model, the 2060-Florida vegetation map was used; this was the result of the
extraction of the forest covers from the 2060-Florida vegetation and land use. This
raster was combined with the ecological subsection and county layers. However, for the
water yield model all land cover types were considered in the analysis.
Statistical differences between the 2003 and the 2060 urbanization map at the
sub-watershed level were determined using a two tail t-test with two paired samples for
means at 95% confidence level. A Pearson correlation coefficient was calculated
between carbon storage, timber volume, and water yield, as well as between each of

46
them and the amount of forest areas. The analyses were done at the sub-watershed
level and Microsoft Excel® (Microsoft, 2010) was used for both calculations.
Results
Carbon Storage in 2003 and Urbanized 2060
In 2003, the total carbon storage in the Lower Suwannee River watershed was
36,586,750 Mg. The total carbon storage ranged from 72 to 342 Mg/ha with an average
of 196 Mg/ha. However, in 2060, the total carbon storage was 30,638,160 Mg with a
minimum and maximum value of 69 and 326 Mg/ha, respectively. The average total
carbon for the watershed was 187 Mg/ha (Table 2-8). A reduction of 5,948,590 Mg of
total carbon (19%) occurred due to urbanization. The highest carbon values in 2003-
2060 correspond to the soil and aboveground pools (Table 2-9). In 2003, the total
carbon aboveground was 10,193,638 Mg with an average value of 55 Mg/ha. In 2060,
the total aboveground carbon was 8,467,580 Mg with an average of 52 Mg/ha. The
highest average values of total carbon were concentrated in the northern part of the
watershed (Table 2-9 and Figure 2-6), which corresponded to the mixed wetland forest
and hardwood swamp in the Gulf Coastal Lowlands (232Db) and Florida Northern
Highlands (232Ka) ecological subsections, respectively. The lowest value corresponded
to the sandhill ecological subsection 232Ka.
There was a reduction in the mean carbon value due to urbanization across all 63
sub-watersheds that ranged from 4 to 26 Mg/ha. The largest difference was observed in
the Waccasassa Slough sub-watershed (Id 49), where the mean carbon storage in 2003
was 183 Mg/ha, and in 2060 this value decreased to 156 Mg/ha with a reduction of 26
Mg/ha. In this sub-watershed there was a decrease in forest area of 14% and an
increase of 40% in urban areas. The largest changes were observed in the hardwood

47
hammock forests and the pinelands. The smallest difference was observed in the sub-
watershed id 39 (Rock Bluff Spring), which had a forest area reduction of 7% and an
increase of 18% in urban areas (Figures 2-6, 2-8). Differences in mean total carbon
storage between sub-watersheds for the period 2003 and 2060 were statistically
significant at 95% confidence level (Table 2-9).
In the Pensacola Bay in 2003, the total carbon storage in forest was 7,998,265 Mg
with an average of 148 Mg/ha, with 66 and 229 Mg/ha as minimum and maximum
values (Figure 2-7). However, in 2060, the total carbon storage decreased to 5,866,804
Mg with a minimum and maximum value of 64 and 218 Mg/ha, respectively. The
average total carbon for the watershed was 137 Mg/ha. The forest area was reduced by
11,212 ha, with a resulting reduction of 2,131,461 Mg of total carbon (Table 2-8). The
carbon aboveground in the watershed was 1,396,430 Mg, representing the 17% of the
total carbon storage in the Pensacola Bay watershed (Table 2-9); however, in 2060 this
value was 1,015,730 Mg. The highest total carbon was observed in the Bay Swamp
within the ecological subsection denominated 232Bg. The lowest value was for the
Hardwood Hammocks and Forest in the ecological subsection named Florida Gulf
Coast Flatwoods (232Lb).
At the sub-watershed level in the Pensacola Bay watershed, there was a reduction
in the mean total carbon in the 15 sub-watersheds from 3 to 18 Mg/ha. The largest
difference was observed in the Fundy Bayou-Williams Creek Frontal sub-watershed (Id
11), where the mean carbon was 162 Mg/ha in 2003 and 144 Mg/ha in 2060 with a
reduction of 18 Mg/ha. Regarding the land use change in this sub-watershed, the forest
area was reduced by 34% and the urban area increased by 36%. The largest changes

48
were found the Pineland areas (Figures 2-9, 2-10). A t-test using two paired samples for
means was conducted to find differences in mean total carbon between sub-watersheds
due to urbanization and differences were significant at 95% confidence level (Table 2-
9).
Timber Volume in 2003 and Urbanized 2060
The average timber net volume (volnet) for the Lower Suwannee in 2003 was 109
m3/ha and a total timber net volume of 20,402,395 m3 approximately over an area of
186,275 ha of forest. However, for 2060, the average timber net volume was 110 m3/ha
within an area of 163,692 ha, giving an approximate total net volume 18,100,416.54 m3.
Therefore, the urbanization in the Lower Suwannee watershed produced a decrease of
2,301,978.47 m3 in the timber net volume, as a result of the loss of 22,583 ha of forest;
this despite of an increase in timber volume of 1.72% (Prestemon and Abt, 2002b). The
timber volume in the sawlog portion, in 2003 was 15,477,193.37 m3 with an average of
83 m3/ha.
However, in 2060, the timber volume in the sawlog portion was 13,540,937.07 m3
with an average of 83 m3/ha and a reduction of 1,936,256.24 m3 of timber in the sawlog
portion (Table 2-10). Higher values were observed in the 2003 compared to 2060. The
highest timber net volume corresponded to the northeast part of the watershed and to
the Pinelands located in the Florida Northern Highlands (232Ka) ecological subsection.
At the sub-watershed level in 2003 the largest decrease (17%) in mean timber net
volume was for the Waccasassa Slough sub-watershed (Id 49). This sub-watershed had
a decrease in forest area of 14% and an increase in urban areas of 40%. A t-test using
two paired samples for means was conducted to find that differences between the mean

49
timber net volume in 2003 and 2060 were statistically significant at 95% confidence
level (Table 2-10).
For Pensacola Bay, the average timber net volume in 2003 was 69 m3/ha in an
area of 54,381 ha and total timber net volume was approximately 3,730,642 m3.
However, for the year 2060, there was a reduction of 11,514 ha of forest that produced
a decrease of 800,909 m3 of timber net volume. For sawlog timber volume, in 2003 the
volume was approximately 2,980,362.85 m3 with an average of 68.344 m3/ha. However,
in 2060, the sawlog timber volume was approximately 2,309,369 m3 (Table 2-10). The
highest timber net volume corresponded to the Pinelands located in the ecological
subsection named Florida Gulf Coast Flatwoods (232Lb). At the sub-watershed level, in
2060 there was a decrease in the mean timber net volume in 13 out of 15 sub-
watersheds. The largest difference (6 m3/ha) in the mean timber net volume was
observed in the Williams Creek-Oriole Beach Frontal sub-watershed (Id 11). In this sub-
watershed there was a decrease of 34% of forest and an increase of 36% of urban
areas. The t-tests showed statistically significant differences between sub-watersheds
for 2003 and 2060 at 95% confidence level (Table 2-10).
Water Yield in 2003 and Urbanized 2060
Mean annual water yield for the Lower Suwannee River watershed in 2003 was
1,293 mm and water yield volume of 12,932 m3/ha. However, in 2060, the mean
precipitation and PET as was mean annual water yield (1,342 mm) (Table 2-11) and
volume (13,422 m3/ha) were greater than 2003. The highest values of water yield were
located in the south part of the watershed and lowest values were located in the north
part of the watershed, where most of the forest areas are located.

50
At the sub-watershed level, there were increases in water yield, precipitation, and
PET for the Lower Suwanee’s water yield in 2060. The largest difference in mean
annual water yield between 2003 and 2060 was observed in the Barnett Creek sub-
watershed (Id 1), where there was an increase of 152 mm/year and the largest increase
in precipitation in 2060 but no changes in land use/cover. In the 63 sub-watersheds
there was more water yield per hectare in 2060 (Figure 2-8). The t-test showed that the
differences in water yield volume were statistically significant at 95% confidence level
(Table 2-11).
In 2003 the Pensacola Bay the annual water yield was 1,520 mm and the average
water yield per hectare was 15,319 m3. However, in 2060 the precipitation and PET
were higher as were annual water yield at 1,578 mm and water yield per hectare at
15,776 m3. At the sub-watershed level, the largest increase in mean annual water yield
was observed in the Bayou Cico-Bayou Garcon Frontal sub-watershed (id 15) that
registered the largest increase in precipitation in 2060 and there is a high positive
correlation (r=0.969) between the difference in annual water yield and difference in
precipitation (Figure 2-9). There was also a decrease in the forest area and an increase
in the urban areas. The t-test showed statistically differences in the water yield volume
between sub-watersheds for 2003 and 2060 at 95% confidence level (Table 2-11).
Water Yield Assessment for the Lower Suwannee River Watershed
Results show that there were differences between the average water volume from
the Gopher gage station and the average water yield estimated from the model. The
average value from the model was 5,184,553,019 m3 and the average from the gage
station was higher 6,722,705,162 m3 (Table 2-12). However, when the values were

51
normalized, the trends between both curves (i.e. modeled and measured water yield)
were similar (Figure 2-10).
Tradeoffs Between Carbon Storage, Timber Volume, Water Yield, and Urbanization
Tradeoffs were evident between carbon storage, timber volume and water yield in
both watersheds. In the 2060 urbanized scenario, carbon storage and timber volume
were lower than the 2003; however, water yield was higher in 2060 (Figure 2-11). Also,
a positive correlation was observed between carbon storage and timber volume, and a
negative correlation with water yield (Table 2-13). Because the loss of forest areas in
this study is the result of urbanization, it can thus be surmised that carbon storage and
timber volume decrease when urban areas increase. However, water yield increase
when forest areas decrease or urban areas increase, but the correlation was weakly
negative (Table 2-13).
Discussion
The study hypothesis was accepted, thus urbanization, ignoring the ecosystem
service provision in urban areas, directly affects carbon storage, timber volume, and
water yield. Carbon storage and timber volume were high negatively correlated to
urbanization in both watersheds and water yield was high positively correlated in the
Lower Suwannee watershed and weak positively correlated in the Pensacola Bay
watershed. Results showed that urbanization will convert forest areas by the year 2060,
and this will result into the decrease of the provision of carbon storage and timber
volume, and into an increase in water yield that will statistically be significant differences
at 95% confidence level.

52
Carbon Storage in 2003 and Urbanized 2060
Aboveground and soil carbon accounted for about 50-80% of the total carbon
storage in both watersheds (Table 2-9) and store the largest amount of carbon in forests
(Huggett et al., 2002; Lal, 2005; Moore et al., 2002). The mean total carbon storage for
the Lower Suwannee and Pensacola Bay watershed were 196 and 148 Mg/ha
respectively for the year 2003 (Table 2-8). These values were within the range reported
by Heath et al. (2011) for forest areas in the United States, where the mean was 162
Mg of carbon per ha, and ranged from 150 Mg/ha to 192 Mg/ha. According to Timilsina
et al. (2011) carbon pools average for Florida forests were 165 Mg of carbon per ha in
cold spots (i.e. clusters of lower carbon storage values) and 177 Mg of carbon per ha in
hot spots (i.e. clusters of higher carbon storage values). Lal (2005) mentioned an
average of 60-130 Mg C/ha in temperate forests and 120-194 Mg of carbon per ha in
tropical forests. However, carbon storage decreased by 16% and 26% in the 2060 land
use scenario in the Lower Suwannee and Pensacola Bay watersheds, respectively.
Escobedo et al. (2009a) presented a comparison of average carbon storage by
urban forests in Florida that ranged from 9.3 Mg per hectare in Miami-Dade County,
27.4 Mg per hectare in Southern Escambia County, and 30.8 Mg per hectare in
Gainesville. Using this study's 2003 average forest carbon storage values and average
carbon storage for Southern Escambia's urban forests (Escobedo et al., 2009a), the
total carbon storage for the Pensacola Bay watershed will be about 175.4 Mg/ha.
Therefore, the amount of carbon stored in the Pensacola Bay watershed 's urban
forests is about 16% of the total carbon storage (i.e. 175.4 Mg/ha). Using the former
total carbon storage value that includes both urban and natural forests, total carbon
storage in the urbanized 2060 scenario in Pensacola Bay watershed decreased 26%

53
when compared to the 2003 total carbon storage. So, even if carbon stored in urban
forests were included in this analysis; there would still be an overall decrease in total
carbon storage in the Pensacola Bay watershed from 2003 to 2060.
This reduction in C storage was a combination of the increased urbanization as
well as the 5% reduction in the carbon pools considered in the analysis for 2060. Since
the decreases in both study areas were greater than 5%, urbanization and not the
assumed 5% carbon reduction loss, was the main driver for this decrease. In Pensacola
Bay, the forest area losses due to urbanization were 21%, and corroborates studies that
show that land use change as an important driver affecting carbon storage and
sequestration in ecosystems (Birdsey et al., 2006; Moore et al., 2002; Reyers et al.,
2009), as well as diseases, pests, hurricanes, and fires (McNulty, 2002). Also
urbanization is the dominant land use change that affects southern forests (Conner and
Sheffield, 2006; Nowak et al., 2005; Wear and Greis, 2002b) and Wear and Greis
(2002a) mentioned that 30-43 million acres of land are likely to be converted to urban
land uses by 2060 in the Southern United States.
At the sub-watershed level, both watersheds showed reductions of carbon storage
and the largest differences between 2003 and 2060 were observed in sub-watersheds
where forest ecosystems have decreased and urban areas increased. This indicates
that urbanization generates forest losses and carbon emissions (Wear and Greis,
2002b). Huggett et al. (2002) developed some scenarios assuming high and low
urbanization and the highest amount of carbon storage in 2060 was for the low-
urbanization scenario, and the lowest carbon storage was for the high urbanization
scenario. This study’s two watersheds were very different in terms of distribution of land

54
cover in the year 2003 since Pensacola Bay was more urbanized than Lower Suwannee
(30% and 6%) (Table 2-1), therefore the percentage of carbon storage in the Pensacola
Bay was lower because of a higher percentage of urbanization, and was thus the most
impacted watershed in 2060.
Timber Volume in 2003 and Urbanized 2060
The Lower Suwannee had 11% less timber volume in 2060 compared to 2003;
however, the Pensacola Bay had a larger decrease (21%) (Table 2-10). As mentioned
before, the Pensacola Bay is more impacted by urbanization. The same situation
applied to the timber in the sawlog portion. At the sub-watershed level, both watersheds
reported the largest changes between 2003 and 2060 in areas where the forest area
has been decrease and urban area has been increased. Two main factors are
considered important in terms of forest loss: urbanization and timber prices, because
the first one comprises land use change and the second one can increase levels of
timber harvest (Huggett et al., 2002). According to Conner & Hartsell (2002), Florida has
lost most of the forest areas due to urbanization; however, timber prices are projected to
increase. Hodges et al. (1998) found that the forest area was reduced by urbanization
by 25% compared to this study’s 12% and 21% in the Lower Suwannee and Pensacola
Bay watersheds respectively (Table 2-10). Munn et al. (2002) mentioned that
urbanization affects timber harvesting possibilities because of the decrease in the forest
area.
Water Yield in 2003 and Urbanized 2060
In both watersheds the water yield was higher in 2060; as well as the precipitation
and potential evapotranspiration. Based on data produced by the CSIRO Mk3 model
precipitation and evapotranspiration will increase in the next years and according to

55
several studies (Alvarez et al., 2001; Florida Oceans and Coastal Council, 2009;
Furniss et al.). Increase in water yield is due to two main factors: increase in
precipitation, the primary driver of water yield (Dymond et al., 2012; Sun et al., 2005)
and changes in land use/cover. A high correlation factor (0.9) between precipitation and
water yield can be observed. In the case of changes in land use/cover, many studies
proved that water yield is lower in forested areas (Bosch and Hewlett, 1982; Dymond et
al., 2012; Hibbert, 1965). Bosch & Hewlett (1982) found that forests decrease water
yield, for example for deciduous hardwoods and coniferous there is a 25 mm and 40
mm change in water yield respectively per 10% change in cover. This value was close
to the one obtained in this study; in the Lower Suwannee there was a 12% change in
cover and a 49 mm change in water yield. However, in the Pensacola Bay there was a
21% change in forest cover and a 57 mm change in water yield. However, Swank et al.
(2001) identified a 28% increase in water yield after forest harvesting due to reduction in
total ecosystem evapotranspiration and the increase in runoff. Even, Dymond et al.
(2012) mentioned that there is a reduction between 30%-50% in the water yield
because of new forest areas. Since water yield is highly influenced by precipitation, the
percentage of increase will depend on the characteristics of the site. Swank et al. (2001)
did the study in western North Carolina where annual precipitation ranges from 1,700
mm to 2,500 mm. In many sub-watersheds, the increase in water yield was the result of
the increase in precipitation, decrease in potential evapotranspiration, and decrease in
forest areas (Dymond et al., 2012).
Water Yield Assessment
The differences in absolute values for the InVEST model and the gauging station
were large in most analyzed years (Table 2-12). These differences could be related to

56
the groundwater discharge, according to Katz et al. (1997) this watershed is
characterized by the presence of karst features that enable the interaction between the
groundwater and surface water. Therefore, groundwater is an important component in
this watershed; however the InVEST model does not account for it. This situation can
be considered a problem in the case where absolute values are important for example if
the water will be used for irrigation, so in this case the model should be calibrated.
Tradeoffs Between Carbon Storage, Timber Volume, Water Yield, and Urbanization
Tradeoffs arise when the increase in use of one ecosystem service can decrease
the use of another service (Rodriguez et al., 2006). Therefore, when forests are
managed for increased carbon storage, tradeoffs can arise as seen in the two studied
watersheds. Carbon storage and timber volume were highly positive correlated (Table
2-13), so the increase in carbon storage results in an increase in timber volume (Figure
2-11). However if timber production is taken into account, this relationship was negative;
an increase in timber harvesting will result in a decrease in carbon storage in live trees
(in situ). There is also carbon storage in wood products (ex situ) and this pool can store
considerable amounts of carbon (Seidl et al., 2007). The ex situ carbon was not
considered in this analysis. Timber harvesting can provide positive benefits in economic
terms but also there are some negative effects in ecological terms because of the loss
in forest area, such as release of carbon to the atmosphere, increase in flooding, and
climate regulation (Dymond et al., 2012; Raudsepp-Hearne et al., 2010).
Water yield was, however, inversely related to carbon storage and timber volume
(Table 2-13) (Dymond et al., 2012). There was an increase in water yield with decrease
in forest areas and this can considered as both a negative and a positive thing
57
depending on the characteristics of the watershed. For example if there is a demand for
irrigation water, less water yield is a negative thing; however, the increase in water yield
can result in an increase in flooding and in soil erosion, because more water is moving
faster over the surface (Dymond et al., 2012). In general terms, increase in provisioning
services will result in a decrease in regulating services (Dymond et al., 2012;
Raudsepp-Hearne et al., 2010). Urbanization, as a result of this study is the responsible
of the forest area losses. So, urbanization was negatively correlated to carbon storage
and timber volume and positively correlated to water yield (Table 2-13). According to
Escobedo et al. (2009a) the average carbon storage for urban forests in Southern
Escambia County in the Pensacola Bay watershed is 27.4 Mg per hectare, so this
carbon value is much lower when compared to forest areas analyzed in this study.
The key point is to reduce tradeoffs between ecosystem services, as well as
between ecosystem services and urbanization. This is complicated because the
interactions between ecosystem services are complex (Dymond et al., 2012), in addition
to the difficulty in finding the balance between the use of different ecosystem services
(DeFries et al., 2004). DeFries et al. (2004) referred to the problem of finding the
balance between human needs (e.g. new urban areas) and ecological functions of
ecosystems. Therefore, the starting point for assessing tradeoffs is to quantify
ecosystem services and to know about the response of ecosystems to different land use
changes (e.g. urbanization) (DeFries et al., 2004). This can be understood as the
inclusion of ecological knowledge in the land-use decisions (DeFries et al., 2004). One
alternative proposed by DeFries et al. (2004) and Gimona and van der Horst (2007) is
to identify the “win-win” and “lose-lose” areas were urbanization produces neither

58
positive or negative consequences in the ecosystem services. Then, areas where the
ecosystem services will suffer less impact should be selected for new development.
Concluding Remarks
Urbanization reduces forest area thus affecting its functions and the provision of
services, and consequently human well-being. Even though, there are tradeoffs
between ecosystem services and between human needs and ecological functions,
some management alternatives can be used for reducing these tradeoffs. Some key
challenges in terms of ecosystem management are related to better knowing about the
ecosystem services in biophysical terms (e.g. Mg of carbon storage) and to understand
how ecosystem services are linked, their tradeoffs, as well as the effects of drivers on
them. However, to develop alternatives for reducing these tradeoffs and consequently to
produce less impacts on ecosystems and people is not simple.
Further, spatial mapping and quantifying ecosystem services is not an easy task.
The use of the Integrated and Valuated Ecosystem Services and Tradeoffs (InVEST)
model, the USDA FIA field data, and other Geographic Information System (GIS) data
analysis provided a viable method to spatially map ecosystem services such as carbon
storage and water yield despite some limitation. The advantage of the InVEST model is
that is simple, so little data is needed and can be used in areas with poor data
availability. However, there are also some limitations, for example the water yield model
does not account for the groundwater, and this situation generates a large difference in
absolute water yield values when comparing to real data from gauge stations.
Nevertheless, as shown in Figure 2-9 the model can predict trends in water yield very
well and most importantly models can not reflect the complexity of the real world, but
they can approximate processes.

59
The FIA field data provide information that can be used in several approaches
such as for determining the values for different carbon pools and timber volume in the
study area. However, data limitation is the exact plot position (latitude/longitude), plots
displacement of plus or minus ½ or 1 mile because of privacy rights. A different
approach was used in this analysis for dealing with this limitation; some attributes from
the FIA data such as FIA Survey Unit, County, and Ecological subsection were used for
specifying carbon and timber data. The potential of this FIA database is large, and
several analysis based on GIS could be done if the FIA plot geographic coordinates
were available.
Future research can include other ecosystem services in the analysis to better
have a complete idea of the interactions between ES. One ecosystem can provide
multiple services at the same time; therefore all of them need to be considered in the
analysis. These services can be water quality, erosion control, food, recreation, among
others. Similarly, the analysis of other direct and indirect drivers is recommended. A
climate change scenario could be very interesting, as well, as different forest
management scenarios.
The results provided in this study are useful for land planners for balancing
ecological information with human needs and to include this ecological information in
land decisions. Land planners would know the quantity of ecosystem services that can
be lost when a forest area is converted into an urban area. This information should be
part of the decision-making processes. Results can also be used for maximizing human
well-being by maximizing all the services provided by ecosystems, as well as reducing
the tradeoffs between them, and the valuation of ecosystem services. The first step for

60
valuing ecosystem services is to quantify their production functions; the second one is
to assign an economic value to these functions. Knowing the value of the ecosystem
services and the effects of drivers influencing them is important when developing
payments for ecosystem services as a conservation tool. Payment for ecosystem
services is becoming an important mechanism to achieve the balance between human
and natural well-being. Forecasting land use change will also show how human needs
(new urban areas) can alter ecosystem and its services and how ecosystems respond
to these changes.

61
Table 2-1. Land cover distribution in the Lower Suwannee River and Pensacola Bay watersheds, Florida based on the Florida Fish and Wildlife Conservation Commission
Number Land cover
Type Pensacola Bay
Lower Suwannee
Area (ha) % Area (ha) %
1 Coastal Strand 1,034 0.7 ------ ------
2 Sand/Beach 2,173 1.5 1 0
3 Xeric Oak Scrub 121 0.1 ------ ------
4 Sand Pine Scrub (*) S 489 0.4 ------ ------
5 Sandhill (*) S 15,018 10.7 3,352 0.8
6 Dry Prairie ------ ------ 259 0.1
7 Mixed Pine-Hardwood Forest (*) H 3,745 2.7 10,561 2.6
8 Hardwood Hammocks and
Forest (*) H
2,144 1.5 38,880 9.5
9 Pinelands (*) S 18,475 13.1 97,118 23.8
12 Freshwater Marsh and Wet
Prairie
2,124 1.5 2,599 0.6
15 Shrub Swamp 217 0.2 8,579 2.1
16 Bay Swamp (*) S 5,969 4.2 187 0.1
17 Cypress Swamp (*) S 399 0.3 12,724 3.1
18 Cypress/Pine/Cabbage Palm (*) S ------ ------ 0.27 0
19 Mixed Wetland Forest (*) H 4,486 3.2 9,325 2.3
20 Hardwood Swamp (*) H 3,629 2.6 13,538 3.3
21 Hydric Hammock (*) H ------ ------ 590 0.1
23 Salt Marsh 136 0.1 2,148 0.5
26 Tidal Flat 17 0 0.09 0
27 Open Water 48,597 34.5 6,706 1.6
28 Shrub and Brushland 1,922 1.4 43,910 10.7
29 Grassland 38 0 11 0
30 Bare Soil/Clearcut 412 0.3 30,694 7.5
31 Improved Pasture 10 0.01 74,320 18.2
32 Unimproved Pasture ------ ------ 2,841 0.7
35 Row/Field Crops 1,098 0.8 21,098 5.2
36 Other Agriculture 25 0 3,824 0.9
41 High Impact Urban 24,181 17.2 12,705 3.1
42 Low Impact Urban 4,365 3.1 12,843 3.1
43 Extractive ------ ------ 17 0
Total 140,825 100 408,828 100
* Land cover used in the carbon storage and timber volume analysis; H, hardwoods; S, softwoods

62
Table 2-2. Ecological subsection (Ecol. Subs.) descriptions. [Adapted from McNab, W. H., Cleland, D. T., Freeouf, J. A., Keys, J., J.E., Nowacki, G. J., and C. A. Carpenter. 2007. Description of Ecological Subregions: Sections of the Conterminous United States. U.S. Department of Agriculture, Forest Service. Washington.]
Ecol. Subs.
Name Description Mean annual Temperature
(°F)
Annual Precipitation
(mm)
232Bg Gulf Coastal Plains and Flatwoods Section
Flat topography. Natural vegetation consists of longleaf-slash pine, loblolly-shortleaf pine, and oak-hickory cover types, with oak-gum-cypress along rivers.
67 1,587
232Bj Gulf Coastal Plains and Flatwoods Section
Flat topography. Natural vegetation consists of longleaf-slash pine, loblolly-shortleaf pine, and oak-hickory cover types, with oak-gum-cypress along rivers.
65 1,553
32Db Florida Coastal Lowlands-Gulf Section
Generally flat topography. Vegetation is mostly longleaf-slash pine and oak-gum-cypress cover types.
72 1,303
232Jf Southern Atlantic Coastal Plains and Flatwoods section
Terrain is weakly dissected irregular. Vegetation is mainly a mixture of loblolly-shortleaf pine, longleaf slash pine, oak-pine, and oak-gum-cypress cover types.
66 1,262
232Ka Florida Coastal Plains Central Highlands Section
Terrain is hilly with excessively drained. Forests consist of longleaf-slash pine and oak-hickory cover types. Much of the original forest vegetation has been removed and replaced by highly cultivated citrus groves. Section is ecologically significant because environments are drier than adjacent units.
68 1,393

63
Table 2-2. Continued
Ecol. Subs.
Name Description Mean annual Temperature
(°F)
Annual Precipitation
(mm)
232Lb Gulf Coastal Lowlands Section
Flat topography. Vegetation is mostly longleaf-slash pine and oak-gum-cypress cover types.
67 1,627
232Lc Gulf Coastal Lowlands Section
Flat topography. Vegetation is mostly longleaf-slash pine and oak-gum-cypress cover types.
68 1,473
Table 2-3. Description of the Forest Inventory and Analysis (FIA) attributes used in the
carbon and timber analysis. [Adapted from Woudenberg, S. W., Conkling, B. L., O'Connell, B. M., LaPoint, E. B., Turner, J. A., and K. L. Waddell. 2010. The Forest Inventory and Analysis Database: Database Description and User’s Manual Version 4.0 for Phase 2. U.S. Department of Agriculture, Forest Service, Rocky Mountain Research Station. Fort Collins, CO.]
Attribute code Attribute FIA Table name Attribute description
UNITCD FIA Survey unit Condition, Tree, Plot
Survey units are groups of counties within each State
PLT_CN Plot sequence number
Condition, Tree, Plot
Unique number to identify plots
ECOSUBCD Ecological Subsection
Plot An area of similar surficial geology, lithology, geomorphic process, soil groups, sub-regional climate, and potential natural communities
COUNTYCD County Condition, Tree, Plot
The identification number for a county, a governmental unit in a State
COND_STATUS_CD Condition status
Condition The condition status indicates the basic land cover (e.g. forest land)
STDAGE Stand age Condition The average age of the stand
SPCD Species code Tree A FIA tree species code FORTYPCD Forest
description Condition Forest type code

64
Table 2-4. Forest tree species used in the carbon storage and timber volume analysis by Land cover type
Scientific name Forest Inventory and Analysis code Land Cover number
4 5 7 8 9 16 17 18 19 20 21
Acer rubrum 316
X X X Carpinus caroliniana 391
X X
Carya glabra 403
X X
Carya tomentosa 400
X X
Chamaecyparis thyoides 43
X
Cornus florida 491
X
Fagus grandifolia 531
X X
Fraxinus americana 541
X X
Fraxinus caroliniana 548
X X Gordonia lasianthus 555
X
Ilex cassine 7455
X X Ilex opaca 591
X X
Juniperus silicicola 57
X
Liquidambar styraciflua 611
X X
X
Magnolia grandiflora 652
X X
Magnolia virginiana 653
X X X X
Morus rubra 682
X X
Nyssa aquatic 691
X X
Nyssa sylvatica var. biflora 693
X X X X Ostrya virginiana 701
X X
Persea palustris 720
X
Pinus clausa 107 X
X
4: Sand Pine Scrub, 5: Sandhill, 7: Mixed Pine-Hardwood Forest, 8: Hardwood Hammocks and Forest, 9: Pinelands, 16: Bay Swamp, 17: Cypress Swamp, 18: Cypress/Pine/Cabbage Palm, 19: Mixed Wetland Forest, 20: Hardwood Swamp, 21: Hydric Hammock
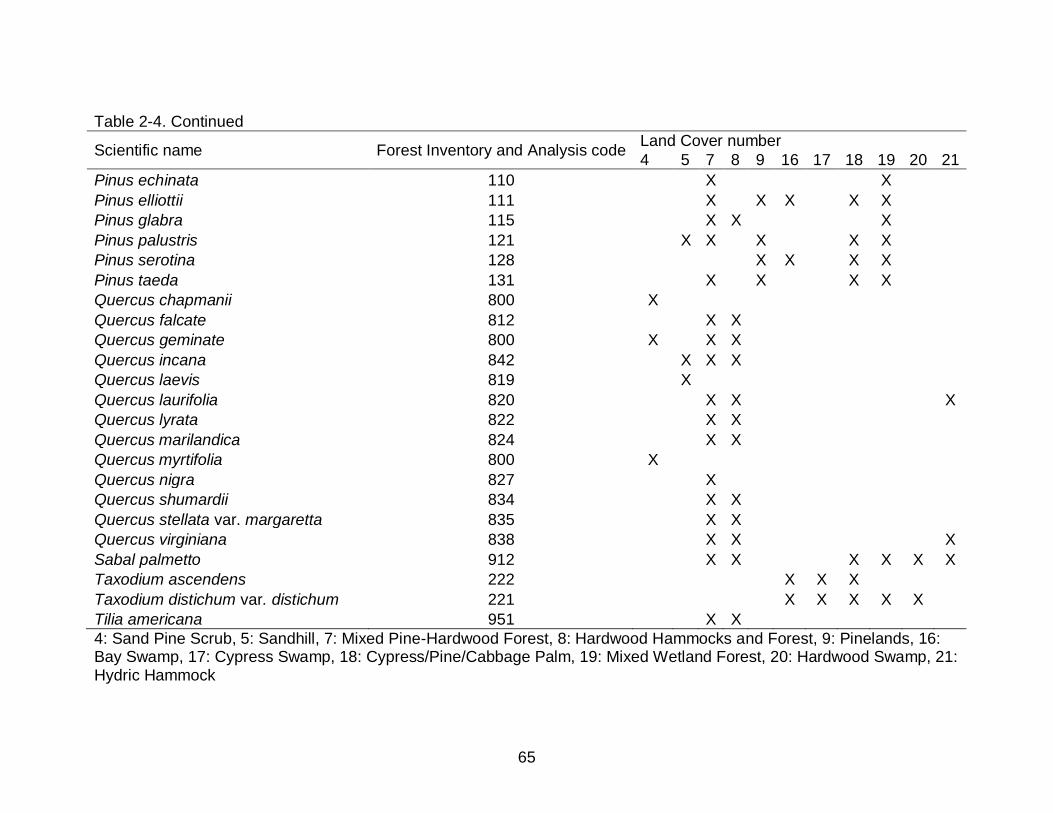
65
Table 2-4. Continued
Scientific name Forest Inventory and Analysis code Land Cover number
4 5 7 8 9 16 17 18 19 20 21
Pinus echinata 110
X
X Pinus elliottii 111
X
X X
X X
Pinus glabra 115
X X
X Pinus palustris 121
X X
X
X X
Pinus serotina 128
X X
X X Pinus taeda 131
X
X
X X
Quercus chapmanii 800 X
Quercus falcate 812
X X
Quercus geminate 800 X
X X
Quercus incana 842
X X X
Quercus laevis 819
X
Quercus laurifolia 820
X X
X
Quercus lyrata 822
X X
Quercus marilandica 824
X X
Quercus myrtifolia 800 X
Quercus nigra 827
X
Quercus shumardii 834
X X
Quercus stellata var. margaretta 835
X X
Quercus virginiana 838
X X
X
Sabal palmetto 912
X X
X X X X
Taxodium ascendens 222
X X X Taxodium distichum var. distichum 221
X X X X X
Tilia americana 951
X X
4: Sand Pine Scrub, 5: Sandhill, 7: Mixed Pine-Hardwood Forest, 8: Hardwood Hammocks and Forest, 9: Pinelands, 16:
Bay Swamp, 17: Cypress Swamp, 18: Cypress/Pine/Cabbage Palm, 19: Mixed Wetland Forest, 20: Hardwood Swamp, 21: Hydric Hammock

66
Table 2-5. Carbon pools aggregation based on the information available in the Forest Inventory and Analysis (FIA) Program database
Carbon pools FIA Carbon data
Aboveground biomass Carbon aboveground + carbon understory aboveground
Belowground biomass Carbon belowground + carbon understory belowground
Soil organic matter Carbon soil Dead biomass Carbon litter + carbon standing dead + carbon down
dead
Table 2-6. Reclassified land cover and carbon pools for the Pensacola Bay
watershed Raster value
Original LC
Eco subs County C above C below C soil C dead LC name
1 9 232Bj 113 44.63 9.91 107.59 17.39 Pinelands
2 7 232Bj 113 63.91 13.93 49.84 11.82 Mixed Pine-
Hardwood Forest
3 8 232Bj 113 14.68 2.72 49.84 11.82 Hardwood
Hammocks and Forest
4 20 232Bj 113 10.92 2.08 174.04 13.62 Hardwood
Swamp
5 19 232Bj 113 55.27 12.17 121.21 18.15 Mixed
Wetland Forest
6 9 232Bg 113 42.62 9.48 107.59 16.77 Pinelands
7 8 232Bg 113 24.05 3.57 49.84 8.54 Hardwood
Hammocks and Forest
8 7 232Bg 113 66.50 13.32 49.84 8.54 Mixed Pine-
Hardwood Forest
9 20 232Bg 113 11.07 2.07 174.04 25.38 Hardwood
Swamp
10 19 232Bg 113 68.13 15.28 125.20 18.61 Mixed
Wetland Forest
11 16 232Bg 113 51.68 11.27 147.63 20.23 Bay Swamp
12 9 232Lb 113 31.90 7.06 121.21 18.59 Pinelands
13 7 232Lb 113 38.91 8.49 49.84 13.76 Mixed Pine-
Hardwood Forest
14 8 232Lb 113 10.29 1.80 49.84 13.76 Hardwood
Hammocks and Forest
15 20 232Lb 113 3.23 0.49 174.04 5.06 Hardwood
Swamp
LC, Land cover; Eco subs, ecological subsection; C, carbon

67
Table 2-6. Continued Raster value
Original LC
Ecol subs
County C above C below C soil C dead LC name
16 19 232Lb 113 33.02 7.39 147.63 12.23 Mixed
Wetland Forest
17 16 232Lb 113 22.64 4.94 147.63 12.23 Bay Swamp
18 5 232Bg 113 15.48 3.23 67.64 16.58 Sandhill
19 5 232Bg 91 14.77 2.88 67.64 14.85 Sandhill
20 9 232Bg 91 32.10 7.03 107.59 16.44 Pinelands
21 7 232Bg 91 50.53 10.80 49.84 12.87 Mixed Pine-
Hardwood Forest
22 16 232Bg 91 45.55 9.79 147.63 20.23 Bay Swamp
23 20 232Bg 91 26.03 5.38 174.04 15.16 Hardwood
Swamp
24 19 232Bg 91 52.90 13.90 125.20 17.05 Mixed
Wetland Forest
25 8 232Bg 91 19.27 3.62 49.84 12.87 Hardwood
Hammocks and Forest
26 5 232Lb 113 19.47 4.05 67.64 15.01 Sandhill
27 20 232Bg 33 5.44 0.94 174.04 20.27 Hardwood
Swamp
28 19 232Bg 33 48.90 10.80 125.20 17.83 Mixed
Wetland Forest
29 7 232Bg 33 116.30 21.48 49.84 16.00 Mixed Pine-
Hardwood Forest
30 9 232Bg 33 45.80 10.12 80.33 16.87 Pinelands
31 8 232Bg 33 62.66 11.78 49.84 16.00 Hardwood
Hammocks and Forest
34 16 232Bg 33 10.95 2.07 147.63 20.23 Bay Swamp
36 17 232Bg 33 5.44 0.94 174.04 20.27 Cypress
Swamp
37 17 232Lb 113 3.23 0.49 174.04 5.06 Cypress
Swamp
40 5 232Lb 91 12.47 2.32 67.64 8.96 Sandhill
41 9 232Lb 91 18.97 4.08 121.21 20.65 Pinelands
42 20 232Lb 91 5.12 0.88 174.04 5.06 Hardwood
Swamp
43 19 232Lb 91 40.48 9.12 100.77 22.42 Mixed
Wetland Forest
44 8 232Lb 91 10.92 1.91 49.84 13.76 Hardwood
Hammocks and Forest
LC, Land cover; Eco subs, ecological subsection; C, carbon

68
Table 2-6. Continued
Raster value
Original LC
Ecol subs
County C above C below C soil C dead LC name
45 7 232Lb 91 27.51 5.84 49.84 13.76 Mixed Pine-
Hardwood Forest
46 16 232Lb 91 12.72 2.70 121.21 22.56 Bay Swamp
47 17 232Bg 91 26.03 5.38 174.04 15.16 Cypress
Swamp
48 17 232Lb 91 4.72 0.79 174.04 5.06 Cypress
Swamp
51 4 232Lb 113 3.59 0.47 80.33 23.65
52 7 232Lb 33 31.68 6.93 49.84 13.76 Mixed Pine-
Hardwood Forest
53 9 232Lb 33 30.92 6.76 121.21 18.17 Pinelands
54 16 232Lb 33 33.04 7.14 121.21 18.17 Bay Swamp
55 8 232Lb 33 4.25 0.56 49.84 13.76 Hardwood
Hammocks and Forest
56 20 232Lb 33 6.21 1.09 174.04 5.06 Hardwood
Swamp
57 19 232Lb 33 47.72 10.57 100.77 21.60 Mixed
Wetland Forest
58 17 232Lb 33 5.82 1.00 174.04 5.06 Cypress
Swamp
59 4 232Lb 91 25.07 5.44 80.33 22.28 Sand Pine
Scrub
61 4 232Lb 33 15.76 3.29 80.33 25.02 Sand Pine
Scrub
LC, Land cover; Eco subs, ecological subsection; C, carbon

69
Table 2-7. Input data for the InVEST water yield model. [Adapted from Tallis, H., Ricketts, T., Guerry, A., Wood, S., Sharp, R., Nelson, E., Ennaanay, D., Wolny, S., Olwero, N., Vigerstol, K., Pennington, D., Mendoza, G., Aukema, J., Foster, J., Forrest, J., Cameron, D., Arkema, K., Lonsdorf, E., Kennedy, C., Verutes, G., Kim, C., Guannel, G., Papenfus, M., Toft, J., Marsik, M., and J. Bernhardt. 2011. Invest 2.2.2 User’s Guide. The Natural Capital Project. Stanford.]
Data Description Units Data Source
Soil depth–GIS Raster Minimum of depth to bedrock and typical water table depth.
mm Soil Survey Staff, Natural Resources Conservation Service, USDA (2006)
Precipitation–GIS Raster A non-zero value for average annual precipitation for each cell (1998-2008)
mm PRISM Climate Group & Oregon State University (2008)
Plant Available Water Content-GIS Raster
Fraction of water that can be stored in the soil profile that is available for the use of plants.
Soil Survey Staff, Natural Resources Conservation Service, USDA (2006)
Average Annual Potential Evapotranspiration–GIS Raster
Potential loss of water from soil by both evaporation from the soil and transpiration by healthy Alfalfa, if sufficient water is available (1998-2008)
mm U.S Geological Survey, Florida Water Science Center (2008)
Land cover-GIS Raster A LC code for each cell (2003) Florida Fish and Wildlife Conservation Commission (2004)
Watershed–GIS Shapefile
The boundary of one drainage area Natural Resources Conservation Service (2005)
Sub-watershed–GIS
Shapefile Subdivision of watersheds Natural Resources Conservation
Service (2005)
Maximum root depth (per land cover type)
Maximum root depth for vegetated land covers mm Canadell et al. (1996) U.S. Department of Agriculture
Forest Service

70
Table 2-7 Continued
Data Description Units Data Source
Evapotranspiration coefficient (etk; per land cover type)
The plant evapotranspiration considering the transpiration characteristics to modify the reference evapotranspiration, which is based on alfalfa
Zhang Constant (per watershed)
Corresponds to the seasonal distribution of precipitation.
Tallis et al. (2011)

71
Table 2-8. Carbon storage descriptive statistics for the Lower Suwannee (LS) and Pensacola Bay (PB) Florida watersheds in Mg/ha
Watershed Year Forest
area (ha) Minimum Maximum Range Mean Std
LS 2003 186,276 72 342 270 196 56
LS 2060 163,692 69 326 257 187 53
PB 2003 54,074 66 229 163 148 40
PB 2060 42,862 64 218 154 137 38
Std, Standard deviation Table 2-9. Carbon storage in the four pools (Mg) for the Lower Suwannee River
(LS) and Pensacola Bay (PB) watersheds, Florida Watershed Aboveground Belowground Soil Dead Total p
LS-2003 10,193,638 (27.86%)
2,056,594 (5.62%)
21,136,310 (57.77%)
3,200,208 (8.75%)
36,586,750 (100%)
0.0005
LS-2060 8,467,580 (27.64%)
1,697,010 (5.54%)
17,848,700 (58.26%)
2,624,870 (8.57%)
30,638,160 (100%)
PB-2003 1,396,430 (17.46%)
280,855 (3.51%)
5,504,360 (68.82%)
816,620 (10.21%)
7,998,265 (100%)
0.0009
PB-2060 1,015,730 (17.31%)
191,896 (3.27%)
4,040,830 (68.88%)
618,348 (10.54%)
5,866,804 (100%)
p<0.05, significant differences Table 2-10. Timber volume values for the Lower Suwannee (LS) and Pensacola
Bay (PB) watersheds, year 2003-2060
Watershed Timber volume Area (ha) Mean* Std* Total** p
LS Volnet 2003 186,276 109.53 66.22 20,402,395 0.0005
LS Volnet 2060 163,692 110.58 67.92 18,100,416
LS Volsaw 2003 186,276 83.09 72.83 15,477,193
LS Volsaw 2060 163,692 82.72 72.33 13,540,937
PB Volnet 2003 54,074 68.60 54.95 3,709,552 0.0044
PB Volnet 2060 42,862 68.34 57.75 2,929,327
PB Volsaw 2003 54,074 54.80 40.96 2,963,514
PB Volsaw 2060 42,862 53.87 43.54 2,309,049
* in cubic meter per hectare; ** in cubic meter; Std: standard deviation; Volnet: net volume; volsaw: volume in the sawlog portion; p<0.05, significant differences Table 2-11. Water yield for the Lower Suwannee (LS) and Pensacola Bay (PB)
watersheds
Watershed Year Mean* Mean Total volume** p
LS 2003 1,293 93,193,344 0.002
LS 2060 1,342 96,694,988
PB 2003 1,520 104,635,694 0.0412
PB 2060 1,577 108,440,687
* in mm; ** in m3; p<0.05, significant differences

72
Table 2-12. Average volume in m3 for the Gopher gage station and the InVEST water yield model
Year Volume at gage station Volume water yield model Difference
2000 4,052,867,141 4,340,245,073 -287,377,932
2001 4,667,723,281 4,591,129,229 76,594,052
2002 3,181,523,048 5,674,599,116 -2,493,076,068
2003 10,402,507,944 6,268,311,839 4,134,196,105
2004 9,642,874,632 6,166,135,117 3,476,739,515
2005 12,636,723,568 5,895,177,138 6,741,546,429
2006 6,300,488,059 4,054,040,486 2,246,447,573
2007 3,637,303,035 4,367,875,584 -730,572,549
2008 5,982,335,754 5,303,463,592 678,872,162
Average 6,722,705,162 5,184,553,019 1,538,152,143
Table 2-13. Pearson Correlation coefficients between carbon storage, timber
volume, water yield and percentage (%) of forest change for the Lower Suwannee River and Pensacola Bay watersheds at the sub-watershed level
% of forest change Carbon Timber Water
LS % of forest change 1 LS Carbon 0.981 1
LS Timber 0.986 0.981 1 LS Water -0.856 -0.927 -0.868 1
PB Forest area variation 1 PB Carbon 0.994 1
PB Timber 0.974 0.966 1 PB Water -0.143 -0.129 -0.201 1

73
Figure 2-1. Study area: Lower Suwannee River and Pensacola Bay watersheds
Figure 2-2. Approach for the estimation of carbon pools and timber volume using
the Forest Inventory and Analysis (FIA) program data
Land Cover Forest Species or
Forest type description
FIA Survey Unit
Ecological subsection
County
Condition status
Stand age
Map created using ESRI basemap Copyright © Esri

74
Figure 2-3. Reclassification of the original land covers to include the ecological
subsection and county data.

75
Figure 2-4. Flow chart for estimating carbon and timber in the Lower Suwannee
River and Pensacola Bay Florida watersheds to approximate the exact locations of the Forest Inventory and Analysis (FIA) plots
Carbon and Timber estimates
Forest Inventory and Analysis (FIA) data
Land cover Map
Four carbon pools by forest
species (tons/ha)
Land cover reclassification
process
Four carbon pools by Land cover (tons/ha) Final
reclassified Land cover
map
Carbon values assigned to Land cover
map
InVEST carbon
Model
Model Output-carbon
in Mg/ha
Net and sawlog timber volume
by forest species
Net and sawlog timber volume
by Land cover
Volume values assigned to Land cover
map
Output-timber volume in
m3/ha

76
Figure 2-5. Conceptual framework for the InVEST water yield model. [Adapted
from Tallis, H., Ricketts, T., Guerry, A., Wood, S., Sharp, R., Nelson, E., Ennaanay, D., Wolny, S., Olwero, N., Vigerstol, K., Pennington, D., Mendoza, G., Aukema, J., Foster, J., Forrest, J., Cameron, D., Arkema, K., Lonsdorf, E., Kennedy, C., Verutes, G., Kim, C., Guannel, G., Papenfus, M., Toft, J., Marsik, M., and J. Bernhardt. 2011. Invest 2.2.2 User’s Guide. (Page 229, Figure 1). The Natural Capital Project, Stanford.]
Precipitation
Evaporation
Transpiration
Runoff
Water availability
Water yield= Runoff +
Water availability
Root
depth

77
A
B Figure 2-6. Total Carbon storage in the Lower Suwannee River, Florida. A) Total carbon
storage in 2003. B) Range of change in mean total carbon between 2003 and 2060 by sub-watershed.

78
A
B Figure 2-7. Total carbon storage in the Pensacola Bay watershed. A) Total carbon
storage in 2003. B) Range of change in mean total carbon between 2003 and 2060 by sub-watershed

79
Figure 2-8. Differences between 2060 and 2003 in the water yield per hectare for the
Lower Suwannee River watershed
Figure 2-9. Differences between 2060 and 2003 in the water yield (mean) and
precipitation (ppt) for the Pensacola Bay watershed
0
20
40
60
80
100
120
140
160
180
1 3 5 7 9 111315171921232527293133353739414345474951535557596163
Diffe
rence in
wate
r yie
ld 2
060
-2003
(mm
)
Subwatersheds
-100.000
-50.000
0.000
50.000
100.000
150.000
200.000
1 2 3 4 5 6 7 8 9 10 11 12 13 14 15
Diffe
rence (m
m)
Subwatersheds
Difference in mean
Difference in ppt

80
Figure 2-10. Normalized curves showing differences between average water yield
volume from the InVEST model and the Gage station data (actual) for the Lower Suwannee River watershed
0
0.2
0.4
0.6
0.8
1
1.2
2000 2001 2002 2003 2004 2005 2006 2007 2008
Year
Actual
Model

81
Figure 2-11. Carbon storage, timber volume, and water yield in 2003 (current) and 2060
for the Lower Suwannee (LS) and Pensacola Bay (PS) watersheds

82
CHAPTER 3 ASSESSING AND MAPPING POTENTIAL LOSS OF ABOVEGROUND CARBON
STORAGE AND TIMBER VOLUME FROM HURRICANES
Background
Hurricanes are considered one of the major threats to forest ecosystems in the
southeastern United States (U.S.) since the frequency of a major hurricane making
landfall in the eastern U.S. is every 2 to 3 years (McNulty, 2002). In many cases, the
quantification of forest damage is not taken into account because the damage is low
compared to human lives and property losses (McNulty, 2002). However, the damage to
forests can be significant and large areas of forest ecosystems can be altered, as well
as their functions and services; consequently affecting human well-being (Kupfer et al.,
2008; Wear and Greis, 2002b). Predicting the impacts of hurricanes on ecosystems
then becomes important in terms of the development of strategies for management,
post-hurricane response and restoration, salvage logging potential, and especially for
long-term ecosystem analyses (Kupfer et al., 2008).
According to Hanson (2010), hurricanes, tornadoes and other natural disturbances
create periodic forest clearings. One example is Hurricane Katrina, a category 5 in the
Saffir-Simpson Hurricane wind scale, that produced an estimated loss of 320 million
trees in Louisiana and Mississippi in 2005 (Hanson et al., 2010). Florida is one of the
most vulnerable areas to hurricanes (Leatherman and Defraene, 2006), and climate
change projections suggest that hurricanes will increase in frequency as well as
intensity in the next years (Stanton and Ackerman, 2007). According to Stanturf et al.
(2007) in the southern U.S., the probability of having a hurricane event is greater over
the next 40 years. This situation generates the need to better understand how a forest
ecosystem’s structure and its services can be altered as a result of this disturbance. As

83
such, hurricanes are considered an ecological driver affecting ecosystems since by
definition drivers are ecological or human factors that can affect ecosystem
composition, functioning, and processes, increasing or decreasing the provisioning of
ecosystem services (Hanson et al., 2010; Millennium Ecosystem Assessment, 2003).
Impacts of Hurricanes on Forests and Ecosystem Services
Hurricanes can affect forests by creating fragmentation, as well as different stand
ages and successional stages (Foster and Boose, 1992). Myers et al. (1998) mentioned
that severe hurricanes (e.g. Hurricanes Camille in 1969, David in 1979, and Gilbert in
1988) caused forest mortality and forest canopy loss of up to 100%. Brokaw and Walker
(1991) mentioned defoliation, uprooting, and snapping as the principal types of damage
to forest due to hurricanes. Moreover, this effects of forest structure can influence
ecosystem services such as the ability of a forest to store and sequester carbon,
especially in terms of short-term carbon storage (McNulty, 2002; Uriarte and Papaik,
2007; Worley, 2008). For example, hurricanes can reduce the amount of carbon stored
in the aboveground portions of trees; according to McNulty (2002) the 10% of the total
annual carbon sequestered in U.S. forests is converted to dead wood due to hurricanes.
For hurricane Katrina, 20% of annual forest carbon sequestration was lost,
corresponding to 40 million metric tons of forest carbon (McNulty, 2002; Worley, 2008).
However, not all the carbon is released into the atmosphere; carbon is transferred
from the living to dead pool, as well as to the soil pool after some period of time
(McNulty, 2002; Myers and van Lear, 1998). Frangi and Lugo (1991) found that after
Hurricane Hugo impacted a flood plain forest in Luquillo Mountains of Puerto Rico, ten
percent of the aboveground biomass was transferred to the forest floor. Tanner et al.
(1991) mentioned that after Hurricane Hugo, the total litter generated by the hurricane

84
was equivalent to two years of litter fall. Besides the conversion of biomass from live to
dead pool, Chambers et al. (2007) also mentioned the shift from larger tree sizes to
smaller ones, thus resulting in lower biomass.
To evaluate if hurricanes can have either positive or negative consequences on
ecosystem services such as carbon storage several factors need to be analyzed such
as the amount of carbon that is converted from living wood to dead wood, as well as
how much is released to the atmosphere (McNulty, 2002). The amount of wood that can
be salvaged determines how much carbon is lost by hurricanes. For example, McNulty
(2002) mentioned that after Hurricane Hugo in 1989 only 13% of the timber was
salvaged representing an amount of less than 9% of the carbon storage. Because a
forest requires approximately 15-20 years to recover after a hurricane, a large amount
of carbon can be lost (Lugo, 2008; McNulty, 2002). On the other hand, hurricanes can
eliminate older trees, thus favoring the establishment of younger trees, and in doing so,
the amount of carbon sequestered can increase because younger trees have more
photosynthetic activity (McNulty, 2002). The loss in timber volume is also important,
since hurricanes can generate huge financial losses. Stanturf et al. (2008) mentioned
that the estimated loss in economic terms due to hurricane Katrina was about $1.4 to
$2.4 billion and Jacobs (2007) estimated that the potential loss in forest volume due to
Charley, Frances, Ivan, and Jeanne hurricanes was about 56,000,000 cubic meter of
timber.
Tanner et al. (1991) discussed some effects of hurricanes on forests’ ecosystem
processes such as the reduction in the forest area that will also reduce
evapotranspiration after a hurricane impact. They also mentioned that the nutrient

85
cycling is altered because of all the litter and downed biomass added to the soil. Some
authors mentioned that hurricanes can increase the risk of secondary damages. The
increase in forest fuels, especially when some dry conditions occur, increases the
probability of wildfires occurrence with the potential to release carbon into the
atmosphere (Dale et al., 1998; Lugo, 2008; McNulty, 2002; Myers and van Lear, 1998;
Uriarte and Papaik, 2007). With high levels of rainfall the soil can be saturated
producing a risk of flooding and erosion (Tanner et al., 1991). Other consequences of
hurricanes are the increase in disease risk (Lugo, 2008; McNulty, 2002) and the
invasion of some species, increasing the risk of the extinction of other species (Lugo,
2008). Horvitz et al. (1998) studied forest areas impacted by Hurricane Andrew in
Florida and found that in terms of forest species regeneration, after the hurricane 28%
of 90 species identified were invasive.
Factors Controlling Hurricane Damage on Forests
The pattern of hurricane damage on forests is the result of the combination of
meteorological, physiographic, biotic (Duryea et al., 2007; Foster and Boose, 1992;
Oswalt and Oswalt, 2008), historical (e.g. previous natural disturbance) and stochastic
processes (Foster and Boose, 1992; Myers and van Lear, 1998). Myers et al. (2008)
mentioned that the cumulative effects of hurricanes alter forest structure and
composition in the long term. The relationship between wind speed and duration with
forest damage is not however clearly understood (Boose et al., 1994). Studies mention
that the most important factor that determine a forest’s vulnerability to hurricane
damage are stand characteristics such as tree diameter, height, age and species (Merry
et al., 2010; Xi et al., 2008). In the particular case of Hurricane Katrina, damage to
forests was more related to stand conditions and site characteristics (Kupfer et al.,

86
2008; Oswalt and Oswalt, 2008; Stanturf et al., 2007). On the other hand, studies also
mentioned that the highest damage in forests was the result of higher wind speeds
(Boose et al., 1994; Duryea et al., 2007) and the distance to landfall. For example,
Oswalt and Oswalt (2008) concluded that the damage to forests decreased when the
distance to landfall increased, in other words, when the distance from the coastline (i.e.
where hurricane reaches land) to inland areas increased.
Additionally McNulty (2002) found no evidence of forest damage from hurricanes
with hurricane categories below 3. Boose et al. (1994) performed an analysis on the
impacts of hurricanes on forests in Puerto Rico and concluded that the damage was
strongly related with differences in elevation (below 600 m) and vegetation type
(Colorado, palm, and dwarf forest types). Duryea et al. (2007) mentioned that the
damage to urban trees will depend on several factors such as species, wind speed, soil
type, moisture, and depth, tree health, and topography. According to Bromley (1939)
soils with hard clay horizons resulted in increased susceptibility to uprooting. Regarding
stand characteristics, Duryea et al. (2007) found that urban trees that grew in groups
had 80% of possibility to survive after a hurricane impact, comparing to 70% for the
individual, open-grown trees.
In regards to individual tree characteristics, Foster and Boose (1992) found that
damages was influenced by forest height, composition, slope, and aspect. In terms of
forest type, softwoods were most affected by hurricanes resulting in severe damage and
hardwoods were less affected (Foster and Boose, 1992). However, Oswalt and Oswalt
(2008) concluded that softwoods do not experience more damage than hardwoods.
They also mentioned that there was a relationship between forest type and distance to

87
landfall, as damage in hardwoods increase with the increase in distance to landfall.
Furthermore, softwoods experienced more damage in the zone where the distance to
landfall was less (generally referred to as zone 1, closer to the coastline). Kupfer et al.
(2008) included several variables in their analyses of hurricanes damage that can also
play an important role in the determination of the patterns of damage in forests such as:
wind speed, rainfall, topography, and floodplain conditions (e.g. soil) and found that
hurricane damage was a combination of several of these factors or variables.
Assessing and Mapping Hurricane Damage in Forests
A combination of field, remote sensing, climate (Boose et al., 1994; Kupfer et al.,
2008; Oswalt and Oswalt, 2008), and historical data (Boose et al., 1994) are necessary
to better estimate forest damage by hurricanes. Kupfer et al. (2008) for example used
aerial photographs for forest damage analysis, as well as rainfall data, wind speed,
duration of hurricane, and wind direction, and the overall accuracy using a classification
tree analysis was 71.5%. Jacobs (2007) developed a rapid response method for
assessing hurricanes potential damage in forests based on the delineation of the
damage areas using the hurricane track, wind speed, wind patterns, rainfall
accumulation, and tidal surge areas, and forest damage based on U.S Department of
Agriculture Forest Inventory and Analysis (FIA) data. Jacobs (2007) mentioned that
most of the forest damage is observed immediately adjacent to the windward side of the
track. Further, Oswalt and Oswalt (2008) estimated the forest damage by hurricanes
based on FIA data and the damage zones outlined by Jacobs (2007).
Wang and Xu (2010) performed a comparison of different vegetation indices
techniques (e.g. Normalized Difference Vegetation Index-NDVI) from pre and post-
hurricane using Landsat 5 TM imagery and aerial photos to identify damaged forests

88
due to hurricane Katrina using the supervised classification method. Based on an error
matrix to assess accuracy, results showed an overall accuracy ranging from 51% to
86%. Chambers et al. (2007) quantified the carbon loss by Hurricane Katrina using
detailed field data (i.e. FIA), remote sensing analyses, and a model to estimate forest
damage. Wang and Xu (2009) applied Geographic Information System (GIS) and logit
regression to assess the influence of several factors (i.e. forest characteristics and site
conditions) on pattern, severity and probability of damage due to hurricane Katrina.
Other studies have used decision-tree analyses to assess hurricanes. Decision
tree is an analytic method that can be used to select between different options or
choices considering high or low risk, cost, or influence using a graphic approach to
compare different alternatives (Olivas, 2007). However, the decision comprises some
uncertainty. Li et al. (2009) applied a decision-tree analysis and a set of decision rules
to find the influence of four parameters: sea surface temperature, vertical wind shear,
atmospheric water vapor, and zonal stretching deformation on tropical cyclone
formation and intensity. Kupfer et al. (2008) also used a classification tree analysis to
develop models for Hurricane Katrina based on storm meteorology, stand conditions,
and site characteristics to predict forest damage. Howard et al. (1972) applied a
decision-tree analysis to make the decision of seeding, or not, a hurricane to reduce its
intensity. DeLoach and Dicke (2005) presented several questions for landowners that
involve timber salvaged and management decisions and developed a Timber Stand
Salvage Decision Model to determine salvaging of damaged timber.
However, few studies that have assessed the potential role of hurricanes as direct
drivers of forest ecosystem services such as carbon storage and timber. Furthermore,

89
there are few hurricane-related studies that identify and map high and low forest
damage risk zones that can then be used to predict possible damages or conversely
identify areas where pre-hurricane management practices can be used to reduce
hurricane damage to forests. Dale et al. (2008) mentioned to the possibility of managing
forests to alter their vulnerability to hurricanes, by the selection of forest species,
silvicultural techniques (e.g. thinning), and genetic engineering. Post-hurricane forest
management includes debris and downed tree clean-up to avoid other events such as
wildfires and diseases resulting from the accumulation of biomass in the forest (Myers
and van Lear, 1998). However, this kind of information is not available for Florida.
Therefore, this study will develop a framework based on a decision-tree analysis
that can be used for assessing forest damages due to hurricanes with available field
data. This information can also be used to help land managers understand the
consequences of hurricanes on their forests in terms of loss of ecosystem services, as
well as to predict the responses of ecosystems, and forest/emergency management
activities, to this kind of disturbances (Dale et al., 1998; Kupfer et al., 2008). Decision-
tree analysis can also be useful for determining areas with high probability of timber
salvaged after a hurricane. By knowing this information managers can be prepared for
such events taking into account in their management plans, and consequently they can
reduce losses to forests, property, and ecosystem services (Kupfer et al., 2008).
In this chapter, the risk of forest damage by hurricane was assessed and mapped.
Specifically, this study’s objective was to determine potential loss of ecosystem services
in terms of aboveground carbon storage and timber volume that can be affected by a
direct driver – hurricanes. Another objective was to develop a decision-tree analysis

90
framework to identify zones of high and low forest damage risk by hurricanes using
existing literature and available plot-level spatial data such as: tree diameter and height,
type of species (e.g. softwoods and hardwoods), basal area, and distance to landfall
(damage zone).
Methods
Study Areas
The highly forested Lower Suwannee River watershed in west Florida and the
more urbanized Pensacola Bay located in Northwestern Florida were selected for this
study (Figure 2-1; Table 2-1).The Lower Suwannee watershed consists of an area of
408,828 ha, and is one of five watersheds that comprise the Suwannee River watershed
(Katz et al., 1997). Eight counties are within the watershed boundary: Columbia, Dixie,
Gilchrist, Lafayette, Levy, Madison, Suwannee, and Taylor. The Suwannee river is the
second largest river in Florida in terms of average discharge (Light et al., 2002). Several
studies were done in the Lower Suwannee watershed due to the threat of the transition
from natural ecosystems to more intense land-use practices (Martin, 2007) and the area
has been defined by Obreza and Means (2006) as one with unique biota and water
resources that need to be protected.
The Suwannee watershed is also characterized by the presence of karst features,
wetlands, lowland topography, and a small number of tributary streams (Katz et al.,
1997). Interactions between groundwater and surface water occur within the Suwannee
River watershed due to the presence of karst features. The land cover type in the
watershed is predominantly forest, agriculture, and wetlands (Katz et al., 1997) and has
63 sub-watersheds. The watershed has subtropical weather with warm summers and
moderate winters (Katz et al., 1997). The average precipitation in the watershed is

91
1,270 mm per year (Obreza and Means, 2006). The Lower Suwannee River watershed
was affected by several hurricanes. According to Light et al. (2002), the hurricanes
impacting the watershed were: Alma (1966), Agnes (1972), Josephine (1996), Earl
(1998), Opal (1995), and Georges (1998).
The Pensacola Bay watershed comprises an area of 140,825 ha and is part of the
Pensacola Bay system that is composed by five watersheds (Schwenning et al., 2007).
The counties of Escambia, Okaloosa, and Santa Rosa are within the watershed
boundaries. This watershed includes the Pensacola Bay estuary and parts of four major
rivers: Escambia, Blackwater, Shoal and Yellow Rivers, and some small tributaries
(Florida Department of Environmental Protection, 2007; Thorpe et al., 1997). The
watershed was chosen because of its different land cover characteristics compared to
the Lower Suwannee River watershed. The Pensacola Bay watershed is more
urbanized than the Lower Suwannee with around 30% of its area covered by urban
areas.
The Pensacola Bay system has unique features such as its morphology and the
hydrodynamics that are considered key points for the natural ecosystems. However,
over the last decades it was impacted by human activities such as habitat damage,
urban development, and point and non-point source pollution such as industrial and
domestic waste and non-point source pollutants from urban, suburban, and agricultural
areas (Thorpe et al., 1997; U.S. Environmental Protection Agency, 2004). Natural
ecosystems such as wetlands and aquatic habitats have been affected by urban related
deposition and sedimentation (Thorpe et al., 1997), as well as through conversion and
fragmentation (Northwest Florida Water Management District, 2006). The Pensacola

92
Bay watershed has a humid subtropical weather and annual precipitation ranges from
730 to 2,280 mm (Hays, 2009) with an average of 1,625 mm (Thorpe et al., 1997).
Pensacola Bay is affected by hurricanes approximately every five to ten years (NOAA-
National Hurricane Center, 2012a). The last major hurricanes in the area were Ivan in
2004 and Dennis in 2005 (Hays, 2009). According to NOAA-National Hurricane Center
(2012a), the hurricanes that affected Pensacola Bay watershed were: Eloise(1975),
Fredrick (1979), Elena (1985), and Opal (1995).
Quantification of Aboveground Carbon Storage and Timber Volume
Aboveground carbon storage and timber volume were estimated using the USDA
Forest Inventory and Analysis (FIA) data and the Florida Vegetation and Land Cover
2003 (Florida Fish and Wildlife Conservation Commission, 2004). Both data sets were
input into the InVEST model, developed for the Natural Capital Project to analyzing the
amount of aboveground carbon storage (Natural Capital Project, 2011).
Forest Inventory and Analysis Program Data
The USDA Forest Service Inventory and Analysis (FIA) program data was used for
analyzing forest carbon storage. Several studies (Jenkins et al., 2003; Smith et al.,
2004; Woodbury et al., 2007) have used this database for calculating forest carbon
stocks. The FIA data set contains database for the forest lands in all the U.S including
forest characteristics, such as extent, condition, and volume. The FIA Program started
in 1929 with periodic forest inventories of nation-wide network of plots in all the U.S. and
since 1999, these inventories are conducted annually (Jenkins et al., 2003;
Woudenberg et al., 2010). The plot-level data is based on individual tree measurement.
One limitation with the FIA data is that exact geographic coordinates (latitude and
longitude) of the plots are not provided because of the “Privacy provision” enacted by

93
Congress in the Food Security Act of 1985 to ensure private landowners’ privacy and
plot integrity. The location of the plots is approximately with a buffer of 1 mile or ½ mile
from the exact position. Moreover, 20% of the plots are swapped, which means that
some private plots are exchanged with other similar private plot, in the same county
(Woudenberg et al., 2010). This situation creates an uncertainty while plots need to be
overlaid with other GIS data. Sabor et al. (2007) found that the potential error of using
the altered location of the plots in combination with other layers, for example for a 30
meters by 30 meter raster layers, plot misclassification ranged from 32% to 66%.
However, different approaches, based on other FIA attributes, can be applied to better
use the data and approximate the location. For example, only the 1-10 % of plots were
misclassified using ecological subsection data (Sabor et al., 2007).To deal with the
problem of the precise FIA plot location, a different approach can be developed to
approximate the aboveground carbon and timber volume for the different forest types.
Some attributes available at the FIA database used for this the FIA Survey Unit,
ecological subsection, county, condition status, and stand age (Figure 2-2).
To extract the aboveground carbon and timber volume from the FIA data, the Tree
table was used (Woudenberg et al., 2010), which contains individual tree data. A tree
expansion factor, which can be found in the Tpa_unadj attribute in the Tree table was
used to scale each tree on a plot to a per-acre basis, considering the number of trees
per acre (TPA) (Woudenberg et al., 2010). Per tree values for aboveground carbon and
timber volume were multiplied by the corresponding Tpa_unadj to get the plot-level
data.

94
Using the Pivot table function in Microsoft Excel® (Microsoft, 2010), these values
were summed by plot (PLT_CN) considering specie code (SPCD), FIA survey unit
(UNITCD), ecological subsection (ECOSUBCD), county (COUNTYCD), condition status
(COND_STATUS_CD), and stand age (STDAGE). The aboveground carbon and timber
volume for each plot was calculated. Then, the average was calculated using these plot
data to get the value for each species, considering the ecological subsection and
county. To assign the aboveground carbon and timber volume to a raster file (i.e.
reclassified land cover) from unidentified FIA plot locations, the forest species were
identified in both data, so the carbon values in the FIA data for one specific forest
specie, one ecological subsection, and one county were assigned to the each forest
ecosystem in the raster file that corresponded to the same attributes (i.e. ecological
subsection and county).
Florida Vegetation and Land Cover 2003
The 2003 Florida Vegetation and Land cover map was developed based on
Landsat Enhanced Thematic Mapper satellite imagery with a 30 meter spatial resolution
and had detailed distinction between different ecosystems. It contained 43 classes of
vegetation and land cover, 26 being natural and semi-natural vegetation types, 16 types
of disturbed lands (e.g., agriculture and urban), and a single water class (Stys et al.,
2004). For the development of the hurricane framework, 11 forest cover classes were
selected and these classes were reclassified into two main tree types for analyses:
softwoods and hardwoods (Table 2-1). Urban forests (i.e. all trees and other associated
resources within urban areas), were not considered in the analysis.

95
Decision-tree Framework
Forest damage risk by hurricanes in this study considered the following as the
main factors behind forest damage: tree diameter, height, basal area, tree type
(softwoods and hardwoods), and distance to landfall (Merry et al., 2010; Oswalt and
Oswalt, 2008; Xi et al., 2008). The reclassified land cover and main factors were
combined to develop a forest ecosystem map to identified forest damage risk zones.
The tree diameter and height, as well as the basal area, and type of species (e.g.
softwoods and hardwoods) were extracted from the FIA database. Mean values for
each ecological subsection and county were calculated for diameter, height, and basal
area considering softwoods or hardwoods. The mean tree diameter and the mean tree
height were extracted from the Tree table that contains per tree level data; however the
mean basal area and the tree type (e.g. softwoods and hardwoods) were extracted from
the Condition table that contain per plot level data. The FIA data corresponded to cycle
8 (2002-2007) were used in the analysis because the land cover corresponds to 2003.
To deal with the problem of the precise plot location, a different approach was
used to extract the mean tree diameter and height, as well as the basal area from the
FIA database. The FIA attributes considered to identify the plots that are within the
boundaries of the study area were: FIA Survey Unit, ecological subsection (U.S.D.A
Forest Service, ECOMAP Team, 2007), county, condition status, and stand age. The
FIA survey, the ecological subsection, and the county were used to approximate the
location of the plots. However, the condition status and stand age were used to define
the characteristics of the forests. Only plots in the study area with the condition status
defined as “forest land” and with a stand age ranging from 1 to 72 years were
considered in the analysis. The description of each attribute is shown in Table 3-1.

96
The FORTYPCD attribute from the Condition table in the FIA database was used
to classify the tree type in the database and to better extract the information and assign
to the previously created raster file. The basal area of live trees on the plot (BALIVE)
was also extracted from the condition table and information was added to the Tree table
that contains tree diameter (DIA) and total height (HT) (Woudenberg et al., 2010). The
average values for DIA, HT, and BALIVE according to tree type, plus ecological
subsection and county were then calculated. The DIA, HT and BALIVE were classified
in two categories: small and large, short and tall, and low and high, respectively (Table
3-2). This classification was done using the ArcGIS® 10 software and the Natural breaks
(i.e. Jenks) method. The natural breaks are based on natural groupings inherent in the
data. Class breaks are identified that best group similar values and that maximize the
differences between classes (ESRI, 2011b).
The distance to landfall, defined as the intersection of the surface center of
hurricane with a coastline (NOAA-National Hurricane Center, 2012b), was used for
determining the two forest hurricane damage zone as: high and moderate-low.
Specifically, using the American Society Civil Engineer’s Standard 7 for the 1998 (ASCE
7-98), the wind damage zones were determined according to distance to hurricane
landfall (Peacock et al., 2005). The ASCE 7-98 shows a Florida map of wind risk
assessment associated with hurricanes where the maximum wind speed for a given
area is expected to affect building construction standards (Figure 3-2). The ASCE 7-98
was used because it presents the average worst case situation, in terms of the
maximum wind speed that can affect a specific area in Florida. This map can therefore

97
be used to delineate different hurricane damage zones by taking into account these
worst case wind speeds.
For the study area, two areas of damage were identified based on the ASCE 7-98.
One area had a shorter distance to landfall and a high wind speed: 13 miles of distance
and 120 miles per hour for the Lower Suwannee, and 2 miles of distance and 140 miles
per hour for Pensacola Bay; this area was identified as high hurricane damage zone
(zone 1). The farther area and lower wind speed was identified as Moderate-Low
hurricane damage zone (zone 2) and had a distance ranging from 13 to 65 miles and a
wind speed of 100-110 miles per hour for the Lower Suwannee and for Pensacola Bay
with a distance from 2 to 23 miles with 130 miles per hour of wind speed. The two-class
vegetation map (softwoods and hardwoods) was then combined with the Ecological
subsection and county raster files, as well as with the hurricane damage zones based
on the ASCE 7-98.
The result of this analysis was one raster file showing the unique combination of
classes for each type of forest ecosystem: hardwoods or softwoods, ecological
subsection, county and hurricane damage zone. The final raster used to develop the
risk of forest damage due to hurricanes in the decision tree analysis contained: 1) Tree
type: Hardwood or Softwood, 2) Hurricane damage zone: high (zone 1) and moderate
or low (zone 2), 3) Ecological subsection, 4) County, 5) FIA Survey Unit, 6) Mean
diameter: small (code = 2) and large (code = 1), 7) Mean total height: short (code = 2)
and tall (code = 1), and 8) Basal area: high (code = 1) and low (code = 2).
A decision tree scenario was developed to identify areas with high and low risk of
forest damage from hurricanes (Figure 3-1) based on information presented in Oswalt

98
and Oswalt (2008), Stanturf et al. (2007), Merry et al. (2010), Xi et al. (2008), and
Kupfer et al. (2008). Forest damage, for the purpose of this study, is some degree of
alteration of forests (i.e. plot- level, individual tree level). According to Oswalt and
Oswalt (2008), the hardwoods are more affected by hurricanes when the distance to
landfall increase (i.e. zone 2), and softwoods are more affected when they are closer to
the coast (i.e. zone 1). For tree diameter, Oswalt and Oswalt (2008) report that when
the diameter is smaller in softwoods and larger in hardwoods they were more affected
due to hurricanes. In terms of total height when both softwoods and hardwoods are
taller they are most affected by hurricanes. For basal area, both softwoods and
hardwoods are more affected when the basal area is lower (i.e. low density) (Duryea et
al., 2007; Escobedo et al., 2009b; Oswalt and Oswalt, 2008). Specific size, height, and
density criteria and respective units are provided in Table 3-2.
Based on this information and using the final raster containing all the decision tree
factors previously described, the high and low forest damage risk zones were selected
using the Conditional Function in ArcGIS® Spatial Analyst. The conditional function
allows the selection of several attributes from a raster file. By doing so, the areas with
high and low forest damage risk zones can be identified based on the five factors
analyzed. The expression used in the conditional function can be found in Table 3-3. In
zone 1 (high damage) the most affected type of tree species was softwoods, with:
smaller diameters (code = 2), great heights (code = 1), and lower densities (code = 2).
However, in zone 2 (moderate or low damage) the most affected were hardwoods with
larger diameter (1), greater heights (1), and lower densities (Oswalt and Oswalt, 2008).
A map showing the high and low forest damage risk zones due to hurricanes was

99
created for each watershed and the flow chart for the decision tree analysis is shown in
Figure 3-3. A sub-watershed analysis was also done to identify the sub-watersheds with
high percentage of high forest damage risk zones. Therefore, based on the total forest
area of each sub-watershed, the percentage of area in both high and low forest damage
risk zones was calculated.
Potential Loss of Aboveground Carbon Storage and Timber Volume
Using the aboveground carbon storage, timber net volume and timber in the
sawlog portion results based on the 2003 Florida Vegetation map and the USDA FIA
data (Chapter 2), aboveground carbon storage and timber volume for each zone (i.e.
high and low forest damage risk) were assessed and mapped. The high-low forest
damage risk map resulting from the decision tree analysis was used with the 2003-
aboveground carbon storage and timber volume map to calculate the potential amount
of loss of these two ecosystem services in each of these zones. Later, using the Zonal
statistics as a Table in ArcGIS® Spatial Analyst, the carbon storage and timber volume
raster values were summarize within each forest damage risk zone (e.g. high and low)
to get total aboveground carbon storage and timber volume estimates in each zone
(ESRI, 2012b).
Results
Potential Loss of Aboveground Carbon Storage Due to Hurricanes
In 2003 the aboveground carbon storage was 10,193,638 Mg for the Lower
Suwannee River watershed. Considering the worst case scenario where hurricanes
potentially impact all the forest areas in the watershed the approximate amount of
potential loss of carbon aboveground can be up to 10,193,638 Mg. Highest average
potential losses were located in the northeastern part of the watershed in the Suwannee

100
County (Figure 3-4). At the sub-watershed level, the current carbon aboveground
ranged from 22 to 115 Mg/ha, corresponding the highest average value to Rocky Hill
Tower sub-watershed that is composed by 54% of forests distributed in 38% of
hardwoods and 16% of softwoods.
Table 3-4 shows the potential aboveground carbon storage for the identified high
and low forest damage risk zones due to hurricanes for the Lower Suwannee River
watershed. Most of the areas with high risk were located in the Northeastern part of the
watershed (Figure 3-5). The area corresponding to the high risk was 23,840 ha (13%)
and the low risk area was 162,435 ha (87%). The aboveground carbon in the high forest
damage risk zone included 31% of the total estimated for the watershed. Considering
each zone the high risk zone (zone 1) and the moderate or low risk zone (zone 2), the
first one had 79,260 Mg (1%) and the second one had 3,037,890 Mg (30%). At the sub-
watershed level, 22 out of 63 sub-watersheds had a high risk of experiencing some
damage in their forests due to hurricanes (Figure 3-6). Rocky Hill Tower sub-watershed
registered the greater high risk considering the total forest area within its boundaries
that is equal to 326 hectares; or 70% of the forest has a high risk of hurricane damage
and 30% of the sub-watershed’s forests are under low risk.
For the Pensacola Bay watershed, the aboveground carbon storage in 2003 was
1,396,430 Mg and ranging from 3 to 116 Mg/ha, thus, the carbon that could be
potentially lost in the worst scenario was considered. High average values were located
in the western part of the watershed (Figure 3-7). The sub-watershed with the highest
average aboveground carbon was Bayou Texar-Bayou Garcon Frontal, with 64 Mg/ha,

101
where 27% of the area is composed by forests, 15% being hardwoods and 12%
softwoods.
About 0.3% of the existing forest area in the watershed is under high risk of
damage due to hurricanes; but the rest, 99.7% are under low risk of damage. The most
affected areas were located in the coastal areas of the watershed (Figure 3-8). Table 3-
5 shows the aboveground carbon values in the high and low forest damage risk zones
for the Pensacola Bay watershed. The aboveground carbon in the high risk zone was
0.5% of the total aboveground carbon registered in the watershed. At the sub-
watershed level only 2 out of 15 sub-watersheds registered a high risk of damage based
on the forest vegetation characteristics. The highest value corresponded to Fundy
Bayou-Williams Creek Frontal sub-watershed with 59% of the areas defined as high risk
(Figure 3-9). This sub-watershed registered only 3% of forest area. Urban areas were
not assessed in this analysis.
Potential Loss of Timber Volume Due to Hurricanes
The average timber net volume (volnet) for the Lower Suwannee in 2003 was 109
m3/ha over an area of 186,275 ha of forest, resulting in a total timber net volume of
20,402,395 m3 approximately. Considering the worst scenario where hurricanes can
damage all the forest areas, the approximate amount of volnet that can be potentially
lost can be up to 20,402,395 m3. At the sub-watershed level, the timber net volume
ranged from 33 to 194 m3/ha, with the highest average value for Gopher River sub-
watershed. In this sub-watershed the 73% of the area is covered by forest where 71%
corresponded to hardwoods and 2% to softwoods.
The timber volume in the sawlog portion (volsaw), in 2003 was 15,477,193 m3 with
an average of 83 m3/ha for the Lower Suwannee River watershed. In the worst scenario

102
where the hurricane affects all the forest areas, the approximate amount of volsaw that
can be potentially lost can be around 15,477,193 m3. Table 3-2 shows the timber net
volume and the timber in the sawlog portion for the identified high and low forest
damage risk zones due to hurricanes for the Lower Suwannee River watershed. The
timber net volume in the high risk zones was 15% of the total observed in the
watershed, and the timber sawlog portion was 32%.
For Pensacola Bay, the average timber net volume in 2003 was 69 m3/ha in an
area of 54,381 ha, the total timber net volume was approximately 3,730,642 m3. This is
the potential timber volume that can be lost in the worst hurricane scenario. At the sub-
watershed level the average timber net volume ranged from 45 to 157 m3/ha. The
highest average value corresponded to Bayou Texar-Bayou Garcon Frontal where 27%
of the area is covered by forests; being 15% hardwoods and 12% softwoods. The
timber volume in the sawlog portion, in 2003 was 2,980,362.85 m3 approximately with
an average of 68 m3/ha. Table 3-4 shows the values for timber net volume and timber in
the sawlog portion in the Pensacola Bay watershed. The amounts of timber net volume
and in the sawlog portion were low in the high risk zones: 0.7% and 0.5% of the total
registered in the watershed, respectively.
Discussion
A decision tree analysis based on previous studies can help to determine the
zones with high and low forest damage risk zones due to hurricanes considering the
structural characteristics of forests such as tree diameter and height, as well as basal
area. Results show that this method can be used to determine the effects of direct
drivers on ecosystem services, specifically how aboveground carbon storage and timber

103
volume can be potentially affected due to hurricanes in the Lower Suwannee River and
Pensacola Bay watersheds.
Potential Loss of Aboveground Carbon Storage Due to Hurricanes
Hurricanes can produce a decrease in the aboveground carbon in the study area’s
forests. However, not all the carbon will be lost, different changes will occur in the short
term as well as in the middle and long term. In the short term carbon pool changes
occur as aboveground carbon in live materials shifts to carbon dead and carbon can
also be stored in the salvaged timber (McNulty, 2002). According to McNulty (2002),
only 15% of the total carbon can be salvaged after a major hurricane, the rest is
decomposed and returned to the atmosphere in a long-term.
For the Suwannee River watershed, the area with high risk of forest damage was
13% of the total forests in the watershed, 11% being in zone 2 (moderate or low
damage), where most of the forest are hardwood (87%). Oswalt and Oswalt (2008)
calculated the mean percent of plot damages by hurricane Katrina and they found that
8% were damaged considering all the zones (closest and furthest from landfall). In
terms of forest area damage by Hurricane Katrina, Wang and Xu (2009) found that 60%
of the total forest land in the region was damaged by the Hurricane. The aboveground
carbon in the high forest damage risk zone was 31% of the total estimated for the
watershed, with a 30% of the amount in the zone 2 because most of the forest is
located within this zone (93%).
In the Pensacola Bay watershed, the area with high forest damage risk due to
hurricanes was only 0.3% of the total forest registered in the watershed. The
aboveground carbon in the high risk zone was only 0.5% of the total aboveground
carbon estimated for the watershed; most forest area (93%) being located within this

104
zone. Previous studies mention that the amount of aboveground carbon that can be
transferred from the living to dead pool is about 10% for a single hurricanes (McNulty,
2002), in terms of carbon emissions about 9-18% of the carbon storage can be released
(Zeng et al., 2009), and for Hurricane Katrina the carbon loss was 77.6 kg per ha (Zeng
et al., 2009). Apparently and according to the results of this study - the loss of
aboveground carbon storage in the Pensacola Bay watershed is potentially low
compared to documented losses from Hurricane Katrina; in spite the area being more
affected by hurricanes because of its geographic location (i.e. ASCE 7-98 maximum
wind speed for this region is 130-140 miles per hour).
Potential Loss of Timber Volume Due to Hurricanes
The timber net volume in the high forest damage risk zone was 15% and 0.7% of
the total observed in the Lower Suwannee and Pensacola Bay watershed, respectively.
The timber in the sawlog portion was 32% for the Lower Suwannee and 0.5% for
Pensacola Bay watershed. Jacobs (2007) found that 10% of the total timber was
destroyed after hurricane Camille (category 5) that impacted Southern Mississippi.
Stanturf et al. (2007) mention that approximately the 20% of the standing timber volume
was destroyed as consequence of Hurricane Katrina. However, McNulty (2002)
mentions that across all the damage zones, 37% of the standing tree was damaged
from major hurricanes such as Katrina. Jacobs (2007) mentioned that with hurricane
Andrew, there was a loss in standing volume of 66% in high and moderate damage
zones, with hardwoods receiving more damage. In the case of Hurricane Camille in
1969 (category 5), Jacobs (2007) produced a decrease in timber volume of 21-37%.
The percentage of damage can vary significantly because of the factors that control
forest damage, such as forest characteristics (Oswalt and Oswalt, 2008), regional

105
characteristics (climate, topography) (Boose et al., 1994) and because of the
uncertainty in hurricane prediction (Oswalt and Oswalt, 2008).
Some of the limitations of this study include the decision-tree analysis that was
based on existing literature that identified factors controlling forest damages due to
hurricanes. Thus, to get better results, this method should be used with existing pre and
post-hurricane field data to be better able to determine effects based on the percentage
of forest damage and to find relevant factors. Another limitation is hurricane complexity,
since many factors interact to determine the degree of forest damage by hurricane,
such as wind speed, rainfall, mechanical and chemical effects of storm surges, stress
from hurricane-induced damage, and mortality from subsequent post-hurricane
disturbances (i.e. fires), as well as the variability of forest structural characteristics and
conditions(Kupfer et al., 2008).
Concluding Remarks
The main objective of this study was to determine the potential loss of
aboveground carbon storage and timber volume due to drivers such as hurricanes and
to identify high forest damage risk zones due to hurricanes based on the most important
factors influencing forest damage. According to existing literature these factors were the
tree diameter and height, the distance to landfall and the type of species that composed
the forest (hardwood or softwood). Using decision tree analyses, a scenario was
developed and combined with available USDA FIA and Florida vegetation and land use
spatial data to better identify spatially explicit high and low forest damage risk zones in
the study area. However, the uncertainty associated with hurricanes can generate
highly variability resulting in uncertainty when predicting damages to forests. This

106
uncertainty is the product of the random nature of hurricane occurrence in terms of
space and time as hurricanes are natural forces that cannot be replicated.
Further research could explore the damage to forests from hurricanes through an
analysis that included more factors that can exert and influence in the degree of
damage on forests, as well as different analysis for different categories of hurricanes
and different climatic situations. Other ecosystem services can be included and
analyses at different scales should also be done, because factors can vary across
different scales. The identification of high forest damage risk zones is important for pre
and post-hurricane forest management. Some forest management at the stand level
can be done to minimize the risk of carbon and timber loss due to hurricanes, the
management practices can be done before or after the hurricane impact. Overall, based
on the literature review, decision tree analysis is not commonly used in this kind of
study; however, it is a good alternative for assessing hurricane damage to forests. This
method could also be applied at a state-level to identify high forest damage risk zones
across the State of Florida. The potential for timber salvaging activities can be also
included in the decision-tree analysis to identify areas after a hurricane. This study’s
decision tree could also be used to develop an online portal for landowners to know how
vulnerable their forests are to hurricane impacts. The inclusion of urban areas in the
analysis can also be done in future studies to have a complete idea about ecosystem
services losses across all ecosystems in the watersheds.
Knowledge on the potential effects of hurricanes on forest ecosystems and their
services is growing because of the predicted increase in hurricane intensity and
occurrence. The study’s results can serve to map and identify the most vulnerable

107
zones, as well to evaluate how hurricanes can affect aboveground carbon storage, and
consequently carbon sequestration in a long-term, and timber volume to intensify the
management of the areas with high probability of ecosystem services loss. Land
managers should include the potential occurrence of disturbances, such as hurricanes
in their management plans to be aware of the consequences in terms of loss of
ecosystem services especially when they have in mind some conservation strategies
such as payment for ecosystem services.

108
Table 3-1. Description of the Forest Inventory and Analysis (FIA) attributes used in the hurricane framework. [Adapted from Woudenberg, S. W., Conkling, B. L., O'Connell, B. M., LaPoint, E. B., Turner, J. A., and K. L. Waddell. 2010. The Forest Inventory and Analysis Database: Database Description and User’s Manual Version 4.0 for Phase 2. U.S. Department of Agriculture, Forest Service, Rocky Mountain Research Station, Fort Collins, CO.]
Attribute code Attribute FIA Table name Attribute description
UNITCD FIA Survey unit Condition, Tree, Plot
Survey units are groups of counties within each State
ECOSUBCD Ecological Subsection
Plot An area of similar surficial geology, lithology, geomorphic process, soil groups, sub-regional climate, and potential natural communities
COUNTYCD County Condition, Tree, Plot
The identification number for a county, a governmental unit in a State
COND_STATUS_CD Condition status
Condition The condition status indicates the basic land cover (e.g. forest land)
STDAGE Stand age Condition The average age of the stand (years)
FORTYPCD Forest description
Condition Forest type code
DIA Current diameter
Tree Current diameter of the tree in inches.
HT Total height Tree The total length of the tree (in feet) from the ground to the tip of the apical meristem.
BALIVE Basal area Condition Basal area of live trees over 1 inch of diameter at breast height (in square feet per acre)

109
Table 3-2. Range of values for the two defined classes for tree diameter, tree height and basal area for the Lower Suwannee River and Pensacola Bay watersheds
Attribute Value in Lower Suwannee River Value in Pensacola Bay
Tree diameter DIA 1 >=8.4 inch >=7.5 inch Tree diameter DIA 2 <8.4 inch <7.5 inch Tree height HT 1 >=45.8 feet >=50 feet Tree height HT 2 <45.8 feet <50 feet Basal area BA 1 >=80 square feet/acre >=68 square feet/acre Basal area BA 2 <80 square feet/acre <68 square feet/acre
Table 3-3. Expressions used in the Conditional function in ArcGIS® Spatial Analyst to
define the risk of forest damage by hurricanes
Area of damage Expression Risk of forest damage
High forest risk damage zone: 1
Land cover = softwoods and Area of damage = 1 and mean height = 1 and mean diameter= 2 and basal area = 2
High
Moderate or Low forest risk damage zone: 2
Land cover = hardwoods and Area of damage = 2 and mean height = 1 and mean diameter = 1 and basal area = 2
High
Table 3-4. Potential aboveground carbon, timber net volume, and timber in the sawlog
portion in the forest damage risk zones for the Lower Suwannee watershed
Risk zone Area (ha)
Aboveground carbon (Mg)
% Timber net
volume (m3) %
Timber sawlog
portion (m3) %
Low 162,435 7,076,490 69 17,337,987 85 10,563,310 68
High 23,841 3,117,150 31 3,064,328 15 4,913,881 32
Total 186,276 10,193,640 100 20,402,314 100 15,477,192 100
Table 3-5. Potential aboveground carbon, timber net volume, timber in the sawlog
portion in the forest damage risk zones for the Pensacola Bay watershed
Risk zone Area (ha)
Aboveground carbon (Mg)
% Timber net
volume (m3) %
Timber sawlog
portion (m3)
%
Low 53,904 1,384,500 99.5 3,681,811 99.3 2,950,522 99.5
High 170 7,547 0.5 27,391 0.7 13,661 0.5
Total 54,074 1,392,047 100 3,709,202 100 2,964,183 100

110
Figure 3-1. Decision tree scenario for determining forest damage risk due to hurricanes
Tree
type Risk
Tree
height
Tree
diameter
Basal
area
Hardwoods
Zone 1
Softwoods
Zone 1
Softwoods
Zone 2
Hardwoods
Zone 2
High
High
Height 1 (greater
heights)
Height 2
Height 1
(greater
heights)
Height 2
Diameter 1 (larger
trees)
Diameter 2 (smaller
trees)
Diameter 1 (larger
trees)
Diameter 2
(smaller
trees)
Basal area
1
(high)
Basal area 1
(low)
Basal area 1
(high)
Basal area 1
(low)
Forest damage
risk

111
Figure 3-2. American Society Civil Engineer’s Standard (ASCE) 7-98 map with wind
risks for the two watersheds: Lower Suwannee River and Pensacola Bay. [Adapted from Peacock, W. G., Brody, S. D., and W. Highfield. 2005. Hurricane Risk Perceptions among Florida's Single Family Homeowners. (Page 127, Figure 1). Landscape and Urban Planning.]

112
Figure 3-3. Flow chart for the decision tree analysis for determining forest damage risk
zones
Hurricane framework
Forest Inventory
Analysis (FIA)
Data
Land cover (LC)
Map
FIA forest
reclassification:
hardwoods and
softwoods
LC reclassification
process: hardwoods
and softwoods
Mean diameter
(DIA), total height
(HT), and Basal
area (BALIVE)
Final reclassified
LC
DIA, HT and BALIVE
by LC
Decision tree analysis
High and Low forest
damage risk zones
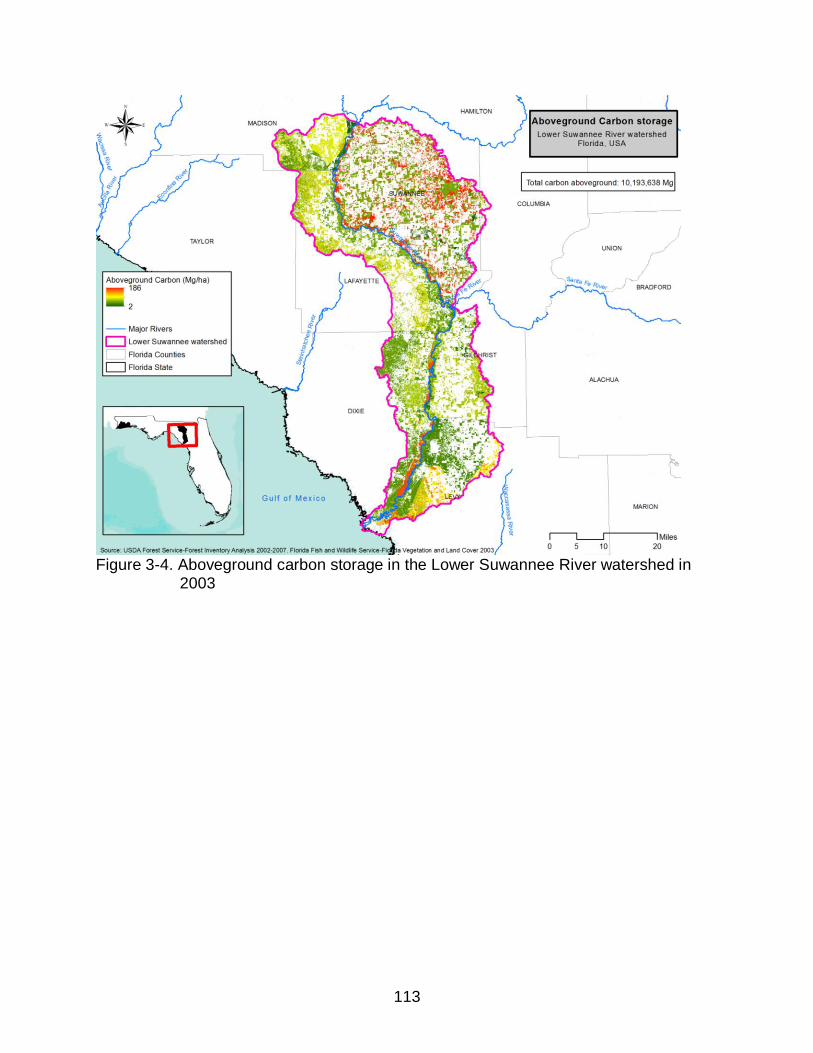
113
Figure 3-4. Aboveground carbon storage in the Lower Suwannee River watershed in
2003

114
Figure 3-5. Risk of forest damage by hurricanes in the Lower Suwannee River
watershed

115
Figure 3-6. High risk of forest damage by hurricanes in the Lower Suwannee River
watershed by sub-watersheds

116
Figure 3-7. Aboveground carbon storage in the Pensacola Bay watershed in 2003

117
Figure 3-8. Risk of forest damage by hurricanes in the Pensacola Bay watershed

118
Figure 3-9. High risk of forest damage by hurricanes in the Pensacola Bay watershed by
sub-watersheds

119
CHAPTER 4 CONCLUSIONS
Summary
The concept of ecosystem services is becoming more relevant to environmental
planning and management (Boyd and Banzhaf, 2007; Brown et al., 2007; de Groot et
al., 2010; Farley and Costanza, 2010). The Millennium Ecosystem Assessment (2003)
defined ecosystem services as those services provided by ecosystems with a direct
influence on human well-being. The southern US forests are one of the most biologically
diverse temperate forests in the world and consequently they can produce a bundle of
ecosystem services (i.e. a set of multiple ecosystem services) (Raudsepp-Hearne et al.,
2010). Although, people can benefit from multiple ecosystem services; they often have
to decide which services are more relevant to them depending on what benefit they
want from these ecosystems. So, the inclusion of the population in the decision-making
process is key to know what ecosystem services are important for a region.
Change in land cover can affect the provision of ecosystem services by reducing
them. All ecosystems constantly change over time, and many of these changes are due
to human impacts (e.g. urbanization) and natural processes (e.g. wildfire) (ICSU et al.,
2008; Millennium Ecosystem Assessment, 2003). Understanding the causes of these
changes, or drivers as done in this study, is fundamental to minimize their impact on the
provisioning of ecosystem services, as well as on the human well-being (Millennium
Ecosystem Assessment, 2003).
Effects of Urbanization on Carbon Storage, Timber Volume, and Water Yield
Ecosystem can be impacted from different drivers that can alter their functionality,
as well as their processes and services. The first step in understanding the magnitude

120
of the impacts to ES provision is to quantify ES as well as the drivers affecting them.
Urbanization, defined as the development of new urban areas in non-urban lands, is
considered one of the major drivers that can affect ecosystems (Grimm et al., 2008; Xu
et al., 2007). As urbanization areas increase, ecosystems functions, processes and
services can be impacted. This study estimated the effects of urbanization as a driver of
carbon storage, timber volume, and water yield in the Lower Suwannee River and
Pensacola Bay watersheds in Florida. The study combined Geographic Information
System (GIS) and Forest Inventory and Analysis (FIA) data to estimate ES using a
2003- current scenario and a projected 2060 urbanized-scenario in these two areas.
The Integrated Valuation and Ecosystem Services Tradeoffs (InVEST) GIS model was
used to quantify the ecosystem services.
Results show that there were significant changes in the two study areas between
the current and urbanized 2060 scenarios in terms of provision of the three ecosystem
services. Thus, urbanization directly affects carbon storage, timber volume, and water
yield; carbon storage and timber volume were negatively correlated to urbanization and
water yield was positively correlated. Results showed that urbanization will convert
forest areas in the year 2060, and that will be result in the decrease of the provision of
carbon storage and timber volume, and into an increase in water yield.
Potential Loss of Aboveground Carbon Storage and Timber Volume from Hurricanes
Hurricanes are also a driver affecting ecosystems, as well as its processes and
services. This study identified forest damage risk zones due to hurricanes that can be
useful for landowners and policy makers and is crucial for management purposes. This
study also estimated the potential loss of ecosystem services in terms of aboveground

121
carbon storage and timber volume by hurricanes, in the Lower Suwannee (LS) and
Pensacola Bay (PB) watersheds in Florida. The identification of the high and low
probabilities zones were based on five factors identified in previous studies as important
for determining the degree of forest damage: tree diameter and height, distance to
landfall, type of species (e.g. hardwoods or softwoods), and basal area. A decision tree
framework was developed based on five factors identified in previous studies as
important for determining the potential damage in forest due to hurricanes. Those
factors were: tree diameter and height, distance to landfall, type of species (e.g.
hardwoods or softwoods), and basal area. Results showed that this method can be
used to determine potential losses of aboveground carbon storage and timber volume
due to hurricanes in the Lower Suwannee River and Pensacola Bay watersheds.
Integrating the Concept of Ecosystem Services in Decisions
One of the major challenge that scientist are facing is the translation of ecosystem
services into action. The objective of this is to make better decisions, resulting in better
use of the natural resources (Daily et al., 2009). Several studies have been done for
evaluating ecosystem services in different aspects (Liu and Costanza, 2010; Millennium
Ecosystem Assessment, 2003; Nelson et al., 2009); however not many of them have
been put in practice. So, the integration of ecosystem services in decisions becomes
very important to improve human life. Decisions in terms of land use change have been
done base only in economic aspects putting aside ecological aspects (McKenzie et al.,
2011).
As a result of the lack of information on the quantity and value of ecosystem
services, some land covers that are multifunctional (and consequently multiple ES
provision) are converted often to single-functional land covers (e.g. croplands).

122
Therefore, to produce the information about ecosystem services and how these are
affected by different drivers is the first step to include them in the decision-making
process. The next step is to put that information available to the public, land owners,
policy makers, urban planners, and others decision makers but in a very clear, simple
and understandable way. Other effective strategies are education and awareness
programs for all who lack information (McKenzie et al., 2011). Daily et al. (2009) for
example, presented a framework to integrate ecosystem service into decisions, they
started describing the how decisions are linked with ecosystems, they proposed the use
of scenarios to see the effects of decisions on ecosystems. Next, they mention the
importance of knowing about ecosystem services and their values to provide this
information to the institutions that have the power to create, for example conservation
incentives.
Integrating ecosystem services into policies is not impossible. There are some
examples, ecosystem services are included in the National Strategy for Growth and
Reduction of Poverty of Tanzania for the year 2005 (McKenzie et al., 2011). Basically
they include the protection and enhancing of ecosystem services to improve the welfare
of people. Information about ecosystem services can also influence decisions, this is the
case of Borneo, there was an interest in change a forest area to an oil palm plantation;
however, an assessment on the values of ecosystem services favor the forest area over
the oil palm plantation (McKenzie et al., 2011). The Millennium Ecosystem Assessment
(2005) presents several other examples.
Even though several studies have been done to show the consequences of
ecosystem service changes on the population, if people’s perception about ecosystems
123
does not change, no possible study can have any impact on them (McKenzie et al.,
2011). Therefore, if people do not value nature and they are more interested in short-
term economic growth; the integration of ecosystem services in decisions will be very
difficult (Daily et al., 2009; Nelson et al., 2009). In conclusion, when people begin
understanding the importance of ecosystem services to their well-being incorporating
ecosystem services into policies will become easier.

124
LIST OF REFERENCES
Abd-Elrahman, A., Adams, D., Borisova, T., Delphin, S., Escobedo, F., Frank, A., Kil, N., Kreye, M., Kroeger, T., Stein, T., and N. Timilsina, 2012, "Stewardship Ecosystem Services Survey Project: Final Report", Escobedo, F. and N. Timilsina (Eds.), Unpublished manuscript, last modified May 16 2012.
Abt, R. C., Cubbage, F. W., and G. Pacheco, 2000, "Southern Forest Resource
Assessment Using the Subregional Timber Supply (SRTS) Model," Forest Products Journal, 50(4):25-33.
Alig, R. J., Kline, J. D. and M. Lichtenstein, 2004, "Urbanization on the US Landscape:
Looking Ahead in the 21st Century," Landscape and Urban Planning, 69(2-3):219-234.
Alvarez, R., Cropper, W., Harwell, M., Jagtap, S., Landsea, C., Letson, D., Parker, C.,
Shivlani, M., Wanless, H., and J. Winchester, 2001, Feeling the Heat in Florida: Global Warming on the Local Level. Fiedler, J., F. Mays and J. Siry (Eds.), New York, NY: Natural Resources Defense Council.
Arnold, J. G., Bircket, M. D., Williams, J. R., Smith, W. F., and H. N. McGill, 1987,
"Modeling the Effects of Urbanization on Basin Water Yield and Reservoir Sedimentation," Journal of the American Water Resources Association, 23(6):1101-1107.
Bengston, D. N., Potts, R. S., Fan, D. P., and E. G. Goetz, 2005, "An Analysis of the
Public Discourse about Urban Sprawl in the United States: Monitoring Concern about a Major Threat to Forests," Forest Policy and Economics, 7(5):745-756.
Birch, E. L. and S. M. Wachter (Eds.), 2008, Growing Greener Cities: Urban
Sustainability in the Twenty-First Century, The City in the Twenty-First Century, Philadelphia: University of Pennsylvania Press.
Birdsey, R., Pregitzer, K., and A. Lucier, 2006, "Forest Carbon Management in the
United States: 1600-2100," Journal of Environmental Quality, 35(4):1461-1469. Boggess, D. H., 1968, Water-Supply Problems in Southwest Florida, Tallahassee, FL:
U.S. Geological Survey Open-File Report FL-68003. Boggs, J. L. and G. Sun, 2011, "Urbanization Alters Watershed Hydrology in the
Piedmont of North Carolina," Ecohydrology, 4(2):256-264. Boose, E. R., Foster, D. R., and M. Fluet, 1994, "Hurricane Impacts to Tropical and
Temperate Forest Landscapes," Ecological Monographs, 64(4):369-400.

125
Bosch, J. M. and J. D. Hewlett, 1982, "A Review of Catchment Experiments to Determine the Effect of Vegetation Changes on Water Yield and Evapo-Transpiration," Journal of Hydrology, 55(1-4):3-23.
Boyd, J. and S. Banzhaf, 2007, "What Are Ecosystem Services? The Need for
Standardized Environmental Accounting Units," Ecological Economics, 63(2-3):616-626.
Braatz, S. M. (Eds.), 2001, State of the World’s Forests 2001, Rome, Italy: Food and
Agriculture Organization of the United Nations. Brokaw, N. V. L. and L. R. Walker, 1991, "Summary of the Effects of Caribbean
Hurricanes on Vegetation," Biotropica, 23(4):442-447. Bromley, S. W., 1939, "Factors Influencing Tree Destruction during the New England
Hurricane," Science, 90:15-16. Brown, T. C., Bergstrom, J. C., and J. B. Loomis, 2007, "Defining, Valuing, and
Providing Ecosystem Goods and Services," Natural Resources Journal, 47(2):329-376.
Bystriakova, N., Brown, S., Gonzalez, P., Irland, L. C., Kauppi, P., Sedjo, R., and I. D.
Thompson, 2005, "Timber, Fuel, and Fiber," in Ecosystems and Human Well-Being: Current State and Trends : Findings of the Condition and Trends Working Group of the Millennium Ecosystem Assessment, Hassan, R. M., Scholes, R. and N. Ash (Eds.), Washington, D.C.: Island Press, 243-269.
Canadell, J., Jackson, R., Ehleringer, J., Mooney, H. A., Sala, O., and E. D. Schulze,
1996, "Maximum Rooting Depth of Vegetation Types at the Global Scale," Oecologia, 108(4):583-595.
Carr, M. H. and P. D. Zwick, 2007, Smart Land-Use Analysis: The LUCIS Model Land-
Use Conflict Identification Strategy, Redlands, CA: ESRI Press. Chambers, J. Q., Fisher, J. I., Zeng, H., Chapman, E. L., Baker, D. B., and G. C. Hurtt,
2007, "Hurricane Katrina's Carbon Footprint on U. S. Gulf Coast Forests," Science, 318(5853):1107-1107.
Chapin III, F. S., Matson, P. A., and H. A. Mooney, 2002, Principles of Terrestrial
Ecosystem Ecology, New York, NY: Springer. Chen, N., Li, H., and, L. Wang, 2009, "A GIS-Based Approach for Mapping Direct Use
Value of Ecosystem Services at a County Scale: Management Implications," Ecological Economics, 68(11):2768-2776.

126
Conner, R. and A. Hartsell, 2002, "Forest Area and Conditions," in Southern Forest Resource Assessment., Wear, D. N. and J. G. Greis (Eds.), Asheville, NC: U.S. Department of Agriculture, Forest Service, Southern Research Station, 357-402.
Conner, R. C. and R. M. Sheffield, 2006, Analysis of the Timber Situation in Florida,
1995 to 2025, Asheville, NC: U.S. Department of Agriculture, Forest Service, Southern Research Station.
Conte, M., Ennaanay, D., Mendoza, G., Todd Walter, M., Wolny, S., Freyberg, D.,
Nelson, E., and L. Solorzano, 2011, "Retention of Nutrients and Sediment by Vegetation," in Natural Capital: Theory and Practice of Mapping Ecosystem Services, Kareiva, P., H. Tallis, T. H. Ricketts, G. Daily and S. Polasky (Eds.), New York, NY: Oxford University Press, 89-110.
Cooley, T. N. and D. F. Martin, 1979, "Cadmium in Naturally-Occurring water
Hyacinths," Chemosphere, 8(2):75-78. Costanza, R., d'Arge, R., de Groot, R., Farber, S., Grasso, M., Hannon, B., Limburg, K.,
Naeem, S., O'Neill, R. V., Paruelo, J., Raskin, R. G., Sutton, P., and M. van den Belt, 1997, "The Value of the World's Ecosystem Services and Natural Capital," Nature, 387(6630):253-260.
Coulson, D. P., Joyce, L. A., Price, D. T., McKenney, D. W., Siltanen, R. M., Papadopol,
P., and L. Kevin., 2010, Climate Scenarios for the Conterminous United States at the County Spatial Scale Using SRES Scenarios A1B and A2 and Prism Climatology, U.S. Department of Agriculture, Forest Service, Rocky Mountain Research Station (March 19 2012) [http://www.fs.fed.us/rm/data_archive/dataaccess/US_ClimateScenarios_county_A1B_A2_PRISM.shtml].
Cubbage, F. W., Harris Jr, T. G., Wear, D. N., Abt, R. C., and G. Pacheco, 1995,
"Timber Supply in the South: Where Is All the Wood?," Journal of Forestry, 93(7):16-20.
Daily, G. C. (Eds.), 1997, Nature's Services: Societal Dependence on Natural
Ecosystems, Washington, DC: Island Press. Daily, G. C., Polasky, S., Goldstein, J., Kareiva, P. M., Mooney, H. A., Pejchar, L.,
Ricketts, T. H., Salzman, J., and R. Shallenberger, 2009, "Ecosystem Services in Decision Making: Time to Deliver," Frontiers in Ecology and the Environment, 7(1):21-28.
Dale, V. H., Lugo, A. E., MacMahon, J. A., and S. T. A. Pickett, 1998, "Ecosystem
Management in the Context of Large, Infrequent Disturbances," Ecosystems, 1(6):546-557.

127
Davies, Z. G., Edmondson, J. L., Heinemeyer, A., Leake, J. R., and K. J. Gaston, 2011, "Mapping an Urban Ecosystem Service: Quantifying above-Ground Carbon Storage at a City-Wide Scale," Journal of Applied Ecology, 48(5):1125-1134.
de Groot, R. S., Alkemade, R., Braat, L., Hein, L., and L. Willemen, 2010, "Challenges
in Integrating the Concept of Ecosystem Services and Values in Landscape Planning, Management and Decision Making," Ecological Complexity, 7(3):260-272.
DeFries, R. S., Foley, J. A., and G. P. Asner, 2004, "Land-Use Choices: Balancing
Human Needs and Ecosystem Function," Frontiers in Ecology and the Environment, 2(5):249-257.
DeLoach, T. and S. Dicke, 2005. General Forestry Information: Salvaging Timber,
Frequently Asked Questions, Raymond, MS: Mississippi State Extension Service. Duryea, M. L., Kampf, E., and R. C. Littell, 2007, "Hurricanes and the Urban Forest: I.
Effects on Southeastern United States Coastal Plain Tree Species," Arboriculture & Urban Forestry, 33(2):83-97.
Dymond, J. R., Ausseil, A. G. E., Ekanayake, J. C., and M. U. F. Kirschbaum, 2012,
"Tradeoffs between Soil, Water, and Carbon: A National Scale Analysis from New Zealand," Journal of Environmental Management, 95(1):124-131.
Egoh, B., Reyers, B., Rouget, M., Richardson, D. M., Le Maitre, D. C., and A. S. van
Jaarsveld, 2008, "Mapping Ecosystem Services for Planning and Management," Agriculture Ecosystems & Environment, 127(1-2):135-140.
Escobedo, F., Varela, S., Staudhammer, C., Thompson, B., and J. Jarratt, 2009a,
Southern Escambia County, Florida's Urban Forests, Gainesville, FL: University of Florida-IFAS, EDIS. FOR 293.
Escobedo, F. J., Luley, C. J., Bond, J., Staudhammer, C., and C. Bartel, 2009b,
"Hurricane Debris and Damage Assessment for Florida Urban Forests," Arboriculture & Urban Forestry, 35(2):100-106.
ESRI, 2011a, ArcGIS® Desktop: Release 10, Redlands, CA: Environmental Systems
Research Institute. ESRI, 2011b, Classifying Numerical Fields for Graduated Symbology (May 18 2012)
[http://help.arcgis.com/en/arcgisdesktop/10.0/help/index.html#//00s50000001r000000.htm].
ESRI, 2012a, How IDW Works (May 22 2012) [http://help.arcgis.com/en/arcgisdesktop/
10.0/help/index.html#/How_IDW_works/009z00000075000000/].

128
ESRI, 2012b, Zonal Statistics as Table (Spatial Analyst) (May 20 2012) [http://help.arcgis.com/en/arcgisdesktop/10.0/help/index.html#//009z000000w8000000.htm].
European Commission, 2009, Ecosystem Goods and Services, Luxembourg:
Publications Office. Farley, J. and R. Costanza, 2010, "Payments for Ecosystem Services: From Local to
Global," Ecological Economics, 69(11):2060-2068. Florida Department of Environmental Protection, 2007, Water Quality Assessment
Report: Pensacola Bay, Lord, L. (Eds.), Tallahassee, FL. Florida Fish and Wildlife Conservation Commission, 2004. Florida Vegetation and Land
Cover 2003, Tallahassee, FL. Florida Oceans and Coastal Council, 2009, The Effects of Climate Change on Florida’s
Ocean and Coastal Resources: a Special Report to the Florida Energy and Climate Commission and the People of Florida, Tallahassee, FL.
Foley, J. A., DeFries, R., Asner, G. P., Barford, C., Bonan, G., Carpenter, S. R., Chapin,
F. S., Coe, M. T., Daily, G. C., Gibbs, H. K., Helkowski, J. H., Holloway, T., Howard, E. A., Kucharik, C. J., Monfreda, C., Patz, J. A., Prentice, I. C., Ramankutty, N., and P. K. Snyder, 2005, "Global Consequences of Land Use," Science, 309(5734):570-574.
Foster, D. R. and E. R. Boose, 1992, "Patterns of Forest Damage Resulting from
Catastrophic Wind in Central New-England, USA," Journal of Ecology, 80(1):79-98.
Frangi, J. L. and A. E. Lugo, 1991, "Hurricane Damage to a Flood Plain Forest in the
Luquillo Mountains of Puerto Rico," Biotropica, 23(4):324-335. Frick, E. A., 1998, Water Quality in the Apalachicola-Chattahoochee-Flint River Basin,
Georgia, Alabama, and Florida, 1992-95: U.S. Geological Survey [http://pubs.water.usgs.gov/circ1164].
Furniss, M. J., Staab, B. P., Hazelhurst, S., Clifton, C. F., Roby, K. B., Ilhadrt, B. L.,
Larry, E. B., Todd, A. H., Reid, L. M., Hines, S. J., Bennett, K. A., Luce, C. H., and P. J. Edwards, 2010, Water, Climate Change, and Forests: Watershed Stewardship for a Changing Climate, Portland, OR: U.S. Department of Agriculture, Forest Service, Pacific Northwest Research Station.
Gilbert, T. and B. Stys, 2004, Descriptions of Vegetation and Land Cover Types
Mapped Using Landsat Imagery, Tallahassee, FL: Florida Fish and Wildlife Conservation Commission.

129
Gimona, A. and D. van der Horst, 2007, "Mapping Hotspots of Multiple Landscape Functions: A Case Study on Farmland Afforestation in Scotland," Landscape Ecology, 22(8):1255-1264.
Gordon, H. B., Rotstayn, L. D., McGregor, J. L., Dix, M. R., Kowalczyk, E. A., O’Farrell,
S. P., Waterman, L. J., Hirst, A. C., Wilson, S. G., Collier, M. A., Watterson, I. G., and T. I. Elliott, 2002, The CSIRO Mk3 Climate System Model, Aspendale, Australia: CSIRO Atmospheric Research.
Gorte, R. W., 2009, Carbon Sequestration in Forests, Washington, D.C.: Congressional
Research Service. Grimm, N. B., Foster, D., Groffman, P., Grove, J. M., Hopkinson, C. S., Nadelhoffer, K.
J., Pataki, D. E., and D. P. C. Peters, 2008, "The Changing Landscape: Ecosystem Responses to Urbanization and Pollution across Climatic and Societal Gradients," Frontiers in Ecology and the Environment, 6(5):264-272.
Hancock, J., 2010, "The Case for an Ecosystem Service Approach to Decision-Making:
An Overview," Bioscience Horizons, 3(2):188-196. Hanson, C., Yonavjak, L., Clarke, C., Minnemeyer, S., Boisrobert, L., Leach, A., and K.
Schleeweis, 2010, Southern Forests for the Future, Washington, DC: World Resources Institute.
Harmon, M. E., 2001, "Carbon Sequestration in Forests: Addressing the Scale
Question," Journal of Forestry, 99(4):24-29. Hays, B., 2009, "Environmental Setting," in Ecology of Pensacola Bay, Caffrey, J.
(Eds.), 1-38. Heath, L. S. and J. E. Smith, 2000, "An Assessment of Uncertainty in Forest Carbon
Budget Projections," Environmental Science & Policy, 3(2-3):73-82. Heath, L. S., Smith, J. E., Woodall, C. W., Azuma, D. L., and K. L. Waddell, 2011,
"Carbon Stocks on Forestland of the United States, with Emphasis on Usda Forest Service Ownership," Ecosphere, 2(1):1-21.
Hibbert, A. R., 1967, "Forest Treatment Effects on Water Yield," in International
Symposium on Forest Hydrology, Sopper, W. E. and H. W. Lull (Eds.), Oxford, England: Pergamon Press, 527-543.
Hodges, D. G., Gunter, J. T., Swalm, C. M., and J. L. Regens, 1998, Impact of
Urbanization and Environmental Protection Policies on Timber Availability: A GIS Application, Paper read at Proceedings of the First International Conference Geospatial Information in Agriculture and Forestry, 1-3 June 1998, at Lake Buena Vista, FL.

130
Hollis, G., 1977, "Water Yield Changes after the Urbanization of the Canon's Brook Catchment, Harlow, England," Hydrological Sciences Journal, 22(1):61-75.
Horvitz, C. C., Pascarella, J. B., McMann, S., Freedman, A., and R. H. Hofstetter, 1998,
"Functional Roles of Invasive Non-Indigenous Plants in Hurricane-Affected Subtropical Hardwood Forests," Ecological Applications, 8(4):947-974.
Howard, R. A., Matheson, J. E., and D. W. North, 1972, "Decision to Seed Hurricanes,"
Science, 176(4040):1191-1202. Huggett, R., Wear, D. N., Li, R., Coulston, J., and S. Liu, 2002, "Forecasts of Forest
Conditions," in Southern Forest Resource Assessment, Wear, D. N. and J. G. Greis (Eds.), Asheville, NC: U.S. Department of Agriculture, Forest Service, Southern Research Station, 1-71.
ICSU, UNESCO, and UNU, 2008, Ecosystem Change and Human Well-Being:
Research and Monitoring Priorities based on the Millennium Ecosystem Assessment, Paris, France: International Council for Science.
IPCC, 2001, Climate Change 2001: Impacts, Adaptation and Vulnerability, Contribution
of Working Group II to the Third Assessment Report of the Intergovernmental Panel on Climate Change, Cambridge, UK, and New York, USA: Cambridge University Press.
Jacobs, D. M., 2007, Forest Inventory, Catastrophic Events and Historic Geospatial
Assessment in the South, Paper read at ASPRS 2007 Annual Conference, May 7-11, at Tampa, FL.
Jandl, R., Vesterdal, L., Olsson, M., Bens, O., Badeck, F., and J. Roc, 2007, "Carbon
Sequestration and Forest Management," CAB Reviews: Perspectives in Agriculture, Veterinary Science, Nutrition and Natural Resources, 2(17):1-16.
Jenkins, J. C., Chojnacky, D. C., Heath, L. S., and R. A. Birdsey, 2003, "National-Scale
Biomass Estimators for United States Tree Species," Forest Science, 49(1):12-35. Jones, R. C. and C. C. Clark, 1987, "Impact of Watershed Urbanization on Stream
Insect Communities," Water Resources Bulletin, 23(6):1047-1055. Katz, B. G., DeHan, R. S., Hirten, J. J., and J. S. Catches, 1997, "Interactions between
Groundwater and Surface Water in the Suwannee River Basin, Florida," Journal of the American Water Resources Association, 33(6):1237-1254.
Kupfer, J. A., Myers, A. T., McLane, S. E., and G. N. Melton, 2008, "Patterns of Forest
Damage in a Southern Mississippi Landscape Caused by Hurricane Katrina," Ecosystems, 11(1):45-60.

131
Lal, R., 2005, "Forest Soils and Carbon Sequestration," Forest ecology and management, 220(1):242-258.
Leatherman, S. and N. Defraene, 2006, 10 Most Hurricane Vulnerable Areas,
International Hurricane Research Center (02/20 2012) [http://www.fema.gov/emergency/reports/2006/nat112006.shtm].
Li, W., Yang, C., and D. Sun, 2009, "Mining Geophysical Parameters through Decision-
Tree Analysis to Determine Correlation with Tropical Cyclone Development," Computers & Geosciences, 35(2):309-316.
Light, H. M., Darst, M. R., Lewis, L. J., and D. Howell, 2002, Hydrology, Vegetation, and
Soils of Riverine and Tidal Floodplain Forests of the Lower Suwannee River, Florida, and Potential Impacts of Flow Reductions: U.S. Geological Survey.
Liu, S. and R. Costanza, 2010, "Ecosystem Services Valuation in China," Ecological
Economics, 69(7):1387-1388. Lugo, A. E., 2008, "Visible and Invisible Effects of Hurricanes on Forest Ecosystems: An
International Review," Austral Ecology, 33(4):368-398. Martin, J. B., 2007, The Suwannee River: A Coastal Plain Watershed in Transition,
Gainesville, FL: University of Florida, Florida State University, University of South Florida, University of Central Florida, University of Georgia, USGS, USDA, and SRWMD.
McKenzie, E., Irwin, F., Ranganathan, J., Hanson, C., Kousky, C., Bennett, K., Ruffo,
S., Conte, M., Salzman, J., and J. Paavola, 2011, "Incorporating Ecosystem Services in Decisions," in Natural Capital: Theory and Practice of Mapping Ecosystem Services, Kareiva, P., Tallis, H., Ricketts, T. H., Daily, G. and S. Polasky (Eds.), New York, NY: Oxford University Press, 339-355.
McNab, W. H., Cleland, D. T., Freeouf, J. A., Keys, J., J.E., Nowacki, G. J., and C. A.
Carpenter, 2007, Description of Ecological Subregions: Sections of the Conterminous United States, Washington, DC: U.S. Department of Agriculture, Forest Service.
McNulty, S. G., 2002, "Hurricane Impacts on Us Forest Carbon Sequestration,"
Environmental Pollution, 116:S17-S24. Mendoza, G., Ennaanay, D., Conte, M., Todd Walter, M., Freyberg, D., Wolny, S., Hay,
L., White, S., Nelson, E., and L. Solorzano, 2011, "Water Supply as an Ecosystem Service for Hydropower and Irrigation," in Natural Capital: Theory and Practice of Mapping Ecosystem Services, Kareiva, P., Tallis, H., Ricketts, T. H., Daily, G. and S. Polasky (Eds.), New York, NY: Oxford University Press, 53-72.

132
Merry, K. L., Bettinger, P., Grebner, D. L., and J. Hepinstall-Cymerman, 2010, "Perceptions of Foresters of Wind Damage in Mississippi Forests," Southern Journal of Applied Forestry, 34(3):124-130.
Metzger, M. J., Rounsevell, M. D. A., Acosta-Michlik, L., Leemans, R., and D. Schröter,
2006, "The Vulnerability of Ecosystem Services to Land Use Change," Agriculture, Ecosystems & Environment, 114(1):69-85.
Microsoft, 2010, Microsoft Excel, Redmont, Washington: Microsoft. Millennium Ecosystem Assessment, 2003. Ecosystems and Human Well-Being: A
Framework for Assessment, Washington, D.C.: Island Press. Millennium Ecosystem Assessment, 2005. Ecosystems and Human Well-Being:
Synthesis, Washington, D.C.: Island Press. Moore, J., Bartlett, J., Boggs, J. L., Gavazzi, M. J., Heath, L. S., and S. G. McNulty,
2002, "Abiotic Factors," in Southern Forest Resource Assessment, Wear, D. N. and J. G. Greis (Eds.), Asheville, NC: U.S. Department of Agriculture, Forest Service, Southern Research Station, 429-452.
Munn, I. A., Barlow, S. A., Evans, D. L., and D. Cleaves, 2002, "Urbanization's Impact
on Timber Harvesting in the South Central United States," Journal of Environmental Management, 64(1):65-76.
Myers, R. K. and D. H. van Lear, 1998, "Hurricane-Fire Interactions in Coastal Forests
of the South: A Review and Hypothesis," Forest Ecology and Management, 103(2-3):265-276.
Nasi, R., Wunder, S., and J. J. Campos A., 2002. Forest Ecosystem Services: Can
They Pay our Way out of Deforestation?, Bogor, Indonesia: CIFOR for the Global Environmental Facility (GEF).
Natural Capital Project, 2011, Integrated Valuation of Ecosystem Services and
Tradeoffs 2.2.2 (InVEST), Stanford, CA. Natural Resources Conservation Service, 2005, Florida Hydrologic Unit Area Map,
USDA-Natural Resources Conservation Service [http://water.usgs.gov/GIS/huc.html].
Nelson, E., Mendoza, G., Regetz, J., Polasky, S., Tallis, H., Cameron, D. R., Chan, K.
M. A., Daily, G. C., Goldstein, J., Kareiva, P. M., Lonsdorf, E., Naidoo, R., Ricketts, T. H., and M. R. Shaw, 2009, "Modeling Multiple Ecosystem Services, Biodiversity Conservation, Commodity Production, and Tradeoffs at Landscape Scales," Frontiers in Ecology and the Environment, 7(1):4-11.

133
Nelson, G. C., 2005, "Drivers of Ecosystem Change: Summary Chapter," in Ecosystems and Human Well-Being: current State and Trends, Hassan, R., R. Scholes and N. Ash (Eds.), Washington, DC: Island Press, 74-76.
Newell, R. G. and R. N. Stavins, 2000, "Climate Change and Forest Sinks: Factors
Affecting the Costs of Carbon Sequestration," Journal of Environmental Economics and Management, 40(3):211-235.
Nielsen, J. P. and J. M. Norris, 2007. From the River to You: USGS Real-Time
Streamflow Information, Pembroke, NH: U.S. Geological Survey. NOAA-National Hurricane Center, 2012a, Glossary of NHC Terms (May 18 2012)
[http://www.nhc.noaa.gov/aboutgloss.shtml#l]. NOAA-National Hurricane Center, 2012b, NHC Data Archive (March 20 2012)
[http://www.nhc.noaa.gov/pastall.shtml]. Northwest Florida Water Management District, 2006, Surface Water Improvement and
Management Program: Priority List for the Northwest Florida Water Management District, Havana, FL.
Nowak, D. J., Noble, M. H., Sisinni, S. M., and J. F. Dwyer, 2001, "People & Trees -
Assessing the Us Urban Forest Resource," Journal of Forestry, 99(3):37-42. Nowak, D. J., Walton, J. T., Dwyer, J. F., Kaya, L. G., and S. Myeong, 2005, "The
Increasing Influence of Urban Environments on Us Forest Management," Journal of Forestry, 103(8):377-382.
Obreza, T. and G. Means, 2006, Characterizing Agriculture in Florida's Lower
Suwannee River Basin Area: University of Florida-IFAS, EDIS. SS460. Olivas, R., 2007, Decision Tree: A Premier for Decision-Making Professionals (April 28
2012) [http://www.stylusandslate.com/decision_trees/index.html]. Oswalt, S. N. and C. M. Oswalt, 2008, "Relationships between Common Forest Metrics
and Realized Impacts of Hurricane Katrina on Forest Resources in Mississippi," Forest Ecology and Management, 255(5-6):1692-1700.
Peacock, W. G., Brody, S. D., and W. Highfield, 2005, "Hurricane Risk Perceptions
among Florida's Single Family Homeowners," Landscape and Urban Planning, 73(2-3):120-135.
Prestemon, J. P. and R. C. Abt, 2002a, "The Southern Timber Market to 2040," Journal
of Forestry, 100(7):16-22.

134
Prestemon, J. P. and R. C. Abt, 2002b, "Timber Products Supply and Demand," in Southern Forest Resource Assessment, Wear, D. N. and J. G. Greis (Eds.), Asheville, NC: U.S. Department of Agriculture Forest Service, Southern Research Station, 299-325.
PRISM Climate Group and Oregon State University, 2008, Total Precipitation (August
10 2011) [http://prism.oregonstate.edu]. Raudsepp-Hearne, C., Peterson, G. D., and E. M. Bennett, 2010, "Ecosystem Service
Bundles for Analyzing Tradeoffs in Diverse Landscapes," Proceedings of the National Academy of Sciences of the United States of America, 107(11):5242-5247.
Reyers, B., O'Farrell, P. J., Cowling, R. M., Egoh, B. N., Le Maitre, D. C., and J. H. J.
Vlok, 2009, "Ecosystem Services, Land-Cover Change, and Stakeholders: Finding a Sustainable Foothold for a Semiarid Biodiversity Hotspot," Ecology and Society, 14(1):38.
Rodriguez, J. P., Beard, T. D., Jr., Bennett, E. M., Cumming, G. S., Cork, S. J., Agard,
J., Dobson, A. P., and G. D. Peterson, 2006, "Trade-Offs across Space, Time, and Ecosystem Services," Ecology and Society, 11(1):28.
Sabor, A. A., Radeloff, V. C., McRoberts, R. E., Clayton, M., and S. I. Stewart, 2007,
"Adding Uncertainty to Forest Inventory Plot Locations: Effects on Analyses Using Geospatial Data," Canadian Journal of Forest Research-Revue Canadienne De Recherche Forestiere, 37(11):2313-2325.
Schwenning, L., Traci Bruce, T., and L. R. Handley, 2007, "Pensacola Bay," in
Seagrass Status and Trends in the Northern Gulf of Mexico: 1940–2002, Handley, L., D. Altsman and R. DeMay (Eds.): U.S. Geological Survey Scientific Investigations Report, 129-142.
Seidl, R., Rammer, W., Jaeger, D., Currie, W. S., and M. J. Lexer, 2007, "Assessing
Trade-Offs between Carbon Sequestration and Timber Production within a Framework of Multi-Purpose Forestry in Austria," Forest Ecology and Management, 248(1-2):64-79.
Smail, R. A. and D. J. Lewis, 2009, "Forest Land Conversion, Ecosystem Services, and
Economic Issues for Policy a Review," In. Portland, OR: U.S. Dept. of Agriculture, Forest Service, Pacific Northwest Research Station [http://purl.access.gpo.gov/GPO/LPS119022].
Smith, J. E., Heath, L. S., and P. B. Woodbury, 2004, "How to Estimate Forest Carbon
for Large Areas from Inventory Data," Journal of Forestry, 102(5):25-31.

135
Soil Survey Staff, Natural Resources Conservation Service, and Agriculture, U. S. D. A., 2006, U.S. General Soil Map (Statsgo2) (August 10 2011) [http://soildatamart.nrcs.usda.gov].
Stanton, E. A. and F. Ackerman, 2007, Florida and Climate Change: The Costs of
Inaction, Medford, MA: Global Development and Environment Institute, Tufts University and Stockholm Environment Institute–US Center, Tufts University.
Stanturf, J., 2008, Lessons from Katrina and Rita, Compass, 1-2. Stanturf, J. A., Goodrick, S. L., and K. W. Outcalt, 2007, "Disturbance and Coastal
Forests: A Strategic Approach to Forest Management in Hurricane Impact Zones," Forest Ecology and Management, 250(1-2):119-135.
Stavins, R. N., 1999, "The Costs of Carbon Sequestration: A Revealed-Preference
Approach," American Economic Review, 89(4):994-1009. Stys, B., Kautz, R., Reed, D., Kertis, M., Kawula, R., Keller, C., and A. Davis, 2004.
Florida Vegetation and Land Cover Data Derived from 2003 Landsat Etm+ Imagery, Tallahassee, FL: Florida Fish and Wildlife Conservation Commission.
Su, S., Xiao, R., Jiang, Z., and Y. Zhang, 2012, "Characterizing Landscape Pattern and
Ecosystem Service Value Changes for Urbanization Impacts at an Eco-Regional Scale," Applied Geography, 34(2012):295-305.
Sun, G., McNulty, S. G., Lu, J., Amatya, D. M., Liang, Y., and R. K. Kolka, 2005,
"Regional Annual Water Yield from Forest Lands and its Response to Potential Deforestation across the Southeastern United States," Journal of Hydrology, 308(1-4):258-268.
Sun, G., McNulty, S. G., Myers, J. A. M., and E. C. Cohen, 2008, "Impacts of Multiple
Stresses on Water Demand and Supply across the Southeastern United States," Journal of the American Water Resources Association, 44(6):1441-1457.
Swank, W. T., Vose, J. M., and K. J. Elliott, 2001, "Long-Term Hydrologic and Water
Quality Responses Following Commercial Clearcutting of Mixed Hardwoods on a Southern Appalachian Catchment," Forest Ecology and Management, 143(1-3):163-178.
Tallis, H., Ricketts, T., Guerry, A., Wood, S., Sharp, R., Nelson, E., Ennaanay, D.,
Wolny, S., Olwero, N., Vigerstol, K., Pennington, D., Mendoza, G., Aukema, J., Foster, J., Forrest, J., Cameron, D., Arkema, K., Lonsdorf, E., Kennedy, C., Verutes, G., Kim, C., Guannel, G., Papenfus, M., Toft, J., Marsik, M., and J. Bernhardt, 2011, Invest 2.2.2 User’s Guide, Stanford: The Natural Capital Project.

136
Tanner, E. V. J., Kapos, V., and J. R. Healey, 1991, "Hurricane Effects on Forest Ecosystems in the Caribbean," Biotropica, 23(4):513-521.
Tawil, N., 2007, The Potential for Carbon Sequestration in the United States,
Washington, D.C.: Congress of the U.S., Congressional Budget Office. Thorpe, P., Bartel, R., Ryan, P., Albertson, K., Pratt, T., and D. Cairns, 1997, The
Pensacola Bay System Surface Water Improvement and Management Plan: A Comprehensive Plan for the Restoration and Preservation of the Pensacola Bay System. Cairns, D., Macmillan, T., Bartel, R., Culbertson, M., Ryan, P., and P. Thorpe (Eds.). Havana, FL: Hank Montford.
Timilsina, N., Escobedo, F., Cropper, W. P. J., Abd-Elrahman, A., Brandeis, T., Delphin,
S., and S. Lambert, 2011, "A Framework for Identifying Carbon Hotspots and Forest Management Drivers," Unpublished manuscript, last modified March 29 2012.
Troy, A. and M. A. Wilson, 2006, "Mapping Ecosystem Services: Practical Challenges
and Opportunities in Linking GIS and Value Transfer," Ecological Economics, 60(2):435-449.
United States, Department of Commerce, Census Bureau, 2002, International Data
Base: World Population, U.S. Census Bureau, U.S. Department of Commerce (7 March 2012) [http://www.census.gov/population/international/data/idb/informationGateway. php].
United States, Environmental Protection Agency, 2004, The Ecological Condition of the
Pensacola Bay System, Northwest Florida (1994-2001), Gulf Breeze, Florida U.S. Environmental Protection Agency, Office of Research and Development, National Health and Ecological Effects Research Laboratory, Gulf Ecology Division.
United States, Department of Agriculture, Forest Service, ECOMAP Team, 2007,
Ecological Subregions: Sections and Subsections for the Conterminous United States, Washington, DC: U.S.D.A Forest Service.
United States, Geological Survey, Florida Water Science Center, 2008, Florida Potential
and Reference Evapotranspiration 1998-2008 (August 10 2011) [http://hdwp.er.usgs.gov/].
Uriarte, M. and M. Papaik, 2007, "Hurricane Impacts on Dynamics, Structure and
Carbon Sequestration Potential of Forest Ecosystems in Southern New England, USA," Tellus Series a-Dynamic Meteorology and Oceanography, 59(4):519-528.
Vitousek, P. M., Mooney, H. A., Lubchenco, J., and J. M. Melillo, 1997, "Human
Domination of Earth's Ecosystems," Science, 277(5325):494-499.

137
Waage, S., Stewart, E., and K. Armstrong, 2008, Measuring Corporate Impact on Ecosystems: A Comprehensive Review of New Tools: Synthesis Report, San Francisco, CA: Business for Social Responsibility.
Wang, F. and Y. J. Xu, 2009, "Hurricane Katrina-Induced Forest Damage in Relation to
Ecological Factors at Landscape Scale," Environmental Monitoring and Assessment, 156(1-4):491-507.
Wang, F. and Y. J. Xu, 2010, "Comparison of Remote Sensing Change Detection
Techniques for Assessing Hurricane Damage to Forests," Environmental Monitoring and Assessment, 162(1-4):311-326.
Wear, D., 2002a, Forecasts of Land Uses. Wear, D. N. and J. G. Greis (Eds.), Southern
Forest Resource Assessment: Technical Report, Asheville, NC: U.S. Department of Agriculture, Forest Service, Southern Research Station, 1-71.
Wear, D., 2002b, "Land Use," in Southern Forest Resource Assessment: General
Report, Wear, D. N. and J. G. Greis (Eds.), Asheville, NC: U.S. Department of Agriculture, Forest Service, Southern Research Station, 153-173.
Wear, D. N. and J. G. Greis (Eds.), 2002a, Southern Forest Resource Assessment:
Technical Report, Ashville, NC: US Department of Agriculture, Forest Service, Southern Research Station.
Wear, D. N. and J. G. Greis (Eds.), 2002b, Southern Forest Resource Assessment:
Summary Report, Asheville, NC: U.S. Department of Agriculture, Forest Service, Southern Research Station.
Winter, T. C., 1999, Ground Water and Surface Water: A Single Resource, Denver, CO:
U.S. Geological Survey. Woodbury, P. B., Smith, J. E., and L. S. Heath, 2007, "Carbon Sequestration in the Us
Forest Sector from 1990 to 2010," Forest Ecology and Management, 241(1-3):14-27.
Worley, S., 2008, How Much Forest Carbon Is Lost after a Major Hurricane?, Compass,
21-22. Woudenberg, S. W., Conkling, B. L., O'Connell, B. M., LaPoint, E. B., Turner, J. A., and
K. L. Waddell, 2010, The Forest Inventory and Analysis Database: Database Description and User’s Manual Version 4.0 for Phase 2, Fort Collins, CO: U.S. Department of Agriculture, Forest Service, Rocky Mountain Research Station.
Xi, W., Peet, R. K., Decoster, J. K., and D. L. Urban, 2008, "Tree Damage Risk Factors
Associated with Large, Infrequent Wind Disturbances of Carolina Forests," Forestry, 81(3):317-334.

138
Xu, C., Liu, M., An, S., Chen, J. M., and P. Yan, 2007, "Assessing the Impact of Urbanization on Regional Net Primary Productivity in Jiangyin County, China," Journal of Environmental Management, 85(3):597-606.
Yonavjak, L., Hanson, C., Talberth, J., and T. Gartner, 2011. Keeping Forest as Forest:
Incentives for the U.S. South, Washington, DC: World Resources Institute. Zang, S., Wu, C., Liu, H., and X. Na, 2011, "Impact of Urbanization on Natural
Ecosystem Service Values: A Comparative Study," Environmental Monitoring and Assessment, 179(1-4):575-588.
Zektser, I. S. and H. A. Loaiciga, 1993, "Groundwater Fluxes in the Global Hydrologic-
Cycle - Past, Present and Future," Journal of Hydrology, 144(1-4):405-427. Zeng, H., Chambers, J. Q., Negron-Juarez, R. I., Hurtt, G. C., Baker, D. B., and M. D.
Powell, 2009, "Impacts of Tropical Cyclones on Us Forest Tree Mortality and Carbon Flux from 1851 to 2000," Proceedings of the National Academy of Sciences of the United States of America, 106(19):7888-7892.
Zhang, C., Tian, H., Chen, G., Chappelka, A., Xu, X., Ren, W., Hui, D., Liu, M., Lu, C.,
and S. Pan, 2012, "Impacts of Urbanization on Carbon Balance in Terrestrial Ecosystems of the Southern United States," Environmental Pollution, 164:89-101.
Zhang, D. W. and R. V. Nagubadi, 2005, "The Influence of Urbanization on Timberland
Use by Forest Type in the Southern United States," Forest Policy and Economics, 7(5):721-731.
Zhang, L., Dawes, W., and G. Walker, 1999, Predicting the Effect of Vegetation
Changes on Catchment Average Water Balance, Canberra: Cooperative Research Centre for Catchment Hydrology.
Zhang, L., Dawes, W., and G. Walker, 2001, "Response of Mean Annual
Evapotranspiration to Vegetation Changes at Catchment Scale," Water resources research, 37(3):701-708.
Zheng, D., Heath, L. S., and M. J. Ducey, 2012, "Potential Overestimation of Carbon
Sequestration in the Forested Wildland-Urban Interface in Northern New England," Journal of Forestry, 110(2):105-111.
Zwick, P. and M. Carr, 2006, Florida 2060: A Population Distribution Scenario for the
State of Florida, Gainesville, FL: GeoPlan Center-University of Florida.

139
BIOGRAPHICAL SKETCH
Sonia Elsa Rocio Delphin Perez was born in Asuncion, Paraguay in 1980. She got
a bachelor degree in forest engineering from the National University of Asuncion in
2005. Her thesis analyzed forests fires based on remote sensing and geographic
information systems (GIS) methods. After graduation, she joined an environmental
consulting firm focusing her work in the use of GIS to analyze forest ecosystems. She
worked there for 2 and half years. Later, she started working for World Wildlife Fund
(WWF) in Paraguay as a GIS analyst. Her work was focused on the monitoring of the
deforestation in the Upper Parana Atlantic Forest in the Eastern Region of Paraguay
based on Landsat satellite imagery. Her job also included different GIS analysis of
forests and GIS training to environmental employees from the Paraguayan Government.
She has been working there for 2 and half years. During that time she continued her
education in GIS and remote sensing at the Kansas State University and the
Polytechnic University of Madrid. She entered at the School of Forest Resources and
Conservation at the University of Florida in the fall 2010 to get a master’s degree and
she was graduated in August 2012.