effect of the number of tractor passes on soil rut depth and compaction in two tillage regimes
TRANSCRIPT
Ei
Ga
b
c
A
A
R
R
A
K
R
S
S
6
0
d
ffect of the number of tractor passes on soil rut depth and compactionn two tillage regimes
.F. Botta a,b,*, A. Tolon Becerra c, F. Bellora Tourn a
University of Buenos Aires, Agronomy Faculty, Av. San Martın 4453, 1427 Buenos Aires, Argentina
National University of Lujan, Technology Department, 6700 Lujan, Argentina
University of Almerıa, E.T.S.I.A. Agronomos, Almerıa, Spain
Soil & Tillage Research 103 (2009) 381–386
R T I C L E I N F O
rticle history:
eceived 18 August 2008
eceived in revised form 7 December 2008
ccepted 10 December 2008
eywords:
epeated traffic
oil bearing capacity
oil compaction
A B S T R A C T
The initially high level of soil compaction in some direct sowing systems might suggest that the impact of
subsequent traffic would be minimal, but data have not been consistent. In the other hand on freshly
tilled soils, traffic causes significant increments in soil compaction. The aim of this paper was to quantify
the interaction of the soil cone index and rut depth induced by traffic of two different weight tractors in
two tillage regimes: (a) soil with 10 years under direct sowing system and (b) soil historically worked in
conventional tillage system. Treatments included five different traffic frequencies (0, 1, 3, 5 and 10
passes repeatedly on the same track). The work was performed in the South of the Rolling Pampa region,
Buenos Aires State, Argentina at 348550S, 578570W. Variables measured were (1) cone index in the 0–
600 mm depth profile and (2) rut depth. Tyre sizes and rut depth/tyre width ratio are particularly
important respect to compaction produced in the soil for different number of passes. Until five passes of
tractor (2WD), ground pressure is responsible of the topsoil compaction. Until five passes the tyre with
low rut depth/tyre width ratio reduced topsoil compaction. Finally, the farmer should pay attention to
the axle load, the tyre size and the soil water content at the traffic moment.
� 2008 Elsevier B.V. All rights reserved.
Contents lists available at ScienceDirect
Soil & Tillage Research
journa l homepage: www.e lsev ier .com/ locate /s t i l l
1. Introduction and literature review
In Argentina 16 million hectares cropped are grown undercontinuous direct sowing (DS) system, the rest, approximately 22million hectares, are cultivated under conventional tillage (CT)system. Direct drilling systems usually have lower trafficintensities than those using conventional tillage, however, afterseveral years of continuous direct drilling, yields tend to decrease.This could be the result of increased weed control problems androot diseases as well as a gradual increase in soil compaction due toagricultural traffic.
Highly compacted soil, particularly in the surface layers,generates inadequate soil physical conditions for seedling emer-gence. Therefore, the challenge is to attain a suitable seedbed whileminimizing traffic-induced soil compaction, so that the soilphysical properties do not diminish normal root growth (Bottaet al., 2004). Strain force and compaction degrade soil bydecreasing water infiltration and water holding capacity, increas-ing runoff and erosion, increasing crop production problems,thereby decreasing crop yields and profitability of farming systems
* Corresponding author at: National University of Lujan, Technology Department,
700 Lujan, Argentina. Tel.: +54 2323 422350; fax: +54 2323 422350.
E-mail address: [email protected] (G.F. Botta).
167-1987/$ – see front matter � 2008 Elsevier B.V. All rights reserved.
oi:10.1016/j.still.2008.12.002
(Way et al., 2005). The soil parameters usually identified as themost critical in over-compacted soils are aeration, bulk density andcone index (CI) (Hakansson et al., 1988).
The most obvious visual indicator of topsoil compaction is rutdepth affected by agricultural tractor and machinery’s traffic onthe soil. That rut depth will be principally related with initial soilcondition, inflation pressure, tyre width and number of passes(Botta et al., 2006). Davies et al. (1973) considered rut depth as themain indicator of compaction after trafficking. Chancellor (1976)reports that all the porosity reduction (measured with X-rays) inthe soil, when applied superficial high load, was similar to thedepression caused by traffic over the soil surface. The same authoradjudicates a great importance to the relation between rut depthand tyre’s width, for different loads, as an indicator of thecompaction depth distribution. Low rut depth/tyre width ratioindicates that most of the compaction happens close to the topsoilwhere the soil is more affected not only by tyre’s inflationpressures, but also by the pressure in the contact area. According toRaper et al. (1994), by increasing inflation pressure, the width ratiois decreased, but this has low effects on the ground pressure. Thegreater effect, according to the same authors, on the groundpressure is related to the tyre’s load, because when it is increasedthere is a widening of the tyre at the same time that the soil isdeformed, indicating that the greater pressure on the soil is in thecenterline of the rut. Smith and Dickson (1992), on soil bin, found
G.F. Botta et al. / Soil & Tillage Research 103 (2009) 381–386382
that compaction on the surface layer is determined by the groundpressure. However, for Hakansson et al. (1988) subsoil compactionis directly influenced by total load being independent of the groundpressure.
For the number of passes is known that the second and nextpasses of the tyre causes less compaction than the first one.However, this response to traffic is related to the initial level of soilcompaction and the distribution in deep layers (Soane, 1980).Ljungars (1977) affirms that in some cases a lineal rise of the coneindex may occur over the sixth pass, however, remarks the need forstudying the response to repeated passes and initial soil conditionwhere the traffic occurs. Raghavan and McKyes (1978) comparedthe compaction produced by the number of passes for different sizeof tyres with an approximate load of 14 kN. The 16.9–28 tyresproduced an increase of the soil bulk density even after the fifthpass, exceeding this, the increase was lower. In the other hand18.4–30 tyres produced a lineal rise of the cone index over thetenth pass.
In Argentina, soybean (Glycine max L.) is grown mainly onclayey soils (2.6 million ha). These soils are very susceptible toheavy traffic compaction. Narro Farias (1994) advises that soil coneindex, in fine textured soil, should not exceed 1000 kPa, becausehigher values can harm root growth. Terminiello et al. (1998)found, in west Pampas region, that cone index values over1150 kPa produced reduction, in the dry root weight, of cabbagecrop (Brassica oleracea L.) in approximately 32%. Jorajuria et al.(1997) found in west pampas region that dry bulk density valuesover 0.937 Mg m�3 at 0–300 mm depth range produced a decreasein pasture yield of approximately 76%.
Data from research that compare yield effects in the presenceand absence of random traffic on no tillage soils are less extensivethan those from conventional tillage systems. Campbell andHunter (1986) working on imperfectly drained clay loam inScotland showed that even with fairly modest wheel loads, notillage yields were reduced when compared with not traffickedareas. However, this only occurred in the early years of no tillageand differences were absent by the fourth season despite noreduction in bulk density on the trafficked soil. In contrast, Bottaet al. (2004) working with soybeans on clayey soil found that yieldswere reduced in 9.8%, 22.6% and 38% for 4, 6 and 8 passesrespectively with a 39 kN tractor. Also, Botta et al. (2007), after 3years of studies on clayey soil found that, comparing trafficintensities between 15.2 Mg km�1 ha�1 and 38.45 Mg km�1 ha�1
in soybean, yields reductions were approximately 23.5%. Soza et al.(2003) found, in the east Pampas region on a soil with high claycontent, that cone index values >1200 kPa reduced wheat(Triticum aestivum L.) emergence by 26%. Also in Argentina, Ressiaet al. (1998) advised that in clay soil, dry bulk density values
Table 1Typical soil profile.
HORIZONS Ap A12 B1
Depth range (cm) 0–15 16–22 23–35
Organic carbon (%) 1.74 1.35 0.93
Total nitrogen (%) 0.24 0.14 0.10
Clay (<2 mm) 21.2 25.5 24.9
Silt (2–20 mm) 32.3 34.7 29.8
Silt (2–50 mm) 75.6 70.8 67.2
Fine Sand (100–250 mm) 0.3 0.2 0.3
pH 5.4 5.3 5.5
pH in H2O (1:2.5) 5.8 5.8 6.0
Cation exchange capacity (m.e. 100 g�1)
Ca2+ 11.4 12.7 12.0
Mg2+ 2.9 2.5 3.1
Na+ 0.2 0.1 0.2
K+ 1.4 1.0 0.9
>1.2 Mg m�3 at 200 mm depth produced a 30% decrease in corn(Zea mays L.) yield.
The objective of the present work is to study the relationbetween rut depth and number of passes and the compactioncaused by two different load tractors traffic on two soil mechanicconditions: (a) soil with 10 years under direct sowing system and(b) soil historically worked in conventional tillage system.
2. Equipment and test procedure
2.1. The site
The work was performed in the south of the Rolling Pamparegion, Buenos Aires State, Argentina at 348360S, 588400W, altitude14.8 m over sea level, slope type 1, gradient 0.5–1%, well drained,drainage class 4, no stony class 0. The soil was a fine clayey, illitic,thermic Typical Argiudol (Soil Conservation Service, 1994), with anorganic matter content ranging from 3.4% (w/w) in the surface to1.2 at 600 mm depth. Typical profile characteristics shown inTable 1. Previous history of soil management included, 10 years ofa very usual regional alternative in crop rotation, wheat (Triticum
aestivum) in winter, followed of a soybean (G. max), in summer.Two tillage regimes were prepared: (a) conventional tillage, soil
was moldboard ploughed at 200 mm depth after soybean harvest-ing, then harrowed with a light disk harrow (vertical load of 450 N/disk), to prepare the seedbed for wheat. After wheat harvesting,soil was chisel plowed to a depth of 280 mm and then tilled with aheavier disk harrow (vertical load of 850 N/disk), at an averagedepth of 150 mm, and then the soybean was seeded, (b) soil indirect sowing condition, soil with 10 years under direct sowingsystem.
2.2. Experimental treatments
Five treatments were imposed on plots 100 m long � 7 m wide(700 m2) each one, where the experimental variable was trafficfrequency of 0, 1, 3, 5 and 10 tractor passes in the same tracks, with3 m wide buffer zones between plots to avoid interactions. Plotswere in completely randomized blocks having three replications.Each experimental plot (CT and DS) were trafficked with 0, 1, 3, 5and 10 passes of two 2WD tractors equipped with single rear tyres:Light (L) and Heavy (H) (Table 2), tractors speed was 5.5 km h�1. Nohitch load was applied to the tractors during the experiment.Statistical analyses were performed utilizing the Statgraf program7.1. An analysis of variance (ANOVA) was carried out on the dataand means were analyzed by Duncan’s multiple range test. Thesetractors were models usually used on commercial farms in theexperimental area. The numbers of passes were selected in order to
B21t B22t B23t B3 Cca
35–60 65–80 90–110 120–150 160–220
0.63 0.50 0.31 0.22 0.14
0.085 0.075 0.058 0.042 –
33.2 47.5 33.0 23.0 15.8
29.3 20.8 31.2 32.9 28.7
61.3 50.0 63.0 72.7 79.9
0.4 0.4 0.4 0.5 0.4
5.5 5.8 6.0 6.0 7.5
6.2 6.5 6.4 6.4 7.9
13.8 18.3 17.2 16.5 –
4.5 6.5 6.4 3.8 –
0.1 0.2 0.2 0.3 0.5
1.3 2.3 2.4 2.3 2.4
Table 2Tractors characteristics.
Tractor 2WD
heavy
2WD
light
Engine power (CV/kW) 109/80 85/62
Front tyres 1100–16 600–16
Rear tyres (single) 23.1R 30 18.4R 34
Inflation pressure, front tyre (kPa)a 200 180
Inflation pressure, rear tyre (kPa)a 60 60
Total weight (kN) 58 42
Front weight (kN) 18 12
Rear weight (kN) 40 30
Front wheel track width (mm) 2000 1550
Rear wheel track width (mm) 2200 1700
Front tyre–soil contact area in conventional tillage (m2) 0.220 0.141
Rear tyre–soil contact area in conventional tillage (m2) 0.303 0.182
Ground pressure front tyre in conventional tillage (kPa) 40 41.7
Ground pressure rear tyre in conventional tillage (kPa) 66 81
Front tyre–soil contact area in direct sowing (m2) 0.200 0.12
Rear tyre–soil contact area in direct sowing (m2) 0.273 0.171
Ground pressure front tyre in direct sowing (kPa) 44.1 49
Ground pressure rear tyre in direct sowing (kPa) 73.2 86
a The tyre inflation pressure was within the range advised by the web page of
Firestone Agricultural Tyre Division.
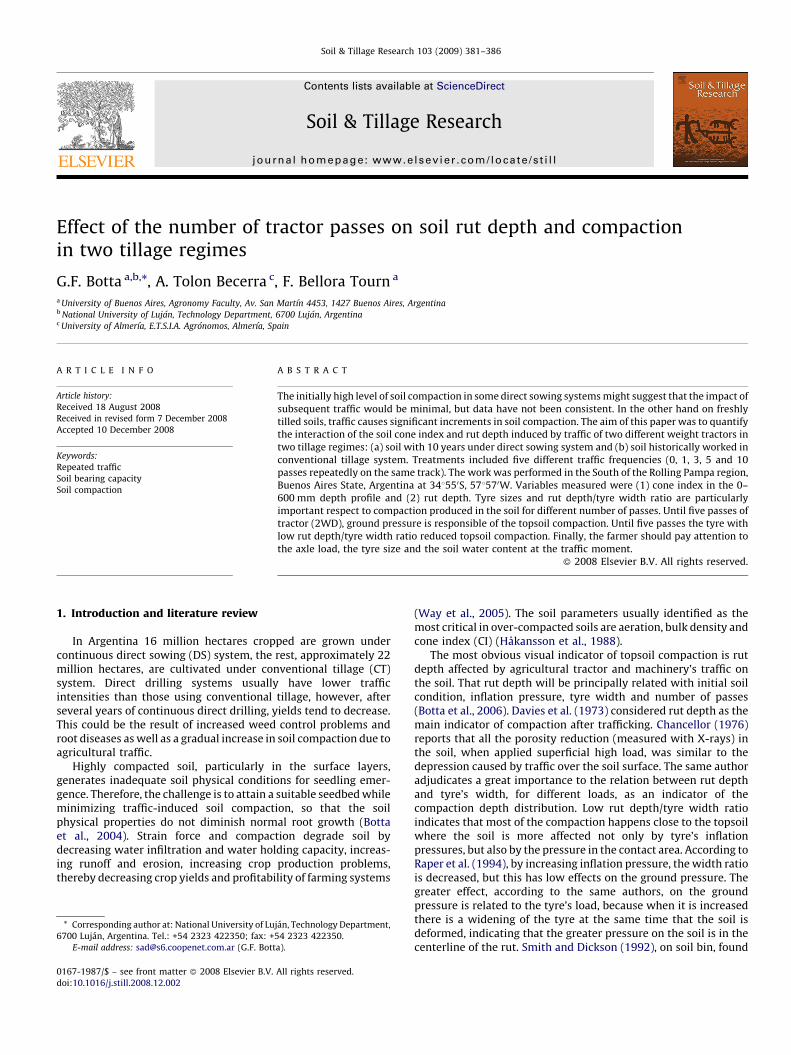
Fig. 1. Soil moisture content of the maximum compaction (Standard Proctor test, 0–
200 mm).
G.F. Botta et al. / Soil & Tillage Research 103 (2009) 381–386 383
simulate the typical traffic intensity in the region under study. Theintensity responds to the combination of load and number ofpasses of the used machinery in both tillage systems.
The tyre/soil contact area was measured on the experimentalfield by reversing or driving the tractor into the field and sprayingthe area around the tyre with paint. An hydraulic lift was thenused to raise the tractor so that the tyre impression could be placedonto a sheet of glass, transferred to paper, and measured with aplanimeter. Average ground pressure was estimated as the totalaxle load divided by the tyre–soil contact area for both tyres on theaxle. Finally tyre’s widths were measured in the field under workconditions (axle load and inflation pressure).
2.3. Soil response variables
Experimental variables related to soil compaction were:
� C
one index measured with a Rimick CP20 recording penetrom-eter from the soil surface to a maximum depth of 600 mm. Datawere recorded at depth increments of 50 mm, and the conedimensions were 308 cone angle, 130 mm2 projected area, and12.83 mm diameter (S 313.2, 1993). Cone index was the averageof 15 measurements per plot. � RTable 3Values of rut depth (mm) measured for Light (L) and Heavy (H) tractor for 1, 3, 5 and
10 passes in soil under conventional tillage (CT).
Number of passes L1 L3 L5 L10 H1 H3 H5 H10
Rut depth 76 a 81 a 93 b 108 c 68 a 73 a 85 b 145 d
Different letters in depth show significant differences among treatments (P < 0.01
Duncan’s multiple range test).
Table 4Values of rut depth (mm) measured for Light (L) and Heavy (H) tractors for 1, 5 and
10 passes in soil under direct sowing (DS).
Number of passes L1 L3 L5 L10 H1 H3 H5 H10
Rut depth 43 a 50 a 61 b 80 c 34 a 41 a 53 b 95 d
Different letters in depth show significant differences among treatments (P < 0.01
Duncan’s multiple range test).
ut depth was measured using a profile meter consisting of a setof vertical metal rods (length 500 mm and diameter 5 mm),spaced at 25 mm horizontal intervals, sliding through holes in a1 m long iron bar. The bar was placed across the wheel tracksperpendicular to the direction of travel and rods were positionedin order to conform to the shape of the depression. Ruth depthwas calculated as the average depth of 40 reads on the 1 m bar.
For each traffic treatment, cone index, soil water content and rutdepth were measured at 2-m intervals along a 50-m transect withinthe wheel track. All measurements were made in the centerlines ofthe tyre tracks because this is where the compressive effects tend toconcentrate (Sohne, 1958).
The soil water content (w/w) present during traffic was 20.0% inthe surface 0–200 mm, 22.0% at 200–400 mm and 23.5% at 400–600 mm. The soil water content of 0–200 mm is 4.8% below thewater content of the maximum compaction for this soil (24.8%) bythe standard Proctor compaction test (1933) (Fig. 1). Soil watercontent measured with a gamma ray and neutron probe (Troxler3440) over the depth ranges: 0–200 mm, 200–400 mm and within
a trench at 400–600 mm depth. In soils with high organic matter,the neutron probe can overestimate soil water content substan-tially, this parameter was verified by gravimetric and cylindermethods respectively.
3. Results and discussion
The rut depth measured results, on conventional tillage anddirect sowing, are shown in Tables 3 and 4 respectively. In bothtillage regimes, heavy and light tractors did not differentiatesignificantly between themselves when they were trafficked one,three and five times, but there was a difference when traffic raisedup to 10 passes. Until the fifth pass the lower values of rut depthand cone index, were produced by the heavy tractor, which can beexplained by the lower ground pressure of this tractor respect thelight one.
The greater rut depth values for both tractors were produced onsoil under conventional tillage; this is because of the highcompressibility of this weak soil, as shown by its low cone indexvalues compared to direct sowing. On the other hand, if the groundis relatively firm (soil in DS) and the sum of inflation pressure andpressure by the carcass is less than the pressure exerted by the soil,then the portion of the tyre in contact with terrain will have asignificant deflection and the tyre will be more deformed biggerthan the soil.
For the cone index values, in both soil conditions, areimportant to compare heavy and light tractors. In topsoil, up tofive passes of the heavy and light tractors, as in one and threepasses, the cone index values (Tables 5 and 6) responded to theground pressure being higher in absolute value for the lighttractor. This is confirmed because, until fifth pass, as shown in

Table 5Cone index (kPa) values measured in the centerlines of the tyre tracks for Light (L)
and Heavy (H) tractors after 1, 3, 5 and 10 passes in three depth ranges in soil under
conventional tillage (CT).
Depth (mm) 0–200 200–400 400–600
Control plot 152.5 a 617 a 1348 a
Tractor Light 1 pass 927 c 1100 b 1397 a
Tractor Heavy 1 pass 800 b 1472 c 1556 b
Tractor Light 3 passes 980 c 1260 c 1427 a
Tractor Heavy 3 passes 907 c 1610 d 1670 c
Tractor Light 5 passes 1071 c 1340 c 1500 b
Tractor Heavy 5 passes 1001 c 1666 d 1799 d
Tractor Light 10 passes 1302 e 1492 c 1704 d
Tractor Heavy 10 passes 1989 f 2045 e 2230 e
Values with different letters (vertically) show significant differences among
treatments (P < 0.01 Duncan’s multiple range test).
Table 6Cone index (kPa) values measured in the centerlines of the tyre tracks for Light (L)
and Heavy (H) tractors after 1, 3, 5 and 10 passes in three depth ranges in soil under
direct sowing (DS).
Depth (mm) 0–200 200–400 400–600
Control plot 429 a 714.9 a 1422 a
Tractor Light 1 pass 740.5 b 869 b 1430 a
Tractor Heavy 1 pass 450 a 1059 c 1480 a
Tractor Light 3 passes 800 b 980 b 1450 a
Tractor Heavy 3 passes 540 a 1370 d 1495 a
Tractor Light 5 passes 847.5 b 1133 c 1458 a
Tractor Heavy 5 passes 794 b 1426 d 1510 a
Tractor Light 10 passes 1044 c 1449 d 1547 ab
Tractor Heavy 10 passes 1602 d 1965 e 2002 c
Values with different letters (vertically) show significant differences among
treatments. (P < 0.01 Duncan’s multiple range test).
Table 7Ratios of tyre rut depth to rear tyre section width (D/W) for Light (L) and Heavy (H)
tractors in 1, 3, 5 and 10 passes in soil under direct sowing (DS).
Tractor and
number of passes
L1 L3 L5 L10 H1 H3 H5 H10
D/W 0.09 0.107 0.130 0.171 0.06 0.07 0.09 0.162
Table 8Ratios of tyre rut depth to rear tyre section width (D/W) for Light (L) and Heavy (H)
tractors in 1, 3, 5 and 10 passes in soil under conventional tillage (CT).
Tractor and
number of passes
L1 L3 L5 L10 H1 H3 H5 H10
D/W 0.162 0.173 0.199 0.231 0.116 0.125 0.145 0.247
Fig. 2. Relationship between cone index in topsoil (0–200 mm) and tractor passes (1, 3 an
DS (direct sowing).
Fig. 3. Relationship between cone index and tractor passes (200–400 mm depth range)
(direct sowing).
G.F. Botta et al. / Soil & Tillage Research 103 (2009) 381–386384
Fig. 2, the light tractor caused in both soils higher values in coneindex than the heavy tractor, also in Fig. 2, for heavy and lighttractors, it can be seen that there is a strongly positiverelationship between tractor passes and cone index in bothtillage regimes.
The light tractor used narrower tyres than the heavy tractor,which caused a higher pressure on the soil (81 kPa) of the lighttractor compared with the heavy tractor (66 kPa) for conven-tional tilled soil and 86 kPa and 73.2 kPa for soil under directsowing respectively. Until five passes, these results confirm thatground pressure produced a bigger increase in CI in topsoil thanin the subsoil, the influence of rut depth on subsoil compaction isnot clear. From Tables 7 and 8, it can be inferred that tyres with alow rut depth/rut width ratio (D/W) produced, only until the fifthpass, the lower cone index values, nearer the surface than theones with a high (D/W), according with Chancellor (1976)(Tables 5 and 6).
d 5) for heavy and light tractors in two tillage regimes, CT (conventional tillage) and
for heavy and light tractors in two tillage regimes, CT (conventional tillage) and DS
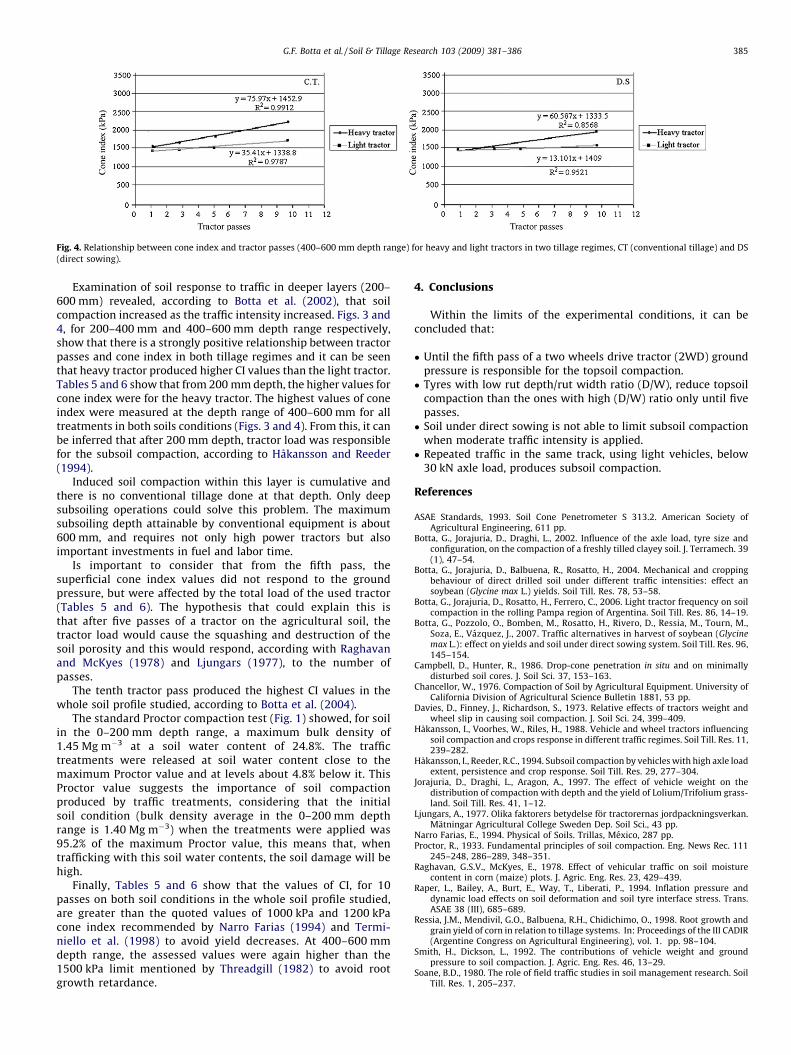
Fig. 4. Relationship between cone index and tractor passes (400–600 mm depth range) for heavy and light tractors in two tillage regimes, CT (conventional tillage) and DS
(direct sowing).
G.F. Botta et al. / Soil & Tillage Research 103 (2009) 381–386 385
Examination of soil response to traffic in deeper layers (200–600 mm) revealed, according to Botta et al. (2002), that soilcompaction increased as the traffic intensity increased. Figs. 3 and4, for 200–400 mm and 400–600 mm depth range respectively,show that there is a strongly positive relationship between tractorpasses and cone index in both tillage regimes and it can be seenthat heavy tractor produced higher CI values than the light tractor.Tables 5 and 6 show that from 200 mm depth, the higher values forcone index were for the heavy tractor. The highest values of coneindex were measured at the depth range of 400–600 mm for alltreatments in both soils conditions (Figs. 3 and 4). From this, it canbe inferred that after 200 mm depth, tractor load was responsiblefor the subsoil compaction, according to Hakansson and Reeder(1994).
Induced soil compaction within this layer is cumulative andthere is no conventional tillage done at that depth. Only deepsubsoiling operations could solve this problem. The maximumsubsoiling depth attainable by conventional equipment is about600 mm, and requires not only high power tractors but alsoimportant investments in fuel and labor time.
Is important to consider that from the fifth pass, thesuperficial cone index values did not respond to the groundpressure, but were affected by the total load of the used tractor(Tables 5 and 6). The hypothesis that could explain this isthat after five passes of a tractor on the agricultural soil, thetractor load would cause the squashing and destruction of thesoil porosity and this would respond, according with Raghavanand McKyes (1978) and Ljungars (1977), to the number ofpasses.
The tenth tractor pass produced the highest CI values in thewhole soil profile studied, according to Botta et al. (2004).
The standard Proctor compaction test (Fig. 1) showed, for soilin the 0–200 mm depth range, a maximum bulk density of1.45 Mg m�3 at a soil water content of 24.8%. The traffictreatments were released at soil water content close to themaximum Proctor value and at levels about 4.8% below it. ThisProctor value suggests the importance of soil compactionproduced by traffic treatments, considering that the initialsoil condition (bulk density average in the 0–200 mm depthrange is 1.40 Mg m�3) when the treatments were applied was95.2% of the maximum Proctor value, this means that, whentrafficking with this soil water contents, the soil damage will behigh.
Finally, Tables 5 and 6 show that the values of CI, for 10passes on both soil conditions in the whole soil profile studied,are greater than the quoted values of 1000 kPa and 1200 kPacone index recommended by Narro Farias (1994) and Termi-niello et al. (1998) to avoid yield decreases. At 400–600 mmdepth range, the assessed values were again higher than the1500 kPa limit mentioned by Threadgill (1982) to avoid rootgrowth retardance.
4. Conclusions
Within the limits of the experimental conditions, it can beconcluded that:
� U
ntil the fifth pass of a two wheels drive tractor (2WD) groundpressure is responsible for the topsoil compaction. � T yres with low rut depth/rut width ratio (D/W), reduce topsoilcompaction than the ones with high (D/W) ratio only until fivepasses.
� S oil under direct sowing is not able to limit subsoil compactionwhen moderate traffic intensity is applied.
� R epeated traffic in the same track, using light vehicles, below30 kN axle load, produces subsoil compaction.
References
ASAE Standards, 1993. Soil Cone Penetrometer S 313.2. American Society ofAgricultural Engineering, 611 pp.
Botta, G., Jorajuria, D., Draghi, L., 2002. Influence of the axle load, tyre size andconfiguration, on the compaction of a freshly tilled clayey soil. J. Terramech. 39(1), 47–54.
Botta, G., Jorajuria, D., Balbuena, R., Rosatto, H., 2004. Mechanical and croppingbehaviour of direct drilled soil under different traffic intensities: effect ansoybean (Glycine max L.) yields. Soil Till. Res. 78, 53–58.
Botta, G., Jorajuria, D., Rosatto, H., Ferrero, C., 2006. Light tractor frequency on soilcompaction in the rolling Pampa region of Argentina. Soil Till. Res. 86, 14–19.
Botta, G., Pozzolo, O., Bomben, M., Rosatto, H., Rivero, D., Ressia, M., Tourn, M.,Soza, E., Vazquez, J., 2007. Traffic alternatives in harvest of soybean (Glycinemax L.): effect on yields and soil under direct sowing system. Soil Till. Res. 96,145–154.
Campbell, D., Hunter, R., 1986. Drop-cone penetration in situ and on minimallydisturbed soil cores. J. Soil Sci. 37, 153–163.
Chancellor, W., 1976. Compaction of Soil by Agricultural Equipment. University ofCalifornia Division of Agricultural Science Bulletin 1881, 53 pp.
Davies, D., Finney, J., Richardson, S., 1973. Relative effects of tractors weight andwheel slip in causing soil compaction. J. Soil Sci. 24, 399–409.
Hakansson, I., Voorhes, W., Riles, H., 1988. Vehicle and wheel tractors influencingsoil compaction and crops response in different traffic regimes. Soil Till. Res. 11,239–282.
Hakansson, I., Reeder, R.C., 1994. Subsoil compaction by vehicles with high axle loadextent, persistence and crop response. Soil Till. Res. 29, 277–304.
Jorajuria, D., Draghi, L., Aragon, A., 1997. The effect of vehicle weight on thedistribution of compaction with depth and the yield of Lolium/Trifolium grass-land. Soil Till. Res. 41, 1–12.
Ljungars, A., 1977. Olika faktorers betydelse for tractorernas jordpackningsverkan.Matningar Agricultural College Sweden Dep. Soil Sci., 43 pp.
Narro Farias, E., 1994. Physical of Soils. Trillas, Mexico, 287 pp.Proctor, R., 1933. Fundamental principles of soil compaction. Eng. News Rec. 111
245–248, 286–289, 348–351.Raghavan, G.S.V., McKyes, E., 1978. Effect of vehicular traffic on soil moisture
content in corn (maize) plots. J. Agric. Eng. Res. 23, 429–439.Raper, L., Bailey, A., Burt, E., Way, T., Liberati, P., 1994. Inflation pressure and
dynamic load effects on soil deformation and soil tyre interface stress. Trans.ASAE 38 (III), 685–689.
Ressia, J.M., Mendivil, G.O., Balbuena, R.H., Chidichimo, O., 1998. Root growth andgrain yield of corn in relation to tillage systems. In: Proceedings of the III CADIR(Argentine Congress on Agricultural Engineering), vol. 1. pp. 98–104.
Smith, H., Dickson, L., 1992. The contributions of vehicle weight and groundpressure to soil compaction. J. Agric. Eng. Res. 46, 13–29.
Soane, B.D., 1980. The role of field traffic studies in soil management research. SoilTill. Res. 1, 205–237.

G.F. Botta et al. / Soil & Tillage Research 103 (2009) 381–386386
Sohne, W., 1958. Fundamentals of pressure distribution and soil compaction undertractors tyres. Agric. Eng. 39, 276–281.
Soil Conservation Service, 1994. Keys to Soil Taxonomy, 6th ed. Soil Survey Staff,USDA, Washington, DC, USA.
Soza, E., Botta, G., Tourn, M., 2003. Direct sowing of wheat (Triticum aestivum L.):implantation efficiency with relation of soil compaction in the moment ofsowing. J. Agro-Ciencia Chile 19, 121–128.
Terminiello,A.M.,Clverie, J.,Casado, J.,Balbuena,R.,1998.Coneindexevolutionthroughthe growth season of cabbage crop (Brassica oleracea L.). In: Proceedings of the IVCADIR (Argentine Congress on Agricultural Engineering), vol. 1. pp. 68–73.
Threadgill, E., 1982. Residual tillage effects as determined by cone index. Trans.ASAE 25 859–863 and 867.
Way, T., Erbach, D., Bailey, A., Burt, E., Johnson, E., 2005. Soil displacement beneathan agricultural tractor drive tyre. J. Terramech. 2005, 35–46.