effect of substrate contact angle on ink transfer in ... · microfluidics module of comsol...
TRANSCRIPT

Effect of Substrate Contact Angle on Ink Transfer in Flexographic Printing F. E. HIZIR*1, D. E. HARDT1 1Massachusetts Institute of Technology *Corresponding author: MIT, Department of Mechanical Engineering, 77 Massachusetts Ave., Cambridge, MA 02139; [email protected] Abstract: Flexography is a roll-based mass printing process used in manufacture of printed products such as sensors, self-cleaning surfaces, and flexible electronics. Flexography involves inking of a stamp wrapped around a roller, and the transfer of ink on the stamp surface to a printing substrate as the roller rotates against it (Figure 1). The ink transfer ratio from the stamp surface to the printing substrate is an important parameter of the system, as it determines printing quality and the thickness of the printed product. In this study, ink transfer from the stamp to the printing substrate is simulated for two cases (equal and unequal contact angles on the two surfaces) using the moving mesh interface, and the laminar two-phase flow, phase field interface in microfluidics module of COMSOL software. Simulation results indicate an increase in ink transfer ratio to the substrate, as the ink contact angle on its surface is reduced. Keywords: Flexography, ink transfer, contact angle, moving mesh, phase field. 1. Introduction Flexography is a roll-based mass printing processes used in manufacture of printed products such as sensors, self-cleaning surfaces and flexible electronics [1-2]. Flexography uses a cylinder with engravings on its surface (the engraved roller) for ink transfer to the substrate from an ink supply. Subsequent steps of the flexographic printing process (Figure 1) are: 1) Inking of the engraved roller 2) Blading of the engraved roller to meter an exact volume of ink into the roll cells 3) Ink transfer from the engraved roller to a patterned elastomer stamp surface 4) Ink transfer to the substrate surface from the stamp surface.
In this study, we examine how ink contact angle on the substrate surface affects the ink transfer ratio from the stamp surface to the printing substrate during the fourth step of the flexographic printing process.
Figure 1. Schematic of flexographic printing process Results of this study will help design of stamp and substrate surfaces for enhanced printing quality and controlled thickness of the printed product. 2. Method of Approach In the simulations, the stamp and substrate surfaces are approximated as two flat surfaces (Figure 2). With these surfaces stationary, an ink mass placed between them first reaches its equilibrium shape. Next, the upper plate is set into motion, so the ink mass stretches and eventually splits into two. The ratio of mass and shape after splitting is a key result of the model. The simulation domain and its dimensions are shown in Figure 2, and simulation parameters are shown in Table 1. For the two simulations performed the ink contact angle on the stamp
Ink$supply$(Chambered$doctor$blade$system)$
Stamp$
Plate$cylinder$ Impression$
cylinder$
Engraved$roller$
Prin=ng$substrate$
Excerpt from the Proceedings of the 2014 COMSOL Conference in Boston

surface is held at 60o while contact angle on the substrate surface is varied from 60o to 30o . In both simulations, it is verified that the results obtained are independent of the size of the grid used (See the Appendix).
Figure 2. Simulation domain and its dimensions
Ink dynamic viscosity 0.1 N.s/m2 Ink density 1000 kg/m3 Air dynamic viscosity 1.81x10⁻⁵ N.s/m2 Air density 1.16 kg/m3 Gravity acceleration 0 Separation speed 0.1 m/s Volume of liquid 32 µm2 Surface tension coefficient 1 N/m
Table 1. Parameters used in the simulation of ink transfer between stamp and substrate surfaces. 2.1 Use of COMSOL Software The moving mesh interface and the laminar two-phase flow, phase field interface in microfluidics module of COMSOL software are used for the simulations. The setup with boundary and initial conditions is shown in Figure 3. 2.2 Governing Equations Navier-Stokes and continuity equations are solved by COMSOL software to obtain the velocity (u) and pressure (p) profile inside the fluids:
𝜌𝜕𝒖𝜕𝑡
+ 𝜌 𝒖 ∙ 𝛁 𝒖 = 𝛁 ∙ −𝑝𝑰 + 𝜇 𝛁𝒖 + 𝛁𝒖𝑻
+ 𝑭𝒈 + 𝑭𝒔𝒕 (1) 𝛁 ∙ 𝐮 = 0 (2) Two additional equations are solved to track the interface. These arise from the use of the phase field method and comprise the phase-field variable (𝜙) and phase-field help variable (𝜓):
𝜕𝜙𝜕𝑡
+ 𝒖 ∙ 𝛁ϕ = 𝛁 ∙𝛾𝜆𝜀!𝛁φ (3)
𝜓 = −𝛁 ∙ 𝜀!∇𝜙 + 𝜙! − 1 𝜙 +𝜀!
𝜆𝜕𝑓!"#𝜕𝜙
(4)
In the above equations, density (𝜌), dynamic viscosity (𝜇), gravity force (Fg) and surface tension force (Fst) are defined in terms of external free energy (𝑓!"#), density (𝜌!,!) and dynamic viscosity (𝜇!,!) of the two fluids, and 𝜙 as: 𝜌 = 𝜌! 1 − 𝑉!! + 𝜌! 𝑉!! (5) 𝜇 = 𝜇! 1 − 𝑉!! + 𝜇! 𝑉!! (6) 𝑭𝒈 = 𝜌𝒈 (7)
𝑭𝒔𝒕 = 𝐺 −𝜕𝑓!"#𝜕𝜙
𝛁𝜙 (8)
In equation (8), G is the chemical potential defined in terms of mixing energy density (𝜆) and capillary width (𝜀) as:
𝐺 = 𝜆 −𝛁!𝜙 +𝜙(𝜙 − 1)
𝜀!+𝜕𝑓!"#𝜕𝜙
(9)
𝑉!! is the volume fraction of second fluid defined as:
𝑉!! =1 + 𝜙2
(10) The range of 𝑉!! and 𝜙 are: 0 ≤ 𝑉!! ≤ 1 (11) −1 ≤ 𝜙 ≤ 1 (12) The relation between λ, ε and the surface tension coefficient (𝜎) is:
𝜎 =2 23
𝜆𝜀 (13)
The relation between mobility (γ), ε and the mobility tuning parameter (𝜒) is1: 𝜒 = !
!! (14)
1 𝜒 is a parameter introduced by COMSOL to control
the diffusion-related time scale for the interface
LIQUID& AIR&
symmetry'
8µm'
2µm' 8µm'STAMP&
SUBSTRATE&
direc0on&of&mo0on&&
Excerpt from the Proceedings of the 2014 COMSOL Conference in Boston
In the simulations, the following are used as inputs: 𝜒=1 m.s/kg, 𝜀=0.125µm, 𝜕𝑓!"# 𝜕𝜙=0 J/m3.
Domain, Boundary
Type, Specified Values
Laminar two-phase flow, phase-field interface (4=ink, 6=air) 4, 6 Fluid
- Initial velocity=0 - Initial pressure=0
2 Wetted wall - Contact angle=60o
3 Initial interface 1 Symmetry 5 Inlet
- Normal stress=0 N/m2 - Volume fraction of Fluid 6=1
7 Moving wetted wall - Contact angle=30o or 60o - Ux=0
- Uy=0 𝑚/𝑠, 0 < 𝑡 < 810µμsec0.1 𝑚/𝑠, 𝑡 ≥ 810𝜇𝑠𝑒𝑐
Moving mesh interface 4, 6 Free deformation
- Initial mesh displacement=0 1, 5 Prescribed displacement
- dx=0 - dy=unspecified
2 Prescribed displacement - dx=0 - dy=0
7 Prescribed velocity - Ux=0 m/s
- Uy=0 𝑚/𝑠, 0 < 𝑡 < 810µμsec0.1 𝑚/𝑠, 𝑡 ≥ 810𝜇𝑠𝑒𝑐
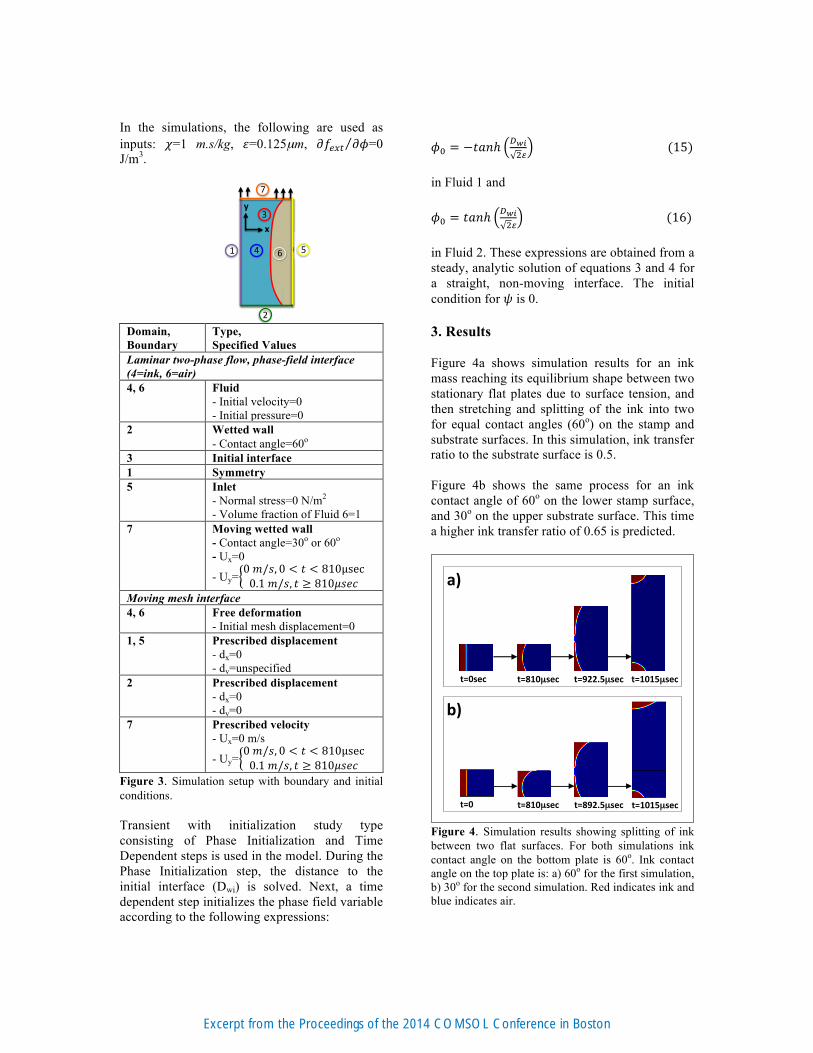
Figure 3. Simulation setup with boundary and initial conditions. Transient with initialization study type consisting of Phase Initialization and Time Dependent steps is used in the model. During the Phase Initialization step, the distance to the initial interface (Dwi) is solved. Next, a time dependent step initializes the phase field variable according to the following expressions:
𝜙! = −𝑡𝑎𝑛ℎ !!"
!! (15)
in Fluid 1 and 𝜙! = 𝑡𝑎𝑛ℎ !!"
!! (16)
in Fluid 2. These expressions are obtained from a steady, analytic solution of equations 3 and 4 for a straight, non-moving interface. The initial condition for 𝜓 is 0. 3. Results Figure 4a shows simulation results for an ink mass reaching its equilibrium shape between two stationary flat plates due to surface tension, and then stretching and splitting of the ink into two for equal contact angles (60o) on the stamp and substrate surfaces. In this simulation, ink transfer ratio to the substrate surface is 0.5. Figure 4b shows the same process for an ink contact angle of 60o on the lower stamp surface, and 30o on the upper substrate surface. This time a higher ink transfer ratio of 0.65 is predicted.
Figure 4. Simulation results showing splitting of ink between two flat surfaces. For both simulations ink contact angle on the bottom plate is 60o. Ink contact angle on the top plate is: a) 60o for the first simulation, b) 30o for the second simulation. Red indicates ink and blue indicates air.
Domain/Boundary- Type- Specified-Values-
LAMINAR'TWO+PHASE'FLOW,'PHASE'FIELD'INTERFACE'(4=ink,'6=air)'
4,-6- Fluid- ;-Ini=al-values:-Ux=-Uy=-0,-P=0-
2- WeGed-wall- ;-θ=60o-
3- Ini=al-interface-
1- Symmetry-
5- Inlet- ;-Normal-stress-=-0-N/m2-
;-Volume-frac=on-of-Fluid-6-=-1-
7- Moving-weGed-wall- ; θ=60o-or-30o-
;-Ux=0-;-Uy=-0.1*step(t;8.1e;4-sec)-[m/s]-
MOVING'MESH'INTERFACE'
4,-6- Free-deforma=on- ;-Ini=al-mesh-displacement:-dx0=-dy0=0-
1,-5- Presc.-mesh-displacement- ;-dx=0-;-dy=unspecified-
2- Presc.-mesh-displacement- ;-dx=0-;-dy=0-
7- Prescribed-velocity- ;-Ux=0-;-Uy=-0.1*step(t;8.1e;4-sec)-[m/s]-
1"
7"
2"
3"
4"
5"6" +"a"
y"
x"1"
7"
2"
3"
4"
5"6" +"a"
y"
x"
t=0sec' t=810µsec' t=922.5µsec' t=1015µsec'
a)#
t=0$ t=810µsec$ t=892.5µsec$ t=1015µsec$
b)#
Excerpt from the Proceedings of the 2014 COMSOL Conference in Boston

For both simulations, contact lines on upper and lower surfaces move, while the diameter of the filament decreases until it is finally broken. Variation in total fluid mass is less than 2% until splitting occurs. 4. Discussion and Conclusions In this study, splitting of ink between two flat surfaces is simulated, and the effect of contact angles on ink transfer is examined. A liquid adheres more strongly to a surface with high surface energy, which it likes to wet [3]. Hence, a lower contact angle indicates the tendency of a droplet to adhere more strongly to a surface. In parallel with this fact, simulations predict that exactly half of the volume of the liquid is transferred to the upward moving plate for two plates having equal contact angles (60o). As the contact angle on the upper plate is reduced to 30o, the ink transfer fraction to the upper plate increases to 0.65. This is slightly lower than the value presented in the literature for a similar simulation setting [4]. Work is in progress to match simulation results with the literature. 5. References 1. H. Kipphan, “Handbook of Printing Media”, Springer, 2001. 2. European Comission, “Final Vision Document in Roll-to-Roll Printed Electronics Manufacturing Equipment, Production Lines and Systems”, Deliverable Report. 3. H. W. Kang et. al., “Liquid Transfer Between Two Separating Plates for Micro-gravure-offset Printing”, Journal of Micromechanics and Microengineering, 2009. 4. W. -X. Huang et. al., “Simulation of Liquid Transfer Between Separating Walls for Modeling Micro-gravure-offset Printing”, International Journal of Heat and Fluid Flow, 2008. 6. Acknowledgements The authors would like to thank the King Fahd University of Petroleum and Minerals in Dhahran, Saudi Arabia, for funding the research reported in this paper through the Center for Clean Water and Clean Energy at MIT and KFUPM.
7. Appendix Sample mesh refinement analysis results for the first simulation with equal contact angles on top and bottom plates are shown below. Three simulations (A, B and C) are performed with the maximum mesh element size on the left side of the domain being h0, h0/3 and h0/4, respectively. h0 is defined as 0.25µm. There is no significant difference in recorded quantities in simulations with h0/3 and h0/4 maximum mesh element size, while simulation results for h0 maximum mesh element size differ significantly (Figure A-1 to A-3). Hence, a maximum mesh element size of h0/3 is used in the simulations.
Figure A-1. Velocity magnitude averaged over left boundary of simulation domain.
Figure A-2. Velocity magnitude at 7 points spaced 1 micron apart on the left boundary of the simulation domain at t=922.5 µsec.
Figure A-3. Pressure at point (1µm, 2µm) with center of coordinate axes defined as the bottom left corner of the simulation domain.
Averaged
(velocity
(mag.((m/s)(
Time((sec)(!0.05%
0%
0.05%
0.1%
0.15%
0.2%
0.25%
!1E!04% 0.0001% 0.0003% 0.0005% 0.0007% 0.0009% 0.0011%
Test_1d(Test_1e(Test_1b(
B"C"A"
Velocity)m
agnitude
)(m/s))
Index)
3"2"1"
"7"6"5"4"
Simula'on*domain*at*t=0*sec*
0"
0.01"
0.02"
0.03"
0.04"
0.05"
0.06"
0.07"
0.08"
0.09"
0" 1" 2" 3" 4" 5" 6" 7" 8"
1b"
1d"
1e"
A*B*C*
!300000$
!200000$
!100000$
0$
100000$
200000$
300000$
400000$
0$ 0.0002$ 0.0004$ 0.0006$ 0.0008$ 0.001$
Test_1b(
Test_1d(
Test_1e(
A"B"C"
Pressure&(P
a)&
Time&(sec)&
Excerpt from the Proceedings of the 2014 COMSOL Conference in Boston