effect of soil properties on unsaturated hydraulic conductivity pore-interaction factors
TRANSCRIPT
SOIL SCIENCE SOCIETY OF AMERICAJOURNAL
VOL. 54 NOVEMBER-DECEMBER 1990 No. 6
DIVISION S-l-SOIL PHYSICS
Effect of Soil Properties on Unsaturated Hydraulic Conductivity Pore-Interaction FactorsW. M. Schuh* and R. L. Cline
ABSTRACTThe variability of the pore-interaction factor, p, for a microscopic
model proposed for predicting unsaturated hydraulic conductivity,K(t), from soil water-retention, *(0), data was examined in relationto soil particle-size data and indices, bulk density, organic C, pa-rameters for the van Genuchten ¥(0) function, an index (W) of totalenergy of drainage and soil-series, toposequential, and geographicgroupings. The p exhibited no trend relationship to any of the soilproperties tested. However, a change in the distribution of p wasobserved in relation to the geometric-mean particle diameter (Gd)and other soil textural variables. For Ga < 0.08 mm, variability wasmuch larger than for soils with Cd > 0.08 mm. The latter consistedentirely of soils in the sand and loamy sand textural groups. A similardistributional relationship also occurred for p vs. W. Examinationof p on three sites of the Hecla soil series and on related topose-quential soils indicated that classification of p on the basis of soilseries or of soil-association groupings is a feasible strategy for pparameter estimation on some soils. The exponential factor ij for amacroscopic model was also investigated. The TJ was found to berelated to W as an exponential function over the full data range.However, i\ vs. W was nearly identical to a linear function for Wdata extending from 0 to 400 cm-7 (where y is the density of water).The i) was also strongly related to Gd as a power function, and toother textural variables as exponential functions. The increasingslope of the power function for <7d < 0.08 mm indicated a largepotential error of prediction for K(8) on fine-textured soils.
MANY MODELS (Burdine, 1953; Marshall, 1958;Millington and Quirk, 1961; Green and Corey,
1971; Mualem, 1976) have been developed for pre-dicting K(6) (cm/s) for soil-water content 0 using ^f(6),where ^ is soil-water suction (cm). Two models com-monly used are the Burdine model (1953):
Kr = [1]
North Dakota State Water Commission, 900 East Boulevard, Bis-marck, ND 58505. Contribution from the North Dakota State WaterCommission, Received 19 Jan. 1990. 'Corresponding author.
Published in Soil Sci. Soc. Am. J. 54:1509-1519 (1990).
and the model of Mualem (1976):
[2]o o
whereKT = K(6) / Ks [3]
for a saturating or matching K(ff) value Ks; and where
"e == 7n 7T\ I J
for saturated soil-water content 0S, and residual watercontent 0r.
Equations [1] and [2] have been classified by Mu-alem (1976) as microscopic models because of theirdevelopmental assumption that bulk flow through thesoil can be characterized using a microscopic pore-radius distribution represented by the integral terms(see Appendix). A common element in microscopicpore-distribution models is the use of p, which wasdeveloped to account theoretically for effects of porediscontinuity and tortuosity. Marshall (1958) and Mil-lington and Quirk (1961) interpreted p as a propertydefined by the probability of occurrence of continuouspores. Assuming isotropy and homogeneity, 6(^f) wasused to scale the two-dimensional flowing pore frac-tion of the soil surface area. The Marshall and Mil-lington and Quirk expression for the effect of poreinteraction was p = 2x, where x is an adjustment foreffective, or flowing, porosity. The porosity scale factorwas, therefore, 6(^f)2x. Millington and Quirk used x =2/3, resulting in p = 4/3. Marshall made no adjust-ment for effective porosity (x — 1) and thus proposedthat p = 2. For Marshall, the theoretical case of un-interrupted flowing capillary pores (no pore interac-tion) would correspond to p = 1. For Millington andQuirk, the case of no pore interaction would result inP = 2/3.
In contrast to the probabilistic treatment of Mar-shall, Burdine interpreted p strictly as a function of
1509

1510 SOIL SCI. SOC. AM. J., VOL. 54, NOVEMBER-DECEMBER 1990
soil tortuosity. Burdine (1953) and Brooks and Corey(1964) relied on the empirical finding that tortuosityvaried linearly with S*. On this basis, Burdine adoptedthe value p = 2. In Mualem's (1976) interpretation,the inclusion of a proportional relationship betweenpore length and width to account for tortuosity negatesthe application of the tortuosity vs. S% relationship.Instead, Mualem derived a p = 0.5 factor empirically,based on optimized measured K(0) fits for Eq. [2] using50 soils.
Computational as well as theoretical differences af-fect the prediction of K(0) using pore-interactionmodels, so that a simple deterministic definition of phas not been possible. For example, while the Se mul-tiplier (outside of the integral term in Eq. [1] and [2])varies with water-filled porosity, the model of Greenand Corey (1971) assumes a constant 0S value. Com-putational methods include analytical solutions usinglog-log 6(V) relationships (Brooks and Corey, 1964;Campbell, 1974) or closed-form equations describing6(V) (van Genuchten, 1980), and results are dependenton appropriateness and goodness of fit of the selectedfunctions. Numerical approximations based on power-series solutions (Marshall, 1958; Millington andQuirk, 1961; Green and Corey, 1971) or on functionalsegmentation of the 6(3?) curve (Mualem, 1976) maybe influenced by the degree of discretization of theseries or segmented increments (Green and Corey,1971; Bouma and Anderson, 1973; Mualem, 1976).Finally, the assumption of capillary flow may not bevalid for water strongly influenced by soil electricalproperties in the very dry range or for very large poreswhere turbulent flow may occur.
Mualem (1978) reviewed a class of K(8) modelsbased on capillary-flow assumptions, but derived fromthe theoretical application of a macroscopic or non-distributed hydraulic radius (see Appendix). The re-sulting model was
where the empirical factor a is attributed to the de-crease in wetted area with decreasing 6. The value ofa is also influenced by a relative decrease in 0T withdecreasing 6 on finer soils. While theoretically distinctfrom the microscopic p values discussed by Marshall(1958), Burdine (1952), Brooks and Corey (1964), andMualem (1976), the macroscopic a does represent ananalogous pore-interaction factor allowing for adjust-ment of the model to offset incongruities betweenmodel developmental assumptions and the true prop-erties of the flowing porous media.
Many comparative studies of K(0) models have beenpublished (Nielsen et al., 1960; Jackson et al., 1965;Laliberte and Brooks, 1967; Green and Corey, 1971;Rogowski, 1972; Bouma and Anderson, 1973). Thesehave generally concluded that K(0) models fit best oncoarse- or medium-textured soils without well-definedstructure. Some experiments have evaluated the rel-ative accuracies of varying intensities of data discre-tization for power-series solutions of the integral termsin Eq. [1] and [2] (Bouma and Anderson, 1973). WhileMualem (1976) derived his microscopic p (0.5) using50 soil samples of varying soil properties, and whileMualem (1978) also calibrated the macroscopic « pa-
rameter using soil hydraulic properties, there havebeen few published comparative investigations onlarge data sets of the relationship between pore-inter-action parameters and soil hydraulic and physicalproperties.
In recent years, considerable work has been pub-lished describing and classifying spil-water-retentionproperties and parameters using soil physical and hy-draulic properties (Clapp and Hornberger, 1978; Bloe-man, 1980; de long, 1982; Rawls et al., 1982).However, K(8) pore-interaction parameters have con-tinued to be treated as assumed constants in mostmodeling studies. The microscopic p and the macro-scopic a (or composite if) are the sole empirical factorsdefining the fits of KT determined using Eq. [1], [2],and [5] with measured soil hydraulic data, and maycomprise a source of large error in the application ofmodels involving unsaturated flow. It is importantthat the accuracy of these parameters be further as-sessed in relation to the properties of soils on whichthey are applied.
The objective of this study was to examine the re-lationship between the p and 17 parameters for the mi-croscopic and macroscopic models of Mualem (1976,1978) and soil textural properties and indices, bulkdensity and organic matter data, and soil hydraulicparameters using in situ K(B) and -$(9) measured onsoils of varying texture. The variability of p was alsoexamined within and between soil series for soils ofsimilar parent material and different toposequentialposition in order to explore the feasibility of classifyingp according to soil series or associations.
MATERIALS AND METHODSTen sites were selected in Dickey County, North Dakota,
for in situ measurement of soil *(0) and K(9). Soil series,classifications, and site descriptions are summarized in Table1. Sites 1, 2, and 3, and Sites 4, 5, and 6 composed twotoposequences «8 km apart. Sites 7, 8, 9, and 10 were meas-ured at individual scattered locations within a 60-km2 area.The sites were selected to provide a range of soil texturescommon to the Oakes area, as well as a variety of landscapepositions and chemical regimes. Descriptive data (particle-
Table 1. Summary of sites used for in situ hydraulic measurementsand laboratory sample acquisition.
Site
1
2
3
4
5
6
7
8
9
10
Soil series
Hamar sand
Hecla loamysand
Hecla loamysand
Hecla loamy-fine sand
Ulen loamy-fine sand
Arveson fine-sandy loam
Heimdal loam
Stirum fine-sandy loam
Eckman loam
Gardena loam
Classification
sandy, mixed, (rigid TypicHaplaquoll
sandy, mixed AquicHaploboroll
sandy, mixed AquicHaploboroll
sandy, mixed AquicHaploboroll
sandy, frigid AerieCalciaquoll
coarse-loamy, frigid TypicCalciaquoll
coarse-loamy, mixed UdicHaploboroll
coarse-loamy, mixed,frigid, Typic Natraquoll
coarse-silty, mixed UdicHaploboroll
coarse-silty, mixed PachicUdic Haploboroll
Description
depression, somewhatpoorly drained
midslope, moderatelywell drained
crest, moderately welldrained
crest, moderately welldrained
toeslope, somewhatpoorly drained
depression, poorlydrained (tiled)
crest, well drained
nearly level, poorlydrained (tiled)
nearly level, welldrained
nearly level, welldrained

SCHUH & CLINE: PORE-INTERACTION FACTORS 1511
size distribution, organic matter, and bulk density) are sum-marized for Sites 1, 2, 3, 7, and 9 in Table 2. Correspondingdata for Sites 4, 5, 6, 8, and 10 were published previously(Schuh et al., 1988). Soil chemical regimes varied from well-leached sandy soils to saline and sodic soils formed in closeproximity to the water table. The proportions of sand, silt,and clay for all soils used in this study are illustrated in Fig.1.
Field and Laboratory MethodsEach site installation consisted of two neutron-probe ac-
cess tubes set approximately 0.75 m apart. Correspondingto each access tube, tensiometers were placed at 0.152-mdepth increments to as deep as 2.42 m. Larger depth incre-ments were allowed below 0.61 m on some sites where soilswere homogeneous in the C horizon. Soil-water retentionand K(8) were measured using the instantaneous profilemethod (Hillel et al., 1972; Cassel, 1974) for a draining soilprofile. Soils were ponded until wetted as fully as possibleto the deepest tensiometer, and were then covered with threelayers of polyethylene weather barrier and 9 cm of fiberglassinsulation and allowed to drain. For sandy soils, tensiom-eters were read at 20-min intervals and neutron-probe mea-surements were made at 10-min intervals during the early,highly saturated phase of drainage. Readings were graduallyreduced to 4 d~' on the second day, 3 d"1 on the third day,and 1 d'1 for 1 wk following the cessation of ponding. Read-
Table 2. Summary of morphologic and physical properties for se-lected soils used in estimation of the microscopic unsaturated hy-draulic conductivity \K(6)] model pore-interaction factor (p) andthe microscopic K(9) model pore-interaction factor (ij) of Mualem(1976). Corresponding properties for Sites 4, 5, 6, 8, and 10 areavailable in Schuh et al. (1988).
Horizon Depth
m
Sand Silt ClayOrganic Bulk
C density
Mgnr3
Hamar (Site 1)ApABgCglCg2Cg3
0-0.100.10-0.290.29-0.600.60-1.021.02-1.601.60-1.83
87.285.288.392.594.987.5
9.99.37.65.02.27.5
3.05.54.02.52.95.1
1.20 1.501.00 1.580.310.120.080.12
Hecla (Site 2)ApABwCCg
0-0.100.10-0.340.34-0.600.60-0.860.86-1.50
89.291.592.493.295.0
6.05.13.22.41.4
4.83.34.44.30.0
0.640.030.310.080.04
Hecla (Site 3)ApAlA2BwCCg
0-0.090.09-0.260.26-0.560.56-0.820.82-1.001.00-1.40
83.885.984.688.586.692.3
5.89.1
10.97.87.64.1
10.45.24.43.65.73.6
1.501.500.870.470.200.16
Heimdal (Site 7)ApABwBCClC2
0-0.150.15-0.280.28-0.410.41-0.810.81-1.171.17-1.52
47.947.644.237.345.744.9
35.636.139.548.645.647.2
16.516.216.314.28.77.9
1.741.680.750.580.120.04
Eckman (Site 9)ApABwBCC
0-0.150.15-0.300.30-0.530.53-0.810.81-1.32
32.936.39.9
15.61.4
50.749.058.070.692.0
16.314.632.113.66.5
3.001.500.94
.55
.59
.59
.68
.58
.58
.56
.49
.57
.42
.50
.44
.51
.54
.53
.41
.40
.44
.32
.50
.47
.66
.48
.350.40 1.400.13 1.35
ings were continued at reduced intervals for about 1 mo.Less intensive monitoring was required during the earlydrainage phase on the loamy soils.
Following the completion of soil drainage, the sites wereexcavated and bulk samples were removed between the neu-tron-probe access tube and the corresponding tensiometersfor each depth increment for measurement of soil particle-size distribution using the pipette method, and for mea-surement of organic carbon (OC) and soil chemical prop-erties, including sodium adsorption ratio (SAR) andexchangeable bases (Soil Survey Staff, 1986). Soil particle-size classes measured included USD A very-coarse sand (1.0-2.0 mm), coarse sand (0.5-1.0 mm), medium sand (0.25-0.5 mm), fine sand (0.1-0.25 mm), very-fine sand (0.05-0.1mm), coarse silt (0.02-0.05 mm), fine silt (0.02-0.05 mm),and clay (<0.002 mm).
One 7.65 by 7.65 cm (length by diam.) core sample wasremoved from each depth for determination of bulk density(Z)b) using the core method (Blake and Hartge, 1986). Two3 by 5.3 cm (length by diam.) samples were taken at eachdepth for measurement of the laboratory "main dryingcurve" (Klute, 1986) using 0.1-MPa ceramic plates withinpressure-pot extractors. One 6 by 5.3 cm (length by diam.)core sample was taken at each depth for measuring K(6) usingthe Doering (1965) one-step outflow method. The laboratoryK(6) data were used to supplement field K(0) measurementsbetween field capacity and 500-cm soil-water suction, andthe laboratory 6(&) data were used to supplement field 0(SP)data between field capacity and «800-cm soil-water suction.In addition, 1.5-MPa (15 300-cm) water content was meas-ured for disturbed samples as described by Klute (1986). Inall cases, laboratory samples were taken from the exact fieldpositions corresponding to the in situ measurements. Fieldand laboratory procedures and methods of field data han-dling and interpretation were previously described in greaterdetail by Schuh et al. (1988).
Calculation and Calibration of Mualem MacroscopicExponential Factor r\
The TJ was calculated for 69 hydraulic data sets using meas-ured K, and Sc data for each measured point in each dataset according to Eq. [5]. Analogous to a similar power re-lationship (see Appendix, Eq. [A10]) described by Brooksand Corey (1964), Eq. [5] would not be expected to properly
100
100100
Sand + Loamy Sand% SAND • Of > 0.08 mm
o Ga < 0.08 mm
Fig. 1. Percent sand, silt, and clay of data used for microscopicunsaturated hydraulic conductivity [K(ff)] model pore-interactionfactor (p) and macroscopic K(ff) model pore-interaction factor (ij)evaluation. Gd = geometric-mean particle diameter.

1512 SOIL SCI. SOC. AM. J., VOL. 54, NOVEMBER-DECEMBER 1990
describe K(Se) between air-entry suction, SE ,̂ and field sat-uration. The K(Se) values in this range usually depart fromthe power function describing K(SC) in the drier ranges. In-stead, K(SC) values between ^ and saturation are frequentlyrepresented using a constant Ks value, or a gradually slopinglinear or parabolic function (Ahuja et al., 1980; Clapp andHornberger, 1978). Because of the air-entry value limitation,the mean r\ determined for all Sc < 0.9 on each data set wasused as a characteristic ij for that data set. In calculating TJ,Se values were calculated using the 0r value determined forEq. [4] using the method described by van Genuchten (1980),and Ks was set equal to the K(Se) value measured closest tosaturation. All matching K(Se) values were identified withK(Se) corresponded to *f? values below *i; and within 20-cmsuction of saturation.
Mualem (1978) proposed predicting ij using W (in unitsof cm--y), an index of the total energy required to drain aunit volume of saturated soil. The W index and Mualem'scalibration curve for predicting -r\ from W are described inthe Appendix (Eq. [A8] and [A9]). To calibrate the relation-ship between 17 and W using our data, the integral solvingfor W was performed using a numerical approximationbased on the assumption that ¥(0) can be fitted as a seriesof log-log curves over short intervals.
The ^(0) data are frequently fitted as a log-log functionusing a 9, parameter. Without 0r, a single log-log function isfrequently inadequate to fit the entire range of ^>(6) data oncoarse soils. However, fitted 0r parameters usually corre-spond to ̂ data values below (wetter than) 1.5 MPa. Becauseof the large sensitivity of the W integral to 1.5-MPa watercontent, an equation of the Brooks and Corey form wouldnot be useful in integrating the desired data range in thisapplication.
However, *(0) data can almost always be fitted well usingtwo or more connected log-log functions. For solution of theW integral, V(0) data were fitted as a series of connected log-log functions, each corresponding to one pair of data points.In integrated form, W was solved as
i + 1[6]
where ft and a{ are linear curve-fitting parameters deter-mined from the coordinates of each of k pairs of data points.
Calculation of Mualem Microscopic Pore-InteractionFactor
Van Genuchten (1980) described a closed-form equationfor 0(V) such that
5e = [1 + (a*)"]-"1 [7]where a, n, and m are curve-fitting parameters. Using Eq.[7], Eq. [2] is then solved as
Kr = St [1 - (1 - [8]Field V(d) data from saturation to field capacity, laboratory•&(0) data from field capacity to approximately 800 cm (in-cluding 330-, 500-, and 800-cm suctions), and laboratory15 300-cm suction data were used to determine a, m, and nusing a Marquardt nonlinear least-squares parameter opti-mization procedure in a FORTRAN computer programwritten by van Genuchten (RETC, 1986, personal com-munication). The parameters m and n were identified ac-cording to the m = 1 — \/n relation suggested by vanGenuchten (1980), and 0r and 0S were treated as empiricalparameters. The 0S was treated as an empirical parameterbecause of the large natural variation of 0S from full satu-ration caused by air entrapment under field conditions. Itwas considered undesirable to excessively weight a highlyvariable property in fitting the entire *(0) and K(SC) curves.
After fitting the ^(0) parameters (a, m, n, 0r, and 0S) tosoil-water-retention data, p was estimated by holding the ^(0)parameters constant and fitting K, to Se (Eq. [8]), varyingonly the p parameter and K,. The p was estimated as theproduct of an optimized Marquardt least-squares fit for com-bined field and laboratory K(SC) data using the RETC com-puter program (van Genuchten, 1986, personalcommunication). Although the RETC program was capableof performing a simultaneous fit for p with the •*(#) param-eters, Eq. [7] and [8] are most frequently applied where only*(0) parameters are known, and where p is an assumed value.The separate determination of Eq. [7] parameters was thusconsidered to be closest to conditions of actual application.The Ks was allowed to vary because many of the subsoilscould not be fully saturated. However, all data sets were wellrepresented near saturation.
Soil Textural IndicesTextural parameters examined as predictors of p and 77
included Gd, the standard deviation of SDg, and the standard-normal deviate (Zg) of the GA (calculated GySDg) as de-scribed by Shirazi and Boersma (1984), the sand-to-silt ratio(SASI) (Schuh and Bauder, 1986), and a soil particle-distri-bution index introduced by Bloemen (1980) to describe theBrooks and Corey (1964) and Campbell (1974) function pa-rameters for
RESULTS AND DISCUSSIONThe Mualem Macroscopic Model
Exponential Factor i;The result of the calibration of 77 (Eq. [5]) to
Appendix, Eq. [A8]) was an exponential function (Eq.[9] in Fig. 2), with increasing sensitivity of r? to Wv/ithincreasing W. The fitted curve is almost identical toMualem's linear function between 0 and 400 cm-7values of W, and that the curve Tj-intercept value is2.8, compared with Mualem's value of 3.0. These re-sults, moreover, do not necessarily contradict Mu-
50
40
30
20
10
-10
equation 9T\ = exp(1.025 0.003338 W).
1 = 3.0 + 0.015 W(From Mualem)
200 400 600 800 1000
W cm-yFig. 2. Data and fitted functions for macroscopic unsaturated hy-
draulic conductivity [K(9)] model pore-interaction factor (TI) vs.soil-water energy index (W). * Standard error of the estimate (SE)is for the natural log form of Eq. [9].

SCHUH & CLINE: PORE-INTERACTION FACTORS 1513
alem's data, which were less dense in the higher rangeof W and which did exhibit an indication of largervariability and an increasing 77 vs. W beyond the 500cm-7 lvalue. Mualem, in fact, initially hypothesizeda power function for 77 vs. W.
Both 77 and W are strongly correlated with a largenumber of soil particle-size variables, including per-cent sand, silt, and clay and Gd, SDg, Zg, and SASI.Bulk density was also slightly correlated with both 77and W. The fit of the relationship between 77 and W(R2 = 0.65) was better than those of the best texturalvariables [ln(77) vs. ln(Gd), R2 = 0.55; ln(77) vs. percentsand, R2 = 0.62) and no improvement in predictionwas gained in combining textural variables with W inmultiple-regression models. The predictive relation-ship for 77 using Gd, Eq. [10], is shown in Fig. 3. Aswith the W predictive variable, 77 was highly respon-sive to Gd in the fine-particle-size ranges, resulting ina large potential predictive error for fine soils. The (rdvariable frequently loses sensitivity as a predictive var-iable for soil hydraulic properties if calculated fromonly three particle-size classes. For those lacking ̂ (0)data for calculation of W and who have only percentsand, silt, and clay data, the percent sand variable canbe used for a predictive estimation where
77 = 47.61 exp(—0.026 percent sand) [11]with a standard error of the estimate of 0.5 for theln(77) vs. percent sand relationship (n = 69).
Our data thus confirm the fundamental empiricalrelationship established by Mualem (1978) for themacroscopic ^(0) model (Eq. [5]), except that a largerresponse of 77 to Wis indicated for very large W. Strongcorrelations between 77 and soil textural properties in-dicate that the range of large response and high errorcorresponds to soils of finer texture.
Additional ^(0) and K(0) data were obtained at Car-rington, ND, but without detailed particle-size-distri-bution data and with 1.5-MPa samples taken severalmeters from the in situ hydraulic monitoring sites.Three individual sites (of the Heimdal soil series) weremeasured, but a single combined 1.5-MPa measure-ment for each depth was used for each site. The valuesof 77 vs. W are shown in Fig. 4. While a few 77 predic-tions correspond to Eq. [9], most data exceed both Eq.[9] and Mualem's function (Appendix, Eq. [A9]). TheCarrington sites were extremely heterogeneous, withdiscontinuous layers and pockets of interbedded sandsand silts. It is thought that the sensitivity of Wto 1.5-MPa water content may have affected the accuracy ofthese 77 estimates. If so, the importance of obtainingaccurate 1.5-MPa data should be stressed.
The Mualem Microscopic ModelPore-Interaction Factor
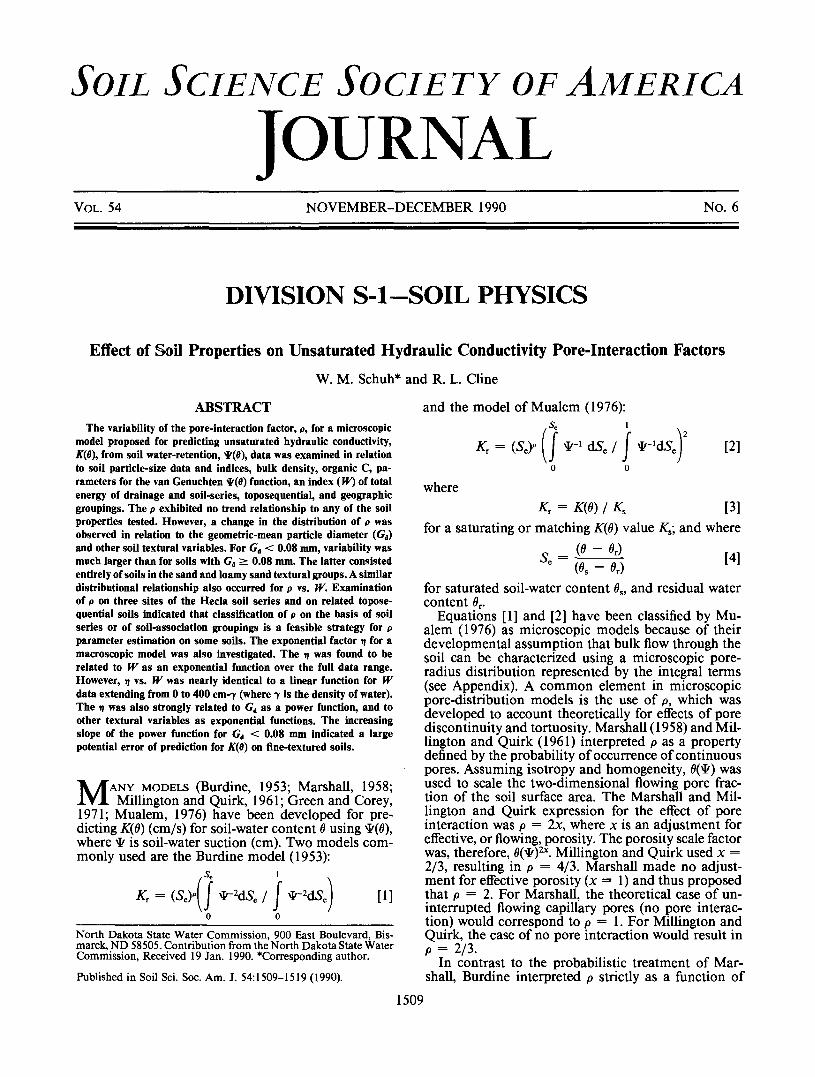
There was little correlation between p for the Mu-alem microscopic model and soil textural propertiesand bulk density. There was also no predictive rela-tionship between p and the van Genuchten (1980)function ^(0) parameters. However, there is evidencethat the distribution of p differs in reference to soiltextural properties. In Fig. 5, the distribution of p isshown as a function of <7d. A change in the distributionis indicated at approximately Gd — 0.08 mm, with alarger variability indicated for soils with Gd < 0.08mm. This boundary value is very close to the divisionbetween fine and coarse silt (0.05 mm) in the USDAclassification system. A similar change in distributionis also observed for other particle-size variables, suchas percent clay. When such a change in distributionoccurs, it is advantageous to split the data into subsets
so
40
30
T\ 20
10
equation 10-0 .696n = 1.215 Gd
-100.0 0.1 0.2 0.3 0.4 0.5
Fig. 3. Data and fitted function for macroscopic unsaturated hy-draulic conductivity [K(0)] model pore-interaction factor (tj) vs.geometric mean particle diameter (Gd). * Standard error of theestimate (SE) is for the natural log form of Eq. [10].
60
50
40
30
20
10
o «r
equation 9
\;
equation A9(From Mualem)
200 400 600 800
W cm-yFig. 4. Comparison of measured and predicted macroscopic unsat-
urated hydraulic conductivity [K(ffj\ model pore-interaction factor(TI) vs. soil-water energy index (W) for the Carrington data.
1514 SOIL SCI. SOC. AM. J., VOL. 54, NOVEMBER-DECEMBER 1990
20
10
-10
• 0.08 mm
0.001 0.010 0.100 1.000
(mm)Fig. 5. Distribution of the microscopic unsaturated hydraulic con-
ductivity [K(8)] model pore-interaction factor (p) in relation togeometric mean particle diameter (Gd).
corresponding to the ranges of different error in orderto minimize the error of estimation for p on coarsesoils, and to establish a better estimate of the truepredictive error on fine soils.
Parametric and nonparan\etric statistics character-izing p for (7d < 0, Gd > 0, and for all measured datacombined are in Table 3. Parametric statistics arebased on a normalized variable, transformed accord-ing to
p' = ln(p + f) [12]where f is an arbitrary constant added to ensure non-negative values. For the composite statistical com-parisons and for the loamy sites, f = 8.75 was used,based on the value of the smallest measured p value(8.73). For the sandy sites, f = 1.5 was used, based
Table 3. Median, minimum (Min.), maximum (Max.), and geomet-ric-mean p; 95% confidence interval for the estimated geometric-mean p from the true population geometric-mean macroscopicpore-interaction factor (p); and the number of samples (n) for soilpopulations represented by several combinations of the data.
PopulationAH samplesAll loamsSites 6,7,8Sites 1,2,3,4,5,6,8
(all sandy)Sites 1,2,3,4,5,6
(all sandy)Sites 1,2,3,4,5
(sandy)Sites 2,3,4 (all
Hecla series)GA < 0.08 mmd > 0.08 mmHecla A horizonHecla B horizonHecla C horizonSites 6,7,8A horizonSites 6,7,8B horizonSites 6,7,8C horizon
Medianp
1.060.814.68
1.06
0.27
0.27
0.271.750.660.130.28
-0.28
2.09
5.77
4.68
Min.p
-8.73-8.73-0.63
-1.45
-1.45
-1.45
-1.45-8.73-1.45-1.45-0.23-0.66
-1.45
-3.76
-8.73
Max.p
14.8013.1514.80
14.80
6.84
6.84
2.1914.806.841.801.242.00
11.8
13.15
14.80
95%Geometric confidence
mean p interval0.63
-0.944.25
0.62
0.29
0.16
0.062.150.55
-0.250.200.34
3.10
5.14
4.00
-0.88-2.44-4.80-6.69-1.48-14.46
0.14-1.25
-0.13-0.85
-0.23-0.68
-0.42-0.76
0.63-3.920.15-1.06
-0.98-1.48-1.11-5.87
-0.194-1.081.11-5.49
2.29-8.71
0.531-8.78
n752021
55
46
42
252649103
12
5
9
7
-1
-2
-3
> 0.08 mm
J*
0.1 1.0
p + 1.5
10.0
t Gd is the geometric mean soil-particle diameter.
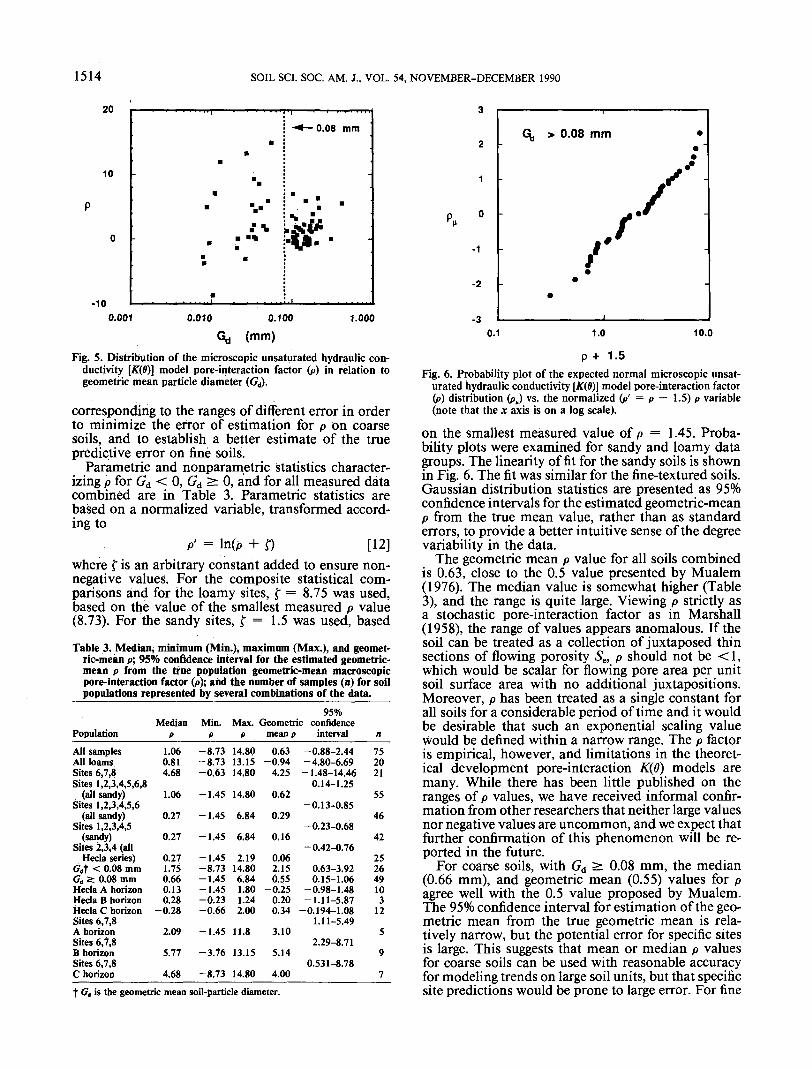
Fig. 6. Probability plot of the expected normal microscopic unsat-urated hydraulic conductivity [Jf(6)] model pore-interaction factor(p) distribution (pB) vs. the normalized (/»' = p + 1.5) p variable(note that the x axis is on a log scale).
on the smallest measured value of p = 1.45. Proba-bility plots were examined for sandy and loamy datagroups. The linearity of fit for the sandy soils is shownin Fig. 6. The fit was similar for the fine-textured soils.Gaussian distribution statistics are presented as 95%confidence intervals for the estimated geometric-meanp from the true mean value, rather than as standarderrors, to provide a better intuitive sense of the degreevariability in the data.
The geometric mean p value for all soils combinedis 0.63, close to the 0.5 value presented by Mualem(1976). The median value is somewhat higher (Table3), and the range is quite large. Viewing p strictly asa stochastic pore-interaction factor as in Marshall(1958), the range of values appears anomalous. If thesoil can be treated as a collection of juxtaposed thinsections of flowing porosity Se, p should not be <1,which would be scalar for flowing pore area per unitsoil surface area with no additional juxtapositions.Moreover, p has been treated as a single constant forall soils for a considerable period of time and it wouldbe desirable that such an exponential scaling valuewould be defined within a narrow range. The p factoris empirical, however, and limitations in the theoret-ical development pore-interaction K(6) models aremany. While there has been little published on theranges of p values, we have received informal confir-mation from other researchers that neither large valuesnor negative values are uncommon, and we expect thatfurther confirmation of this phenomenon will be re-ported in the future.
For coarse soils, with Gd > 0.08 mm, the median(0.66 mm), and geometric mean (0.55) values for pagree well with the 0.5 value proposed by Mualem.The 95% confidence interval for estimation of the geo-metric mean from the true geometric mean is rela-tively narrow, but the potential error for specific sitesis large. This suggests that mean or median p valuesfor coarse soils can be used with reasonable accuracyfor modeling trends on large soil units, but that specificsite predictions would be prone to large error. For fine

SCHUH & CLINE: PORE-INTERACTION FACTORS 1515
20
10
-10
Oakes Data
1500 kPa limit
10 100 1000
50
o
-50
-100
Carrington Data•
•V,. .-'<
1500 kPa limit. . . . . ...i . . ..... ..i
•
*Jt
.
. . . M ..
10 100 1000W cm •
Fig. 7. Distribution of the microscopic unsaturated hydraulic con-ductivity [K(9)] model pore-interaction factor (p) in relation to thesoil-water energy index (W) for Oakes and Carrington data.
soils (Gd < 0.08 mm) both the geometric mean andmedian values are considerably larger (Table 3) thanthe Mualem predicted value of 0.5. In addition, therange and 95% confidence interval are considerablylarger than for the coarse soils, indicating that the sta-tistical prediction of p would be less reliable on soilsof finer texture.
The soil textures corresponding to the divisionsbased on Gd (Fig. 1) indicated that all of the coarse-textured soil samples corresponded to soils of the sandand loamy sand texture. All other soil texture groups,including sandy loam, belonged to the p distributionfor the finer soils. Previous researchers have found thatpredictions of K(0) using microscopic pore-interactionmodels have been best on coarse or structureless soils(Nielsen et al., 1960; Bouma and Anderson, 1973; Eh-lers, 1977). In some cases, however, reasonably goodfits have also been achieved on soils of loamy texture(Nielsen et al., 1960; Bouma and Anderson, 1973; Eh-lers, 1977; Mualem, 1978). The results of this exper-iment indicate that the problem of fits for K(ff) onloamy soils is the occurrence of large variability. Goodfits for predicted K(B) can thus be expected to occurin many instances. However, there are factors affectingp on loamy soils that are not understood at present,and the level of reliability in model application is low-er for fine soils than for coarse soils. The problem ofusing p on fine soils is not that good fits with real fielddata can never be obtained. Rather, the problem is thehigher likelihood of error incurred in the attempt topredict an unknown K(ff) function for soils of finertexture.
The W property was also investigated as a possiblepredictive variable for p. The results indicated that therelationship was similar to that of the particle-size in-dices, exhibiting no discernable trend, but a significantchange in distribution. In Fig. 7, it is seen that anincrease in the variability of p occurs at approximately200 cm-7 Wfor the Oakes data. The Oakes data dis-
tribution indicates that the W = 200 cm-7 boundaryvalue corresponds to the GA = 0.08 mm grain-indexboundary value. The Carrington data (Fig. 7) are moresparse and represent a smaller range of soil grain sizes.Nonetheless, they also indicate that a change in p dis-tribution occurs at approximately 200 cm-7. The rangeof p is larger for the Carrington data. These data werebased on less reliable complementary physical and 1.5-MPa water-content data and they may not be as re-liable as the Oakes data base for comparative purpos-es. The lack of a trend relationship between p and Windicates that the application of the integral micro-scopic pore-distribution term (Eq. [1] and [2]) per-forms a function in the microscopic models similar tothe integral W variable in the macroscopic model. Theuse of both is therefore redundant.
There is a similarity between indicators of pore-in-teraction parameter reliability for the macroscopic andmicroscopic models in relation to Gd. In Fig. 3, the 77vs. Gd curve exponential phase is between 0.0 and 0.08mm, corresponding to the range of large scatter on theplot of p vs. Gd (Fig. 5). For the extremely steep rangeof prediction for r), the potential error in predicting t\per increment change in Gd is much larger than in theflatter portion of the curve. Thus, the correspondencebetween the range of larger scatter for p and the rangeof exponential increase for t\ demonstrates a congruentrange of larger error for both models.
These analyses indicate that, while no simple trendrelationships can be discerned for p vs. soil particlesize, Z)b, and QC, there is a distributional relationshipthat may aid in classifying and assessing the variabilityof p. This type of relationship occurs in relation tovarious soil particle-size properties and the 0(^)-data-based W index. While these preliminary analyses sug-gest that only two combined soil-texture groups wouldbe sufficient to describe and classify p, there may beother possible indices that would serve to further dis-cern differences between soils. It is also possible that,with a much larger data set, further differences maybecome discernable. More work on the level of com-bined analysis is needed to achieve a broad-scale un-derstanding of the classification of these phenomena.
Comparative Site Variabilityof the Pore-Interaction Factor
While the ability to predict p and its variability inrelation to soil properties is of general interest, ped-ological classification of p would also be quite useful.Because site-specific data are frequently unavailable,classifications or groupings within which an assump-tion of similar p magnitude can be made would greatlysimplify parameter estimation. For example, if withina given soil series there is a narrow range of p values,it would be useful to apply the knowledge of that rangeto modeling applications. Similarly, it might be usefulto combine p values for soil series within a topose-quence or within areas of similar parent materials, ifthe result does not excessively increase the error ofprediction for K(6).
Within this experiment, the similarity of p on threeHecla series soil profiles at two different locations isof interest. The similarity of the distribution of p for

1516 SOIL SCI. SOC. AM. J., VOL. 54, NOVEMBER-DECEMBER 1990
the Hecla series to values measured on nearby topos-equential soil sites is also of interest, because it couldlead to simplifying parameter-estimation assumptionsthrough the grouping of those series with the Heclaseries in modeling applications. The three sites usedin toposequential analysis were the Hamar soil on Site1, which occupied an elevated depression with respectto the upslope Hecla measurements on Sites 2 and 3,the Ulen soil on Site 5, which occupied a toeslopelandscape position in relation to the Hecla soil meas-ured on Site 4, and the Arveson soil measured on Site6, which occupied a deep depression position in re-lation to Sites 4 and 5. Of these, the Hamar and Ulenwere of sandy materials similar to the Hecla, but theUlen differed in the presence of CaCO3 within the sol-urn caused by evaporation from the water table.
The Arveson series site, while of the Hecla-Ulentoposequence, differed most severely because of ero-sional clay deposition during pedon development,which resulted in a finer textured soil in some layers,despite the sandy loam pedon classification (Table 1).The Arveson soil also contained both CaCO3 and Nawithin the solum, caused by evaporation from a shal-low water table during periods of high evaporation. Insitu hydraulic measurements were possible on this sitebecause of tile drains that had recently been placed inthe vicinity of the measurement site, which loweredthe water table.
The Stirum soil measured on Site 8 was located sev-eral kilometers from the two sandy toposequences.The Stirum soil is characterized by high SAR withinthe solum, and by clay enrichment within the sandymatrix (Table 2). As with the Arveson site, the mea-surements were made on a recently tile-drained field.The Arveson soil was also examined for similarity ofp distribution with the Hecla series.
Pedologic variability is evaluated using standardparametric and nonparametric statistical indices (Ta-ble 3) and using the nonparametric box-plot represen-tations of Tukey (1977). For visual assessment of datascatter, Tukey (1977, p. 44) classified data as inside,outside, and far out in relation to the median, basedon steps (fences) defined by multiples of 1.5 times thedifference (H-spread) between the values of data de-fining the outer ranked boundaries for 50% of the data.The box-plot representation of p (Fig. 8) can be inter-
20
10
-105 6
SITE8 9 1 0
Fig. 8. Tukey box-plot representation of microscopic unsaturatedhydraulic conductivity [K(9)\ model pore-interaction factor (p) datavariability by individual measurement site.
preted as follows. The center bar is the median. Thebox borders (hinges) are the boundaries for the datacomprising 25% of the data (quartiles) on either sideof the median (50% total). The stem and tick (innerfence) values enclose data labeled inside. All innerfence values truncate at the maximum or minimumvalue if they are within the first step length, so thedistance between the upper and lower inner fence val-ues is the same as the range, provided no outside data(labeled *) exist. If outside data are present, then thelargest or smallest * represent respective maximum orminimum values, and compose the boundaries of therange.
The three Hecla sites (Fig. 8) compose the tightestand most similar p distributions. The geometric-meanvalue (Table 3) is enveloped within a relatively narrow95% confidence interval that includes the p = 0.5 valuepresented by Mualem (1976). This range of p valuesis also tightest of all classification units examined.Within the Hecla soil profile, a slightly larger scatterof data is indicated for the A horizon, but little dif-ference in the median and range of p values is indi-cated. The distribution of p within the soil profile isrelatively uniform.
The elevated depressional and toeslope Hamar andUlen soils (Sites 1 and 5) are characterized by medianp similar to the Hecla soils. However, the variabilityof p represented by the hinges and ranges (Fig. 8) islarger. Inclusion of the Hamar and Ulen soils in com-posite analysis results in no change in the overall me-dian value, and a slight increase in the mean value(Table 3). The overall 95% confidence interval for theestimated mean as a predictor of the true mean de-creases somewhat because of the increase in the com-posite number of samples. The prediction envelopestill includes the Mualem predicted value.
Sites 6 and 8, while predominantly sandy, have me-dians, ranges, and first quartiles (hinges) that are sim-ilar to and larger than those of Sites 1 through 5.Medians and lower ranges are similar to the loamyand coarse-loamy materials of the Heimdal site (Site7). Analysis of the combined data for Sites 6, 7, and8 results in the mean, median, range, and 95% confi-dence interval that are nearly identical (Table 3). Thedata maxima for Sites 7 and 8 are also similar, al-though the * representation for the maximum valueon Site 8 indicates that the next highest value is muchlower (and within the inner fence value).
Statistical parameters for p in individual A, B, andC horizons of the Hecla series are in Table 3. Medianvalues and ranges did not vary greatly between hori-zons. Similar parameters for individual horizons ofcombined Sites 6, 7, and 8 indicate that deeper (B andC) horizons have both a larger p value, and a largerrange than the A horizon. The B and C horizons ex-hibit similar median values.
These data demonstrate that, for the Hecla soil inthe Oakes area, a reasonably tight range of p valuescan be used in estimating K(B) for modeling applica-tions, and that sandy soil series that are not charac-terized by high Na or erosional clay enrichment canalso be combined for a reasonably accurate estimateof p. For soils of finer texture, however, the variabilityof estimation is much larger. Pedological classificationof p for the Hecla soil series and for some combined

SCHUH & CLINE: PORE-INTERACTION FACTORS 1517
toposequential series is thus a feasible approach forevaluating the pore-interaction factor in applying 9(tyfor modeling unsaturated soil water movement in theOakes area. It is also a feasible option for applicationin numerous other study areas, particularly where soilprofiles are uniform in parent materials and in devel-opmental history. It is likely that soils characterizedby large hydraulic discontinuities within the solumwould have to be classified on the level of horizon, aswell as series or association.
CONCLUSIONThe variability of the pore-interaction factor used
in predicting K(6) from fl(*) data was examined inrelation to soil particle-size data and indices, Db, OC,functional parameters for the van Genuchten (1980)Q(V) functional format, an index of total energy ofdrainage (W) proposed by Mualem (1978), and soil-series, toposequential, and geographical groupings toassess the error of estimation and to evaluate possiblemethods for minimizing predictive error. The two spe-cific models tested were the macroscopic model (Eq.[5]) of Mualem (1978), which is derived using the as-sumption of macroscopic-scale similarity between thecapillary-flow (Appendix, Eq. [Al]) and Darcy-Buck-ingham law (Appendix, Eq. [A3]), and the Mualem(1976) model (Eq. [2]) for predicting K(6) based oncharacterization of the microscopic-pore-size distri-bution using soil water-retention data. The combinedscale-length and pore-interaction factor, 17, of the mac-roscopic model was found to be related to the W indexas an exponential function, compared with a linearfunction described previously by Mualem (1978).However, the description of 77 was nearly identical toMualem's function for W data extending from 0 to400 cm-7, including a ^-intercept value nearly iden-tical to that proposed by Mualem. The value of 77 wasalso found to be strongly related to the Gd as a powerfunction, and to other textural variables as exponentialfunctions. The increasing slope of the power functionfor Gd < 0.08 mm indicates that a large potential errorof prediction for K(6) occurs for soils of finer texture.
The p of the microscopic model exhibited no trendrelationship to any of the particle-size data or indices,or to any of the other hydraulic-parameter indicestested. A change in the distribution of p was discern-able in relation to soil particle-size properties and inrelation to W. Results demonstrated a large increasein predictive error for p on soils with Gd < 0.08 mm,with a much tighter margin of prediction defined forsoils with Gd >: 0.08 mm. The partition boundarybetween large and small error distribution for p vs. Wwas observed at approximately 200 cm-7. Examina-tion of p vs. Wfor other available data indicated thata similar W partition boundary value occurred.
Comparison of data for three Hecla sandy loam sitesindicated that the distribution of p between sites andbetween horizons on all sites was narrowly defined,and that grouping of p based on soil series would bea reasonable strategy for model application in the proj-ect area. Further inclusion of elevated depressional(Hamar series) and toeslope (Ulen series) sites in to-posequence with the Hecla sites indicated that both
Hamar and Ulen soils might be reasonably groupedwith Hecla soils without a large loss in predictive pre-cision. The Aryeson soil, however, a deep depressionalsandy loam soil series characterized by erosional clayenrichment, higher organic matter, CaCO3 within thesolum, and increased SAR more closely resembled thep distribution of the coarse-loamy Heimdal series site.
These results demonstrate that p predictions on largedata sites can be better refined by subdivision on ped-ological or textural bases. Based on 75 soil samples ofvarying texture, it appears likely that only two texturalsubdivisions might suffice for defining the distribu-tions of p on a wide variety of soil materials. However,other indices and increased data might allow for fur-ther subdivision and further definitional precision. Itis recommended that further work be done in large-scale combined-data analysis to refine the classifica-tion of pore-interaction parameters.
APPENDIX: THEORYBoth the microscopic and macroscopic pore models (Mu-
alem, 1976, 1978) are based on the representation of soilpores as an assemblage of capillary pores, subject to the cap-illary-flow equation
fl= - [Al]where u is the mean flow velocity for a capillary tube in m/s, 7 is the density of water in Mg/m3, g is the gravitationalconstant in m/s2, u is the kinematic viscosity of water in kgnr1 s-', C is a pore-shape-dependent factor, </> is soil-waterpressure in N/m2, z is the length of the capillary tube in m,and R is the pore radius in m. In applying Eq. [Al] to soil,Burdine represented the total soil porosity microscopicallyas a single, connected, wetted surface area of highly irregularshape (Burdine, 1952; Brooks and Corey, 1964). The variableR was then identified as a single macroscopic representativescale length (called the hydraulic radius) for the soil, to beused with a single composite or mean pore-shape (Q valuein representing bulk capillary flow. For Burdine, R was iden-tified as the pore surface area divided by the wetted perimeterof the composite macroscopic pore. The scale of applicationof R is the basis for Mualem's distinction between macro-scopic and microscopic K(ff) models (Mualem, 1978).Microscopic Models
The microscopic K(0) models are based on the assumption(Burdine, 1953; Brooks and Corey, 1964) that the macro-scopic R can be represented as the cumulative effect of anassemblage of discrete flow domains represented by corre-sponding pore hydraulic radii, r, such that
R2 = [A2]
By analogy with the Darcy-Buckingham equation for soilwater velocity, q, in m/s
q = ~K(Se) d<t>/dz [A3]where q = e U for flowing porosity, c, the nongradient por-tion of the right-hand term in Eq. [Al] is equated with K(Sf).
In practice, the flowing porosity is represented by the dif-ference between total and immobile water e = (6 — 0r), wherethe residual-moisture term is identified with immobile soilwater (water held tightly in thin films on the surfaces of soilgrains or within necks at grain contacts). Substitution for rin Eq. [A2], using the capillary rise equation

1518 SOIL SCI. SOC. AM. J., VOL. 54, NOVEMBER-DECEMBER 1990
^ = 2 cos\/gyr [A4]where X is the wetting angle, allows for the use of soil water-retention data [$(6)] in characterizing the overall effects ofpore-size distribution on water flow. Combining Eq. [Al],[A2], [A3], and [A4] and using the relative form (Eq. [3])results in the cancellation of constants (assuming a negligiblechange in cosX and a single composite C value over 5e) andresults in the Burdine model (Eq. [1]). A similarly derivedmodel modified to include the assumption of a proportionalrelationship between r and effective pore length was pre-sented by Mualem (1976), and is shown in Eq. [2].
Macroscopic ModelsThe macroscopic K(6) models (Mualem, 1978) retain R
on a macroscopic scale and do not identify R2 (Eq. [Al])with an assemblage of discrete hydraulic-radius subdomains.The two-dimensional topological derivation of/? as the ratioof pore area to pore perimeter was defined by Mualem (1978)as the equivalent ratio between mobile pore area and a pe-rimeter defined by the boundary between mobile porosityand residual porosity. Mualem (1976) quantified this rela-tionship as a ratio of mobile pore-water volume to the arealinterface of mobile and immobile water (Aw):
KT = Se<2/* + 3> [A10]
R = (0- 0r)A4w [A5]which is the three-dimensional equivalent of the topologicaltreatment of Brooks and Corey (1964) and results in the samelength scale.
Equations [Al] and [A3] are equated and a single meanC value is assumed, as in the microscopic approach. Fol-lowing the cancellation of constants, the relative form, KT,is represented as
KT = (AJA^SI [A6]where As is the saturated value for Aw. lfAw is constant forall Se, then Eq. [A6] further reduces to a third-order functionof Sf. However, Mualem (1978) suggested that, as large poresdrain, the interfacial area between flowing and nonflowingpores decreases as a power function of flowing porosity
Av = As of [A7]which results in the function described in Eq. [5], where ais assumed within the gross i\ parameter. The empirical factora is attributed to both the concentration of immobile waterinto soil comers with decreasing 6, on sandy soils, and thequantitative decrease in 6r with decreasing 8 on finer soils.
Mualem (1978) provided an empirical calibration for thecombined macroscopic scale-length and pore-interaction fac-tor ri using 50 soils. Because 6(9) data are required for ap-plication of Eq. [5] in most modeling applications, heinvestigated an index
W /: 7*d0 [A8]
W (cm-?) is an index of the total energy required to draina unit volume of saturated soil. Mualem chose 1.5 MPa (15bar) as the upper boundary of integration because of its com-mon availability as the wilting point. The result was a linearrelationship between ?j and W, resulting in a modified cali-brated macroscopic model
J£ — £0.015 W+3.0 [A9]Mualem reported that K, predictions using Eq. [A9] com-pared well with results using microscopic pore-distributionmodels.
Finally, it is observed that Eq. [5] corresponds to the finalform of the K£Se) function predicted for the Burdine model(Eq. [1]) using the Brooks and Corey function
where b is the slope of the log-log St vs. (*/*j) curve for ¥ba = — \/b, and the pore-interaction factor is contained with-in the constant 3 = 1 + p, or p = 2, which is similar to thevalue proposed by Burdine (1953). While a theoretical linkbetween the Mualem macroscopic and Burdine microscopicderivations is not apparent, the similarity is of practical in-terest in comparing the applications of K(St) models.
ROSS & BRISTOW: SIMULATING WATER MOVEMENT IN LAYERED SOILS 1519