effect of soil erosion on the pahang river plume
TRANSCRIPT
International Journal of Applied Environmental Sciences
ISSN 0973-6077 Volume 11, Number 3 (2016), pp. 833-845
© Research India Publications
http://www.ripublication.com
Effect of Soil erosion on the Pahang River plume
Dawi Muftah Ageel*1
Department of environmental sciences Faculty Science and Technology(FST), University Kebangassan Malaysia (UKM), Malaysia.
Tukimat Bin Lihan2
Department of environmental sciences Faculty Science and Technology(FST), University Kebangassan Malaysia(UKM), Malaysia.
Sahibin Abd Rahim3
Department of environmental sciences Faculty Science and Technology(FST), University Kebangassan Malaysia(UKM), Malaysia.
Zulfahmi Abd Rahman4
Department of environmental sciences Faculty Science and Technology(FST), University Kebangassan Malaysia(UKM), Malaysia.
Abstract
Rapid urbanization has accelerated impact on the catchment hydrology and
geomorphology. When the land use and land cover change as a result of
development or human activities, such as replanting which takes place in river
catchment areas, the dramatic increase in the surface runoff and higher
sediment yield are expected. The present study attempts to give an overview
of the channel changes and sediment transport phenomena in Pahang River
including sediment yields movement from the upstream to the river mouth at
Pekan. The sediment transport occurred due to the erosion in river catchment
areas. Total sediment yield from the forested catchment to downstream of
Pahang River basin was investigated from January 2005 to December 2010.
Data were measured namely the rainfall depth, the total sediment yield and
total suspended matter (River plume) at five sampling stations along the river.
Twelve rainfall events were recorded with highest annual rainfall value of 583
mm was received on December 2010, while the lowest rainfall value was
recorded on May 2005 (192 mm). Meanwhile, the annual value of TSY (total
sediment yield) ranges from 172.8 to 622.8 ton /ha/yr. The average TSM (total
suspended matter) ranges from 6.23 to119.47 mg/l. From the results there was
the strong positive relationship (r2=83) between total sediment yield and total

834 Dawi Muftah Ageel et al
suspended matter, therefore, the effect of soil erosion on Pahang River plume
was remarkable.
Keywords; Pahang River, total sediment yield, total suspended matter,
Rainfall, River plume.
Introduction
In recent years, it has been confirmed that high sediment yields are associated with
tropical conditions. Bare soil is highly susceptible to rain splash and washes erosion,
and arid zones produce record suspended sediment concentrations. The sediment not
only causes water quality to deteriorate but also affects physical and biological
conditions in the receiving systems (Walling & Webb,1983). The effect of soil
erosion on suspended sediment transport is necessary for Investigating and
understanding the environmental impact on the coastal area. In addition, detection of
seasonal variations of suspended sediment intensity and sediment loads is the most
important objectives of environmental monitoring since trend detection provides
useful information for sustainable development and long-term planning of water
resources. The increasing of sedimentation loads in the river has caused many
environmental problems such as degrading water quality by (i) carrying pollutants
(i.e. heavy metals and pesticides) and nutrients (i.e. phosphorus and nitrogen), (ii)
reducing the penetration of light because of turbidity and (iii) decreasing the river
depth when sediments are deposited in the river (Park et al., 2011). High suspended
sediment concentrations in the river also can affect the aquatic organisms by clogging
the gill of the fish, interfering with their natural movement and migration and
disturbing the development of eggs and larvae by reducing the concentrations of
dissolved oxygen in the river (Billota and Brazier, 2008). The transportation of
sediment to the river can be classified into three types; (i) overland flow, (ii) rainfall
impact, and (iii) combination between overland flow and rainfall impact. The rate of
soil detachment is depending on the rainfall intensity, a diameter of raindrops and
erodibility of the soil surface. The smaller drops and lower rainfall intensity will lead
to less efficient in sediment removal from the soil surface (Beuselinck et al., 2002).
The small particles of sediment that detached by rainfall impact become suspended in
the overland flow and transported downslope while larger particles of sediment are
transported to the river by rolling over the bed. Human activities and changes of land
use have potential to cause the variability of sediment loads recorded at the river
(Thothong et al., 2011). The rate of soil detachment is depending on the rainfall
intensity, the diameter of raindrops and erodibility of the soil surface. The smaller
drops and lower rainfall intensity will lead to less efficient in sediment removal from
the soil surface. The small particles of sediment that detached (Ward et al., 2009).
Study Area
Following is the data covered by this study: 3,807.38 km2 having latitude 3º 00' N - 4º
00' N and longitude of 102º 40'00' E - 103º20' 00' E. The Pahang River is the longest
river in Peninsular Malaysia. The Pahang River emerges from Banjaran Titiwangsa,

Effect of Soil erosion on the Pahang River plume 835
with the height of 7,175 ft (2,187m). It carves through the valleys and flowing into the
Southern China Sea. The width of the river reaches beyond 800m with respect to its
downstream measurement, and it further develops in the peat forests’ lowlands
(Yusuke et al.2013). Due to the heavy rainfalls throughout the year, the volume of the
water increases, sometimes causing floods in the nearby areas. The high and low
slopes were seen in the south-western and north-western, and southeastern and
northeastern region of the catchment area, respectively. The vegetation here
comprises of dense forest (primary forests), palm oil, rubber, agricultural crops and
paddy, besides the mining areas and the urban zones (no vegetation). Table 1 and
Figure 1 shows the five riverine branches found in the downstream of the Pahang
River basin. These five sub rivers : Jempol River, Lipis River, Temerlong River,
Mentiga River and Luit River. Towards the low level in one of the Kuantan channels,
there is the Lepar River, which basically is a body of a lot of water. It is situated mid-
north of the study area and it goes through a huge area found through the agricultural
plantation and secondary forests. The Mentiga River runs to a Pahang River’s low
level downstream.
Table 1 Sub catchments of study area and their area
Sub-catchments Average elevation Area (Km2) Area (%)
Sungai Luit 263 meters (863 feet) 291 26.77
Sungai Lepar 76 meters (249 feet) 422 38.82
Sungai Mentiga 122 meters (400 feet) 248 22.82
Sungai Temerlung 56 meters (120 feet) 72 6.62
Sungai Jempul 61 meters (200 feet) 54 4.97
Figure 1 Study area and the sub-catchments

836 Dawi Muftah Ageel et al
Materials and Method
Total sediment yield and total suspended matter data were obtained from DID using
daily data for study period 2005 to 2010. Archived suspended-sediment data were
obtained from the gauging stations of Department of Irrigation and Drainage (DID).
The DID gauge stations located at Kubang Paku,Kuala Lepar, Kuala Jempol, Lubuk
Paku, Serengakam, Tanjung Agas and Kuala Pahang. For total suspended matter
data,twenty-five sampling stations front Pahang River delta in the coastal area. From
archive DID data (2005 to 2010) of the Pahang river estuary showed decreasing
values of TSY and TSM concentrations in the earliest estimation year (2005) and
slightly increased by the year 2006 to 2010. With no DID data to support the study in
some months. These data are significantly important in order to obtain the historical
view on the TSY and TSM concentrations in the Pahang river estuary during the study
period from 2005 to 2010. The relationship between the total sediment yield and total
suspended matter data were analyzed by using Regression analysis. In statistics, linear
regression is an approach to modeling the relationship between a scalar dependent
variable γ and one or more explanatory variables denoted x. The case of one
explanatory variable is called simple linear regression. The equation of the straight
line shown as following;
γ=α+βx
Which would provide a "best" fit for the data points. Here the "best" will be
understood as in the least-squares approach: a line that minimizes the sum of squared
residuals of the linear regression model. In other words, α(alpha) is the γ -intercept
and β(beta) the slope. (David 2009). In linear regression, the relationships are
modeled using linear predictor functions whose unknown model parameters are
estimated from the data. Such models are called linear models (Rencher and
William.,2012). Most commonly, the conditional mean of y given the value of X is
assumed to be an affine function of X; less commonly, the median or some other
quintile of the conditional distribution of y gave X is expressed as a linear function of
X. Like all forms of regression analysis, linear regression focuses on the conditional
probability distribution of y has given X, rather than on the joint probability
distribution of y and X, which is the domain of multivariate analysis. Linear
regression was the first type of regression analysis to be studied rigorously, and to be
used extensively in practical applications (Hilary 1967). This is because models which
depend linearly on their unknown parameters are easier to fit than models which are
non-linearly related to their parameters and because the statistical properties of the
resulting estimators are easier to determine (Yan 2009).
Results and Discussion
Relationship between Total Sediment Yield and Total Suspended Matter (TSM)
of Pahang River basin:
Total sediment yield and total suspended matter were recorded by DID data of study
period as showing in Figure 2 where showing the TSY and TSM concentrations

Effect of Soil erosion on the Pahang River plume 837
during Northeast monsoon and Southwest monsoon and Inter-monsoon from 2005 to
2010. TSY data and TSM data were simultaneous during a study period. No data in
some dates of the study period of the TSY and TSM data were not recorded at DID
data. In this study, data information was compared between TSY and TSM. The
gauging stations recorded TSY data in tons/day unit, this unit needs to be converted
into mg/l for regression correlation and TSM data recorded in mg/l unit. In this study,
the relationship between total sediment yield in river water and total suspended matter
in sea water was determine using linear regression. From the results of the annual data
to each of TSY and TSM, there was a strong positive relationship between total
Sediment Yield (TSY) and total Suspended Matter (TSM) in this study, where r
=0.686.as shown in Table 2. The seasonal data recorded highest TSY rate during
Northeast monsoon (wet season) in 2009 about 382.7 mg/l and 321.5 mg/l in
2010,and into Southwest monsoon(dry season), TSY value was 152.4 mg/l in 2010
and it was112.5 mg/l in 2009. While The TSM value during Northeast monsoon was
323.5 mg/l in 2009 and 203.7 mg/l into Southwest monsoon in 2009. TSM value was
252.5 mg/l into Northeast monsoon in 2010, and 168.2 mg/l into Southwest monsoon
in 2010.
Table 2 The annually of TSY and TSM values for study period (2005 to 2010)
Year TSY (mg/l) TSM (mg/l )
2005 338.2 252.8
2006 423.8 357.5
2007 512.5 455.3
2008 481.3 325.2
2009 553.7 477.5
2010 496.2 417.2
Based on the regression analysis, the relationship between TSY and TSM showed
correlation during the Northeast and Southwest monsoon (Figure 2 (a,b)) highest
correlation between TSY and TSM, occurred during Northeast monsoon. The R2 for
the relationship between TSY and TSM was high positive (R2=0.69) during Northeast
monsoon and was high positive (R2=0.65) during Southwest monsoon (Figure 2(b)).
In Figure 3 shown the relationship between TSY and TSM during inter-monsoon of
study period, where was positive ( R2 = 0.71) in April and R2 = 0.67 in October, this
is mean that highest TSY and TSM value recorded in inter-monsoon was 118.3 mg/l
and 92.2 mg/l, respectively, in 2006. While in October was highest value 125.8 mg/l
and 98.8 mg//l in 2008. The lowest of TSY and TSM observed in April 2005 was 15.8
mg/l and 8.1 mg/l respectively, while was 18.8 mg/l and 12.7 mg/l respectively, in
October 2007.

838 Dawi Muftah Ageel et al
Figure 2 Validation from the relationship between TSY and TSM data using
regression analysis during Northeast monsoon (a) and Southwest monsoon (b) during
study period.

Effect of Soil erosion on the Pahang River plume 839
Figure 3 Validation from the relationship between TSY and TSM data during inter-
monsoon, (a) April and (b) October during study period.
The main transport pathway of the TSY is the site to the stations in Kuala Pahang,
relating to the discharge amount. It was observed that Tanjung Agas retained more
TSY, which increased the sediments. Also during Southwest monsoon, TSY in the
Kuala Pahang channel was less than 100 mg/l. The pattern of shallow channel
retaining the TSY was similar, as the concentration in Tanjung Agas channel was
840 Dawi Muftah Ageel et al
between 80 to 90 mg/l. Although good correlations were produced, the data for
determining TSY and TSM as shown in Figure 6.2 observed the relation between
TSY and TSM. TSM was affected by TSY in Pahang river estuary. Regression line
results using mathematical model (R2) of the monthly data from DID to four months
expressed three monsoons during every year between TSY and TSM of Pahang River
for six years (2005-2010),were during 2005 (R²=0. 54), 2006 (R²=0.69), 2007
(R²=0.66), 2008(R²=0.63) 2009 (R²=0.72),and 2010 (R²=0.76),showed that there were
significant positive relationship was strongest in 2010 and lowest in 2005. This
relationship indicated that, the increase of TSY lead to the increase of TSM in Pahang
River plume.
Effect Rainfall on Total Sediment Yield (TSY) and Total Suspended Matter
(TSM):
From the results in Figure 6.3, the regression analysis had been used to identify the
relationship between total sediment yields with the rainfall intensity. The results
showed a strong positive relationship between the rainfall intensity and each of TSY
(R2 = 0.77) and TSM (R2 =0.71). The linear regressions result shows 77% of the total
sediment yield (TSY) at Pahang River stream is influenced by the rainfall intensity.
The remaining 23% of the variations have been due to other factors such as
topography of the basin, soil types, land use and vegetation cover. These results mean
that effect of rainfall on variation loads of TSY was 77% while effect it on TSM was
71%, so these percentages indicate to high effect from rainfall values during study
period on TSY and TSM rates. The remaining of the variations to TSY and TSM were
23% and 29 %, because of another factor, for TSY due to the area of the basin, land
use, the erodibility of the soil, the slope of the land and the area of impervious surface
within the basin also can influence the relationship between rainfall intensity with
stream flow. For TSM was these factors includes upwelling, wind currents, water
depth in the coastal (Prathumratana et al., 2008).
An increased of rainfall intensity during the wet period had resulted in an increase in
TSY and TSM. The rainfall not only transports the suspended matter to the river but
also influences the sediment detachment process. The high intensity and long duration
of rainfall can detach more sediment from the soil surface and transported them to the
river. The high intensity of rainfall also can cause land sliding events which could
supply a huge amount of suspended sediment to the river (Lin et al., 2012).

Effect of Soil erosion on the Pahang River plume 841
Figure 4 Effect Rainfall on Total Sediment Yield (TSY) and Total Suspended Matter
(TSM) during study period.
The relationship between Total Sediment yield and Pahang River plume area:
From the results by regression analysis as shown in Figure 5 and Table 3. Annually
plume area rates were a high during Northeast monsoon about 1350 to 1623 km2 with
annually TSY values from 3×10⁻⁶ to 5×10⁻⁶ ton/km2/yr respectively into same

842 Dawi Muftah Ageel et al
monsoon. Also annually plume size rates were a low about 300 to 650 km2 with
annually TSY values 0.4×10⁻⁶ to 2 ×10⁻⁶ ton/km2/yr respectively into Southwest
monsoon. The relationship between plume size and effective TSY is depicted in
Figure 5 and Table 3. The results recorded highest value was 1.63 ×10⁻⁶ in November
2009 with 1823 km2 in same the month and lowest value was 0.32 ×10⁻⁶ ton/km2/yr in
May 2005 with 318 km2 in same the month. The relationship between TSY and River
plume area values were strong positive ( R2 = 0.77).
Figure 5 The relationship between Total Sediment yield and Pahang River plume area
during study period.
Table 3 Total Sediment yield and Pahang River plume area during study period
Year Total Sediment yield (ton/km2/yr) Plume area (km2 )
2005 2.98×10⁻⁶ 3732.24
2006 4.48×10⁻⁶ 5175.06
2007 3.21×10⁻⁶ 4234.83
2008 3.78×10⁻⁶ 5218.17
2009 5.69×10⁻⁶ 5411.85
2010 5.22×10⁻⁶ 5650.85
The plume size into of the river estuary during the study period, was strongly affected
by the TSY values during November and December of the Northeast monsoon, the
plume size extends further to offshore and begins to distribute southeast and
southwards. A strong wind current pushes the offshore plume and directed it. During
this monsoon, the East coast of Peninsular Malaysia has a heavy rainfall, where cause
the floods. So the Pahang River discharges are higher during Northeast monsoon, this
reflects the high suspended matter in Pahang estuary and coastal area and effect on the
Effect of Soil erosion on the Pahang River plume 843
marine biology. The strong value of TSY exhibited during this period might be
associated with re-suspension of suspended matter at the bottom of the estuary by the
combination of strong wind mixing and current event which also reported by Hetland
(2005) and Walker et al. (2005). In the inter-monsoon (April), the TSM values extent
along offshore and it’s not strongest from Northeast monsoon values. During
Southwest monsoon (May to September) TSY values effect on plume area
distributions are less, where the plume was low due to rainfall was low. During the
southwest monsoon, the plume was directed to the north due to the southwest wind. In
In the inter-monsoon (October), during the transition from dry season to wet season
the plume propagated offshore and extended to the sea. During this period, the TSM
values increased, indicating to the transition from dry to wet season. During the study
period, the river plume is very low due to the low intensity of precipitation. This
condition will cause the influence of river plume to carry out dissolved substances and
suspended sediments from the river mouth weakened and indicating to the low TSY
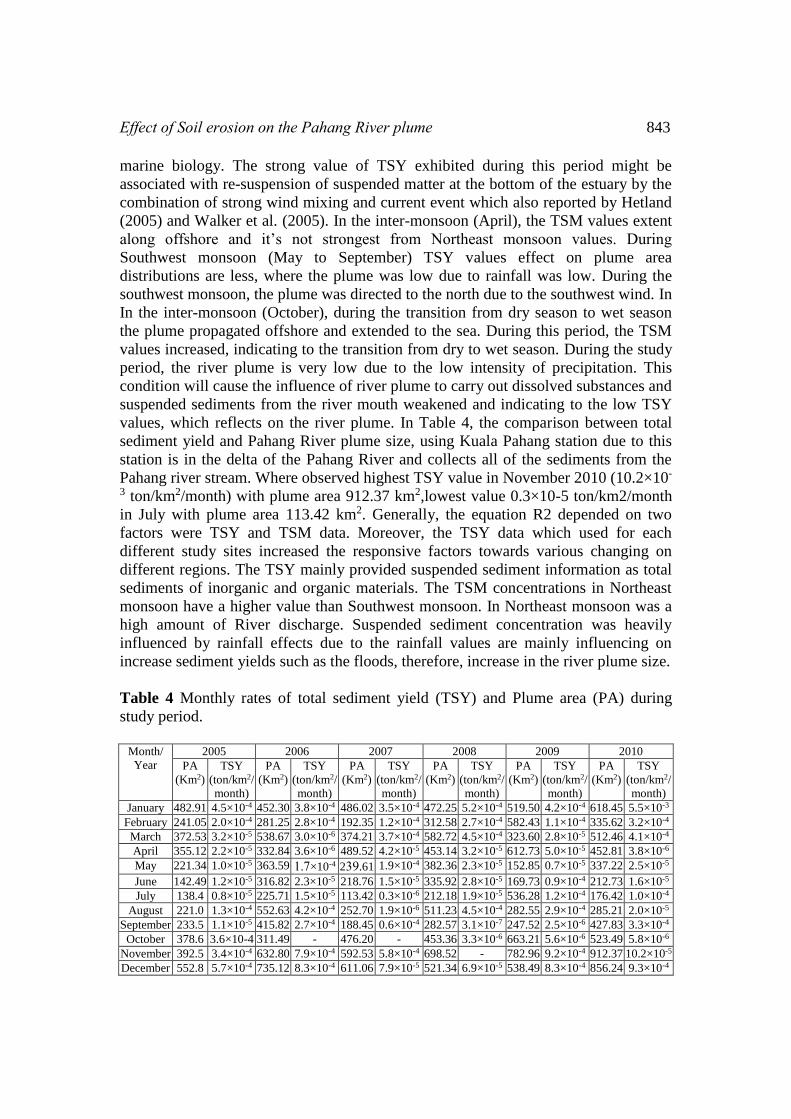
values, which reflects on the river plume. In Table 4, the comparison between total
sediment yield and Pahang River plume size, using Kuala Pahang station due to this
station is in the delta of the Pahang River and collects all of the sediments from the
Pahang river stream. Where observed highest TSY value in November 2010 (10.2×10-
3 ton/km2/month) with plume area 912.37 km2,lowest value 0.3×10⁻⁵ ton/km2/month
in July with plume area 113.42 km2. Generally, the equation R2 depended on two
factors were TSY and TSM data. Moreover, the TSY data which used for each
different study sites increased the responsive factors towards various changing on
different regions. The TSY mainly provided suspended sediment information as total
sediments of inorganic and organic materials. The TSM concentrations in Northeast
monsoon have a higher value than Southwest monsoon. In Northeast monsoon was a
high amount of River discharge. Suspended sediment concentration was heavily
influenced by rainfall effects due to the rainfall values are mainly influencing on
increase sediment yields such as the floods, therefore, increase in the river plume size.
Table 4 Monthly rates of total sediment yield (TSY) and Plume area (PA) during
study period.
Month/
Year
2005 2006 2007 2008 2009 2010
PA
(Km2)
TSY
(ton/km2/
month)
PA
(Km2)
TSY
(ton/km2/
month)
PA
(Km2)
TSY
(ton/km2/
month)
PA
(Km2)
TSY
(ton/km2/
month)
PA
(Km2)
TSY
(ton/km2/
month)
PA
(Km2)
TSY
(ton/km2/
month)
January 482.91 4.5×10⁻⁴ 452.30 3.8×10⁻⁴ 486.02 3.5×10⁻⁴ 472.25 5.2×10⁻⁴ 519.50 4.2×10⁻⁴ 618.45 5.5×10⁻³
February 241.05 2.0×10⁻⁴ 281.25 2.8×10⁻⁴ 192.35 1.2×10⁻⁴ 312.58 2.7×10⁻⁴ 582.43 1.1×10⁻⁴ 335.62 3.2×10⁻⁴
March 372.53 3.2×10⁻⁵ 538.67 3.0×10⁻⁶ 374.21 3.7×10⁻⁴ 582.72 4.5×10⁻⁴ 323.60 2.8×10⁻⁵ 512.46 4.1×10⁻⁴
April 355.12 2.2×10⁻⁵ 332.84 3.6×10⁻⁶ 489.52 4.2×10⁻⁵ 453.14 3.2×10⁻⁵ 612.73 5.0×10⁻⁵ 452.81 3.8×10⁻⁶
May 221.34 1.0×10⁻⁵ 363.59 1.7×10⁻⁴ 239.61 1.9×10⁻⁴ 382.36 2.3×10⁻⁵ 152.85 0.7×10⁻⁵ 337.22 2.5×10⁻⁵
June 142.49 1.2×10⁻⁵ 316.82 2.3×10⁻⁵ 218.76 1.5×10⁻⁵ 335.92 2.8×10⁻⁵ 169.73 0.9×10⁻⁴ 212.73 1.6×10⁻⁵
July 138.4 0.8×10⁻⁵ 225.71 1.5×10⁻⁵ 113.42 0.3×10⁻⁶ 212.18 1.9×10⁻⁵ 536.28 1.2×10⁻⁴ 176.42 1.0×10⁻⁴
August 221.0 1.3×10⁻⁴ 552.63 4.2×10⁻⁴ 252.70 1.9×10⁻⁶ 511.23 4.5×10⁻⁴ 282.55 2.9×10⁻⁴ 285.21 2.0×10⁻⁵
September 233.5 1.1×10⁻⁵ 415.82 2.7×10⁻⁴ 188.45 0.6×10⁻⁴ 282.57 3.1×10⁻⁷ 247.52 2.5×10⁻⁶ 427.83 3.3×10⁻⁴
October 378.6 3.6×10⁻⁴ 311.49 - 476.20 - 453.36 3.3×10⁻⁶ 663.21 5.6×10⁻⁶ 523.49 5.8×10⁻⁶ November 392.5 3.4×10⁻⁴ 632.80 7.9×10⁻⁴ 592.53 5.8×10⁻⁴ 698.52 - 782.96 9.2×10⁻⁴ 912.37 10.2×10⁻⁵
December 552.8 5.7×10⁻⁴ 735.12 8.3×10⁻⁴ 611.06 7.9×10⁻⁵ 521.34 6.9×10⁻⁵ 538.49 8.3×10⁻⁴ 856.24 9.3×10⁻⁴

844 Dawi Muftah Ageel et al
Conclusion
The study shows the importance of forest covers in reducing the surface erosion. The
reserve Forest plays a vital role in controlling surface erosion and rainfall
interception. At the same time, sediment concentration is closely related to rainfall
events which increase river regimes especially in terms of river discharge. Suspended-
sediment yields carried out by the soil erosion during the river catchments occurred in
low values. This indicates that erosion, although occurred in the study area, was still
within the acceptable value. It is extremely important to preserve the forest as one of
the best practices in controlling over sediment yield in the study area
Acknowledgement
The authors would like to acknowledge to Department of Irrigation and Drainage
Malaysia for providing data and reports, and for rainfall data that was important in
this study. Also, Our thanks to university's library to support us by the important
sources in this study.
References:
[1] Beuselinck L, Govers G, Hairsine PB, Sander GC,Breynaert M. 2002.The
influence of rainfall on sediment transport by overland flow over areas of net
deposition. Journal of Hydrology, 257:145-63.
[2] Billota., G.S, Brazier RE. 2008.Understanding the influence of suspended
solids on quality and aquatic biota. Water Research. J, 42: 2849-61.
[3] David., A. F.(2009). Statistical Models: Theory and Practice. Cambridge
University Press. 216pp.
[4] Hetland, R.2005.Relating river plume structure to vertical mixing, J. Phys.
Oceanogr., 35(9), 1667–1688.
[5] Hilary., L. S.1967. The historical development of the Gauss linear model.
Biometrika 54 (1/2): 24pp.
[6] Park,. JH, Inam E, Abdullah MH, Agustiyani D, Duan L,Hoang TT. 2011.
Implications of rainfall variability for seasonality and climate-induced risks
concerning surface water quality in East Asia. Journal of Hydrology; 400:
323-32.
[7] Prathumratana L, Sthiannopkao S, Kim KW. 2008.The relationship of climatic
and hydrological parameters to surface water quality in the lower Mekong
River. Journal of Environment International, 34: 60-66.
[8] Rencher, A., C.; William., F. (2012). Methods of Multivariate Analysis. Wiley
Series in Probability and Statistics. John Wiley & Sons, ISBN
9781118391679, 709 (3rd), 19pp.
[9] Thothong W, Huon S, Janeau JL, Boonsaner A, Rouw A de, Palnchon O,
Bardoux G, Parkpian P. 2011.Impact of land use change and rainfall on
sediment and carbon accumulation in a water reservoir of North Thailand.
Agriculture, Ecosystem and Environment,140(3-4): 158-66.
Effect of Soil erosion on the Pahang River plume 845
[10] Ward., P.J, Van Balen RT, Vertraeten G, Renssen H,and Vandenberghe
J.2009. The impact of land use and climate change on late Holocene and
future suspended sediment yield of the Meuse catchment.
Geomorphology.J;103: 389-400.
[11] Walling, D. E. & Webb, B. W. (1983) Patterns of sediment yield. In:
Background to Palaeohydrology (ed. By K. J. Gregory) Pergamon, New
York., 69-100pp.
[12] Yan, X. (2009). Linear Regression Analysis: Theory and Computing, World
Scientific, 1–2pp.
[13] Yusuke.M, Yuichi.K, Yuta.T, Chika.M and Zulkafli.R.(2013). Ichthyofaunal
assessment of the Gelami and Tinggi Rivers, Pahang River System, eastern
Malay Peninsula, following construction of an adjacent building
complex.ISSN 1809-127X. 9(5): 1035–1042pp.