effect of socioeconomic status on middle school …
TRANSCRIPT

Running Head: Effect of SES on Attendance and MAP Scores 1
EFFECT OF SOCIOECONOMIC STATUS ON MIDDLE SCHOOL STUDENTS’
ATTENDANCE RATES AND MISSOURI ACHIEVEMENT PROGRAM
COMMUNICATION ARTS AND MATHEMATICS SCORES
By
Bob Willis
Submitted to
The faculty of the Educational Specialist Program
Northwest Missouri State University
Department of Educational Leadership
College of Education and Human Services
Maryville, MO 64468
Field Study Committee Members
Dr. Timothy J. Wall
Submitted in Fulfillment of Graduation Requirements for
61-723 WRITING & INTERPRETING EDUCATIONAL LITERATURE AND STATISTICS
AND 61-724 FIELD STUDY

Effect of SES on Attendance and MAP Scores 2
ABSTRACT
This study investigated the effect of socio-economic status (SES) on students’ attendance and
students’ achievement as measured by the communication arts and mathematics sections of the
Missouri Assessment Program (MAP) test. This study addressed existing data on current
seventh and eighth grade students at the middle school level in suburban Kansas City, Missouri.
This study used a causal-comparative research design to examine existing data on two groups of
students, based on their Free and Reduced Lunch (FRL) status. In this study, FRL status was
used as the determinant for SES. The students who were on FRL had statistically significant
(p=.000-.002) lower mean attendance rates and lower mean communication arts and mathematics
scale scores on the MAP test than their non-FRL peers. In addition, students’ attendance and
students’ achievement on the MAP test was shown to have a statistically significant (p=.000-
.029), negligible to weak positive relationship.

Effect of SES on Attendance and MAP Scores 3
TABLE OF CONTENTS
ABSTRACT .........................................................................................................................2
LIST OF TABLES ...............................................................................................................7
CHAPTER ONE: INTRODUCTION TO THE STUDY ...................................................8
Background
Conceptual Underpinnings
Statement of the Problem
Purpose of the Study
Research Questions
Null Hypotheses
Limitations of the Study
Delimitations of the Study
Definition of Terms
Summary
CHAPTER TWO: REVIEW OF RELATED LITERATURE ............................................16
Overview
Effect of SES on Attendance and MAP Scores 4
History of the National School Lunch Program
Student Certification for Free and Reduced Lunch
The Use of Free and Reduced Lunch as a Socio-Economic Status Determinant
Socio-Economic Status and Attendance
Socio-Economic Status and Achievement
The Relationship of Attendance and Achievement
Summary of the Literature Review
CHAPTER THREE: RESEARCH METHODOLOGY ...................................................28
Problem and Purpose of the Study
Study Group
Research Design
Variables Used in the Study
Research Questions
Null Hypotheses
Instrumentation and Data Collection
Data Analysis Strategies
Summary

Effect of SES on Attendance and MAP Scores 5
CHAPTER FOUR: PRESENTATION AND ANALYSIS OF DATA ............................35
Overview
Statement of the Research Questions
Results and Discussion for Research Question One
T-Test for Statistical Significance Between SES and Attendance
Results and Discussion for Research Question Two
T-Test for Statistical Significance Between SES and MAP Scores
Results and Discussion for Research Question Three
CHAPTER FIVE: OVERVIEW, FINDINGS AND RECOMMENDATIONS ...............45
Overview
Summary of Research Methods
Data Analysis
Discussion of Findings
Conclusions
Recommendations
APPENDIX A ....................................................................................................................53
APPENDIX B ....................................................................................................................54

Effect of SES on Attendance and MAP Scores 6
REFERENCES ..................................................................................................................55

Effect of SES on Attendance and MAP Scores 7
LIST OF TABLES
Table 1: The Relationship Between SES and Attendance (2011-2012) ...........................37
Table 2: The Relationship Between SES and Attendance (2012-2013) ...........................39
Table 3: The Relationship Between SES and MAP Scores for Current 7th
Graders ........41
Table 4: The Relationship Between SES and MAP Scores for Current 8th
Graders ........42
Table 5: The Relationship Between Attendance and Achievement for Current 7th
Graders
............................................................................................................................................44
Table 6. The Relationship Between Attendance and Achievement for Current 8th
Graders
............................................................................................................................................44

Effect of SES on Attendance and MAP Scores 8
CHAPTER ONE
INTRODUCTION TO THE STUDY
Background
Numerous studies in the past have examined students’ socioeconomic status and the
effect it can have on achievement (Harwell and LeBeau, 2010;Sirin, 2005; Stull 2013). The
same can be said for studies attempting to determine the link between students’ absences and
achievement (Gottfried, 2009; Gottfried, 2010; Gottfried, 2011; Ready, 2010; Morissey,
Hutchinson and Winsler, 2013). Because students’ achievement is of great importance for all
parties involved in the educational process, any factor affecting achievement should be closely
examined so that achievement can be maximized.
With the passage of the No Child Left Behind act (NCLB) in 2001, assessment and
accountability for student achievement became even more important to school districts (Braden
and Schroeder, 2004). For schools failing to meet adequate progress, federal funding can be
withheld (Braden and Schroeder, 2004). Because K-12 assessment is often measured through
standardized testing, it is important for educators to understand the factors which can affect test
scores.
In 2011, it was announced that states could apply for a waiver in order to free them of
some of the requirements of NCLB. As of September 2013, 42 states had been granted waivers
(U.S. Department of Education, 2013). Missouri is one of these states (Missouri Department of
Elementary and Secondary Education, 2012; Missouri Gets No Child Left Behind Waiver,

Effect of SES on Attendance and MAP Scores 9
2012). One of the requirements for receiving a waiver from NCLB is that states improve their
teacher evaluation systems, to include student growth and achievement as part of teacher
evaluations (Missouri Department of Elementary and Secondary Education, 2013; U.S.
Department of Education, 2013;). Because the Missouri Assessment Program (MAP) test is the
primary assessment tool for the state of Missouri (Missouri Department of Elementary and
Secondary Education, 2012), the measurement of student growth and achievement in Missouri
could possibly include student scores on the Missouri Assessment Program (MAP) Test. Under
the new Missouri Educator Evaluation System, student scores are now a part of a teacher’s
evaluation and can carry weight in any personnel and employment decisions a school might
make (Bock, 2012; Missouri Department of Elementary and Secondary Education, 2013). In
other words, student performance will help to determine a teacher’s proficiency level, and could
bear weight on whether or not a teacher is retained or let go (Missouri Department of Elementary
and Secondary Education, 2013).
Due to current legislation and the way in which Missouri Educators will be evaluated,
student achievement as measured by the MAP test is not only important for the student, but also
for teachers and administrators. While student achievement and success is the ultimate goal for
educators, the new evaluation system must also be taken into account. It is for these reasons that
all factors affecting student achievement should be examined in hopes of improving
achievement. (Bock, 2012; Missouri Department of Elementary and Secondary Education,
2013).
This study will examine student achievement as measured by the Missouri Assessment
Program in two middle schools in Suburban Kansas City, Missouri. The study will attempt to
determine if socio-economic status has an effect on student attendance and achievement, while
Effect of SES on Attendance and MAP Scores 10
attempting to gauge the level of relationship, if any, between attendance and performance on the
communication arts and mathematics portions of the MAP test.
Conceptual Underpinnings
In numerous studies, socio-economic status (SES) has been shown to be one of the
strongest correlates of student achievement (Barry, 2006; Sirin, 2005; Stull, 2013). In many of
these studies, student eligibility for free and reduced lunch (FRL) has been the determinant for
grouping students as low SES (Abbott and Joireman, 2001; Harwell and LeBeau, 2010; Sirin,
2005). While being eligible for FRL is not a fully descriptive determinant of SES (Harwell and
LeBeau, 2010; Lubienski and Crane, 2010; Sirin, 2005), it is a measure that is often used in
research because it is available for every student, is linked to government guidelines, and is easy
to obtain (Harwell and LeBeau 2010).
Student attendance has been shown to be positively correlated with student achievement
in past studies (Gottfried, 2009; Gottfried, 2010; Gottfried, 2011; Jones, 2006; Roby, 2004).
Some research has also been conducted in an attempt to find a relationship between SES and
attendance. Romero and Lee (2007) state that children from poor families are more likely to be
chronically absent than those with higher incomes. In their follow up to the 2007 study, Romero
and Lee (2008) examined maternal and family risk factors linked with student absences and
found that “children living in poverty, and to some extent low income children” (p. 3) were more
likely to be exposed to multiple risk factors than their higher income peers. In their study, the
authors found that children exposed to more risks were more likely to miss school than their
counterparts facing less risks (Romero and Lee, 2008).

Effect of SES on Attendance and MAP Scores 11
Research has shown both SES and attendance to have an effect on student achievement.
In this study, the researcher will continue to investigate these two variables and their possible
effect on achievement, but also investigate the possible relationship between SES and
attendance.
Statement of the Problem
As a result of the importance of standardized testing, it is imperative that educators are
aware of any and all factors that may affect student achievement. While there is existing
evidence from past studies about the relationship of SES and student attendance and SES and
student achievement, much of it has focused on school-level data from the primary grades. This
study will add to the body of knowledge by investigating this relationship using student level
data at the middle school level, which is an extremely important transitional period for students.
Purpose of the Study
This study will attempt to determine if there is a difference in attendance rates or MAP
scores of two groups: students who are eligible for free and reduced lunch, and students who are
not eligible for free and reduced lunch. One purpose of this study is to determine if there is a
difference between students’ attendance rates based on their SES grouping. This study will also
attempt to determine if there is difference between students’ achievement level as measured by
the communication arts and mathematics sections of the Missouri Assessment Program (MAP)
test based on their SES grouping. Finally, this study will investigate whether or not there is a
relationship between students’ attendance rate and students’ communication arts and
mathematics MAP scores.

Effect of SES on Attendance and MAP Scores 12
Research Questions
RQ1. Is there a significant difference in attendance rate at a suburban Kansas City,
Missouri school district when considering students from low SES backgrounds and those not
from low SES backgrounds?
RQ2. Is there a significant difference in communication arts and mathematics MAP
scores at a suburban Kansas City, Missouri school district when considering students from low
SES backgrounds and those not from low SES backgrounds?
RQ3. Is there a significant relationship between students’ attendance rate and students’
communication arts and mathematics MAP scores at a suburban Kansas City, Missouri school
district?
Null Hypotheses
Ho1: There is no significant difference in attendance rate at a suburban Kansas City,
Missouri school district when considering students from low SES backgrounds and those not
from low SES backgrounds.
Ho2: There is no significant difference in communication arts and mathematics MAP
scores at a suburban Kansas City, Missouri school district when considering students from low
SES backgrounds and those not from low SES backgrounds.
Ho3: There is no significant relationship between students’ attendance rate and students’
communication arts and mathematics MAP scores at a suburban Kansas City, Missouri school
district.

Effect of SES on Attendance and MAP Scores 13
Limitations of the Study
1. No student data were gathered to establish a baseline for this study. Students’
incoming abilities were not considered.
2. Students were grouped according to SES based on their free and reduced lunch status.
While FRL status is a good indicator of SES, it is not the only determinant of SES and students
may be affected by other factors.
Delimitations of the Study
1. This study only included currently enrolled 7th
and 8th
graders from two middle
schools in Suburban Kansas City, Missouri during the 2013-2014 school year.
Definition of Terms
The following terms and definitions were used by this study.
Attendance: For the purpose of this study, the term attendance will be defined as the
percentage of school days present in the school year.
Free and Reduced Lunch (FRL): A student is eligible for a free lunch if family income is
at or below 130% of the federal poverty rate. For a family of four, this would mean annual
income is at or less than $30,615 per year for the 2013-2014 school year. A student is eligible
for a reduced price lunch if family income is between 131% and 185% of the federal poverty
rate. For a family of four, this would me annual income of between $30,616 and $43,568 (United
States Department of Agriculture, 2013).

Effect of SES on Attendance and MAP Scores 14
Missouri Assessment Program test (MAP test): The standardized test used by the State of
Missouri to measure students’ progress in meeting the Show-Me Standards and GLE strands.
This test includes the assessments in communication arts, mathematics, and science. At the time
of this study, testing was required in communication arts and math in grades 3-8, and in grades 5
and 8 for science. Students’ correct responses on the test are given a MAP scale score, and these
scale scores are further broken down into four different achievement levels: Below Basic, Basic,
Proficient, and Advanced. (Missouri Department of Elementary and Secondary Education,
2012).
Missouri Department of Elementary and Secondary Education (DESE): The regulatory
agency for public education in Missouri grades K-12 . (Missouri Department of Elementary and
Secondary Education, 2012).
Socio-Economic Status: For the purpose of this study, FRL designation will be the
determinant of SES. Students currently on FRL will be considered to be of low-SES, while
students not on FRL will be considered to be of higher-SES.
Summary
The results of standardized tests such as the MAP test are of the utmost importance to
teachers and administrators. Therefore, it is important for all involved with education to
understand any factors that could affect these results. Past studies have examined the
relationship between SES and test scores as well as SES and attendance (Baxter, Royer, Hardin,
Guinn, and Devlin, 2011; Lamdin, 2001). Studies by Gottfried (2009, 2010, 2011) and others
have also examined the relationship between attendance and achievement. This study will build
on the knowledge of others and determine if there is a statistically significant difference between

Effect of SES on Attendance and MAP Scores 15
those students who are on FRL and those students who are not on FRL in attendance rate. This
study will also determine if there is a statistically significant difference between those students
who are on FRL and those who are not on FRL and MAP Communication Arts and Mathematics
scores. Finally, this study will determine if there is a relationship between students’ attendance
and students’ MAP Communication Arts and Mathematics scores. The results of this study will
give insight into how and where SES affects attendance and achievement and also how
attendance is related to achievement. Giving teachers and administrators this knowledge will
help them to understand factors related to attendance and achievement, and assist them in
developing new ways of thinking or policies to improve both student attendance and student
achievement.

Effect of SES on Attendance and MAP Scores 16
CHAPTER TWO
REVIEW OF LITERATURE
Overview
This chapter will present literature related to student socio-economic status, student
attendance, and student achievement, and relationships that literature suggests to exist amongst
the three. Sections on the history of the national school lunch program, Student certification for
free and reduced lunch, The use of free and reduced lunch as an SES determinant, Socio-
economic status and attendance, Socio-economic status and achievement, and the relationship of
attendance and achievement will be discussed.
Student achievement is important to all involved in the education process. The ultimate
goal of teachers and administrators is student success in school and in life. While in school, one
measure of student success is through standardized tests. Standardized testing became
supremely important to schools and teachers with the passage of the No Child Left Behind act of
2001 (Arce, Luna, Borjian, and Conrad, 2005; Braden and Schroeder, 2004). Although Missouri
has been granted an exemption from some of the requirements of NCLB, standardized testing is
still very important to school districts and teachers as the MAP test is used to compare school
districts and may be used in the new Missouri Educator Evaluation System (Missouri
Department of Elementary and Secondary Education, 2012).
Socio-economic status has been shown to adversely affect students’ lives in multiple
aspects, including school achievement (Morissey et al., 2013; Sirin, 2005). Students’ attendance
has also been shown to have an effect on student achievement (Gottfried 2009, 2010, 2011; Roby
2004). It is for these reasons the researcher chose to investigate whether students in a suburban

Effect of SES on Attendance and MAP Scores 17
Kansas City, Missouri school district on FRL score differently on the MAP test from their peers
not on FRL as well as whether the two groups’ attendance rates displayed a significantly
significant difference.
History of the National School Lunch Program
The National School Lunch Program (NSLP) became a permanently subsidized federal
program with the passage of the National School Lunch act of 1946 (Hinrichs, 2010). The act
was seen as a measure of national security. Schools have the option of participating in the
program. In exchange for federal subsidies, schools have to agree to a set of rules including
serving school lunches on a free or reduced basis to children whose families cannot afford the
full cost of a lunch (Gunderson, n.d.).
Student Certification for Free and Reduced Lunch
Today, a student is eligible for a free lunch if family income is at or below 130% of the
federal poverty rate. For a family of four, this would mean annual income is at or less than
$30,615 per year for the 2013-2014 school year (United States Department of Agriculture, 2013).
A student is eligible for a reduced price lunch if family income is between 131% and 185% of
the federal poverty rate. For a family of four, this would mean annual income of between
$30,616 and $43,568 (United States Department of Agriculture, 2013). Harwell and LeBeau
(2010) explain that students can be certified to receive FRL in two ways: through information
provided by the family, or through direct certification, “based on whether a household receives
food stamps…or participates in at least one federally funded assistance program…(p. 122). If
certification is done by the family, they simply fill out paperwork containing information on
household income and turn it in to the district. Certification that occurs through direct means is

Effect of SES on Attendance and MAP Scores 18
usually handled by a social service agency (Bass, 2010; Harwell and LeBeau, 2010). The goal of
the FRL program is to provide adequate nutrition to lower SES students in order to help them be
successful in school.
The Use of Free and Reduced Lunch as a Socio-Economic Status Determinant
Harwell and LeBeau (2010) extensively discuss the use of FRL status as an SES
determinant in their examination of past educational studies. The authors point out several faults
in using just FRL status when conducting research. One of the main problems for researchers is
to define just what constitutes SES. The authors state that “there is no widely agreed-upon
definition of SES or consensus on whether SES consists of a relatively modest number of
discrete classes or is best represented as a semi-continuous variable with possibly hundreds of
classes” (p. 122). The authors also argue that there is “compelling evidence that a significant
percentage of students are incorrectly certified as eligible or not eligible” (p. 124). This view
was also shared by Bass (2010) who argued that fraud was rampant in the program. Bass pointed
out that no verification of income is required when parents apply for FRL. While school districts
are required to attempt to verify a small portion of their participants each year, it has been shown
that “a high proportion of those asked to provide proof of income could not or would not
comply” (Bass, 2010, p.69). In addition, Bass stated that because schools receive more federal
assistance for each student on FRL, “local school districts have a clear incentive to register as
many students in NSLP as possible” (p. 68). Bass also argues that school districts often fail to
attempt to verify students’ eligibility for FRL (2010). Despite the shortcomings of using FRL
status as the determinant of SES in educational studies, Harwell and LeBeau (2010) state that:

Effect of SES on Attendance and MAP Scores 19
…the FRL variable is consistently defined because of its link to the government’s
poverty guidelines, is available for every student, is nonintrusive, is simple (eligible, not
eligible), and can be obtained relatively cheaply because information is taken directly
from school records. (p. 126)
While some studies did attempt to define and measure SES through a composite of
factors (Barry, 2005; Duncan and Magnuson, 2005; Milne and Plourde, 2006; Stull, 2013), the
majority of the studies, papers, and presentations the researcher found used FRL participation as
a determinant for SES (Brtik, 2013; Bulach, Malone and Castleman, 1995; Gottfried, 2009 and
2011; Jones, 2006; Morissey et al., 2013; Pennington, 2013). Baxter et al. (2011) maintain that
“SES can be difficult to collect at the individual child level because of parental privacy and
confidentiality concerns” (p. 419). Therefore, many researchers use FRL data in their studies
due to it being more readily available than other options (Harwell and LeBeau, 2010).
In their 2012 report, the Omaha Public School District (2012) state:
Although not the most precise indicator of poverty, student participation in the Free and
Reduced-Price Lunch program is the only indicator of socioeconomic status universally
available to public schools across the nation. (p. 1)
The use of FRL as the determinant for SES was also defended in a 2001 study for the
Washington School Research Center, where Abbott and Joireman state that:
While the percentage of students in a given school on free/reduced lunch is not a direct
measure of low income, it is at present the best existing measure, and it is used
extensively throughout comparable research literature. (p.5)

Effect of SES on Attendance and MAP Scores 20
Whereas the researcher realizes that FRL status is not the only possible determinant of
family SES, the researcher has chosen to use FRL as the determinant for SES because it is tied to
government standards and programs and because it is the data that is readily available.
Socio-economic Status and Attendance
The relationship between students’ SES and their school attendance was examined in
several studies. Hinrichs (2010) stated that “receiving a subsidized lunch may raise incentives to
attend school” (p. 2). However, his study did not examine attendance. Thottungal, Kern, Key,
and Sherman (2013) tell us that “Students who participate in the School Breakfast Program
(SBP) attend 1.5 more days of school annually…” (p. 4). While this statistic alone does not
suggest a relationship between SES and attendance, the authors suggest that making the SBP and
alternative breakfast programs more widespread would result in more low-income students to
participate, and in turn, raise their attendance rates (Thottungal et al., 2013).
Schagen and Benton (2006) found in their study of student attendance that “schools with
higher free school meal eligibility showed higher levels of absence (p. 30). Furthermore, in their
study attempting to link income, attendance, and achievement, Morissey et al. (2013) found
“very small but significant associations between the receipt of free or reduced-price lunch and
greater absences and tardies” (p. 7). Additional confirmation of the relationship between SES
and attendance was also found in 2010, when Ready noted the relationship between SES and
student attendance. Ready found that students of lower SES missed more school, but also that
other factors such as single parent homes and speaking a language other than English at home
contribute to absences (Ready, 2010). The case for the relationship between SES and attendance
was also strengthened with the results from a 2007 study by Romero and Lee. Using data from
Effect of SES on Attendance and MAP Scores 21
the Early Childhood Longitudinal Study, the authors found that “In all grades, the lower family
income, the higher the absenteeism rates” (p. 1).
While many studies did find a relationship between SES and attendance, in a 2011 study
conducted to determine the relationship between school absenteeism, body mass index, academic
achievement, and socioeconomic status, Baxter et al. investigated the effect of socioeconomic
status as determined by FRL status on student attendance and found that “These analyses fail to
support…the inverse relationship between absenteeism and SES that was expected and has been
found by other researchers (p. 422).
In summary, students’ SES and attendance rate has been studied by multiple researchers.
Many, but not all, have found a positive relationship to occur between these two variables.
Generally speaking, these studies suggest that as SES goes up, attendance rate also goes up.
Conversely, these studies suggest that as SES goes down, absences go up.
Socio-economic Status and Achievement
Numerous studies were found which explored the relationship between students’ socio-
economic status and achievement. Specific to Missouri, the Nation’s Report Card shows that in
2011, students in grade 8 who were on FRL scored 23 points lower than students not on FRL.
Similar results were seen for the same year in grade four, as students on FRL scored 22 points
lower than their peers not on FRL (U.S. Department of Education, 2011). The Nation’s Report
Card utilizes the NAEP mathematics assessment which is designed to “present a broad view of
what our nation’s students know and can do in mathematics” (National Center for Education
Statistics, More About NAEP Mathematics section, para. 1, 2012). Scores can range from 0-500

Effect of SES on Attendance and MAP Scores 22
on this test, which is given to a representative sample of students from all 50 states (National
Center for Education Statistics, 2012).
In 2013, Judith Stull used data from the Early Childhood Longitudinal Study to
investigate the effect of SES on achievement. She used a composite including income,
education, and occupation to determine SES. On a standardized general knowledge test, Stull
found that as family SES went up, so did the child’s achievement score. She also investigated
other possible variables such as type of school (public or private), teacher’s age, and child’s
gender but found that “family SES was always the most strongly related variable and was always
positive…” (p. 63).
Shores, Shannon, and Smith (2009), conducted a study on the effect of individual learner
variables and their effect on fifth and sixth grade students mathematics scores. This study found
a statistically significant positive relationship between those students on FRL and anxiety when
taking a test. The study also found a statistically significant negative relationship between those
students on FRL and mathematics achievement.
In their 2001 technical report, Abbott and Joireman examined standardized test scores in
the state of Washington to determine if there was a relationship between test scores, students on
FRL, and the ethnicity of students. In this study, the authors use school-level data to investigate
these relationships and define low income “as the percentage of students in a given school who
were on free or reduced lunch” (p. 5). Achievement was measured using two standardized tests.
In their findings, the authors conclude low income has more of an effect on achievement than
does ethnicity.

Effect of SES on Attendance and MAP Scores 23
Barry also investigated the relationship between SES and achievement in 2005. Data for
this study came from the 2002 Educational Longitudinal Study. The dependent variable in her
study was an NCES standardized test. Among her findings was that “SES, net of other factors is
at the .000 significance level and is the strongest predictor of test scores (.224)” (p. 20).
Furthermore, Barry pointed out that as SES goes down, so do test scores (Barry, 2005). Similar
findings occurred with school level data in the Pennington report for the Iowa department of
Education. Pennington found that as the percentage of students in a school district on FRL goes
down, average district scores in math, reading, and science go up (Pennington, 2013).
In 2005, Sirin investigated a large body of journal articles published from 1990-2000
which were all investigating the effect of SES on academic achievement. In this study, Sirin
discussed the many ways this relationship could be differently explored with a few of the
differences being: determinants of SES, level of data (school or district level vs. student level),
grade level, and the way academic achievement was measured. As a result of the study, Sirin
determined that “Of all the factors examined in the meta-analytic literature, family SES at the
student level is one of the strongest correlates of academic performance” (p. 438). The author
also states that the differences in classifying SES can alter the relationship between SES and
achievement.
In this section, several studies demonstrated the relationship between SES and student
achievement. These studies measured SES and achievement in multiple ways and came to
similar conclusions: SES and student achievement are related at the student, building, and
district level.

Effect of SES on Attendance and MAP Scores 24
The Relationship of Attendance and Achievement
The relationship of attendance to student achievement has been dissected in numerous
studies in the past, as well as in recent years. A few of the recent studies have been conducted by
Michael Gottfried (2009, 2010, 2011). In his 2009 study, Gottfried sought to investigate how
different absence types (excused, unexcused) might affect achievement. Using data from the
School District of Philadelphia, the 2000 Census, and results from the Stanford Achievement
Test – Ninth Edition (SAT-9), Gottfried determined that “increasing the number of total days
absent from school is related negatively to academic performance regardless of excused or
unexcused delineations” (p. 405). Of the relationship between SES and achievement, Gottfried
also found that “…the coefficients on being a special education student, English-language
learner, free lunch recipient…are negative and statistically significant” (p. 406). In other words,
students on FRL have lower average scores on the SAT-9 test than students not on FRL, and
students who have more absences also score lower on the SAT-9 test.
In the 2010 study, Gottfried sought to examine the relationship between attendance,
GPA, and standardized test performance at the individual student level. In this study, Gottfried
attempted to account for incoming differences in student ability by developing a baseline model
of student achievement. Among Gottfried’s findings was that “the relationship between
attendance and GPA is positive and significant and that this relationship becomes slightly
stronger for middle school students” (p. 448). Gottfried also found a statistically significant,
positive relationship between attendance and students’ scores on the SAT 9 test. This is
important, as it shows that as attendance rate goes up, so does test scores.

Effect of SES on Attendance and MAP Scores 25
Gottfried attempted to determine the relationship between attendance and achievement in
2011 in a study which included siblings in the Philadelphia School District. Consistent with his
earlier research, Gottfried found a significantly significant negative relationship between student
absences and student achievement on the SAT 9 test even when accounting for several student,
neighborhood, classroom, and teacher characteristics. Once again, as absences go up,
achievement goes down.
Looking beyond Gottfried, in 2001, Lamdin found that attendance was “positively and
significantly related to standardized achievement test performance” (p. 155). This study utilized
school level data from 107 elementary schools in Baltimore, Maryland. Lamdin’s study also
found a “strong positive correlation between no free lunch and attendance” (p. 157). This tells us
that as the number of students not on FRL goes up, attendance rates also go up. In 2004, Roby
also examined the effect of attendance on standardized testing in Ohio. Roby found a
statistically significant, positive relationship between attendance and the Ohio Proficiency Test at
the 4th
, 6th
, 9th
, and 12th
grade level. This data was also investigated at the building level.
Romero and Lee build upon this relationship in their study with data from the Early Childhood
Longitudinal study which suggests that “Greater absenteeism in kindergarten was associated
with lower achievement in reading, math, and general knowledge at the end of first grade” (p. 3).
In this section on the relationship between attendance and achievement, numerous studies
were cited which demonstrated the positive relationship between attendance and achievement.
As attendance goes up, so does achievement. Studies in this section also tied into the previous
section of this paper and again confirmed the positive relationship between SES and attendance.
Typically, higher SES has been shown to manifest itself in higher attendance rates when
compared to lower SES.

Effect of SES on Attendance and MAP Scores 26
Summary of the Literature Review
This chapter presented literature related to student socio-economic status, student
attendance, and student achievement, and relationships that have been proven to exist amongst
the three. Sections on the history of the national school lunch program, Student certification for
free and reduced lunch, The use of free and reduced lunch as an SES determinant, Socio-
economic status and attendance, Socio-economic status and achievement, and the relationship of
attendance and achievement were discussed.
To summarize this review of literature, students’ SES and attendance rate has been
studied by multiple researchers. Many, but not all, have found a relationship to occur between
these two variables. Generally speaking, students of lower SES have lower attendance rates than
those of higher SES. In addition, several studies demonstrated the positive relationship between
SES and student achievement. These studies measured SES and achievement in multiple ways
and came to similar conclusions: SES and student achievement are positively related at the
student, building, and district level. As a final point, numerous studies were cited which
demonstrated the positive relationship between attendance and achievement. As attendance goes
up, so does achievement. Through this literature review, links have been revealed between SES
and attendance, SES and achievement, and attendance and achievement.
As a result of the importance of standardized testing, it is imperative that educators are
aware of any and all factors that may affect student achievement. While there is existing
evidence from past studies about the relationship of SES and student attendance and SES and
student achievement, much of it has focused on school-level data from the primary grades. This

Effect of SES on Attendance and MAP Scores 27
study will add to the body of knowledge by investigating this relationship using student level
data at the middle school level, which is an extremely important transitional period for students.

Effect of SES on Attendance and MAP Scores 28
CHAPTER THREE
RESEARCH METHODOLOGY
Problem and Purposes of the Study
As a result of the importance of standardized testing, it is imperative that educators are
aware of any and all factors that may affect student achievement. While there is existing
evidence from past studies about the relationship of SES and student attendance and SES and
student achievement, much of it has focused on school-level data from the primary grades. This
study will add to the body of knowledge by investigating this relationship using student level
data at the middle school level, which is an extremely important transitional period for students.
This study will attempt to determine if there is a difference in attendance rates or MAP
scores of two groups: students who are eligible for free and reduced lunch, and students who are
not eligible for free and reduced lunch. The purpose of this study is to determine if there is a
difference between students’ attendance rates based on their SES grouping. This study will also
attempt to determine if there is difference between students’ achievement level as measured by
the Missouri Assessment Program (MAP) test based on their SES grouping. Finally, this study
will investigate whether or not there is a relationship between students’ attendance rate and
students’ MAP scores.
Study Group
This study group consisted of 7th
and 8th
grade students currently enrolled at two separate
middle schools in Suburban Kansas City, Missouri. The group consisted of 418 seventh graders,
and 418 eighth graders.

Effect of SES on Attendance and MAP Scores 29
This study group included students designated as receiving FRL benefits from the school,
and students not receiving FRL benefits from the school. In this study, 72 seventh graders
(17.2%) and 83 eighth graders (19.9%) were categorized as being eligible for FRL.
Research Design
This study utilized a causal-comparative research design. The causal-comparative design
was selected because neither the independent variables, nor the dependent variables were
manipulated because they had already occurred (Lunenburg and Irby, 2008).
Variables Used in the Study
This study utilized multiple independent (IV) and dependent (DV) variables in order to
examine the relationships between SES, attendance, and achievement. According to Kranzler
(2011):
An independent variable is a variable that is manipulated to determine its effect on
another variable. A dependent variable is the focus of most statistical analyses, because it
is the variable that is measured in response to manipulation of the independent variable.
(p. 31)
For RQ1: Is there a significant difference in attendance rate at a suburban Kansas City,
Missouri school district when considering students from low SES backgrounds and those not
from low SES backgrounds? The IV is SES status and the DV is attendance rate.
For RQ2: Is there a significant difference in MAP communication arts and mathematics
scores at a suburban Kansas City, Missouri school district when considering students from low

Effect of SES on Attendance and MAP Scores 30
SES backgrounds and those not from low SES backgrounds? The IV is SES status and the DV is
MAP communication arts and mathematics scores.
For RQ3: Is there a significant relationship between students’ attendance rate and
students’ MAP communication arts and mathematics scores at a suburban Kansas City, Missouri
school district? The IV is students’ attendance rate and the DV is students’ MAP
communication arts and mathematics scores.
Research Questions
RQ1. Is there a significant difference in attendance rate at a suburban Kansas City,
Missouri school district when considering students from low SES backgrounds and those not
from low SES backgrounds?
RQ2. Is there a significant difference in MAP communication arts and mathematics
scores at a suburban Kansas City, Missouri school district when considering students from low
SES backgrounds and those not from low SES backgrounds?
RQ3. Is there a significant relationship between students’ attendance rate and students’
MAP communication arts and mathematics scores at a suburban Kansas City, Missouri school
district?
Null Hypotheses
Ho1: There is no significant difference in attendance rate at a suburban Kansas City,
Missouri school district when considering students from low SES backgrounds and those not
from low SES backgrounds.

Effect of SES on Attendance and MAP Scores 31
Ho2: There is no significant difference in MAP communication arts and mathematics
scores at a suburban Kansas City, Missouri school district when considering students from low
SES backgrounds and those not from low SES backgrounds.
Ho3: There is no significant relationship between students’ attendance rate and students’
MAP communication arts and mathematics scores at a suburban Kansas City, Missouri school
district.
Instrumentation and Data Collection
Data for this study was collected with the assistance of school central office personnel
(See Appendix A). Prior to the collection of data, Institutional Review Board approval was
obtained (See Appendix B). Because this study involved existing data and the subjects remained
anonymous to the researcher, exempt status was granted.
Prior to the researcher’s receipt of the data, any identifying characteristics of students
were removed. Upon receipt of the data, the researcher separated the data into two categories:
Students who were receiving FRL and students who were not receiving FRL. Due to grade-level
differences in MAP index scores, students were also separated by current grade level: seventh or
eighth. For example, when in grade seven, the possible MAP communication arts scale score
range is 515-865, but in sixth grade, the possible range is a slightly different 505-855 (Missouri
Department of Elementary and Secondary Education, 2012). Because of these differences, the
researcher made the decision to separate data for students in seventh grade and students in eighth
grade.
Data to be examined include: FRL status, communication arts and mathematics MAP
test scores for the previous two years, and attendance rate for the previous two years. For FRL

Effect of SES on Attendance and MAP Scores 32
status, there are two possibilities: students who are on FRL, and students who are not on FRL.
The communication and mathematics MAP test scores for the current seventh graders are for
tests taken during their fifth and sixth grade years; scores for the current eighth graders are for
tests taken during their sixth and seventh grade years. Finally, attendance rate was defined as the
percentage of school days present in the school year.
This study used FRL status as the determinant for SES. For the purpose of this study,
SES data would be characterized as being on the nominal scale as students are assigned a
category based on their eligibility for FRL (Kranzler, 2011). This study also used the results
from the communication arts and mathematics portion of the MAP test. MAP test data was
collected at the interval level as the scale has equal units of measurement, but no absolute zero
(Kranzler 2011). MAP scale scores on the communication arts portion of the MAP test can
range from 485-865 over the fifth, sixth and seventh grade tests which are used in this study
(Missouri Department of Elementary and Secondary Education, 2012). MAP scale scores on the
mathematics portion of the MAP test can range from480-860 over the fifth, sixth and seventh
grade tests which are used in this study (Missouri Department of Elementary and Secondary
Education, 2012). While this scale score has equal units of measurement, there is no absolute
zero. Lastly, attendance data collected represented a percentage of school days a student was
present for the school year. This data would be considered to be on the ratio scale as it has a true
zero point and equal units of measurement (Kranzler, 2011).
Data Analysis Strategies
Data was analyzed using descriptive and inferential statistics. After receiving the data,
the researcher organized all data into Microsoft Excel and performed statistical calculations

Effect of SES on Attendance and MAP Scores 33
using EZ Analyze software. As part of this analysis, the mean, median, and mode were
calculated for students’ attendance rates and communication arts and mathematics MAP scores.
For research questions one and two, independent t-tests were calculated with an a priori
alpha level of α = .05 to determine if there was a significant difference between groups
attendance rates and MAP test scores (Lunenberg and Irby, 2008).
RQ1. Is there a significant difference in attendance rate at a suburban Kansas City,
Missouri school district when considering students from low SES backgrounds and those not
from low SES backgrounds?
RQ2. Is there a significant difference in communication arts and mathematics MAP
scores at a suburban Kansas City, Missouri school district when considering students from low
SES backgrounds and those not from low SES backgrounds?
For research question three, the product-moment correlation coefficient (Pearson’s r) was
used because the question merely investigates a relationship between two groups, and data is on
the interval and ratio scale (Lunenberg and Irby, 2008). Pearson’s r was calculated with an a
priori alpha level of α = .05 to determine if there was a statistically significant relationship
between students’ attendance rates and students’ achievement on the MAP test.
RQ3. Is there a significant relationship between students’ attendance rate and students’
communication arts and mathematics MAP scores at a suburban Kansas City, Missouri school
district?

Effect of SES on Attendance and MAP Scores 34
Summary
This chapter presented the Problem and purposes of the study, Study group, Research
design, Variables used in the study, Research questions, Null hypotheses, Instrumentation and
data collection, and Data analysis strategies.
This study will attempt to determine if there is a difference in attendance rates or MAP
scores of two groups: students who are eligible for free and reduced lunch, and students who are
not eligible for free and reduced lunch. One purpose of this study is to determine if there is a
difference between students’ attendance rates based on their SES grouping. This study will also
attempt to determine if there is difference between students’ achievement level as measured by
the Missouri Assessment Program (MAP) test based on their SES grouping. Finally, this study
will investigate whether or not there is a relationship between students’ attendance rate and
students’ MAP scores. Data from the district which includes information on the SES, attendance
rate, and MAP test scores was obtained and input into Microsoft Excel in order to investigate
these variables. Any differences or relationships will be determined through the use of
independent t-tests and Pearson’s r.

Effect of SES on Attendance and MAP Scores 35
CHAPTER 4
PRESENTATION AND ANALYSIS OF DATA
Overview
The purpose of this study was to determine if there is a difference in attendance
rates or MAP scores of two groups: students who are eligible for free and reduced lunch, and
students who are not eligible for free and reduced lunch. One purpose of this study was to
determine if there is a difference between students’ attendance rates based on their SES
grouping. This study will also determine if there is difference between students’ achievement
level as measured by the communication arts and mathematics sections of the Missouri
Assessment Program (MAP) test based on their SES grouping. Finally, this study will determine
whether or not there is a relationship between students’ attendance rate and students’
communication arts and mathematics MAP scores.
Statement of the Research Questions
This study addressed the following research questions:
RQ1. Is there a significant difference in attendance rate at a suburban Kansas City,
Missouri school district when considering students from low SES backgrounds and those not
from low SES backgrounds?
RQ2. Is there a significant difference in communication arts and mathematics MAP
scores at a suburban Kansas City, Missouri school district when considering students from low
SES backgrounds and those not from low SES backgrounds?

Effect of SES on Attendance and MAP Scores 36
RQ3. Is there a significant relationship between students’ attendance rate and students’
communication arts and mathematics MAP scores at a suburban Kansas City, Missouri school
district?
Results and Discussion for Research Question One
Research question one sought to determine if there was a difference in attendance rates
between students receiving FRL and students not receiving FRL. Attendance rates were
investigated for current seventh and eighth graders for the two previous school years (2011-2012
and 2012-2013). For the seventh graders, this would include their fifth and sixth grade years,
and for the eighth graders, their sixth and seventh grade years.
T-Test for Statistical Significance Between SES and Attendance
A t-test was applied to the data to determine if there was a statistically significant
difference in attendance rate in the 2011-2012 school year of students receiving FRL and
students not receiving FRL (see table 1). An a priori alpha level of .05 was established for this
study. The resultant significance level (p=.000) showed a statistically significant difference
between the groups, regardless of whether students were grouped together, or separated by grade
level. In both the seventh and eighth grade groups, students who were on FRL had a lower
average attendance rate than students who were not on FRL. The mean differences of the groups
(seventh grade – 1.781%, eighth grade 2.269%) may not appear to be a large difference on the
surface, but calculate out to 3 and 3.9 missed school days in a 174 day school year. This would
equate to students on FRL missing 18-23.4 more hours of instruction than their peers not on
FRL. For a group already known to have challenges, this could be substantial.

Effect of SES on Attendance and MAP Scores 37
Based on this independent t-test of difference between groups (FRL and no FRL),
information suggests a statistically significant difference between attendance rates of the groups
in the 2011-2012 school year. Alpha level was set by the researcher at (0.05); the observed
result was 0.000. Because the observed error was less than alpha, the researcher rejected the null
hypotheses which stated, “There is no significant difference in attendance rate at a suburban
Kansas City, Missouri school district when considering students from low SES backgrounds and
those not from low SES background” and accepted the alternative. Further research and
analysis should be conducted.
Table 1
The Relationship Between SES and Attendance (2011-2012)
Current 7th
& 8th
Graders Combined Current 7th
Graders Current 8th
Graders
F & R
Status
1=yes, 2=no Yes No Yes No Yes
No
Mean: 93.893% 95.929% 94.072% 95.853% 93.738% 96.007%
Std. Dev: 5.831 3.546 5.527 3.263 6.116 3.819
N: 142 649 66 329 76 320
Mean
Difference: 2.036%
1.781%
2.269%
T-Score: 5.426 3.537 4.088
Eta Squared: .036 .031 .040
P: .000 .000 .000
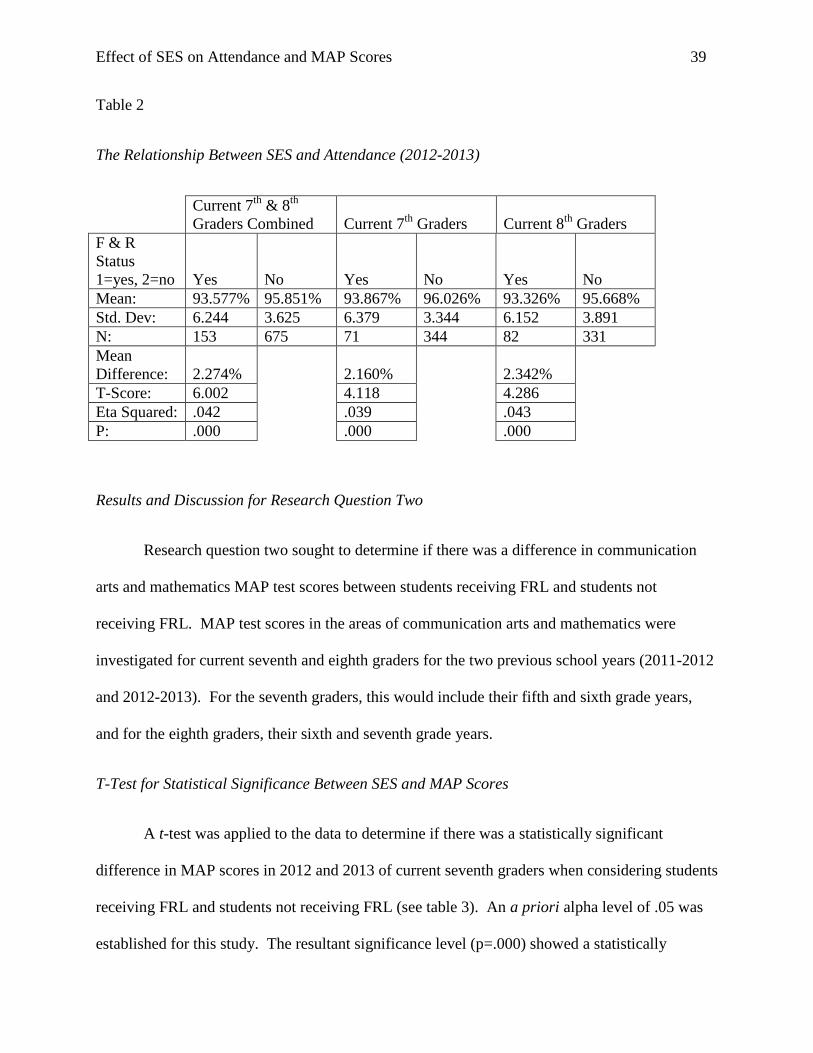
A second t-test was applied to the data to determine if there was a statistically
significant difference in attendance rate in the 2012-2013 school year of students receiving FRL
and students not receiving FRL (see table 2). An a priori alpha level of .05 was established for
this study. The resultant significance level (p=.000) showed a statistically significant difference
Effect of SES on Attendance and MAP Scores 38
between the groups, regardless of whether students were grouped together, or separated by grade
level. In both the seventh and eighth grade groups, students who were on FRL had a lower
average attendance rate than students who were not on FRL. The mean differences of the groups
(seventh grade – 2.160%, eighth grade 2.342%) may not appear to be a large difference at first,
but in this school year, these percentages calculate out to even more missed school time – 3.75
missed days for current 7th
graders, and 4.08 missed school days for current eighth graders in a
174 day school year. This would equate to students on FRL missing 22.5-24.48 more hours of
instruction than their peers not on FRL. If we look to the information gathered in the literature
review concerning attendance and achievement, we know that these missed instruction hours
could be detrimental to achievement (Gottfried, 2010; Lamdin, 2001; Ready, 2010; Roby, 2004).
Based on this independent t-test of difference between groups (FRL and no FRL),
information suggests a statistically significant difference between attendance rates of the groups
in the 2012-2013 school year. Alpha level was set by the researcher at (0.05); the observed
result was 0.000. Because the observed error was less than alpha, the researcher rejected the null
hypotheses which stated, “There is no significant difference in attendance rate at a suburban
Kansas City, Missouri school district when considering students from low SES backgrounds and
those not from low SES background” and accepted the alternative. Further research and
analysis should be conducted.
Effect of SES on Attendance and MAP Scores 39
Table 2
The Relationship Between SES and Attendance (2012-2013)
Current 7th
& 8th
Graders Combined Current 7th
Graders Current 8th
Graders
F & R
Status
1=yes, 2=no Yes No Yes No Yes No
Mean: 93.577% 95.851% 93.867% 96.026% 93.326% 95.668%
Std. Dev: 6.244 3.625 6.379 3.344 6.152 3.891
N: 153 675 71 344 82 331
Mean
Difference: 2.274%
2.160%
2.342%
T-Score: 6.002 4.118 4.286
Eta Squared: .042 .039 .043
P: .000 .000 .000
Results and Discussion for Research Question Two
Research question two sought to determine if there was a difference in communication
arts and mathematics MAP test scores between students receiving FRL and students not
receiving FRL. MAP test scores in the areas of communication arts and mathematics were
investigated for current seventh and eighth graders for the two previous school years (2011-2012
and 2012-2013). For the seventh graders, this would include their fifth and sixth grade years,
and for the eighth graders, their sixth and seventh grade years.
T-Test for Statistical Significance Between SES and MAP Scores
A t-test was applied to the data to determine if there was a statistically significant
difference in MAP scores in 2012 and 2013 of current seventh graders when considering students
receiving FRL and students not receiving FRL (see table 3). An a priori alpha level of .05 was
established for this study. The resultant significance level (p=.000) showed a statistically

Effect of SES on Attendance and MAP Scores 40
significant difference on both the communication arts and mathematics index score in both years
tested.
The mean difference in the current seventh graders’ scale scores for the communication
arts portion of the test was 21.015 in 2012 and 17.726 in 2013. The resultant differences in the
scale scores reveal a striking difference between the two groups. In both years, students on FRL
scored in the basic achievement level of the communication arts MAP test, while students not on
FRL scored in the proficient achievement level. For schools striving to get as many of their
students as possible into the proficient and advanced achievement-levels, this is huge.
The mean difference in the current seventh graders’ scale scores for the mathematics
portion of the test was 23.623 in 2012 and 21.927 in 2013. For the mathematics portion of the
test, the resultant differences in the scale scores demonstrate that both groups of students had
mean scores in the proficient achievement-level.

Effect of SES on Attendance and MAP Scores 41
Table 3
The Relationship Between SES and MAP Scores for Current 7th
Graders
MAP
Communication
Arts 2012
MAP
Mathematics
2012
MAP
Communication
Arts 2013
MAP
Mathematics
2013
F & R
Status
1=yes,
2=no 1 2 1 2 1 2 1 2
Yes 670.180 691.195 674.145 697.768 671.657 689.383 688.143 710.070
Std. Dev: 25.161 28.457 32.090 38.846 23.043 25.462 29.289 35.270
N: 61 323 62 323 70 342 70 342
Mean
Difference: 21.015
23.623
17.726
21.927
T-Score: 5.383 4.501 5.390 4.868
Eta
Squared: .070 .050 .066 .054
P: .000 .000 .000 .000
A second t-test was applied to the data to determine if there was a statistically significant
difference in MAP scores in 2012 and 2013 of current eighth graders when considering students
receiving FRL and students not receiving FRL (see table 4). An a priori alpha level of .05 was
established for this study. The resultant significance level (p=.000-.002) showed a statistically
significant difference on both the communication arts and mathematics index score in both years
tested.
The mean difference in the current eighth graders’ scale scores for the communication
arts portion of the test was 8.463 in 2012 and 12.060 in 2013. In this case, the resultant
differences in the scale scores tell us that the mean communication arts scores of both groups of
students would fall into the proficient achievement-level.

Effect of SES on Attendance and MAP Scores 42
The mean difference in the current eighth graders’ scale scores for the mathematics
portion of the test was 15.032 in 2012 and 13.893 in 2013. Again in this case, the resultant
differences in the mathematics scale scores tell us that the mean mathematics scores of both
groups of students would fall into the proficient achievement-level.
In each instance tested, there was a significantly significant difference in both
communication arts and mathematics scores on the MAP test between the two groups. While
this difference only resulted in a difference in achievement level in two tests (communication
arts scores of current seventh graders in 2012 and 2013), the fact that there was a statistically
significant difference in all areas is definitely something to examine further. Students who are
on FRL are scoring lower on the MAP test than students not on FRL in all cases, and as
educators, we need to examine ways to help close this gap.
Table 4
The Relationship Between SES and MAP Scores for Current 8th
Graders
MAP
Communication
Arts 2012
MAP
Mathematics
2012
MAP
Communication
Arts 2013
MAP
Mathematics
2013
F & R
Status
1=yes,
2=no 1 2 1 2 1 2 1 2
Mean: 678.547 687.009 690.427 705.459 682.463 694.523 698.684 712.578
Std. Dev: 26.208 26.585 35.121 32.406 35.253 30.792 34.138 34.675
N: 75 318 75 318 80 331 76 296
Mean
Difference: 8.463
15.032
12.060
13.893
T-Score: 2.486 3.555 3.053 3.126
Eta
Squared: .015 .031 .022 .026
P: .013 .000 .002 .002

Effect of SES on Attendance and MAP Scores 43
Results and Discussion for Research Question Three
Research question three sought to determine if there was a relationship between
attendance and achievement based on MAP test scores. Attendance rates and MAP tests were
investigated for current seventh and eighth graders for the two previous school years (2011-2012
and 2012-2013). For the seventh graders, this would include their fifth and sixth grade years,
and for the eighth graders, their sixth and seventh grade years. This data was also split into
groups based on current grade level due to slight differences in the MAP scale scores.
Pearson’s r was used to determine if there was a relationship between students’
attendance rate and students’ scores on the communication arts and mathematics MAP tests. For
the current seventh graders, the results show a statistically significant, negligible to weak
positive relationship between attendance and all four tests with a p-value of .000 in all cases (see
table 5). The variance in the test scores that can be attributable to attendance ranges from a low
of 3.46% on the 2013 communication arts portion of the test to a high of 5.11% on the 2012
mathematics portion of the test. This means that roughly ninety-five to ninety-seven percent of
the variance in test scores could be attributable to factors other than attendance.
The current eighth grade tests also all show significantly significant, negligible to weak
positive relationship between attendance and all four tests (see table 6). All p-values for the
current 8th
graders test were statistically significant at the (p=.000) level except for the 2012
communication arts test which was still statistically significant at the (p=.029) level. The
variance in the test scores for current eighth graders that can be attributable to attendance ranges
from a low of 1.21% for the 2012 communication arts portion of the test to a high of 6.86% for
the 2013 mathematics section of the test. This means that roughly between ninety-three and

Effect of SES on Attendance and MAP Scores 44
ninety-nine percent of the variance in test scores could be attributable to factors other than
attendance. While this is a negligible to weak relationship, it is still positive.
Table 5
The Relationship Between Attendance and Achievement for Current 7th
Graders
Current 7th
Graders
MAP
Communication
Arts 2012
MAP
Mathematics
2012
MAP
Communication
Arts 2013
MAP
Mathematics
2013
Pearson’s
Correlation: .207 .226 .186 .207
N: 384.000 385.000 412.000 412.000
P: .000 .000 .000 .000
Variance: .0428 .0511 .0346 .0428
Variance in test
scores
attributable to
attendance 4.28% 5.11% 3.46% 4.28%
Table 6
The Relationship Between Attendance and Achievement for Current 8th
Graders
Current 8th
Graders
MAP
Communication
Arts 2012
MAP
Mathematics
2012
MAP
Communication
Arts 2013
MAP
Mathematics
2013
Pearson’s
Correlation: .110 .213 .260 .262
N: 393.000 393.000 411.000 372.000
P: .029 .000 .000 .000
Variance: .0121 .0454 .0676 .0686
Variance in test
scores
attributable to
attendance 1.21% 4.54% 6.76% 6.86%

Effect of SES on Attendance and MAP Scores 45
CHAPTER 5
OVERVIEW, FINDINGS, AND RECOMMENDATIONS
Overview
The purpose of this study was to determine if there is a difference in attendance
rates or MAP scores of two groups: students who are eligible for free and reduced lunch, and
students who are not eligible for free and reduced lunch. One purpose of this study was to
determine if there is a difference between students’ attendance rates based on their SES
grouping. This study will also determine if there is difference between students’ achievement
level as measured by the Missouri Assessment Program (MAP) test based on their SES grouping.
Finally, this study will determine whether or not there is a relationship between students’
attendance rate and students’ MAP scores. In this chapter, the study will be summarized, results
and additional findings discussed, conclusions will be presented, and recommendations will be
made.
Summary of Research Methods
This study used existing district data on students from two middle schools in suburban
Kansas City, Missouri. The data encompassed the 2011-2012 and 2012-2013 school years and
the study group consisted of 418 students currently in 7th
grade and 418 students currently in
eighth grade. Because the data was already in existence, a causal-comparative research design
was used. The Institutional Review Board granted exempt status to this study because the data
already existed and the researcher would not know the identities of the students in the study
group. With the assistance of school administration, data was collected and separated into two
categories: Students who were receiving FRL and students who were not receiving FRL. Due to

Effect of SES on Attendance and MAP Scores 46
grade-level differences in MAP index scores, students were also separated by current grade level:
seventh or eighth.
Data Analysis
Data was analyzed using descriptive and inferential statistics. After receiving the data,
the researcher organized all data into Microsoft Excel and performed statistical calculations
using EZ Analyze software. As part of this analysis, the mean, median, and mode were
calculated for students’ attendance rates and communication arts and mathematics MAP scores.
Research questions one and two investigated the possibility of a statistically significant
difference between students’ attendance rates and communication arts and mathematics scores
on the MAP test when taking into consideration students’ SES. For research questions one and
two, independent t-tests were calculated with an a priori alpha level of α = .05 to determine if
there was a significant difference between groups attendance rates and MAP test scores
(Lunenberg and Irby, 2008).
Research question three sought to determine if there was a relationship between
attendance and achievement based on communication arts and mathematics MAP test scores.
Pearson’s r (α = .05) was used to determine if there was a relationship between students’
attendance rate and students’ scores on the communication arts and mathematics MAP tests.
Attendance rates and MAP tests were investigated for current seventh and eighth graders for the
two previous school years (2011-2012 and 2012-2013).

Effect of SES on Attendance and MAP Scores 47
Discussion of Findings
The results of this study suggest that in all cases investigated, there is a statistically
significant difference between SES and attendance, as well as SES and achievement. This
finding is consistent with findings of previous researchers, as discussed in the review of literature
(Abbott and Joireman, 2001; Barry, 2006; Jones, 2006; Lamdin, 2001 Romero and Lee, 2008).
This study adds to the body of knowledge suggesting that SES is a factor which affects students
in multiple ways.
The relationship between SES and attendance was demonstrated in the differences
exhibited by students at a middle school in suburban Kansas City, Missouri in the 2011-2012
school year, as well as in the 2012-2013 school year. This study demonstrated that students on
FRL had lower mean attendance rates than those not on FRL. These differences were all
statistically significant and were all found at a p-value of (p=.000). Although there is a
statistically significant difference, the researcher would consider both groups’ mean attendance
rates to be good. The students on FRL had mean attendance rates of 93.89% in 2011-2012, and
93.577% in 2012 and 2013 as compared to the 95.929% and 95.851% displayed be their non
FRL peers. However, when one looks at actual instruction time missed by students on FRL
when comparing to those students not on FRL, it is evident that even a small mean difference can
affect the student. The mean differences of current seventh and eighth graders were 2.036% in
2011-2012 and 2.274% in 2012-2013. This would equate to 3.54 and 3.96 more missed days of
school, respectively. This is an important finding for educators to be aware of. Making up
missed work and learning concepts that may have been missed while absent is a hard thing for
many middle school students to do, regardless of SES grouping. It often requires obtaining a
ride to or from school to get additional help beyond regular school hours. For a lower-SES

Effect of SES on Attendance and MAP Scores 48
family, this could be more difficult than for those from a higher SES family. For some of these
students, their only means of transportation may be the school bus. Therefore, any make-up
work or learning of missed concepts either does not happen, or it has to happen during the school
day, often at the expense of learning new or current concepts that other students may have
already moved on to. For a low SES student, this loss of instructional time can accumulate and
take weeks for them to get caught up when missing just one or two days. Missing more school
can put these kids who are on FRL in a perpetual state of lagging behind the rest of the class and
struggling to catch up, which in turn, may affect their achievement levels in class and on
standardized tests, such as the MAP.
When investigating the differences between students’ SES and students’ scale scores on
the communication arts and mathematics portion of the MAP test, the researcher found that
among both current seventh and eighth graders, in both school years, students who are on FRL
had lower mean MAP test scores than students not on FRL in both the communication arts and
mathematics sections of the test. For the current seventh graders, the difference was statistically
significant at the (p=.000) level in all cases. For the current eighth graders, the difference was
statistically significant with p-values ranging from (p=.000-.002). The fact that this study
suggests that student of lower SES have lower mean MAP test scores than their higher SES peers
is important. It adds to the existing body of knowledge linking SES and achievement, but at the
middle school level with student level data.
In addition to students on FRL mean scores being lower than their non-FRL peers, one
very striking difference was found. In the case of the current seventh graders, mean
communication arts test scores in both the 2011-2012 and 2012-2013 school years were far
enough apart to put the FRL group into a different MAP achievement level than the non-FRL

Effect of SES on Attendance and MAP Scores 49
group. In 2012, current seventh graders on FRL had a mean score of 670.18 on the
communication arts portion of the MAP test, while students not on FRL had a mean score of
691.195. In 2013, the FRL group had a mean score of 671.657, while the non-FRL group’s
mean score was 689.383. For these two tests, the FRL group scored in the basic achievement
level, while the non-FRL group scored in the proficient achievement level. As schools attempt
to move all of their students to proficient levels, this is a huge finding. This group (current
seventh graders on FRL) could be more closely examined in an effort to determine other factors
that may contribute to this difference in order to formulate a plan to help improve student
achievement. This is a group that could be helped to move up an achievement level, as their
scores were only four points away from the next achievement level in both years tested.
This discussion has already demonstrated the effect of SES on attendance and
achievement as related to research questions one and two. This study suggests that students of
lower SES as determined by FRL status have more absences and score lower on the
communication arts and mathematics sections of the MAP test than do their higher SES peers.
Research question three attempted to investigate the level of relationship, if any, between
attendance and performance on the communication arts and mathematics portion of the MAP
test. A product-moment correlation coefficient (Pearson’s r) was used to gauge this relationship.
In both school years investigated, at both grade levels, across all test sections considered, the
relationship was negligible to weak, and positive. This relationship was shown to be statistically
significant at the (p=.000) level in all cases except for the current eighth graders’ 2010
communication arts test, which was still statistically significant and had a value of (p=.029).
While the relationship is weak, and the variances in the test scores show us that over ninety
percent of the variance could be attributed to other factors, the positive relationship is still there.

Effect of SES on Attendance and MAP Scores 50
Attendance and achievement on the communication arts and mathematics portion of the MAP
test are positively related. The magnitude of this relationship may have been affected by the fact
that both groups’ attendance rates, despite being statistically significantly different, were both
high (93.893% and 93.577% for FRL, 95.929% and 95.851% for non-FRL). These attendance
rates may differ in other buildings or in other districts, which could change the relationship.
The results of this study are of interest to educators for a number of reasons. Although
this study failed to establish a strong correlation between attendance and achievement as has
been demonstrated in previous studies, this study has shown that low SES can negatively affect
both attendance and test scores. With this knowledge, educators can begin to investigate
possible strategies to assist those who are of lower SES to improve both their attendance and
achievement. In all cases, further research is needed.
Conclusions
1. Students in a suburban Kansas City, Missouri school district who are of lower SES
background score lower on the communication arts and mathematics sections of the
MAP test than their peers who are of higher SES.
2. Students in a suburban Kansas City, Missouri school district who are of lower SES
have more absences than their peers who are of higher SES.
3. Attendance and achievement are positively related, but at negligible to weak levels at
a suburban Kansas City, Missouri school district.
Recommendations
Upon completion of the study, the following recommendations are presented.

Effect of SES on Attendance and MAP Scores 51
Recommendation One. This study could and should be replicated by many other teachers
and administrators. Through the information gathered and data analyzed, plans could be
formulated to help improve student attendance and achievement. This data and the resultant
plans should be shared with other educators for the benefit of all. Further studies are needed.
Recommendation Two. While this study presented interesting and useful data and
statistically significant results, the researcher believes that the factors that go into determining
SES should be further explored. Several more variables could be taken into account besides FRL
designation which could bring to light other SES factors that may affect students’ attendance and
achievement (Harwell and LeBeau, 2010; Sirin, 2005). By using these combinations of
variables, a truer picture of SES might be achieved. Further studies are needed.
Recommendation Three. After examining the results of the data regarding attendance
between the two groups and discussing the reasons it may be hard for lower SES students to get
caught up after missing school, the researcher suggests that the school goes back to offering a
“late bus” a few nights a week after school. This bus would allow students who need to make up
work or spend extra time with a teacher to do so after school, while still having transportation.
Recommendation Four. This data should be shared with the communication arts teachers
of this class of current seventh graders. While personally identifying characteristics of lower
SES students could not be shared, communication arts teachers could attempt to find areas of
weakness for all students in an attempt to bring the low SES group’s mean communication arts
MAP scores up to the proficient level.
Recommendation Five: All involved in the education process of young people should
become familiar with factors that can affect attendance and achievement. Because SES has been

Effect of SES on Attendance and MAP Scores 52
shown to be a factor that strongly affects both, educators should take the time to learn about the
challenges faced by those of lower SES. Armed with this knowledge, programs could be
implemented to aid all students in the hopes of improving not only their school attendance and
achievement, but also their lives. There is time available in the current school day that could be
used to aid all students. Time spent in advisory and sustained silent reading could and should be
used to help students who need it.

Effect of SES on Attendance and MAP Scores 53
APPENDIX A
Data Collection Table
Students’ FRL Status, MAP Scores, and Attendance Rates
Student Name
F & R Status
1=yes, 2=no
Grade Level
2013-14
MAP Comm
Arts 2012
MAP Comm
Arts 2013
MAP Math
2012
MAP Math
2013
Attendance
Rate 2011-12
Full Year
Attendance
Rate 2012-13
Full Year

Effect of SES on Attendance and MAP Scores 54
APPENDIX B
Institutional Review Board Approval

Effect of SES on Attendance and MAP Scores 55
REFERENCES
Abbott, M. L., & Joireman, J. (2001, July). The relationships among achievement, low
income, and ethnicity across six groups of Washington state students (Report No. 1). Lynwood,
WA: Washington School Research Center.
Augustine-Thottungla, R., Kern, J., Key, J., & Sherman, B. (2013). Ending childhood
hunger: A social impact anlysis. Washington, DC: Deloitte.
Barry, J. (2006). The effect of socio-economic status on academic achievement
(Unpublished master's thesis). Wichita State University, Wichita, KS.
Bartik, T. J. (2013, January). Family income, student achievement, and educational costs.
Upjohn.
Baxter, S. D., Royer, J. A., Hardin, J. W., Guinn, C. H., & Devlin, C. M. (2011). The
relationship of school absenteeism with body mass index, academic achievement, and
socioeconomic status among fourth-grade children. Journal of School Health, 81(7), 417-423.
Bock, J. (2012, January 19). Missouri teachers could be evaluated on student progress.
Retrieved from St. Louis Post-Dispatch website: http://www.stltoday.com
Bulach, C. R., Malone, B., & Castleman, C. (1995). An investigation of variables related
to student achievement. Mid-Western Educational Researcher, 8(2), 23-29.
Downey, D. B., von Hippel, P. T., & Broh, B. (2004). Are schools the great equalizer?
School and non-school sources of inequality in cognitive skills. American Sociological Review,
69(5), 613-635.

Effect of SES on Attendance and MAP Scores 56
Fraenkel, J., & Wallen, N. (n.d.). [The nature of causal-comparative type research].
Retrieved September 18, 2013, from How to Design and Evaluate Research in Education
website: http://highered.mcgraw-hill.com/sites/0073525960/student_view0/
Gottfried, M. A. (2009). Excused versus unexcused: How student absences in elementary
school affect academic achievement. Educational Evaluation and Policy Analysis, 31(4), 392-
415.
Gottfried, M. A. (2010). Evaluating the relationship between student attendance and
achievement in urban elementary and middle schools: An instrumental variables approach.
American Educational Research Journal, 47(2), 434-465.
Gottfried, M. A. (2011). The detrimental effects of missing school: Evidence from urban
siblings. American Journal of Education, (117), 147-182.
Gunderson, G. W. (n.d.). National school lunch program. Retrieved November 6, 2013,
from United States Department of Agriculture, Food and Nutrition Service website:
http://www.fns.usda.gov/nslp/history
Harwell, M., & LeBeau, B. (2010). Student eligibility for a free lunch as an SES measure
in education research. Educational Researcher, 39(2), 120-131.
Hinrichs, P. (2010). The effects of the national school lunch program on education and
health. Journal of Policy Analysis and Management, 29(3), 479-505.
Income eligibility guidelines. (n.d.). Retrieved November 6, 2013, from United States
Department of Agriculture, Food and Nutrition Services website:
http://www.fns.usda.gov/cnd/Governance/notices/iegs/iegs.htm

Effect of SES on Attendance and MAP Scores 57
Jones, D. J. (2006). The impact of student attendance, socio-economic status and mobility
on student achievement of third grade students in title I schools (Unpublished doctoral
dissertation). Virginia Polytechnic Institute, Blacksburg, VA.
Kranzler, J. H. (2011). Statistics for the terrified (5th ed.). Upper Saddle River, NJ:
Prentice Hall.
Lamdin, D. J. (1996). Evidence of student attendance as an independent variable in
education production functions. The Journal of Education Research, 89(3), 155-162.
Lubienski, S. T., & Crane, C. C. (2010). Beyond free lunch: Which family background
measures matter? Education Policy Analysis Archives, 18(11), 1-43.
Lunenburg, F. C., & Irby, B. J. (2008). Writing a successful thesis or dissertation: Tips
and strategies for students in the social and behavioral science. Thousand Oaks, CA: Corwin
Press.
Milne, A., & Plourde, L. A. (2006). Factors on a low-SES household: What aids
academic achievement? Journal of Instructional Psychology, 33(3), 183-193.
Missouri assessment program grade-level assessments (Missouri Department of
Elementary and Secondary Education, Comp.) [Brochure]. (2012). Monterey, CA: CTB/McGraw
Hill.
Missouri educator evaluation system. (n.d.). Retrieved from Missouri Department of
Elementary and Secondary Education website: http://dese.mo.gov/eq/ees.htm
Missouri gets no child left behind waiver. (2012, June 29). Retrieved from
http://www.columbiatribune.com

Effect of SES on Attendance and MAP Scores 58
Missouri's educator evaluation system. (n.d.). Retrieved from Missouri Department of
Elementary and Secondary Education website: http://dese.mo.gov/eq/ees.htm
Morrissey, T. W., Hutchinson, L., & Winsler, A. (2013). Family income, school
attendance, and academic achievement in elementary school. Developmental Psychology, 1-13.
National assessment of educational progress: More about NAEP mathematics. (2012,
August 1). Retrieved November 6, 2013, from National Center for Education Statistics website:
http://nces.ed.gov/nationsreportcard/mathematics/moreabout.aspx
Noerrlinger, C. (2012, December). District free and reduced-price lunch report. Omaha,
NE: Omaha Public Schools.
Pennington, J. (2013, June). District characteristics: What factors impact student
achievement. Des Moines, IA: Iowa Department of Education.
Ready, D. D. (2010). Socioeconomic desadvantage, school attendance, and early
cognitive development: The detrimental effects of school exposure. Sociology of Education,
83(4), 271-286.
Roby, D. E. (2004). Research on school attendance and student achievement: A study of
Ohio schools. Educational Reseach Quarterly, 28(1), 3-14.
Romero, M., & Lee, Y.-S. (2007, October). A national portrait of chronic absenteeism in
the early grades. New York, NY: National Center for Children in Poverty.
Romero, M., & Lee, Y.-S. (2008, January). The influence of maternal and family risk on
chronic absenteeism in early schooling. New York, NY: National Center for Children in Poverty.

Effect of SES on Attendance and MAP Scores 59
Schagen, I., & Benton, T. (2006). Don't judge schools purely on raw attendance data or
examination results. Education, (96), 30-31.
Shores, M. L., Shannon, D. M., & Smith, T. G. (2010). Individual learner variables and
their effect on mathematics achievement as students advance from fifth to sixth grade. Journal of
Research in Childhood Education, (24), 187-194.
Sirin, S. R. (2005). Socioeconomic status and academic achievement: A meta-analytic
review of research. Review of Educational Research, 75(3), 417-453.
Stull, J. C. (2013). Family socioeconomic status, parent expectations, and a child's
achievement. Research in Education, (90), 53-67.
U.S. Department of Education. (2011). The nation's report card: Mathematics 2011 state
snapshot report. Institute of Education Sciences.