effect of size on normal-gravity self-pressurization of
TRANSCRIPT
N A S A TECHNICAL NOTE
EFFECT OF SIZE ON NORMAL-GRAVITY SELF-PRESSURIZATION OF SPHERICAL LIQUID HYDROGEN TANKAGE
by John C. Aydelott and Charles M . Spuckler
Lewis Research Center Cleveland, Ohio
N A T I O N A L A E R O N A U T I C S A N D S P A C E A D M I N I S T R A T I O N W A S H I N G T O N , D . C . M A Y 1 9 6 9
I i.
1 1
d. ’ .

TECH LIBRARY KAFB, NM
E F F E C T OF SIZE ON NORMAL-GRAVITY SELF-PRESSUFUZATION
OF SPHERICAL LIQUID HYDROGEN TANKAGE
By John C. Aydelott and C h a r l e s M. Spuckler
L e w i s R e s e a r c h C e n t e r Cleveland, Ohio
N A T I O N A L AERONAUTICS AND SPACE ADMINISTRATION
For sale by the Clearinghouse for Federal Scientific and Technical Information Springfield, Virginia 22151 - CFSTI price $3.00

ABSTRACT
A study was conducted at the NASA Lewis Research Center to obtain a correlating parameter which would relate the r a t e of p re s su re rise to the volume of spherical liquid- hydrogen tankage. A nonventing 22-inch (56-cm) diameter spherical tank partially filled with liquid hydrogen was subjected to four uniformly heated self-pressurization t e s t s with various combinations of percent filling and heat-transfer rate. These data were compared with data from a similar study on a 9-inch (23-em) diameter, uniformly heated, spherical tank. change in pressure in each tank for equal values of heat added per unit volume.
The two se t s of data verified the analysis which predicted the same

EFFECT OF SIZE ON NORMAL-GRAVITY SELF-PRESSURIZATION
OF SPHERICAL LIQUID HYDROGEN TANKAGE
by J o h n C. Aydelott and Char les M. Spuckler
Lewis Research Center
SUMMARY
A study was conducted at the NASA Lewis Research Center to obtain a correlating parameter which would relate the ra te of pressure rise to the volume of spherical liquid- hydrogen tankage. A nonventing 22 -inch (56-cm) diameter spherical tank partially filled with liquid hydrogen was subjected to four uniformly heated, self-pressurization tes t s with various combinations of percent filling and heat-transfer rate. These data were compared with data from a similar study on a 9-inch (23-cm) diameter, uniformly heated, spherical tank. change in pressure in each tank for equal values of heat added per unit volume.
The two se ts of data verified the analysis which predicted the same
INTRODUCTION
Hydrogen is very attractive for use as a rocket fuel because of the high specific im- pulse it produces either when reacted with an oxidizer o r when used as a heated expel- lant as in a nuclear rocket. However, mission planners and tank designers are confronted with problems that result because hydrogen has many properties which set it apar t f rom common fluids. Gaseous hydrogen has a low density, so that it i’s practical, for space missions, to store hydrogen only as a liquid o r solid. The liquid and solid, however, have a very low equilibrium temperature, and this makes it very difficult to insulate a storage container sufficiently to prevent a net heat gain. As heat is continually added to the tank, the tank pressure wi l l r i s e until venting is required, with an accompanying propellant loss.
The rate of pressure rise in a hydrogen storage tank is highly dependent on the ther- mal transport properties of hydrogen, which make it possible for subcooled liquid and highly superheated vapor to coexist in the same container. The temperature of the inter- face between the liquid and vapor phases increases because the interface temperature is
always equal to the saturation temperature corresponding to the increasing total system pressure. The average liquid temperature may increase at a slower rate, thus the liquid bulk becomes subcooled; the average vapor temperature may increase at a faster rate, thus the vapor becomes superheated. The rate of liquid subcooling and vapor superheating will vary with the experimental conditions (tank geometry and percent filling, heat- transfer ra te and distribution, etc.) and cause the rate of pressure r i s e to vary. Con- sequently, simple thermodynamic analysis often cannot predict the rate of pressure rise in a closed system containing liquid hydrogen, and the possibility of developing scaling parameters should be considered.
The majority of the work in this field has been restricted to cylindrical tanks with heating only on the side walls. Therefore, natural convection theory for vertical plates could be used to predict the heat and mass transfer within the liquid phase. In general, direct heating of the vapor was not considered. An excellent review of this work can be found in reference 1. Of more direct application to understanding the energy transfer processes which take place in any liquid-hydrogen container is the effect of bottom heat- ing (refs. 2 to 5). As the proportion of bottom heating increases, turbulent convection and boiling cause the temperature of the liquid to become more uniform.
or theoretical information is available on the normal-gravity self -pressurization of spherical liquid-hydrogen tankage. The ear l ier work of the first author (ref. 6) deter- mined the importance of the heating configuration on the thermodynamic history of spher- ical, 9-inch (23-cm) diameter, liquid-hydrogen tankage. Heating the tank only from the top caused pressure rise ra tes approximately four t imes greater than those which resulted from heating only the bottom of the tank. Reference 7 presents the results of a self- pressurization test on a 50 000-gallon (1 89 000-liter) spherical liquid-hydrogen storage tank subjected to a uniform heat-transfer ra te of approximately 0.6 Btu per hour per square foot (1.9 W/m ). The measured ra te of pressure r i s e was approximately 10 t imes greater than that which would result if the contents of the tank were homogeneous (uniform temperature throughout). The lack of experimental data and the difficulty in analytically relating the rate of pressure rise to the energy input for full-size hydrogen tanks suggest the use of a scaling parameter.
normal-gravity self -pressurization of spherical liquid-hydrogen tankage. This report presents the information obtained from four self-pressurization tests of a spherical 22 -inch (56-cm) diameter, liquid-hydrogen tank. The tests were conducted under normal- gravity conditions with approximately uniform heat addition. The effects of the variables, liquid filling (approximately 30 to 80 percent by volume) and average heat-transfer rate (approximately 17 to 64 Btu/(hr)(ft ) or 53 to 202 W/m ), on the rate of pressure r i s e were determined. The data are compared with theoretical analyses and with the resul ts
In contrast to the available information on cylindrical tanks, very little experimental
2
This study was conducted to obtain a correlating parameter for the effect of size on
2 2
2
I' I I 1111111

of reference 6 (9-in. (23-cm) diam tank) to show the effect of size on the self- pressurization of spherical liquid-hydrogen tankage. The information presented in ref - erence 7 (50 000 gal (189 000 liter) tank) is discussed in light of the resul ts of the two smaller tank studies.
ANALYSIS
Thermodynamic Pressure Rise
The first law of thermodynamics is
Q = AU +JP dV
(Symbols a r e defined in appendix A. ) For a closed, nonexpanding system, all the heat absorbed by the system manifests itself in a change in the total internal energy of the system; that is, for dV = 0
Q = A U
If the system in question is a tank containing a liquid and its vapor, a knowledge of how the added heat affects the internal energy distribution and, thus, the temperature dis- tribution within the tank permits prediction of the total system pressure. ble because, for a liquid-vapor system, temperature and pressure are interrelated at the interface (ref. 1).
Since the temperature distribution in the fluid within a cryogenic storage tank is highly complex and is affected by many variables, the most important of which a r e tank geometry, percent filling, heat -f lux rate, and heat-flux distribution, any analytical pre - diction of pressure rise as a function of heat added must be based on simplifying assump- tions. This report makes use of two simple pressure r i se models. The mathematical development of each of the models is given in appendix B. homogeneous conditions (uniform temperature) throughout the hydrogen container and is a common calculation that is performed to compare data of this type. assumes that all the energy absorbed by the hydrogen container goes into evaporating liquid and maintaining the vapor at the saturation temperature corresponding to total- system pressure. The liquid-phase temperature remains constant at the saturation tem - perature corresponding to the initial pressure. These models are not intended to be attempts at describing the process that actually takes place in a nonventing hydrogen con-
This is possi-
The first model assumes
The second model
3
I -
~
tainer, but are intended to be a means of comparing one set of experimental data with another. The position that experimental data assume in relation to the theoretical modelk on a plot of total pressure against heat added is then a qualitative indication of how the energy is being distributed within the hydrogen container.
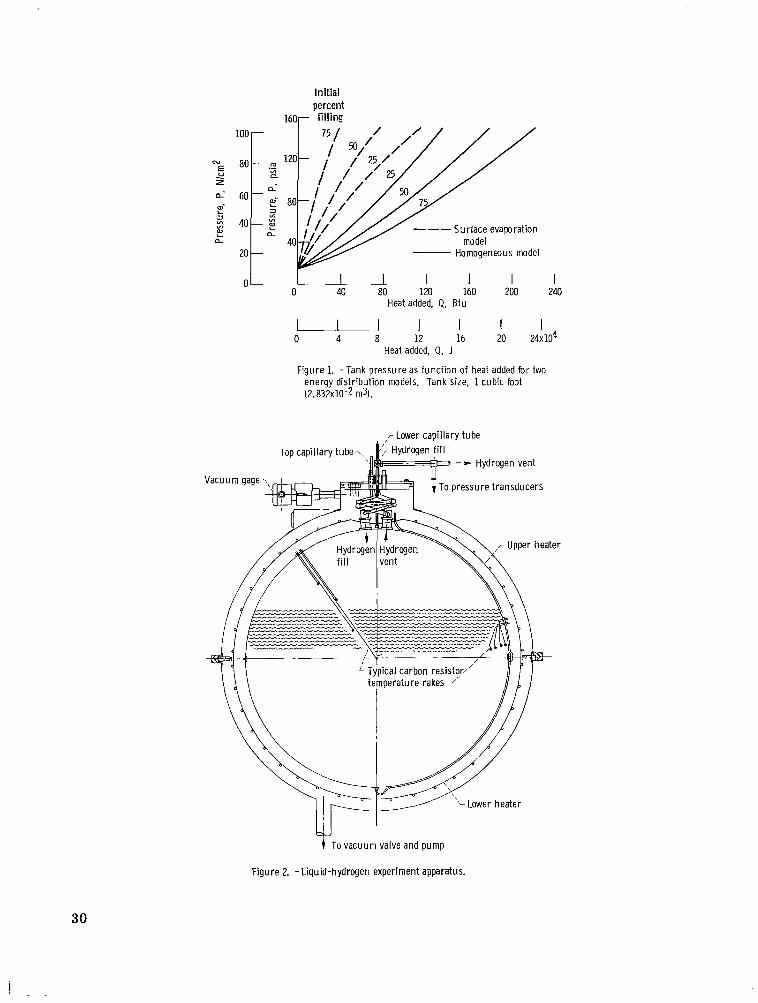
energy distribution models. The plot is for a 1-cubic-foot (0.02832-m ) container and initial liquid fillings of 25, 50, and 75 percent by volume.
Figure 1 is a theoretical plot of tank pressure as a function of heat added for the two 3
Simi lar i ty Relation
Starting with the previously presented first law of thermodynamics for a closed non- expanding system
Q = AU = A(mu) = A(pu)V
g= A b u ) V
For any fluid the product of density and specific internal energy can be expressed as a function of the pressure and temperature. However, if the fluid is saturated, the pres- sure and temperature are dependent variables, and the vapor mass fraction of the fluid is also required in order to specify the desired properties
p u = f(P, T, X)
If we wish to compare two systems containing only liquid and gaseous Qydrogen, af /aP, af/aT, and af/aX will be the same for each system. Consideration will be limited to systems of identical geometry, initial percent filling, and heat-transfer rate in order to logically expect similar processes to occur in the two systems. From the last equation, it can be seen that similar changes in pressure, temperature, and vapor mass fraction may then be expected in each tank for equal values of heat added per unit volume. Bailey (ref. 8) reached an identical conclusion.
dynamic Pressure Rise section. termined by these models, that will cause a specified change in pressure for any tank
This similarity relation holds exactly for both of the models presented in the Thermo- The reader may approximate the energy input, as de-
4
I - . .. . d
size or filling. Referring to figure 1, this is done by interpolating to determine the ef- fect of percent filling and by multiplying the heat added by the volume of the tank in cubic feet.
APPARATUS
Liquid Hydrogen Container
Figure 2 is a cross-sectional drawing of the liquid-hydrogen apparatus that consisted of three concentric spheres; the inner sphere contained the liquid hydrogen, the interme- diate sphere had electric heating coils mounted on its exterior surface, and the outer sphere served as a vacuum jacket to reduce the gaseous conduction of heat. The outer surface of the inner sphere and the inner surface of the heaters were painted black in order to increase their emissivity. The stainless -steel f i l l and vent tubes supported the inner sphere.
A heater controller, which basically consisted of a bridge circuit which balanced the resistance of a temperature sensor on each heater with a corresponding rheostat on the control panel, was used to maintain heater temperatures of 360' or 500' R (200 or 278 K).
In st r u men tat ion
Temperature and pressure transducers measured the total system pressure, vacuum - space pressure, surface temperature of the inner sphere, heater, and vacuum jacket, and temperature at 16 locations inside the inner sphere. platinum temperature transducers on the inner sphere and the four carbon resistor temperature rakes that were located within the inner sphere to measure the temperature of the hydrogen liquid and vapor. Figure 4 shows two of the carbon resis tor rakes.
At any time prior to a test run, the resistance of any temperature transducer could be determined by the use of a digital ohmeter mounted in the control panel. A very small electric current was passed through a temperature transducer to determine the resistance and thus the temperature of the transducer. When a relatively high current was applied to a carbon resistor, its temperature was quite different depending on whether the tem- perature probe was in the liquid or vapor phase. tion of this fact, together with careful arrangement of the carbon resis tors , made it pos- sible to use the carbon resistors to determine the liquid level in the sphere pr ior to the start of a test.
Figure 3 shows the location of the
This was due to self-heating. Exploita-
5

I --
A detailed description of the temperature and pressure measuring and recording sys- tems and a n analysis of the error associated with them will be found in reference 6.
PROCEDURE
Pr io r to the assembly of the experiment, thermocouples were attached to the inner sphere, heaters, and vacuum jacket. All temperature transducers were calibrated by submerging the three spheres in a liquid nitrogen bath at 139. 5' R (78 K) and by placing the spheres in a carefully controlled temperature chamber at 347', 486O, 537', and 601' R (193, 270, 298, and 334 K). After the experiment had been assembled, the inner-sphere temperature transducers were calibrated at 36.4' R (19.1 K) by filling the sphere with liquid hydrogen. Each bridge was calibrated by using a decade box to obtain a voltage versus resistance plot. Pr ior to each test, the pressure transducers were calibrated with standard pressure gages.
was curve fitted using a digital computer. The magnetic data tapes from each test were fed into the digital computer along with the calibration curve fits, and a n automatic data reduction program returned printed temperature data at half-second intervals for each transducer. A continuous plot of the output of the pressure transducers was obtained by feeding the output of the magnetic data tapes into a line recorder.
For each of the tests, the experiment was prepared in an identical manner: only the actual test conditions were varied. The space between the inner and outer spheres was evacuated first with a mechanical pump and then with a diffusion pump. Then the inner sphere was filled with liquid hydrogen. The addition of the liquid hydrogen reduced the pressure in the space between the inner and outer spheres due to cryogenic pumping. The capillary tubes (fig. 2) were used to remove liquid from the inner sphere until the approx- imate desired liquid level was obtained.
For the low heater temperature (low heat-transfer rate) tests, a gas meter installed in the vent line together with the carbon resis tors in the inner sphere (described in the In- strumentation section) made it possible to determine the liquid level at the beginning of the test. The resis tors accurately determined the liquid position at some time prior to the beginning of the test. At this time the gas meter began to record the volume of hydrogen vapor which then leaves the inner sphere. Measurements of the vapor temperature at the gas meter and the atmospheric pressure determine the density of the vapor. From a know- ledge of the volume and density of the vapor, the mass of hydrogen that leaves the inner sphere before the test begins is calculated and the initial percent filling can be determined.
For the high heater temperature (high heat-transfer rate) test, the boiloff rate of the hydrogen was greater than the capacity of the gas meter. Consequently, the eight
Each of the calibration curves for the temperature transducers and for the bridges
6
carbon resis tor temperature transducers that were located near the 50-percent filling level were used to determine the initial filling. By recording the time when the liquid level went below each resis tor and extrapolating to the starting time of the test, the ini- tial percent filling could be determined.
determining the liquid level to eliminate transients. At minus 1 minute, the system be- gan recording data on magnetic tape. At zero time the vent valve was closed and the ex- periment was allowed to self-pressurize. The tes ts were terminated either at a nomi- nal pressure of 100 psia (68.95 N/cm ) or after 45 minutes if the pressure did not reach 100 psia (68.95 N/cm ). After the experiment reached 100 psia (68.95 N/cm ) or ran for 45 minutes, the vent valve was opened and the pressure was allowed to decay slowly. If a sufficient amount of liquid hydrogen still remained in the experiment, a similar test at a lower filling was run as soon as the new liquid level had been determined.
The heater controller was set to maintain the desired heater temperature prior to
2 2 2
EXPERIMENTAL RESULTS
Four quiescent tes ts with uniform heating were performed. Nominal initial fillings of 30, 50, and 80 percent for the low heat-transfer-rate tes ts and 50 percent for the high heat-transfer -rate test were desired. 500' R (200 and 278 K) were used for the tests.
Figures 5 to 8, showing pressure and temperature as a function of time, present the data obtained from the tes t runs. Only enough data symbols a r e included to identify the curves. Each of the figures is made up of four plots: (a) total pressure as a function of time, (b) outer-sphere and average heater temperature as a function of time, (e) upper inner -sphere internal and surface temperature as a function of time, and (d) lower inner - sphere internal temperature as a function of time. Figures 5 to 7 show the effects of three different percent fillings (31.6, 48.9, and 79. 8 percent) for a nearly constant heat-flux, approximately 20 Btu per hour per square foot (63 W/m ). Figures 6 and 8 show the ef- fects of two different average heat fluxes, 18.9 and 64.4 Btu per hour per square foot (60 and 203 W/m ), for an approximately half-full sphere.
Heater temperatures of approximately 360' and
2
2
DISCUSSION OF EXPERIMENTAL RESULTS
External Heat T r a n s f e r
A f i r s t look at the data might suggest that the rate of pressure r i s e is the most im- portant parameter to consider when examining a group of tes ts which had identical heater
7
I - - I
temperatures. However, because the hydrogen vapor becomes superheated and because the top of the inner sphere increases in temperature as a test proceeds, this approach can be quite misleading. The heating of the inner sphere increases the temperature of the container wall causing a reduction in the rate of energy input to the hydrogen. This is due to both the reduction in radiant exchange and the energy that is absorbed by the container wall. Higher heater temperatures and lower per cent liquid fillings cause increasing inner-sphere temperatures so that the average heat f lux to the hydrogen is not a function only of heater temperatures. As a result, it is better to compare the amount of heat that must be added to the hydrogen container to cause a given pressure rise for a particular s e t of conditions. The method of calculating the net heat addition to the hydrogen container used in these experiments is given in appendix C. The results of this analysis indicate that the main source of energy input to the experiment was radiant exchange from the heaters. Heat transfer due to conduction along the f i l l and vent tubes and instrumentation wires, as well as gaseous conduction through the vacuum space, was small.
both the present study and the uniform heating tes ts of the 9-inch (23-cm) diameter spherical tank (ref. 6). The initial percent filling was determined as explained in the PROCEDURE section. The pressure-r ise ra te is an average value obtained by dividing the change in the pressure during the test by the total test time. The bulk temperature was assumed to be the lowest recorded temperature from the lower carbon resis tor temperature transducers. Dividing the change in the buIk temperature by the change in the saturation temperature during the test gives an indication of how much energy went into heating the liquid and, thus, how nearly homogeneous the liquid is a t the end of the test. The maximum change in the vapor temperature is an indication of how much energy went into superheating the vapor. However, the vapor temperature data from the f i r s t two tes ts on the larger spherical tank should not be compared with the other tests. If the f i r s t two tes ts on the larger tank had not been terminated before reaching a pressure of 100 psia (68.95 N/cm ), the maximum change in the vapor temperature would have been larger. The average heat f lux is determined by dividing the total energy input to the hydrogen as calculated in appendix C by the test time and the surface a rea of the inner sphere. This average is then broken down into the heat flux through the liquid wetted walls and through the walls exposed to vapor by assuming that none of the reradiated heat f lux (eq. (C8)) comes f rom the liquid wetted walls. Breaking the heat flux into parts in this manner clearly shows the effect of the increasing upper inner-sphere temperature which reduces the net radiant heat exchange.
Table I is a summary of the experimental results and the heat-transfer analysis for
2
8

Pressu re-Rise Characteristics
Test
Effect of percent filling. - Figure 9 shows the effect of percent filling on the sphere pressure as a function of heat added for six uniformly heated tests. Figure 9(a), taken from reference 6 (9-in. (23-cm) diam spherical tank), and figure 9(b) for the present study (22-in. (56-cm) diam spherical tank), show similar results. The pressurization rate was only slightly affected by varying the percent filling with a trend toward higher pressure-r ise rates at higher fillings. In order to understand why the pressure-r ise rate is only slightly affected by the percent filling, reference is made to table I. The data for the tests indicate that, as the percent filling is increased, the liquid becomes more subcooled (less homogeneous) and the vapor becomes less superheated (more homogeneous). These two effects tend to counterbalance each other.
Effect _. of heat-transfer rate. - Figure 10 shows the effect of heat-transfer rate on sphere pressure as a function of total heat added fo r the approximately 50-percent filled, uniformly heated, quiescent tests. Figure lO(a), taken from reference 6, and figure lO(b), for the present study, show similar results. Since the two coordinates, pressure
Initial filling, percent
TABLE I. - SUMMARY OF EXPERIMENTAL RESULTS AND HEAT-TRANSFER A N A L Y S I ~
1 2 3 4
31.6 48.9 79.8 54.2
34.6 51.4 34.9 48. 9 76.5 36.8 50. 7 77.2
b(130) b(72) b(155) b(86)
0. 85 0. 59 .97 .48
1.4 .34 164 91 3 .3 . 5 1 222 123
Average 1 Liquid- 1 Maximum vapor I Unit area heat-transfer rate q/A,
. ~ .
16.9 53 22.3 18.9 60 22.0 21.9 69 22.6 64.4 203 83.7
pressure-rise ratel temperature 1 temperature change
17.5 18.2 59.9 65.0 72.6
105.4 111.6 128.6
1. 23 1.41 2.04 4. 78
55 57
189 205 229 332 352 405
3.5 3 .6
11. 3 13. 5 17. 0 19.3 23.6 30.3
Average 1 Wetted area I Dry area I I I I I
Btu I W2 1 Btu2 1 W21 Btu2 I W
(hr)(ft2) m (hr)(ft ) m (hr)(ft ) m2 1 1 I I
2.4 2 .5 7. 8 9 .3
11.7 13.3 16.3 20.9
0. 55 .46 .62 .47 .32 . 6 1 .47 . 3 1
110 115 2 12 200 159 258 24 5 182
61 64
118 111 88
143 136 101
'Quantities defined in heat t ransfer analysis and test resul ts section. 'Test terminated before reaching 100 psia (68.95 N/cm ). 2
20.0 20.0 80.3 80. 7 80. 5
148.0 142.7 141.9
9
and heat added, are the integrals over time of pressure-r ise rate and heat-transfer rate, coincident test data indicate a linear relation between pressure-r ise rate and heat- transfer rate; that is doubling the heat-transfer rate will double the pressure-r ise rate. This linear relation was followed almost exactly for all the approximately 50-percent filled, uniformly heated, quiescent tests.
Internal Heat and Mass Transfer
2 4
k yA) for the present study and the work of reference 6 (Ra M l o lo to 10 ), indicates that the mode of heat t ransfer in the liquid bulk would be turbulent convection (refs. 9 to 11). However, a summary of liquid-hydrogen boiling studies presented in references 12 and 13 indicate that, at the heat fluxes employed for these tests, nucleate boiling is quite likely to occur. An essentially uniform-temperature liquid bulk would be antici- pated for either turbulent convection or boiling heat transfer. Because a uniform- temperature liquid bulk was experimentally observed, it is probable that, at the lower heat fluxes, the heat and mass transfer in the liquia was dominated by turbulent convec- tion with some boiling entering in at the higher heat fluxes.
f rom a much larger spherical tank (50 000 gal (189 000 liter)). transfer rate was approximately 0.6 Btu per hour per square foot (1.9 W/m ). pressure-r ise ra te was approximately 10 t imes greater than the calculation based on homogeneous conditions, which is much greater than for any of the small tank tests. is believed that, due to the low heat-transfer rate, a laminar natural convection boundary layer along the tank wall carried the incoming energy directly to the liquid surface. This conclusion is based on the fact that very little heating of the liquid bulk was observed dur- ing the experiment. Natural convection boundary-layer flow would be expected if the Ray- leigh number f o r this test was less than the Rayleigh number for the small tank tests. However, the Rayleigh number, based on tank diameter, for the reference 7 test is much larger due to the fourth power dependence of the Rayleigh number on the significant di- mension. characteristic dimension in the Rayleigh number should be some other quantity such as the boundary-layer thickness.
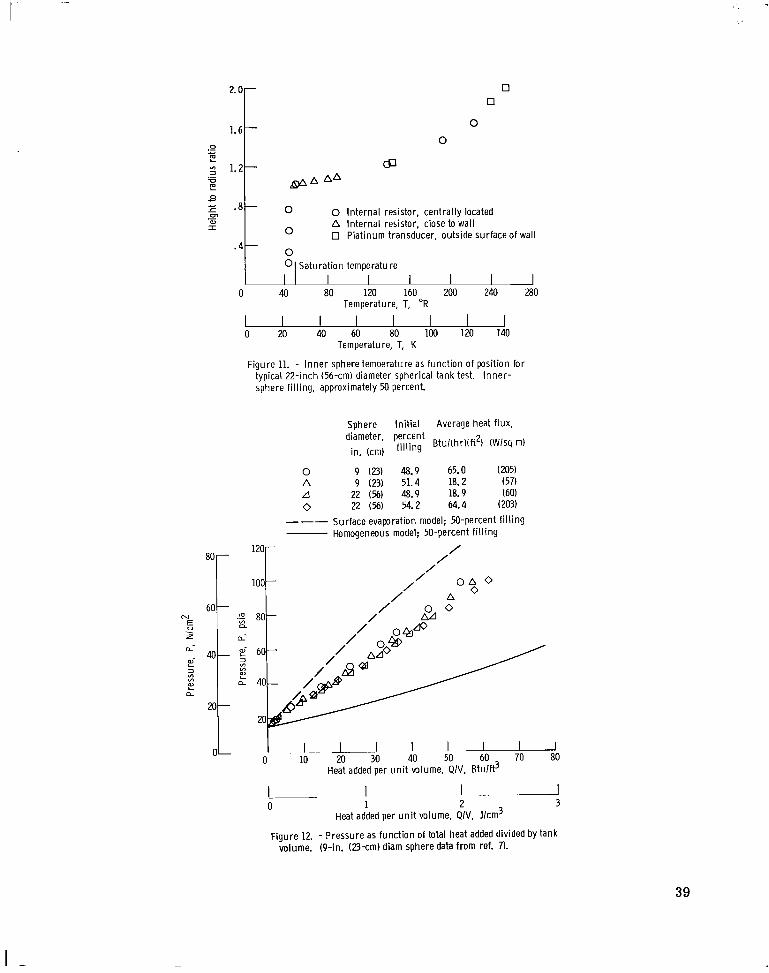
understood. with increasing temperature at higher vertical positions, may rule out the possibility of any convective flow. The validity of this point is shown by figure 11, which is a typical plot of inner-sphere temperature as a function of vertical position. The liquid-vapor in-
Liquid bulk. - Analysis based on the modified Rayleigh number (Ra = C gpp qD / 2 13
In contrast to the results obtained with the smaller tanks, is the data (ref. 7) obtained For this test the heat-
2 The
It
Consequently, either this type of Rayleigh number analysis is not valid or the
Vapor. - The heat-transfer processes which take place in the vapor a r e not clearly The fact that the lines of constant temperature in the vapor were horizontal,
10

terface is located at a height to radius ratio of approximately 1. This figure shows that fo r any given time, the temperature of the vapor space was only a function of the vertical coordinate, since the data fo r all the instrumentation, both centrally located and near the container wall, had the same temperature profile. It is possible that an involved conduc- tion analysis could predict the vapor temperature gradients; however, the results of the study presented in reference 14 indicate that the increasing system pressure could cause fluid motion which would dominate any conduction effects.
Liquid-vapor interface. - The transfer of heat and mass across the liquid-vapor interface, either by evaporation o r condensation, is also a process that is not well under- stood. Reference 15 presents an analysis based on irreversible thermodynamics that will predict the behavior of a fluid as it changes phase. However, the three transport coefficients that are necessary for solution of the equations must be experimentally de- termined. To the authors knowledge, the values of these coefficients for hydrogen a r e not available.
Liquid-thermal layer. - The liquid-thermal layer is the variable temperature region in the liquid between the liquid-vapor interface and the uniform temperature liquid bulk. Since the liquid bulk was always experimentally observed to be subcooled and the liquid-vapor interface is always saturated, it is reasonable to assume that conduction heat-transfer could account for the temperature gradients that exist in the liquid thermal layer. Here analysis is difficult because of the wide diversity of available data for the thermal conductivity of liquid hydrogen (ref. 16).
Effect of Tank Size
As can be seen, a great deal more basic research is necessary before the internal heat and mass-transfer processes which take place in a closed cryogenic container can be predicted analytically. Until this information is available, the rate of pressure r i s e in a closed cryogenic container must be determined experimentally. However, the use of models is a common engineering tool that can be used once scaling laws have been derived. tanks of similar geometry, percent filling, and heating configuration if the ratio of the total heat added to tank volume is the same. The effect of large differences in heat- transfer rate was shown by the comparison of the results of reference 7 (50 000-gal (189 000-liter) spherical tank) with the results obtained in the smaller tanks. The large tank had a rate of pressure rise approximately 10 t imes greater than would result from the homogeneous analysis while the ra te of pressure rise in the smaller tanks was three to four times greater than homogeneous. It is believed that this difference in compara- tive pressure-r ise rates is due to the large difference in heat-transfer rates between the
The ANALYSIS section shows that the same pressure rise should result in two
11
. II -
a i . 5 56.0 70. 5
larger and small tanks. Consequently, for scaling purposes, the heat-transfer rates must be such that similar heat- and mass-transfer processes take place in the liquid bulk. Figure 12 is a plot of pressure as a function of total heat added divided by tank volume for two pairs of similar tests performed using the two smaller spherical liquid- hydrogen tanks. These two pairs of data were chosen because their initial fillings were nearly identical, thus fulfilling one of the restrictions postulated in the ANALYSIS sec- tion. These data fell within a narrow band. However, as shown in figure 9, the effect of percent filling was small, so that all the data would fall within a narrow band, thus sup- porting the analysis which predicted that the effect of s ize on the self-pressurization of hydrogen tankage can be expressed as a simple geometric relation. .
75. a 45.4 30.4 15.0 81.9 64.7 17.2 11.4 93.9 82.7 11.2 4. a 82.9 67.6 15.3 14.0
Energy D i s t r i bu t io n
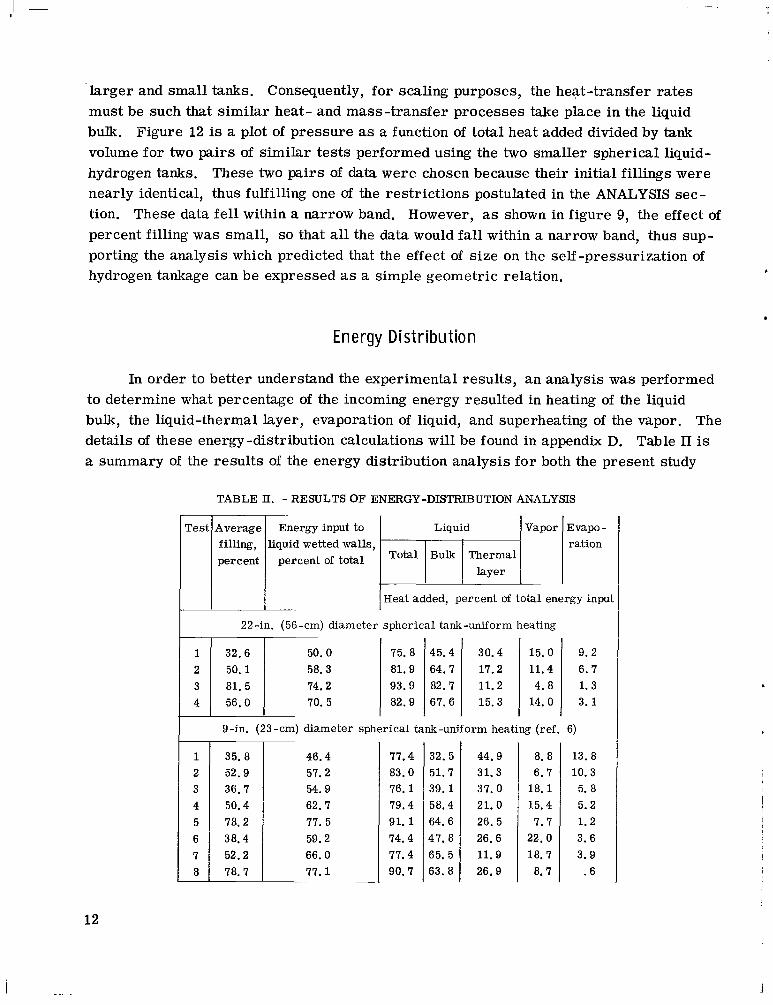
In order to better understand the experimental results, an analysis was performed to determine what percentage of the incoming energy resulted in heating of the liquid bulk, the liquid-thermal layer, evaporation of liquid, and superheating of the vapor. The details of these energy-distribution calculations will be found in appendix D. Table I1 is a summary of the resul ts of the energy distribution analysis for both the present study
TABLE II. - RESULTS OF ENERGY-DISTRIBUTION ANALYSIS
Liquid Vapor EmPo- ration
I
I I I I Heat added, percent of total energy input
1 a
9.2 6.7 1.3 3 .1
I 9-in. (23-cm) diameter spherical tank-uniform heating (ref. 6)
35. a 52.9 36.7 50.4 78.2 38.4 52.2 78.7
46.4 57.2 54.9 62.7 77. 5 59.2 66.0 77. 1
77.4
76.1 79.4 91.1 74.4 77.4 90.7
83. o 32. 5 51.7 39.1 58.4 64.6 47. a
63. a 65. 5
44.9 31.3 37. 0 21.0 26. 5 26.6 11.9 26.9
a. a
18.1 6.7
15.4 7.7
22.0 18.7
a. 7
13. a
5. a 10.3
5.2 1.2 3.6 3.9
. 6
12
-.. . I

and the uniform-heating tests of reference 6. The analysis shows that the energy input to the dry walls heated the vapor, supplied the necessary energy for evaporation, and heated some of the liquid since the energy input to the liquid wetted walls was always l e s s than the input to the liquid. The energy input to the liquid wetted walls heated the liquid bulk, and in some cases, a portion of the liquid-thermal layer. Essentially, the same conclusion was reached by the authors of reference 17 as a result of their tests on a 62 5 -gallon (2360-liter) cylindrical hydrogen Dewar.
primarily a function of the energy input to the dry walls since the energy input to the liquid wetted walls only heats the liquid. The only contribution that the heating of the liquid wetted walls makes to the container pressure is due to the thermal expansion of the liquid. Liquid hydrogen does have a relatively high coefficient of thermal expansion, but this effect is secondary to the energy input to the vapor and for evaporation in deter - mining the rate of pressure r ise .
The minor differences in the energy input distribution explain the slight deviations in the resul ts that were obtained from the two small hydrogen tanks (fig. 12). A s the heat-transfer rate was increased, the contents of the 9-inch (23-cm) tank became slightly less homogeneous (fig. lO(a)); while the contents of the 22-inch (56-cm) tank remained essentially the same (fig. lO(b)). This difference is attributed to the thicker wall of the 22 -inch (56-cm) tank, which absorbed a larger proportion of the incoming energy at the highest heat-transfer rates and caused less heating of the vapor (see tables I and 11).
The pressure-r ise rate in the hydrogen container fo r the uniformly heated tests is
SUMMARY OF RESULTS
A nonventing 22-inch (56-cm) diameter spherical tank partially filled with liquid hydrogen was subjected to four uniformly heated self-pressurization tests. were conducted with various combinations of liquid filling (approximately 30 to 80 percent by volume) and heat-transfer rate (approximately 17 to 64 Btu/(hr)(ft ) or 53 to 202 W/m ). These data were compared with data from a similar study performed on a 9-inch (23-cm) diameter, uniformly heated, spherical tank (ref. 6) and with the self- pressurization of a 50 000-gallon (189 000-liter) spherical liquid-hydrogen storage tank (ref. 7).
1. The data from the 9-inch (23-cm) and 22-inch (56-cm) diameter spherical tank tests verified the analysis that predicted that the effect of s ize on self-pressurization of hydrogen tankage can be expressed as a simple geometric relation involving the heat added per unit volume. This conclusion is supported by the fact that the pressure data, plotted as a function of heat added per unit volume, fell within a narrow band.
These tes ts
2 2
For the range of variables investigated, the following results were obtained:
13
2. The pressure - r ise rate increased almost linearly with increasing heat -transfer rate; however, as the heat-transfer rate was increased, the contents of the 9-inch (23-cm) tank became slightly l e s s homogeneous while the contents of the 22 -inch (56 -cm) tank remained essentially the same. This difference is attributed to the thicker wall of the 22 -inch (56 -cm) tank which absorbed a larger proportion of the incoming energy at the higher heat-transfer rates and caused a change to more bottom heating.
only slightly affected by varying the percent filling with a trend toward increasing pressure-rise ra tes at higher fillings.
had a much greater ra te of pressure r ise , when compared with the homogeneous analysis, than either of the smaller tanks. This difference was attributed to a different mode of heat transfer in the liquid. At the low heat fluxes encountered in the reference 7 experi- ment (0. 6 Btu/(hr)(ft ) or 1.9 W/m ), heat is transported in the liquid by laminar nat- ural convection rather than turbulent convection as is the case for the tes t s on the smaller tanks so that larger temperature gradients and nonhomogeneous conditions result.
3. For both the 9-inch (23-cm) and 22-inch (56-cm) tanks the pressure r i s e ra te was
4. The 50 000-gallon (189 000-liter) spherical liquid-hydrogen storage tank (ref. 7) r
2 2
Lewis Research Center, National Aeronautics and Space Administration,
Cleveland, Ohio December 12, 1968, 124-09-17-01 -22.
14
i . . . .

APPENDIX A
SYMBOLS
A
a
B j l
cP
, cV
D
F
g
k
L
M
m
P
Pf
Q v q
R
r
T
t
U
2 2 surface area, f t ; m
accommodation coefficient
absorption factor
specific heat, Btu/(lb)('R);
specific heat, Btu/(lb)(OR);
J/W (K)
J/(W (K)
diameter, f t ; m
angle factor
acceleration due to gravity, ft/sec 2 ; m/sec 2
(hr) (ft) (OR) ; W/(m) (K) thermal conductivity, Btu/
length, f t ; m
molecular weight
mass, lb; kg
pressure, psia; N/cm
filling by volume, percent
heat added, Btu; J
heat-transfer rate, Btu/hr; W
universal gas constant, 1 . 9 86 Btu/( lb)(mole) (OR); 8.3143 J/(mole)(K)
2
reflectivity
absolute temperature, OR; K
time, hr
total internal energy, Btu; J
U
V
X
X
P
Y
E
I-1
P
0
specific internal energy, Btu/lb; J/kg
3 3 volume, f t ; m
vapor mass fraction
linear distance, f t ; m
coefficient of thermal expansion, l/OR; 1/K
ratio of specific heats, C /Cv
emissivity P
dynamic vis cosi ty , ( lb) ( s e c) /f t' ; 2
3 3 (N) (sec)/m
density, lb/ft ; kg/m
Stefan-Boltemann constant, 0. 1713X10-8 Btu/(hr)(ft )( R ); 5 .669 7X 10 -8 W/( m2) (K4)
2 0 4
Subscripts:
a
av
b
ev
f
gc
i
j
L
Q
1
absorbed
average
liquid bulk
evaporation
final o r any intermediate state
gaseous conduction
initial state
summation variable
at x = L
liquid
liquid thermal Layer
15

m
max
n
r
rr
S
sat
s c
st
mean or average value
maximum
summation variable
radiant
reradiated
system
saturation
solid conduction
stored
V
vg
W
0
1
2
3
4
5
vapor
at vacuum gage
wall
at x = O
inner sphere
upper heater
lower heater
opening in upper heater ”
combined upper and lower heaters I
16

APPENDIX B
THERMODYNAMIC ANALYSIS
One method of analyzing a system thermodynamically is to define the conditions at the beginning and the end of a process; then the necessary input to the system can be de- termined. For the problem of a liquid-hydrogen storage tank, which is sealed at the beginning of the test, the initial condition is that the tank contains a homogeneoas mixture
defined by the model being considered. heat, and, as stated by the first law of thermodynamics
. at atmospheric pressure with a known percent filling by volume. The f inal condition is For a nonexpanding closed system, the input is
Equation (Bl) may be written in the form
t, Pt, f + mv, fuv, f ) - iUt , i + mv, i'v, i) Q = U - U . = ( m f 1
The density and specific internal energy of each phase at state i can be found if the s y s - tem is known to be homogeneous and at the saturation temperature corresponding to at- mospheric pressure (ref. 18). The total internal energy at state i can then be deter- mined be caus e
U
mv, - - pv, 1- 21 v
4 For a closed nonexpanding system, the mass of the liquid plus the mass of the vapor is a constant; consequently, the system density is a constant
Homogeneous .- model. - - State f (and thus the density and internal energy of each
17

phase) is defined by the fact that the system is homogeneous and is at the saturation tem- perature corresponding to the system pressure. Equation (B5), written for state f , can be solved for the percent filling at state f
The total iiiternal energy at state f can then be determined using equation (B6)
and
II1V, f = pv, f [1 -%Iv The amount of heat required to reach state f for the homogeneous model can now be cal- culated by using equations (B2) to (B4) and (B7) and (B8).
Surface-evaporation model. - State i is the same as that for the previous model so that the total internal energy at state i is found by the identical procedure. The surface- evaporation model is based on the concept that all the energy goes into evaporating the liquid and maintaining the vapor at the saturation temperature. If it is assumed that the liquid is incompressible, then the density and internal energy of the remaining liquid will be unaltered by the process; that is, pp , - - pQ, internal energy of the vapor a r e defined by the fact that the vapor is homogeneous and at the saturation temperature corresponding to the final system pressure. written for state f , can be solved for the percent filling at state f:
and uQ, = uQ, f . The density and
Equation (B5), 2
The mass of liquid and vapor at state f can then be determined using equation (B9)
18

and
The total internal energy at state f can now be determined, and from equations (B2) to (B4) and (B10) and (B11) the heat required to reach state f for the surface-evaporation model can be calculated.
i
19

APPENDIX C
HEAT-TRAN SFER ANALYSIS
The amount of energy absorbed by the contained hydrogen is equal to the heat t rans- f e r r ed to the sphere by radiation, solid conduction, and gaseous conduction minus the amount of energy stored in the container itself; that is,
The amount of heat transferred by thermal radiation from the heated intermediate sphere to the inner sphere is determined by the method presented in reference 19. For the radiant exchange calculations the outside of the inner sphere is assigned the number 1, the inside of the upper heater, number 2, the inside of the lower heater, number 3, and the opening in the upper heater, number 4. The net rate of radiant heat absorbed by the inner sphere when both heaters are installed is
4
q1 = o ~ ~ ~ c ~ ~ ~ ~ 4 - a c l ~ l ~ l 4
j= 1
where Bjl, the absorption factor, is defined as the fraction of the total radiant-energy emission of surface j which is absorbed by surface 1. The absorption factors are de- termined by solution of the following simultaneous equations:
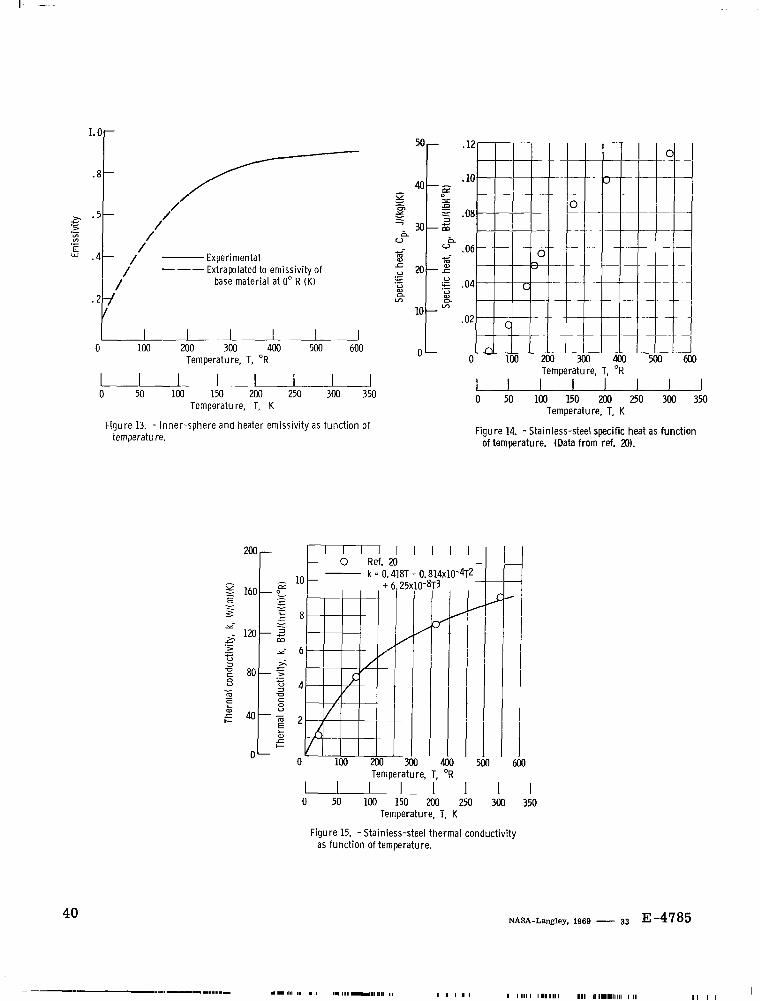
This technique treats all diffuse-radiation circumstances and requires only a know- ledge of the geometry of the four surfaces, the average temperature of the surfaces, and the emissivity of the surfaces. Lewis Research Center personnel experimentally obtained the emissivity of the inner surface of the heaters and the outer surface of the hydrogen
20
1
container (fig. 13) by using a sample identical to both surfaces. Because of the wires and tubes coming through the hole in the upper heater, the heat radiated through the hole from the outer sphere was assumed to be emitted from a black body.
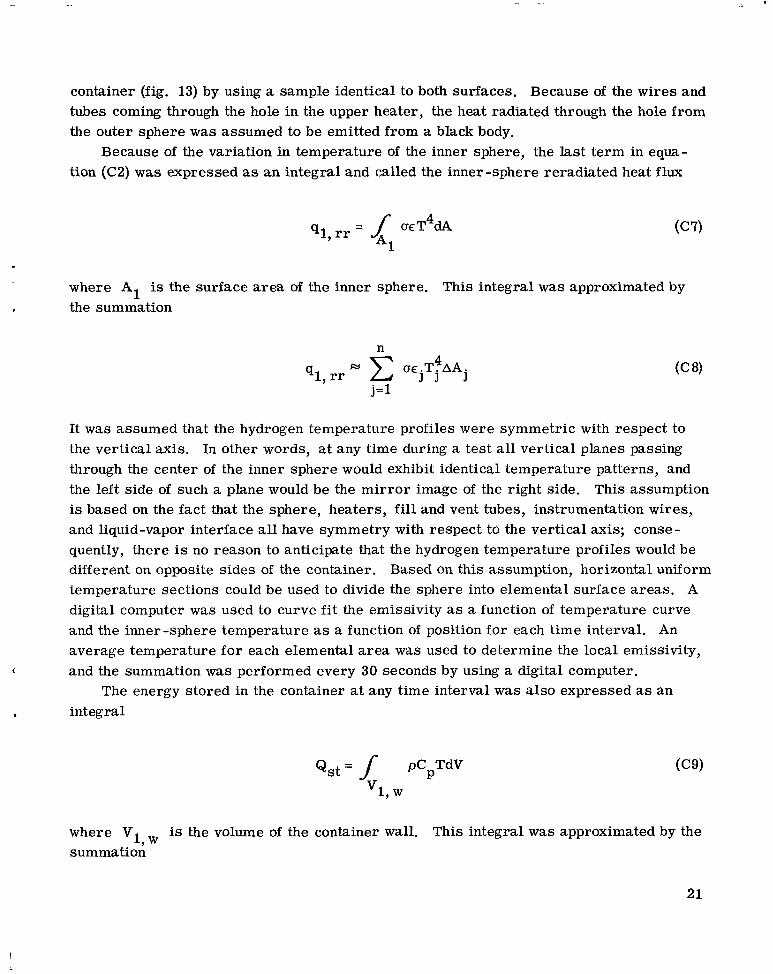
Because of the variation in temperature of the inner sphere, the last te rm in equa- tion (C2) was expressed as a n integral and called the inner-sphere reradiated heat f lux
= f ocT4dA A1
91, rr
where . is the surface area o the summation
the inner sphere. This integral was approximated by
n M wjTjAAj 4
91, rr j = l
It was assumed that the hydrogen temperature profiles were symmetric with respect to the vertical axis. In other words, at any time during a test all vertical planes passing through the center of the inner sphere would exhibit identical temperature patterns, and the left side of such a plane would be the mir ror image of the right side. This assumption is based on the fact that the sphere, heaters, f i l l and vent tubes, instrumentation wires, and liquid-vapor interface all have symmetry with respect to the vertical axis; conse- quently, there is no reason to anticipate that the hydrogen temperature profiles would be different on opposite sides of the container. temperature sections could be used to divide the sphere into elemental surface areas . A digital computer was used to curve f i t the emissivity as a function of temperature curve and the inner-sphere temperature as a function of position for each time interval. An average temperature for each elemental a r ea was used to determine the local emissivity,
The energy stored in the container at any time interval was also expressed as an
Based on this assumption, horizontal uniform
c and the summation was performed every 30 seconds by using a digital computer.
. integral
is the volume of the container wall. This integral was approximated by the 1, w
where V summation
21
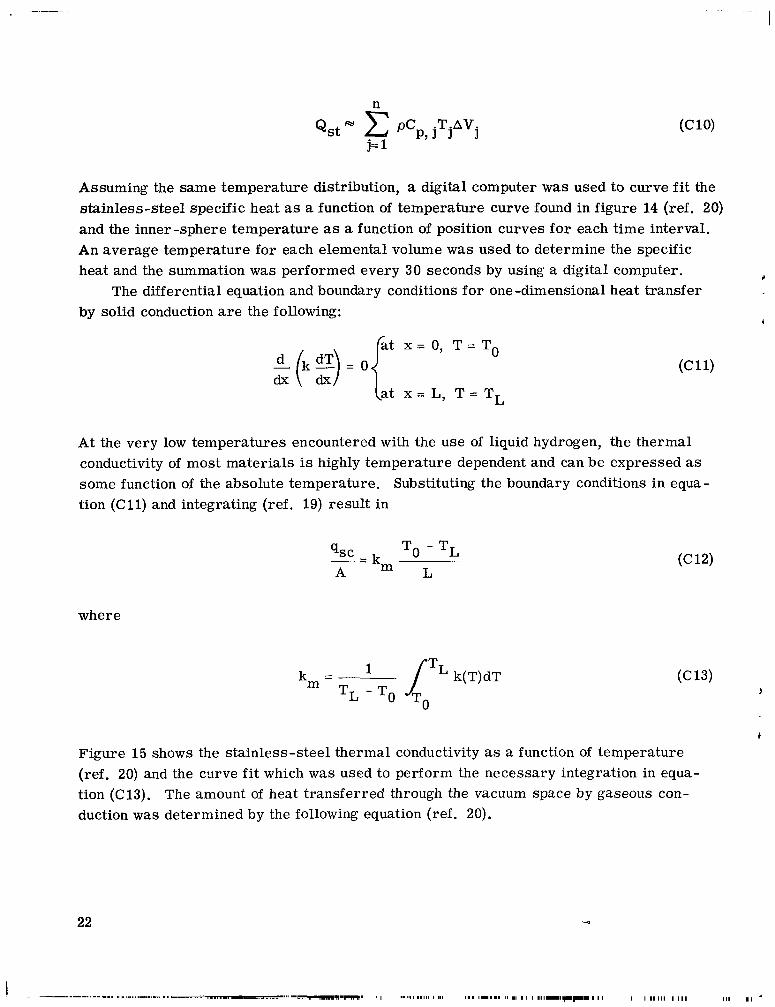
n
Assuming the same temperature distribution, a digital computer was used to curve f i t the stainless-steel specific heat as a function of temperature curve found in figure 14 (ref. 20) and the inner-sphere temperature as a function of position curves for each time interval. An average temperature for each elemental volume was used to determine the specific heat and the summation was performed every 30 seconds by using a digital computer.
by solid conduction are the following:
t
The differential equation and boundary conditions for one -dimensional heat transfer
4
L (at x = L, T = T
At the very low temperatures encountered with the use of liquid hydrogen, the thermal conductivity of most materials is highly temperature dependent and can be expressed as some function of the absolute temperature. Substituting the boundary conditions in equa- tion (C11) and integrating (ref. 19) result in
qsc To - TL - = k m A L
where
k = m 1'" k(T)dT TL - T O To
1
Figure 15 shows the stainless-steel thermal conductivity as a function of temperature (ref. 20) and the curve fit which was used to perform the necessary integration in equa- tion (C13). duction was determined by the following equation (ref. 20).
The amount of heat transferred through the vacuum space by gaseous con-
22

23

APPENDIX D
ENERGY DISTRIBUTION ANALYSIS
The total volume of the hydrogen container as it appears in this analysis included the volume of the plumbing up to the seal-off point of the experiment. Expansion of the con- tainer due to the increasing pressure was neglected.
method the following calculations were performed for each time interval. A s a first ap- proximation, it was assumed that the liquid level did not change between successive time intervals so that the volume of vapor could be determined.
Referring to figure 11, the energy distribution analysis was based on the assumption that the vapor space could be divided into horizontad uniform temperature disks. Each disk or elemental volume approximated a region of constant temperature and pressure. Since two thermodynamic properties are known, for each elemental volume, any other property can be determined. The properties of particular interest a r e the density and specific internal energy. The equations that were used to generate the hydrogen tables (ref. 18) were curved fitted using a digital computer so that the desired properties were readily available once the temperature and pressure were obtained from the experimental data. By using the elemental volumes to perform a summation (approximating an integra- tion) it is possible to determine the total mass and internal energy of the vapor space at any time.
The total test time was divided into 30-second intervals, and by using an iterative
m = 1 dmv V
vV
U v = uv dmv
vV
These two integrals were approximated by the summations
24
111 I
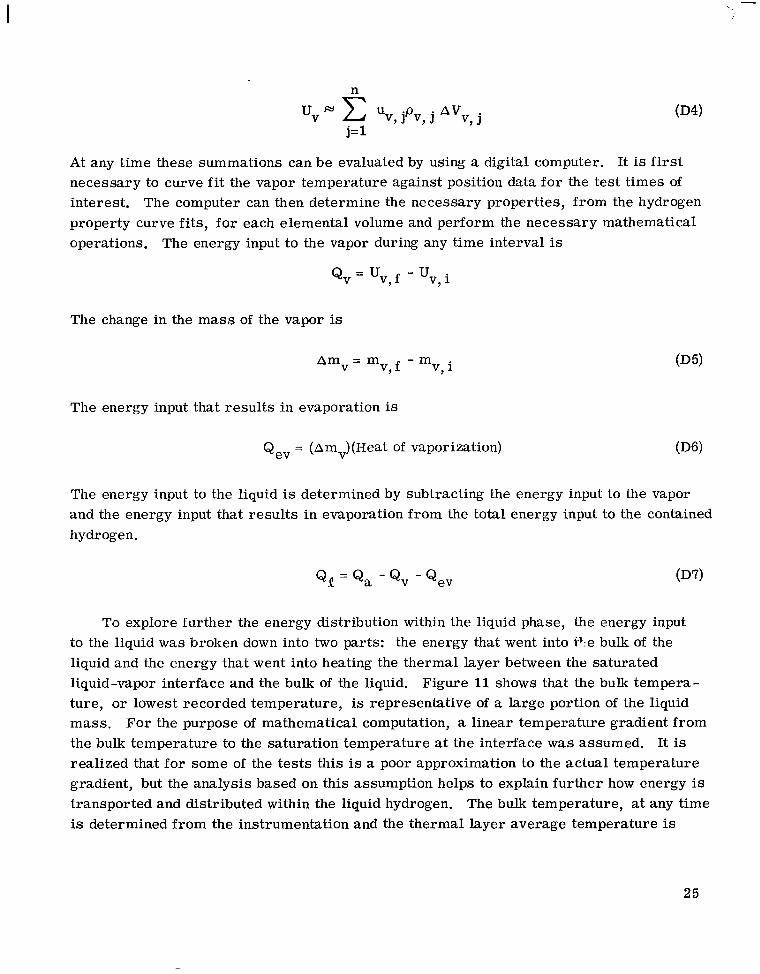
u v >, uv, jpv, j ~ v v , j j= 1
At any time these summations can be evaluated by using a digital computer. It is first necessary to curve f i t the vapor temperature against position data for the test times of interest. property curve fits, for each elemental volume and perform the necessary mathematical operations.
The computer can then determine the necessary properties, from the hydrogen
The energy input to the vapor during any time interval is
The change in the mass of the vapor is
Am = m - m v v,f v , i
The energy input that resul ts in evaporation is
Qev = (Am,)(Heat of vaporization) (D6)
The energy input to the liquid is determined by subtracting the energy input to the vapor and the energy input that results in evaporation from the total energy input to the contained hydrogen.
Qa = Qa - Q v -Qev
To explore further the energy distribution within the liquid phase, the energy input to the liquid was broken down into two parts: the energy that went into F e bulk of the liquid and the energy that went into heating the thermal layer between the saturated liquid-vapor interface and the bulk of the liquid. Figure 11 shows that the bulk tempera- ture, or lowest recorded temperature, is representative of a large portion of the liquid mass. the bulk temperature to the saturation temperature at the interface was assumed. It is realized that for some of the tests this is a poor approximation to the actual temperature gradient, but the analysis based on this assumption helps to explain further how energy is transported and distributed within the liquid hydrogen. The bulk temperature, at any time is determined from the instrumentation and the thermal layer average temperature is
For the purpose of mathematical computation, a linear temperature gradient from
25
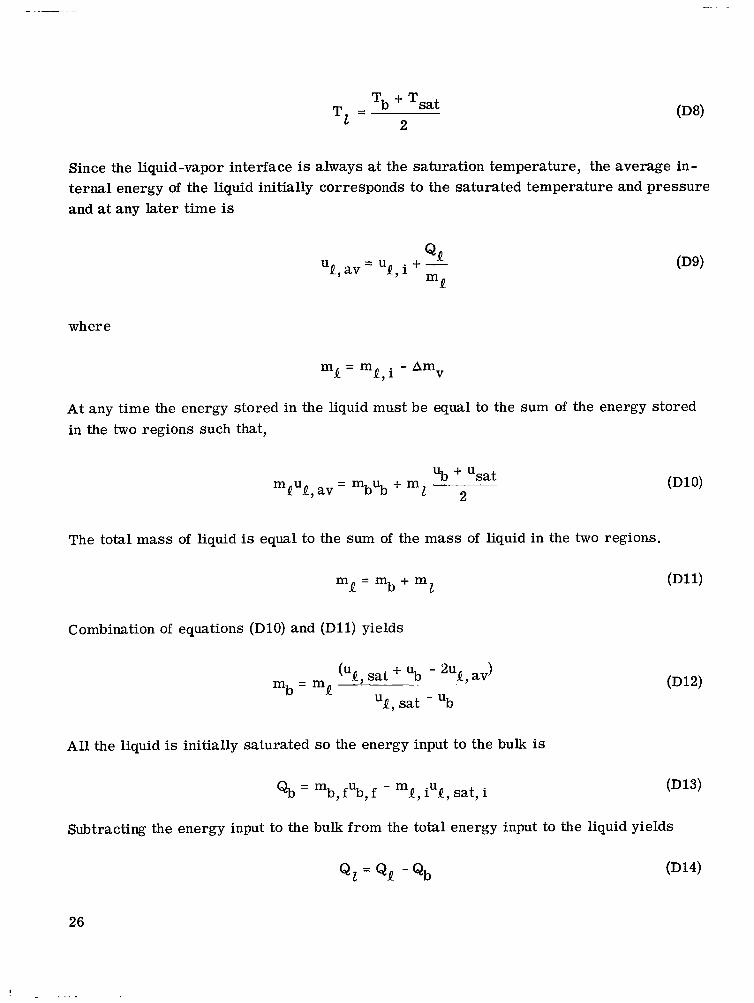
T. = Tb + Tsat 2 L
Since the liquid-vapor interface is always at the saturation temperature, the average in- ternal energy of the liquid initially corresponds to the saturated temperature and pressure and at any later time is
mQ I., a v = i + - U
where
m - m P - Q, i - Amv
At any time the energy stored in the liquid must be equal to the sum of the energy stored in the two regions such that,
ub + Usat m u - m u + m P 1 , a v - b b I
The total mass of liquid is equal to the sum of the mass of liquid in the two regions.
1 mP = mb + m
Combination of equations (D10) and (D11) yields
mb = mP sat "b - 2uPy av)
I., sat - ub U
All the liquid is initially saturated so the energy input to the bulk is
&b = mb, fub, f - mP, iul, sat, i (D13)
Subtracting the energy input to the bulk from the total energy input to the liquid yields
Q I = Q a -Qb (D14)
26

.: .
To determine the validity of the initial assumption, the percent filling of the inner sphere was recomputed
pf = x 100 PP, avv
where pQ as input. sure and ut, av
recomputed and the calculations are performed again starting with equation (Dl). This cycle is repeated until the liquid mass changes by less than 0 . 1 percent; the computer then proceeds to the next time interval.
is determined by using the computer and the values of the total sphere pres - This new value of percent filling allows the vapor volume to be
7 av
27

REFERENCES
1. Clark, J. A. : A Review of Pressurization, Stratification, and Interfacial Phenomena. International Advances in Cryogenic Engineering. Vol. 10. K. D. Timmerhaus, ed., Plenum Press, 1965, pp. 259-283.
2. Scott, L. E. ; Robbins, R. F.; Mann, D. B.; andBirmingham, B. W.: Temperature Stratification in a Nonventing Liquid Helium Dewar. J. Nat. Bureau Standards, vol. 64C, no. 1, Jan. -Mar. 1960, pp. 19-23.
3. Tatom, J. W.; Brown, W. H.; Knight, L. H.; and Coxe, E. F.: Analysis of Thermal Stratification of Liquid Hydrogen in Rocket Propellant Tanks. Advances in Cryogenic Engineering. Vol. 9. K. D. Timmerhaus, ed. , Plenum Pres s , 1964, pp. 265-272.
4. Anderson, Bernhard H. ; and Kolar, Michael J. : Experimental Investigation of the Behavior of a Confined Fluid Subjected to Nonuniform Source and Wall Heating. NASA TN D-2079, 1963.
5. Vliet, G. C. ; and Brogan, J. J. : Experimental Investigation of the Effects of Baffles on Natural Convection Flow and on Stratification. on Propellant Tank Pressurization and Stratification. Vol. 2. NASA TM X-57140,
Proceedings of the Conference
1965, pp. 61-86.
6. Aydelott, John C. : Normal Gravity Self-Pressurization of 9-Inch (23-cm) Diameter Spherical Liquid Hydrogen Tankage. NASA TN D-4171, 1967.
7. Liebenberg, D. H. ; and Edeskuty, F. J. : Pressurization Analysis of a Large-Scale Liquid-Hydrogen Dewar. International Advances in Cryogenic Engineering. Vol. 10. K. D. Timmerhaus, ed., Plenum Press, 1965, pp. 284-289.
8. Bailey, T . ; Convington, D.; Fearn, R . ; Pedreyra, D.; Perchoduk, T . ; Richards, H. ; and Merrill, H. : Analytical and Experimental Determination of Liquid Hydrogen Temperature Stratification. Rep. CR-63 -5, Martin Co. (NASA CR -56979), Apr. 1963.
9. Dropkin, D. and Somerscales, E. : Heat Transfer by Natural Convection in Liquids Confined by Two Paral le l Plates Which a r e Inclined at Various Angles with Re- spect to the Horizontal. J. Heat Transfer, vol. 87, no. 1, Feb. 1965, pp. 77-84.
10. Schwartz, S. H. ; and Holmes, L. A. : Flow Visualization and Thermal Stratification of Water in a Horizontal Cylinder and a Sphere. on Long-Term Cryo-Propellant Storage in Space. NASA TM X-60666, 1966,
Proceedings of the Conference
pp. 163-172.
28

11. Lock, G. S. H.; Gort, C.; and Pond, G. R.: A Study of Instability in Free Convec- tion From an Inclined Plate. Appl. Sci. Res. , vol. 18, no. 3, Nov. 1967, pp. 171- 182.
12. Drayer, D. E. ; and Timmerhaus, K. D. : An Experimental Investigation of the Individual Boiling and Condensing Heat-Transfer Coefficients for Hydrogen. Ad- vances in Cryogenic Engineering. Vol. 7. K. D. Timmerhaus, ed., Plenum Press, 1962, pp. 401-412.
13. Brentari, E. G. ; and Smith, R. V. : Nucleate and Film Pool Boiling Design Corre- International Advances in Cryogenic Engineering. lations f o r 0 2 , N2, Ha, and He.
Vol. 10. K. D. Timmerhaus, ed., Plenum Press , 1965, pp. 325-341.
14. Larkin, B. K . : Heat Flow to a Confined Fluid in Zero Gravity. Progress in Astro- nautics and Aeronautics. Vol. 20. G. B. Heller, ed . , Academic P res s , Inc., 1967, pp. 819-832.
15. Bornhorst, W. J. ; and Hatsopoulos, G. N. : Analysis of a Liquid Vapor Phase Change by the Methods of Irreversible Thermodynamics. J. Appl. Mech., vol. 34, no. 4, Dec. 1967, pp. 840-846.
16. Dwyer, Robert F. ; Cook, Gerhard A. ; and Berwaldt, Oren E. : The Thermal Conduc- tivity of Solid and Liquid Parahydrogen. J. Chem. Eng. Data., vol. 11, no. 3, July 1966, pp. 351-353.
17. Schmidt, A. F.; Purcell, J. R. ; Wilson, W. A.; and Smith, R. V.: An Experimen- tal Study Concerning the Pressurization and Stratification of Liquid Hydrogen. Advances in Cryogenic Engineering. Vol. 5. K. D. Timmerhaus, ed. , Plenum Press , 1960, pp. 487-504.
18. Roder, Hans M. ; and Goodwin, Robert D. : Extended Tables of Provisional Thermo- dynamic Functions for Para-Hydrogen (British Units); in Liquid, Fluid and Gaseous States at Pressures to 5000 PSI., 36' to 180°R and at P res su res to 1500 PSIA., 140' to 540°R. Rep. 7220, National Bureau of Standards, Jan. 3, 1962.
19. Gebhart, Benjamin: Heat Transfer. McGraw-Hill Book Co., Inc., 1961.
20. Scott, Russell B. : Cryogenic Engineering. D. Van Nostrand Co., Inc. , 1959.
29
In i t ia l percent
1 I 1 I
d ai L
2 2 VI
a Surface evaporation
Homogeneous model
,r Lower capi l lary tube
Y T o vacuum valve and pump
Figure 2. - Liquid-hydrogen experiment apparatus.
30

~~ .- . .. - . _. .. . . t
31

I \. I
~ I
\
l . \ . \
l
~~ -- ~'- - -~ _ . ..,...-- -~~-- -
C-67 -4216
Figure 4. - Carbon resistor rakes.
32
--------- - .-- - -- - - - -- - -- - -

d oi z E a
50 r
0 L (a1 Total pressure as function of time.
Transducer 3Wrn
Y
+- E-
5
- e CL
+
600
180 300
r v Outer sphere at top A Outer sphere at equator 0 Lower heater 0 Upper heater
- A ^ " n.. -
I I I (bl Outer-sphere and average heater temperature
as functions of time.
0 3 Transducer 7 4
2 5 0 1 D M a 1 200 r V 6
0 16 0 17 0 18 0 19
c 5 + 50 n ~ ; r 0 Saturated liquid hydrogen
I 40 50
I 30
I M
OL I I 0 10
1 1 I U 0 10 20 30 40 50
Time, t, min
(c) Upper inner-sphere internal and surface tem- perature as functions of time.
(d) Lower inner-sphere internal temperature as function of time.
Figure 5. -Test 1. Initial fil l ing, 31.6 percent; average heat flux, 16.9 Btu per hour per square foot (53 W/m21. (See fig. 3 for location of transducers.)
33

50
20
10
L 01 I 1-1 - 0 (a) Total pressure as function of time.
Transducer
n 2 0 3 0 4 D m
I 1 40
I 0 10 20 3f’
0 L
v Outer sphere at top A Outer sphere at equator 0 Lower heater 0 Upper heater
x 500 c-
I M O L 300 L ~ - l l - a (b) Outer-sphere and average heater temperatu re as
functions of time.
Transducer
a 1 v 6,7,8, and 9 A 11 0 12 D 15 0 16 0 17 0 18 0 19 0 Saturated liquid
hydrogen
I -1 J 30 40 50
_I 50
Time, t, min
(c) Upper inner-sphere internal and surface tem- m a t u r e as functions of time.
(d) Lower inner-sphere internal temperature as function of time.
Figure 6. -Test 2. Initial fil l ing, 48.9 percent; average heat flux, 18.9 Btu per hour per square foot (60 W d ) . (See fig. 3 for location of transducers.)
34

70 r 100-
60 - 80 - /
/
0
(a) Total pressure as function of time.
250 - Transducer
D 2and20 0 3
125 -
100 - E 0
25 t
v Outer sphere at top A Outer sphere at equator 0 Lower heater 0 Upper heater
600 -
x +-
180L I I I I I I 300
(b) Outer-sphere and average heater temperature as function o f time.
a; 3 m L m c
a 5 I-
Transducer
55 - A 1,11,12, and 15 to 19 30 - 0 6 t 0 9
0 Saturated l iquid hydrogen
E 50-
I-'
2 0 L 1 I I I I I 35
0 10 20 30 40 50 0 10 20 30 40 50 Time, t, m in
0
(c) Upper inner-sphere in ternal and surface tern- perature as functions of time.
(d) Lower inner-sphere in ternal temperature as function of time,
Figure 7. -Test 3. In i t ia l f i l l ing, 79.8 percent; average heat flux, 21.9 Btu per h o u r per square foot (69 W/m2). (See fig. 3 for location of transducers. 1
w Ln

N
5
F
- z .i
UI UI
E a
Y
I-'
d
e 3
a
E, I-
70 r loor / 60 60
50 80
20
/ /
L ~ I 6 0 0 r
v Outer sphere at top 0 Upper heater 0 Lower heater A Outer sphere at equator
0
(a) Total pressure as function of time.
Transducer
I I 0 24
I- E 240'- 5 ~
400
(b) Outer-sphere and average heater temperature as functions of time.
c
E, I-
Transducer
a 1 V 6 v 7 A 8 P 9 A 11 h 12 D 15 0 16 0 17 0 18 0 19 0 Saturated liquid
0 4 8 12 16 M 0 4 8 12 16 20 0
Time, t , min
(c) Upper inner-sphere internal and surface tem- perature as functions of time.
(d) Lower inner-sphere internal temperature as function of time.
Figure 8. -Test 4. Initial filling, 54.2 percent; average heat flux, 64.4 Btu per hour per square foot (203 W/m2). (See fig. 3 for location of transducers. 1

In i t ia l Average heat flux, pertent Btu/(hr)(ft2) (W/m2) f i I I ing
In i t ia l Average heat flux,
pili:$ Btu/(hr)(ft2) ( W d )
76.5 72.6 (229) 0 79.8 21.9 (69) 0 0 48.9 65.0 (205) A 48.9 18.9 (60)
a 31.6 16.9 153) a 34.9 59.9 (189)
Surface evaporation model Homogeneous model
- _ _ Surface evaporation model --- - Ho mog en mu s model
120 -
Init ia l percent f i l l i ng
In i t ia l -
percent f i l l i ng / 4 . 9 ,’ 80 -
100 - // 0 ,/ 31.6
31.6 60-
48.9
79.8
20
20 - 0 4 8 12 16 20 24 28 32 0 40 80 120 160 200 240 280 320
Heat added, Q, Btu
I I I I I I I 0 1 2 %!lo4 0 1 2 3
Heat added, Q, J
(a) 9-Inch (23 -m) diameter spherical tank (ref. 7). (b) 22-Inch (56-cm) diameter spherical tank.
Figure 9. - Pressure as function of total heat added, effect of percent f i l l ing,

Initial Average heat flux, percent Btu/(hr)(f t2) (Wlm) f i l l i ng
0 50.7 111.6 (352) 0 48.9 65.0 (205) a 51.4 18.2 (57)
50-percent f i l l ing Homogeneous model; 50-
percent f i l l i ng
--- Surface evaporation model;
I
In i t ia l Average heat f l ux
pi;;:: Btu/(hr)(f lZ) (W/m2)
48.9 18.9 (60) 0 54.2 64.4 (203)
50-percent f i l l ing
f i l l ing
--- Surface evaporation model;
Homogeneous model; 50-percent
60 m VI .- n
a- a- G)~ 40 - $
3 VI VI a,
VI VI
I 3
G) L a
N - z 5 8ol a
20 -
0- 0 4 8 12 16 20 24 28 32 0 40 80 120 160 200 240 280 320
I ...
N
E, --.. z a-
E- a
E VI VI
a
0 0
0
0
Sphere In i t ia l Average heat f lux, diameter, percent
filling BtuI(hr)(ft2) (Wlsq m) in. (cm)
0 9 (23) 48.9 65.0 (205)
A 22 (56) 48.9 18.9 (60) 0 22 (56) 54.2 64.4 (203)
A 9 (23) 51.4 18.2 (57)
--- Surface evaporation model; %-percent f i l l ing Homogeneous model; 50-percent f i l l i ng
L I I - - I I I 1 - 10 20 30 40 50 60 70 80
0 0
Heat added per unit volume, QIV, B t u l d
0 1 2 3 Heat added per unit vulume, QIV, J/cm3
Figure 12. - Pressure as funct ion of total heat added divided by tank volume. (9-in. (23-cm) diam sphere data f rom ref. 7).
39
I -
I I
I-Or
I
/'
/ Experimental Extrapolated to emissivity of
base material at 0" R (K) / --- / - Experimental
Extrapolated to emissivity of base material at 0" R (K)
/ ---
0 50 100 150 200 250 300 350 Temperature, T, K
Figure 13. - Inner-sphere and heater emissivity as funct ion of temperature.
I I I I I 200r mf.
40
Temoerature. T. O R
1 1 1 1 1 0 50 100 150 200 250 300 350
Temperature, T, K
I
I
Figure 15. - Stainless-steel thermal conductivi ty as funct ion of temperature.
NASA-Langley, 1969 - 33 E-4785
I I I I I I1 11111 1111111 111 11111.11111 111 I I I I

. _- .. .. _. . .... . . . .
I 4)
,%NATIONAL AERONAUTICS AND SPACE ADMINISTRATION WASHINGTON, D. C. 20546
I OFFICIAL BUSINESS FIRST CLASS MAIL
POSTAGE A N D FEES PAID NATIONAL AERONAUTICS A N D
SPACE ADMINISTRATION
!
"The aesonnictical and space nctivities of t he United Stntes shall be condncted so as t o contribute . . . t o the expansion of h i m a n knowl- edge of phenoiiiena in the ntiiiosphere and space. T h e Adiiiinistratjon shall protjide fo r the widest psncticnble nnd appiopriale disseminntion of infor))intion comet ning i t s nctiiities and the r9sdts thereof."
-NATIONAL AERONAUTICS AND SPACE ACT OF 1958
NASA SCIENTIFIC AND TECHNICAL PUBLICATIONS
TECHNICAL REPORTS: Scientific and technical information considered important, complete, and a lasting contribution to existing knowledge.
TECHNICAL NOTES: Information less broad in scope but nevertheless of importance as a contribution to existing knowledge.
TECHNICAL MEMORANDUMS: Information receiving limited distribution because of preliminary data, security classifica- tion, or other reasons.
TECHNICAL TRANSLATIONS: Information published in a foreign language considered to merit NASA distribution in English.
SPECIAL PUBLICATIONS: Information derived from or of vaiue to NASA activities. Publications include conference proceedings, monographs, data compilations, handbooks, sourcebooks, and special bibliographies.
TECHNOLOGY UTILIZATION PUBLICATIONS: Information on technology used by NASA that may be of particular interest in commercial and other non-aerospace applications. Publications include Tech Briefs, Technology Utilization Reports and N ~ ~ ~ ~ , and Technology Surveys.
CONTRACTOR REPORTS: Scientific and technical information generated under a NASA contract or grant and considered an important contribution to existing knowledge.
Details on the availability of these publications may be obtained from:
SCIENTIFIC AND TECHNICAL INFORMATION DIVISION
NATI 0 NA L AER 0 N AUT1 C S AND SPACE ADMINISTRATION Washington, D.C. 20546
I