effect of short term debt financing on financial
TRANSCRIPT

i
EFFECT OF SHORT TERM DEBT FINANCING ON FINANCIAL
PERFORMANCE OF SMALL AND MEDIUM ENTERPRISES IN BONDO
BY
SAMSON OANDO
A RESEARCH PROJECT SUBMITTED IN PARTIAL FULFILLMENT OF THE
REQUIREMENTS FOR THE DEGREE OF MASTER OF BUSINESS
ADMINISTRATION
DEPARTMENT OF ACCOUNTING AND FINANCE
MASENO UNIVERSITY
©2017

ii
DECLARATION
This research project report is my original work and has not been presented for a degree
in any other university.
Signature: ……………………………… Date: ………………………
Samson Oando
MBA/BE 00002/2015.
Supervisor
This research project report has been submitted for examination with my approval as
university supervisor.
Signature: ………………………..……… Date: ………………………
Dr. Benjamin Ombok
Department of Accounting and Finance
Maseno University

iii
ACKNOWLEDGEMENT
I would like to take this opportunity to thank my supervisor Dr. Benjamin Ombok for his
invaluable and insightful support and guidance that has enriched the results of this study.
His patience and sacrifice has been profound. Secondly I would wish to thank my family
for moral support, financial support and encouragement and their understanding
throughout my study period. Special thanks to my teacher and friend Mr. Muthama for his
valuable time and effort he contributed to enable me to be where I am.
Finally I wish to thank the Almighty God for granting me the opportunity to successfully
complete the research project.

iv
DEDICATION
This research project is dedicated to my family members, supervisor and friends who
have been very supportive and to the almighty God for the good health of mind that he
accorded me.

v
ABSTRACT
According to the World Bank, Small and Medium Enterprises (SMEs) contribute to over
60 per cent of total employment in developed countries and 80 percent in developing
ones, including the estimated informal sector whereas, according to Organization for
Economic Co-operation and Development (OECD) figures, SMEs account for 40 percent
of exports of OECD countries, and a somewhat smaller share in developing countries. In
Kenya, SMEs subsector is businesses in both formal and informal sectors contributing
Kshs 3371.7 billion against a national output of Kshs 9917.4 billion representing a
contribution of 33.8 percent in 2015. A majority of the SMEs serve a number of
populations and a class of income group who are basically in rural and semi urban set up.
Whereas, the exchange functions in the economy may be large scale, medium scale or
small scale, the greater orientation in that area or sub economy determine its contribution
to that economy. Available information from the trade and licensing records 2017 shows
that Bondo region for instance has a majority of its business undertaking classified to
small and medium enterprises which attract a funding model relevant for the SMEs. The
purpose of this study was to determine the effect of short term debt financing on financial
performance of SMEs in Bondo sub county, Kenya. The specific objectives were to
determine effect of accounts payable on financial performance of small and medium
enterprises and to establish the effect of short term loans on financial performance of
small and medium enterprises. A correlation research design was used for the study. A
target Population for the study was 503 owners of SMEs operating in Bondo Sub County.
400 owners of small and medium enterprises were sampled by use of stratified random
sampling technique as guided by Krejcie and Morgan table. This research used secondary
data. The data was obtained from financial statements of SMEs. A pilot study was
conducted for instrument reliability and data validity using Cronbach’s Alpha and expert
opinions was also sort for instrument validation. Data was analyzed using correlation and
regression methods. Profit margin ratio, return on assets and return on equity were used as
the measurement of performance whereas; short term debt and accounts payable were
used as independent variables. The findings of the study revealed that there was a
significant moderate positive relationship between accounts payable, short term loan and
performance of SMEs. While it concludes that accounts payable and short term loans are
important in explaining financial performance of SMES in Bondo Sub County because
there is significant association between accounts payable, short term loan and financial
performance of SMEs. The study recommends that SMEs should use more of short term
debt financing since it’s not open to fluctuations.
vi
TABLE OF CONTENTS
TITLE PAGE………………………………………………………………………………i
DECLARATION ................................................................................................................. ii
ACKNOWLEDGEMENT ................................................................................................. iii
DEDICATION .................................................................................................................... iv
ABSTRACT ......................................................................................................................... v
TABLE OF CONTENTS .................................................................................................... vi
LIST OF TABLES .............................................................................................................. ix
LIST OF FIGURES ............................................................................................................. x
ABBREVIATIONS & ACRONYMS ................................................................................ xi
DEFINITION OF TERMS ................................................................................................ xii
CHAPTER ONE: INTRODUCTION .............................................................................. 1
1.1 Background Information ................................................................................................ 1
1.2 Statement of the Problem ............................................................................................... 6
1.3 Objectives of the Study .................................................................................................. 7
1.3.1 Specific Objectives of the Study ................................................................................. 7
1.4 Hypotheses of the Study ................................................................................................ 7
1.5 Significance of the Study. .............................................................................................. 7
1.6 Scope of the Study ......................................................................................................... 7
1.7 Conceptual Framework .................................................................................................. 8
CHAPTER TWO: LITERATURE REVIEW ................................................................. 9
2.1 Concept of Financial Management ................................................................................ 9
2.2: Theoretical Review ....................................................................................................... 9
2.2.1: Pecking Order Theory ................................................................................................ 9
2.2.2. Static Trade-off Theory............................................................................................ 10
2.3. Empirical Literature Review ....................................................................................... 10
2.3.1. Accounts Payable on Performance of SMEs. .......................................................... 10
2.3.2: Short Term Loans on Performance of SMEs ........................................................... 12
CHAPTER THREE: RESEARCH METHODOLOGY. ............................................ 14
3.1 Research Design........................................................................................................... 14
3.2 Study Area ................................................................................................................... 14
3.3 Target Population ......................................................................................................... 14

vii
3.4: Sample Methods and Sample Size .............................................................................. 15
3.5: Data Collection Methods ............................................................................................ 15
3.5:1 Reliability and Validity Test. .................................................................................... 16
3.6: Data Analysis. ............................................................................................................. 16
3.7: Data Presentation ........................................................................................................ 17
3.8: Research Ethics ........................................................................................................... 17
CHAPTER FOUR: RESULTS AND DISCUSSION .................................................... 18
4.1 Introduction .................................................................................................................. 18
4.2 Demographic Results ................................................................................................... 18
4.2.1 Response Rate ........................................................................................................... 18
4.2.2 Gender of Respondents ............................................................................................. 18
4.2.3 Age of the Respondents ............................................................................................ 19
4.2.4 Types of Business ..................................................................................................... 19
4.2.5 Age of the Business .................................................................................................. 20
4.3 Accounts payable on performance of SMEs. ............................................................... 20
4.3.1 Correlation between Accounts payable and Return on Asset ................................... 20
4.3.2 Correlation between Accounts Payable and ROE. ................................................... 21
4.3.3 Correlation between Accounts payable and Net Profit Margin ................................ 22
4.4 Regression Analysis ..................................................................................................... 23
4.5 Short Term Loans on Performance of SMEs. .............................................................. 23
4.5.1 Correlation between Short-term Loan and Return on Assets ................................... 23
4.5.2 Correlation between Short-term loan and Return on Equity. ................................... 24
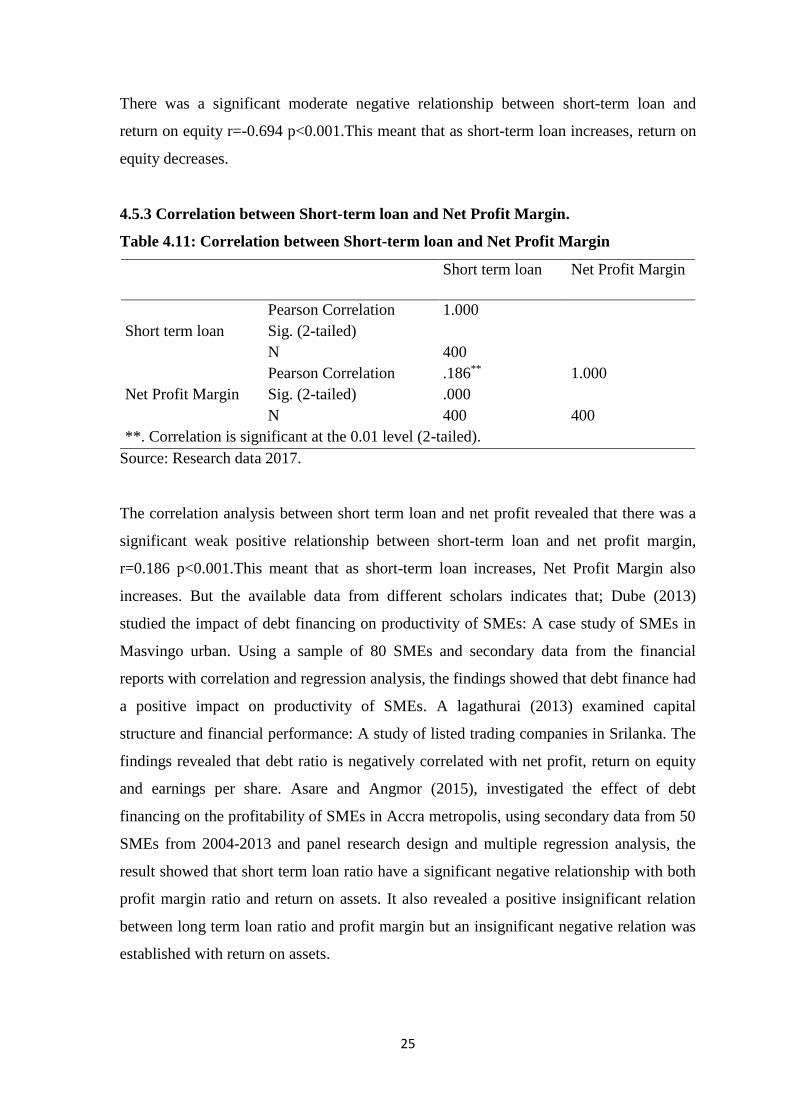
4.5.3 Correlation between Short-term loan and Net Profit Margin. .................................. 25
4.6 Regression Analysis. .................................................................................................... 26
4.7 Hypothesis Testing....................................................................................................... 26
CHAPTER FIVE: SUMMARY, CONCLUSION AND RECOMMENDATION. .... 28
5.1 Introduction .................................................................................................................. 28
5.2 Summary ...................................................................................................................... 28
5.3 Conclusion ................................................................................................................... 28
5.4 Recommendation ......................................................................................................... 28
5.5 Limitations of the Study............................................................................................... 29
5.6 Suggestions for Further Research ................................................................................ 29

viii
REFERENCES ................................................................................................................. 30
APPENDICES .................................................................................................................. 33
Appendix I: Secondary Data Schedule .............................................................................. 33
Appendix II: Raw Data ...................................................................................................... 33

ix
LIST OF TABLES
Table 3.1: Target population .............................................................................................. 15
Table 3.2: Sample Size Distribution .................................................................................. 15
Table 3.3: Reliability Statistics .......................................................................................... 16
Table 4.1: Gender of Respondents ..................................................................................... 18
Table 4.2: Age of the Respondents .................................................................................... 19
Table 4.3: Type of Business............................................................................................... 19
Table 4.4: Age of the Business .......................................................................................... 20
Table 4.5: Correlation between Accounts payable and Return on Asset ........................... 20
Table 4.6: Correlation between Accounts payable and ROE ............................................ 21
Table 4.7: Correlation between Accounts Payable and Net Profit Margin ........................ 22
Table 4.8: Regression Analysis.......................................................................................... 23
Table 4.9: Correlation between Short-Term Loan and Return on Assets .......................... 23
Table 4.10: Correlation between Short-term loan and Return on Equity .......................... 24
Table 4.11: Correlation between Short-term loan and Net Profit Margin ......................... 25
Table 4.12: Regression Analysis........................................................................................ 26
Table 4.13: ANOVAs ........................................................................................................ 27
Table 4.14: ANOVAs ........................................................................................................ 27

x
LIST OF FIGURES
Figure 1.1: Conceptual Framework showing relationship between short term debt
financing and financial performance of SMEs. ................................................................... 8

xi
ABBREVIATIONS &ACRONYMS
SMES Small & Medium Enterprises.
MSMEs Micro, Small & Medium Enterprises.
GDP Gross Domestic Product.
ROE Return on Equity.
ROA Return on Asset.
STDF Short Term Debt Financing.
OECD Organization for Economic Co-operation &Development.
DFI Development Financial Institution.
IFIs International Financial Institutions.
ILO International Labour Organization.

xii
DEFINITION OF TERMS
Debt Financing -Debt financing is money that you borrow to run your business. Debt
Financing is a financing strategy designed to increase the rate of return on
owners' investment by generating a greater return on the borrowed funds than
the cost of using the funds.
Short Term Debt -Financing usually applies to money needed for the day-to-day
operations of the business, such as purchasing of inventory, supplies, or paying
the wages of casuals and employees. Short term financing is referred to as an
operating loan or short term loan because scheduled repayment takes place in
one year.
Financial performance: This is most often defined as increased in the turnover or wider
profit margins, and the ability to contribute to wealth and job creation through
business start-up, survival, and growth. Financial performance can be measured
using profitability, return on asset, liquidity, solvency, and sales growth and all
these can be obtained from the financial statements and reports
Small and Medium Enterprises (SMEs) –Small and medium-sized enterprises (SMEs)
refers to enterprises which employ 6 to 50 persons and which have an annual
turnover not exceeding 50 million euro, and/or an annual balance sheet total not
exceeding 43 million euro (European Commission, 2010)
Return on assets (ROA) - measures how efficiently a company uses the firm’s assets to
generate operating profits. ROA also measures the total return to all providers
of capital (debt and equity). If a company carries no debt, its ROE and ROA
would be the same.
Return on equity (ROE) measures how much net income was earned as a percentage of
shareholder’s equity, it show how much profit a company generates with the
money shareholders have invested.
Accounts payable- Accounts payables are suppliers whose invoice for goods or services
have been processed but who have not been paid.
Short term loan- is granted by banks to meet the working capital needs of business. The
working capital needs refer to financial needs for such purposes as, purchase
of raw materials, payment of wages, electricity bill, taxes etc. Such loans are
granted by banks to its borrowers to be repaid within one year.

1
CHAPTER ONE: INTRODUCTION
1.1 Background Information
Performance is a set of financial and nonfinancial indicators which offer information on
the degree of achievement of objectives and results Lebans and Euske (2006). According
to Brumbach (1998) ‘Performance means both behaviors and results; Where behaviors
are the product of mental and physical efforts applied to tasks and that can be observed
apart from the result from the job. This definition of performance implies, that when
managing performance both inputs (behavior) and outputs results) need to be considered.
Financial performance is the process of measuring the results of a firm's policies and
operations in monetary terms Erasmus (2008). Ashok (2009) defined financial
performance as a subjective measure of how well a firm can use assets from its primary
mode of business and generate revenues. Tehrani and Rahnama (2006), defines financial
performance as a measure of how well a firm uses its available resources in the
generation of revenues and provides a guideline that gives a way for future decisions
relating to business developments, assets acquisitions and managerial control. It reflects
what has been achieved by the management in monetary terms over a specific duration
and can be utilized in making comparison of like firms in the one industry. While, Ongeri
(2014), state that, financial performance provides an avenue for the evaluation of business
activities in objective monetary terms. It shows how better a shareholder is at the end of
an accounting period than he was at the beginning and this can be ascertained by utilizing
financial ratios derived from financial statements or using data on market share prices.
Information on financial results is useful in predicting the capacity of the enterprise in
analyzing its performance against the set objectives Levasseur (2002). Return on equity,
Return on assets, profitability growth, and sales growth are all financial measures of
financial performance of business enterprises, including SMES; which are used to
measure different degrees of outcome Crabtree and Debusk (2008). According to the
Wheeler, “Business finance is that business activity which concerns with the acquisition
and conversation of capital funds in meeting financial needs and overall objectives of a
business enterprise”. While, according to Guthumann and Dougall (1955), business
finance is the activity that is concerned with planning, raising, controlling and
administering of the funds used in the business”. However, in the words of Parhter and

2
Wert, “Business finance deals primarily with raising, administering and disbursing funds
by privately owned business units operating in nonfinancial fields of industry”. Therefore
finance function is the process of acquiring and utilizing funds of a business and it relates
to overall management of an organization.
Financial performance is influenced by the general capital structure of an organization.
Capital structure refers to the different options used by a firm in financing its assets
Bhaduri (2002). Huang and Vuthi (2003) noted that a firm has three main sources of
financing to fund new investment opportunities. They state that this includes the use of
retained earnings, issuing new shares (equity) or borrowing money through debt
instruments (debt capital). These sources of financing constitute the capital structure of a
firm and also reflect the ownership structure of the firm. The foundation for theories and
research focus on the subject of capital structure began with the introduction of
Modigliani and Miller’s (M&M) theoretical model about corporate capital structure in
1958 which is considered to have created the turning point for modern corporate finance
theory. The theory provides insight into a firm’s capital structure decision in a capital
market free of taxes, transaction costs, and other frictions. Sibilkov (2009), state that
equity enables the firm to obtain funds without incurring debt. It means that the fund
obtained through equity do not have to be repaid back. The entrepreneurs who purchase
shares in the firm hope to reclaim their investment out of future profits. The shareholders
are entitled to share in the profits of the firm in the form of dividends or future capital
gains and in the event of loss, he state, that the shareholders have limited liability, which
means that the only loss they face is the amount that they had invested in the business.
Watson and Wilson (2002), has defined debt capital as a capital which a business raises
by taking out a loan. It can be categorized in terms of long term, midterm, or short term;
all of which apply differently to different institutions. It differs from equity or shares
capital because subscribers to debt capital do not become owners of the firm but are
creditors, and suppliers of debt capital usually receive a fixed annual percentage return on
their loan. Debt financing has both an advantage and a disadvantage on the growth of
corporations and for its strategic investments O’Brien and David (2010). According to
Fama and French (2002), the benefits of debt financing include the tax deductibility of
interest and the reduction of free cash flow problems, while the costs of debt financing
include potential bankruptcy costs and agency conflicts between stockholders and debt

3
holders. The over load cost of debt financing is commonly mitigated to various loan
structure by analyzing credit practices considered in issuances of loan. Such components
as collateral, capital base and imputed cost, Imputed cost are normally not levied on by
micro finance institution. Therefore, in making debt financing decisions, managers try to
create a balance between the corporate tax advantages of debt financing and the costs of
financial distress that arise from bankruptcy risks, Kraus and Litzenberger (1973). Loans
and overdrafts are the most common forms of debt finance. Debts are therefore required
for the daily operations of the business enterprise.
Short-term debt can have multiple meanings, but is most commonly viewed as debt that is
money market fund, Gambone and Trevino (2015).Short-term debt (also called
“revolving debt”) is used to fund short-term financial commitments, such as funding
payroll and managing regular, recurring expenses like utilities and rent. Though these
commitments vary widely, they are all considered short-term because money borrowed to
pay for them generally takes less than one year to repay- Guin, (2011), He farther says
that short term financing includes the following financial instruments; commercial
papers, promissory notes, asset-based loans, letters of credit, among others. According to
the matching principle of finance, short-term assets should be financed with short-term
liabilities and long-term assets should be financed with long-term liabilities, Short-term
assets and liabilities are generally defined to be those items that will be used, liquidated
mature or paid off within one year, Guin (2011). The components of short term debts
includes, short term bank loan, accounts payable, lease payment among others.
Small and medium enterprises encompass a broad spectrum of definitions. Dalberg report
of (2011) defines SMEs as having more than five and fewer than fifty employees.
Whereas, Inter-American Development Bank defines Small and Medium Enterprises as
having a maximum of one hundred employees and less than three million U.S Dollars in
revenue. Nataraja and Wyrick (2011) considered SMEs to have less than 500 employees.
The world trade report of 2016 and Kenya National bureau of statistics basic report of
2016 defines small enterprises as firms with a number of employees ranging between
10and 50. While medium sized enterprises are firms with a number of employees ranging
between 50and 250. While, the regulatory and institutional framework for Kenya
(MSMEs Act 2012), considers SMEs based on the number of staffs and the company's
annual turnover. For instance, the micro enterprises have been defined as those employing

4
less than ten workers with annual turnovers of less than Kshs 500,000 and capital
formation of less than Kshs 5 million for services or less than KES 10 million for
enterprises doing manufacturing. From the different definition I can say that SMEs are
viewed differently depending on the county but taking into account the number of
employees, capital formation and annual turnover. Small and medium enterprises sector
in the country comprises of manufacturing, service, and trade, (wholesale and retail) sub-
sectors, with substantial engagement in agro-based activities.
According to Bangasser (2000), SMEs in Kenya came to effect after the ILO report of
1972, which recognized SMEs as a sector for creating income and employment for the
Kenyan population. A further effort by the government formulation of a policy
framework on SMEs was recognized in Sessional Paper No.2 of 1992, "Small and
Medium Enterprises (MSMEs) and Jua Kali Development in Kenya," Kenya national
assembly, (1992). The Sessional Paper recommended that the relevant ministries in
consultation with the Attorney general's office address the regulatory framework to
support the creation of an enabling business environment for SMEs. Another Sessional
Paper No.2 on the development of SMEs for employment and wealth creation for poverty
reduction was formulated and published in 2005. The paper spelled out some of the key
measures to address business registration; business licensing and tax regime. Another
policy regime which attempted to address the SMEs issues integrated the SMEs matters
in the Private Sector Development Strategy (2006-2010). The strategy considered SMEs
as a central link between the private sector and poverty reduction.
According to the recent studies, economic growth of any country closely links with the
SME development. For example, Beck (2005) explains that there is a robust, positive
relationship between the economic growth and the SME's relative size. Similarly,
Ayyagari (2007), notes that the contributions of formal SMEs in the high - income
countries amount to nearly 50 percent of GDP on an average. It is also important to note
that much of employment generation is through the growth of SME sector only Ardic,
Mylenko & Saltane 2011). According to the World Bank, small and medium enterprises
contribute to over 60 per cent of total employment in developed countries and 80 percent
in developing ones, including the estimated informal sector (World Bank, 2013). Also,
according to Organization for Economic Co-operation and Development (OECD) figures,
SMEs account for 40 percent of exports of OECD countries, and a somewhat smaller

5
share in developing countries. In Kenya, SMEs subsector is businesses in both formal and
informal sectors contributing Kshs 3371.7 billion against a national output of Kshs 9917.4
billion representing a contribution of 33.8 percent in 2015, (Kenya national bureau of
statistics 2016). Though it is observed that the role of SMEs is increasing significantly in
respective national economies, a lot needs to be done to ensure the development of the
sector and to improve it significantly in the world trade. Since the creativity of small
companies is the fuel of the entrepreneurial spirit and the economic growth.
In emerging economies, SMEs provide the vast majority of those jobs. Yet every second
business remains credit constrained in emerging markets, and struggles to raise the
financing necessary to invest and create new jobs. New research by McKinsey and IFC
found that 70 percent of the micro, small and medium enterprises (MSMEs) in these
countries does not use any external financing from formal financial institutions, and
another 15 percent are underfinanced from formal sources. This explains why SME
finance has been a key part of the agenda of the G-20 since the Pittsburgh Summit. While
some progress has been made, it will require further commitment from governments,
development financial institutions (DFIs) and international financial institutions (IFIs),
financial institutions, and the private sector to unleash the growth potential of SMEs.
From the available literature relating directly or indirectly short term financing and
financial performance reveals; Abdu’s (2013) considering effect of lease finance on
performance of SMEs in Bangladesh, established a positive correlation between lease
finance and return on equity/return on assets. Yujie (2013) in a study of effect of trade
credit and profitability in small and medium enterprises in Netherlands, had findings
showing that SMEs can establish a long term relationship with their suppliers to gain
credit since accounts payable is positively related to the profitability. Yuba and Zubairu
(2015), looking at the impact of banking sector credit on the growth of small and medium
enterprises in Nigeria, established that banking sector has significant impact on the
growth of small and medium enterprises since it has a positive impact on inflation,
exchange rate and trade debt. Githaiga and Kabiru (2015), in a study of the effect of debt
financing and financial performance of small and medium size enterprises in Kenya,
established that long term loan and short term loan had negative impact on financial
performance of SMEs. Dube (2013), considered the impact of debt financing on
productivity of small and medium scale enterprises in Masvigo urban, the result showed

6
that debt financing had a positive impact on productivity of SMEs. Githire and Muturi
(2015), studied the effects of capital structure on financial performance of firms in Kenya,
listed at the Nairobi securities exchange, the findings showed that equity and long term
debt had a positive and significant effect on financial performance, while short term debt
had a negative and significant effect on financial performance.
The above studies looked at debt financing in general and agrees that debt has an effect
on the performance of SMEs either positively or negatively. However, in the context of
their approaches, there is limited linkage created between short term debt financing and
performance, especially for SMEs. The literature evidences also reveal that debt financing
has the potential for spurring business performance for SMEs, but limited information is
available about short term debt financing and its contribution on the performance of
SMEs. Because short term debt financing address business operation on a day to a day
occurrences, it’s imperative that analysis of short term debt financing on the performance
of SMEs be carried out.
1.2 Statement of the Problem
The available literature on debt financing and performance of SMEs reveals mixed
results; but generally agrees that debt has positive or negative effect on the performance
of SMEs. Consequently, in the context of their approaches, there is limited information
linkage between short term debt financing (STDF) and performance, especially for SMEs,
despite the short time variation in recovery of such credits. Whereas literature also reveals
that debt financing has potential for spurring business performance in general and
specifically for SMEs, there is limited information on the contribution of Short Term
Debt Financing to performance of SMEs. Because short term debt financing address
business operation on a recurrent manner, it is imperative that analysis of short term debt
financing on the performance of SMEs be undertaken. The previous study reveals that
accounts payables, both negatively and positively affects the performance of the large
firms as it is important in meeting the recurrent expenses. Hover little has been studied on
how and to what extent it affects the financial performance of SMEs. It is from this
background that this study seeks to determine the effect of account payable on the
financial performance of SMEs.

7
1.3 Objectives of the Study
The general goal of the study was to determine the effect of short-term debt financing on
the financial performance of small and medium enterprises in Bondo Sub County.
1.3.1 Specific Objectives of the Study
The study was guided by the following specific objectives:
i. To determine the effect of accounts payable on financial performance of Small
and Medium Enterprises in Bondo sub county.
ii. To establish the effect of short term loans on financial performance of Small and
Medium Enterprises in Bondo sub county.
1.4 Hypotheses of the Study
H01: Account payable has no significant effect on financial performance of Small and
medium enterprises
H02: A short term loan has no significant effect on financial performance of small and
medium enterprise.
1.5 Significance of the Study.
The study will be significant in advising in the appropriate financing model relevant to
SMEs. It will also assist the government in the formulation of policies that favors SMEs
and have an insight on how to improve the skills of the entrepreneurs to boost the growth
of SMEs. To entrepreneurs, it provides knowledge on how to manage their funds for
business continuity. To scholars and future researchers, the study will form a basis for
future research by providing additional information on this particular topic.
1.6 Scope of the Study
This research dealt with 70% of small and medium (SMEs) enterprises in Bondo who had
acquired loan facilities from the financial institutions. The rationale for focusing on the
SMEs in Bondo was that there is significant growth potential of SMEs in the region into
major business institutions. A part from this very limited documentation on the effect of
short-term debt financing on the financial performance of SMEs exists. Bondo is situated
in Siaya County, Nyanza, Kenya; its geographical coordinates are 0° 14' 19" North, 34°
16' 10" East.
8
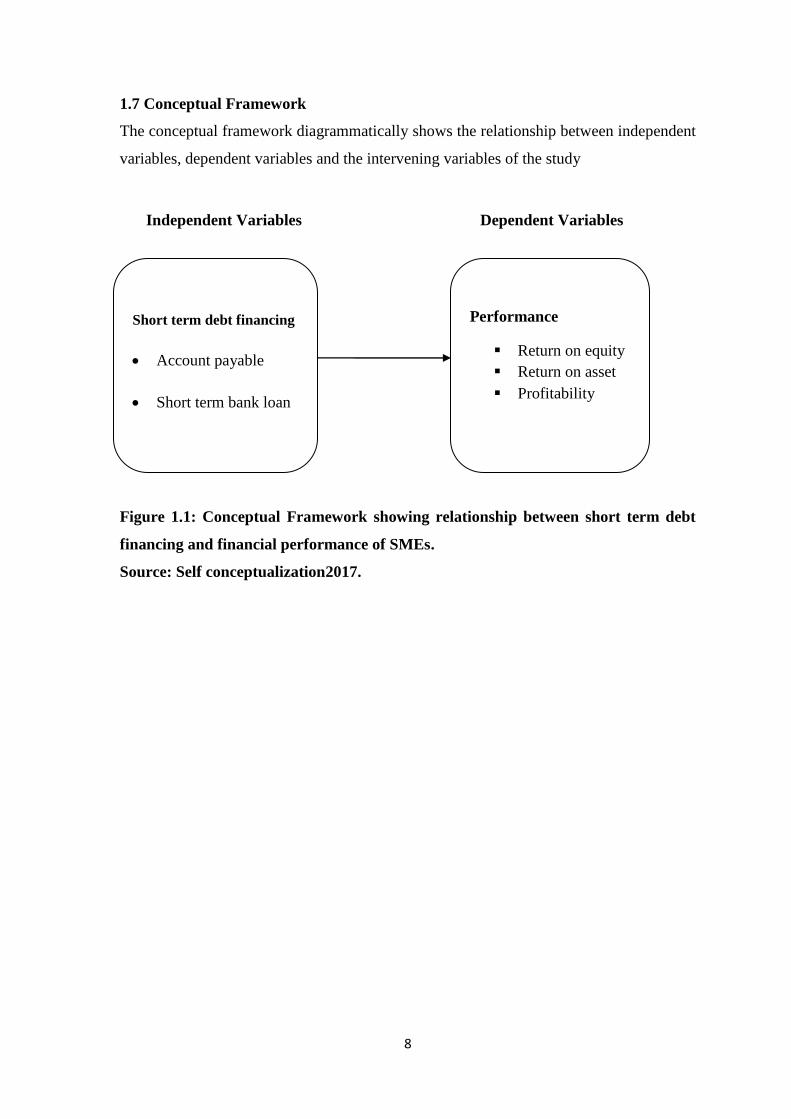
1.7 Conceptual Framework
The conceptual framework diagrammatically shows the relationship between independent
variables, dependent variables and the intervening variables of the study
Figure 1.1: Conceptual Framework showing relationship between short term debt
financing and financial performance of SMEs.
Source: Self conceptualization2017.
Performance
Return on equity
Return on asset
Profitability
Short term debt financing
Account payable
Short term bank loan
Independent Variables Dependent Variables

9
CHAPTER TWO: LITERATURE REVIEW
2.1Concept of Financial Management
Financial performance has been described by Ongeri (2014) as the evaluation of business
activities in objective monetary terms. It shows how better a shareholder is at the end of
an accounting period than he was at the beginning and this can be ascertained by utilizing
financial ratios derived from financial statements or using data on market share prices.
Information on financial results is useful in predicting the capacity of the enterprise in
analyzing its performance against the set objectives
2.2: Theoretical Review
The theoretical review of this study deals with two theories of pecking order theory and
static trade off theory.
2.2.1: Pecking Order Theory
Pecking order (also called adverse selection or financing pyramid) in its simplest form is
a preference theory, which progressively exploits financing choices from the least costly
to the most expensive. The pecking order theory has been mainly associated with Stewart
Myers (Myers (1984), Myers and Majluf (1984). According to the pecking order theory,
management prefers to finance their business first, from retained earnings, followed by
debt, then with hybrid forms of finance such as convertible loans, and last of all by using
externally issued equity. Norton (1991) found out that 75% of SMEs seems to make
financial structures decisions within pecking order framework which is consistent with
small and micro enterprises sector because they are managed by the owner who does not
want to dilute their ownership. Owner-managed businesses usually prefer retained profits
because they want to maintain the control of assets and the business. Financing, from
equity, minimize financial distress because there are no outsiders who can force the
company into liquidation and therefore the business will grow at a slow rate, but the
owner is sure of survival with little profits and no interest paid to the outsiders (Norton,
1991).

10
2.2.2. Static Trade-off Theory
The basic concept behind the static trade-off theory is to minimize the cost of capital by
employing an appropriate debt and equity financing. Firms are partly financed by debt
and equity and the main benefit of debt financing is the tax benefit of that debt, while on
the other hand, the disadvantage of debt financing is debt cost i.e. the interest or return
which company pays on debt which is referred as bankruptcy cost. The static tradeoff
theory of capital structure states that in order to maintain the balance between the pros
and cons of debt and equity financing, the firm must choose the mixed type of financing.
Moreover, the cost of capital cannot be minimized by increasing the debt level because at
a specific point, the cost of debt will become more expensive than the cost of equity
hence increases the Leverage level and due to which the risk of creditor increase as a
result the required rate of return increases. Furthermore, the increased amount of debt also
makes the investors and shareholders' financial position more risky. Hence, up to a certain
limit, the cost of capital can be decreased by increasing debt. However, after that limit,
the cost of capital will start increasing. Therefore, firms usually use the mixture of debt
financing and equity financing in order to minimize the average cost of capital and to
increase the market value per share. The static tradeoff theory of capital structure of firms
varies from sector to sector. Industries, whose firms are more tangible, tend to borrow
more rather than use the equity because assets of these industries are collateral and
considered relatively safe. By using Trade off theory, Rajan and Zingales (1995)
concluded that there is a positive correlation between Leverage, and profitability of a
firm, whereas tangibility of assets and the size of the firm are positively correlated with
firm’s Leverage. Therefore, Static trade-off models understand the optimal capital
structure is achieved when the marginal present value of the tax shield on additional debt
is equal to the marginal present value of the costs of financial distress on additional debt.
On the other hand, the pecking-order theory suggests that there is no optimal capital
structure but firms ration between internal financing (retained earnings) to external funds
depending on the extent of perceived information asymmetry in the financing
environment.
2.3. Empirical Literature Review
2.3.1. Accounts Payable on Performance of SMEs.
Ikechukwu and Nwakaego (2015), studied the effect of accounts payable ratio on the
financial performance of food and beverages manufacturing companies in Nigeria, using

11
multiple regression analysis, showed that accounts payable ratio had negative significant
effect with the profitability ratio. Madishetti and kibona (2013), investigated the impact of
receivables and payables management on the profitability of SMEs in Tanzania, using
regression analysis, the result showed that positive relationship is observed between
average payment period and gross operating profit. Hassan (2016), examined the effect of
trade receivables and inventory management on SMEs performance in Malaysia.
Secondary data was (Nwakaego, 2015) collected from financial reports and using
regression analysis the result revealed that days account receivables and inventory
turnover in days are negatively related to SMEs profitability. Rizwan and Shah (2015),
studied the impact of working capital management on firms performance: A case of
textile spinning sector in Pakistan, using panel data with 10 companies as participants,
from 2008-2014 and spearman’s correlation and linear regression analysis, established
weak negative relationship between account receivable turnover, account payable
turnover with ROE and ROA. Aravind (2016), examined the influence of working capital
metrics on profitability: A critical examination on Indian manufacturing sector, using
descriptive and inferential statistical measures with 100 manufacturing companies
participating from 2005-2015.the result reveled that cash conversion cycle is positively
correlated to net profit ratio but negatively related to the return on equity, (ROE). Awan,
Shahid, Hassan and Ahmed (2014), studied the impact of working capital management on
profitability of cement sector in Pakistan, secondary data was collected from financial
reports with 10 cement companies participating in the study from 2009-2013, using
correlation coefficient and multiple regression analysis, the finding showed that return on
equity is negatively correlated with the cash conversion cycle, current ratio and inventory
turnover in days. Achode and Rotch (2016), studied the effects of account payable as
source of financing on performance of listed manufacturing firms at the Nairobi securities
Exchange, using census sampling technique and multiple regression model the result
showed that there is direct positive relationship between accounts payable and
performance of the firms. Sadiq (2017), studied the impact of working capital
management on SMEs performance in Nigeria, secondary data was collected from
financial report and using regression analysis the findings revealed that accounts payable
period, cash conversion cycle and net trading cycle has positive effect on performance.

12
2.3.2: Short Term Loans on Performance of SMEs
(Abor, 2013) studied the effect of capital structure on profitability of listed firms on
Ghana stock exchange, using panel data and regression analysis. The result showed a
significantly positive relation between the ratio of short term debt to total assets and ROE.
However, a negative relationship between the ratio of long term debt to total assets and
ROE was found. Wanambisi, and Bwisa (2013), on effects of microfinance lending on
business performance: a survey of micro and small enterprises in Kitale municipality,
Kenya; .using descriptive survey research design with 120 SMEs as participants
established that the amount of loans is significantly and positively related with
performance of MSMEs in Kitale municipality. Asare and Angmor (2015), investigated
the effect of debt financing on the profitability of SMEs in Accra metropolis, using
secondary data from 50 SMEs from 2004-2013 and panel research design and multiple
regression analysis, the result showed that short term loan ratio have a significant
negative relationship with both profit margin ratio and return on assets. It also revealed a
positive insignificant relation between long term loan ratio and profit margin but an
insignificant negative relation was established with return on assets. Mwangi and Birundu
(2015), the effect of capital structure on the financial performance of small and medium
enterprises in Thika sub county, Kenya, While using descriptive research design and
multiple linear regressions with 40 SMEs participating in the survey, found out that there
was no significant effect of capital structure, asset turnover and asset tangibility on the
financial performance of SMEs in Thika sub-county, Kenya. Kyule and Ngugi (2014).
Looked at the Influence of capital structure on leverage of small and medium size
enterprises in Kenya, Using descriptive survey design and regression analysis model with
430 SMEs participating in the survey, established that there is positive relationship
between the level of leverage and the firms size.Yuba and Zubairu (2015), looking at the
impact of banking sector credit on the growth of small and medium enterprises in Nigeria.
Using time series design and both descriptive and correlation matrix analysis, established
that banking sector has significant impact on the growth of small and medium enterprises
since it has a positive impact on inflation, exchange rate and trade debt. Kariuki and
Ngugi (2014), studied the effect of table banking on the performance of micro and small
enterprises in Nairobi County. The study adopted a descriptive research design and
correlation analysis model with 250 managers of micro and small enterprises participating
in the survey. Its finding shows that table banking has increased ease of access of credit
for micro and small enterprises in Nairobi County. Abdu’s (2013) considered the effect of

13
lease finance on performance of SMEs in Bangladesh using cross sectional methods and
53 managers of SMEs with the use of regression analysis, established a positive
correlation between lease finance and return on equity/return on assets. Bello, Ahmad and
Aliyu (2016), Examined the impact of lease financing on financial performance of
Nigeria oil and gas industry, the data for the study was collected from annual reports and
accounts of 6 sampled companies in the Nigerian Oil and Gas industry that are engaged in
lease financing and were also listed on the Nigerian Stock Exchange (NSE). Regression
analysis was used to analyze the data, the results of the study revealed that lease financing
has significant impact on the ROA of oil and gas companies in Nigeria. Wafula,
Namusonge and Nambuswa (2016), considered the effect of leasing on the financial
performance of the county government of Trans Nzoia, the study adopted a descriptive
survey research design with 10 departments and 10 officials participating in the survey,
Statistical Package for Social Science (SPSS) version 22 and regression analysis was
used. The results showed that financial lease, had positive effects on ROA and financial
performance of the county government of Trans Nzoia.Mwangi, Makau and Kosimbei
(2014), and investigated the relationship between capital structure and performance of
non financial companies listed in the Nairobi securities exchange, Kenya. Explanatory
non –experimental research design was used with 44 non financial companies
participating in the survey, while using descriptive statistics, correlation analysis, and
panel multiple regression analysis, their finding showed that financial leverage had a
statistically significant negative association with performance as measured by return on
assets (ROA) and return on equity (ROE). Seyoum, testay and kassahun (2016),
examined working capital management and its impact on profitability : evidence from
food complex manufacturing firms in Addis Ababa, from 2009-2013, using descriptive
statistics and multiple regression analysis, findings show that average days in inventory,
have a significant impact on return on assets.
14
CHAPTER THREE: RESEARCH METHODOLOGY.
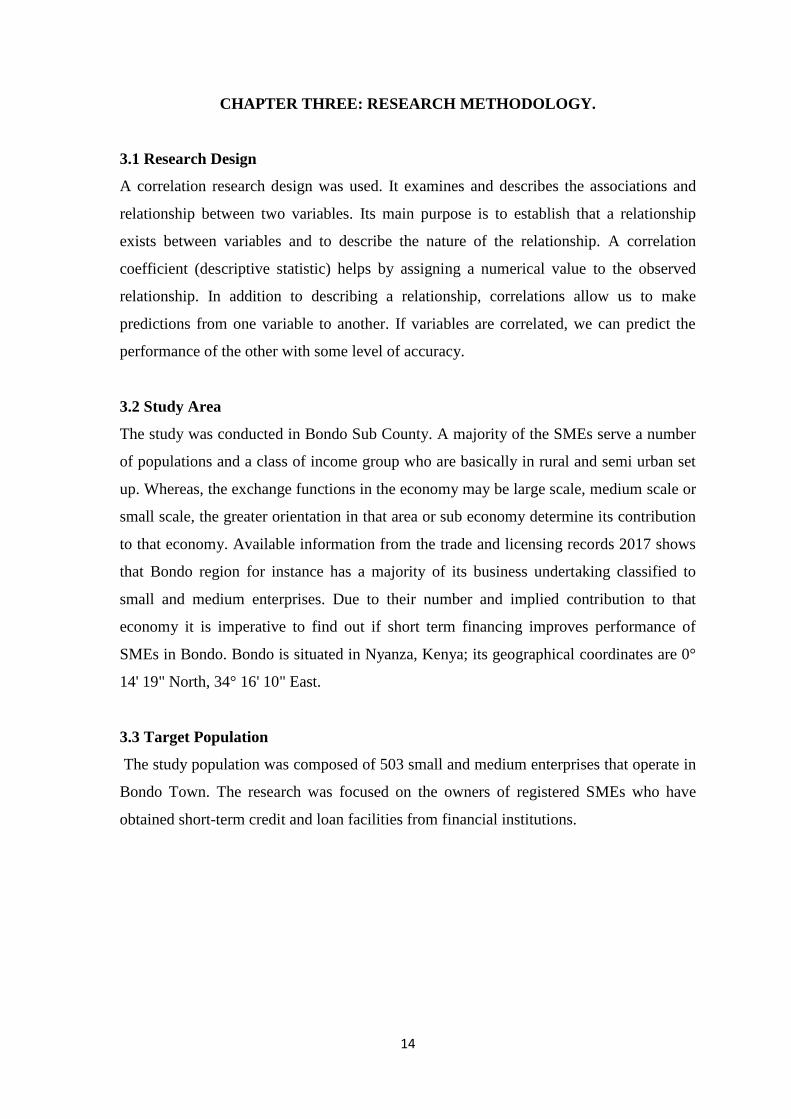
3.1 Research Design
A correlation research design was used. It examines and describes the associations and
relationship between two variables. Its main purpose is to establish that a relationship
exists between variables and to describe the nature of the relationship. A correlation
coefficient (descriptive statistic) helps by assigning a numerical value to the observed
relationship. In addition to describing a relationship, correlations allow us to make
predictions from one variable to another. If variables are correlated, we can predict the
performance of the other with some level of accuracy.
3.2 Study Area
The study was conducted in Bondo Sub County. A majority of the SMEs serve a number
of populations and a class of income group who are basically in rural and semi urban set
up. Whereas, the exchange functions in the economy may be large scale, medium scale or
small scale, the greater orientation in that area or sub economy determine its contribution
to that economy. Available information from the trade and licensing records 2017 shows
that Bondo region for instance has a majority of its business undertaking classified to
small and medium enterprises. Due to their number and implied contribution to that
economy it is imperative to find out if short term financing improves performance of
SMEs in Bondo. Bondo is situated in Nyanza, Kenya; its geographical coordinates are 0°
14' 19" North, 34° 16' 10" East.
3.3 Target Population
The study population was composed of 503 small and medium enterprises that operate in
Bondo Town. The research was focused on the owners of registered SMEs who have
obtained short-term credit and loan facilities from financial institutions.

15
Table 3.1: Target population
Types of businesses Target population Percentage %
Hard wares 28 6%
General shops 143 28%
Fish vendors 112 22%
Hotels 24 5%
Electronic shops 101 20%
Mpesa shops 95 19%
TOTAL 503 100%
Source: County Government of Siaya, 2017
3.4: Sample Methods and Sample Size
The sampling method used was a stratified random sample. It allows the researcher to
take into account the different subgroups of people in the population and helps guarantee
that the sample accurately represents the population on specific characteristics. This was
achieved by dividing the population into subsamples or strata. Using krejcie $ Morgan
sample size table 1970 and confidence level of 95% with margin of error of 5%., a total
of 400 owners of small and medium enterprises was sampled as shown on Table 3.2.
Table 3.2: Sample Size Distribution
Types of businesses Target population Sample size Percentage %
Hard wares 28 27 7%
General shops 143 103 25%
Fish vendors 112 86 22%
Hotels 24 24 6%
Electronic shops 101 80 20%
Mpesa shops 95 80 20%
TOTAL 503 400 100%
Source: County Government of Siaya, 2017
3.5: Data Collection Methods
The research used secondary data. The data was obtained from financial statements such
as balance sheet, inventory records among others using secondary data schedule.

16
3.5:1Reliability and Validity Test.
Mugenda and Mugenda, (2003) defines reliability as a measure of the degree to which
researcher's instruments yield consistent results of data after repeated trials. Developed
secondary data schedule was sent to some selected sample of the respondent from each
respondent and then the information acquired will be evaluated to assess their reliability.
The secondary data schedule was given out at random to respondents for pretesting
purposes. A pre-test was done on the secondary data schedule using a selected sample of
respondents and data acquired was evaluated to check on the reliability of the instrument.
The pilot study was done to pre-test the instruments of data collection. Validity refers to
the degree that an instrument actually measures what it is designed or intended to measure
Aila and Ombok, (2015). Construct validity refers to the extent to which a measured
variable measures the conceptual variable (that is, the construct) that it's designed to
assess. A measure only has construct validity if it measures what we want it to.
Table 3.3: Reliability Statistics
Cronbach's Alpha N of Items
.703 13
3.6: Data Analysis.
Collected data was analyzed using correlation and regression methods. Regression
analysis was used to find the relationship between the two variables. This model
represents the dependent variable as a function of one independent variable subject to a
random ,‟ error‟, which is assumed to have a constant value of zero (Cottrell, 2003). The
regression model used is shown below. The multiple linear regression models were used
to determine the relative importance (sensitivity) of each independent variable in
affecting the financial performance of SMEs.
y = α + β1 χ1 + β2 χ2 + … + Ɛ; Newell, Elmore & Walker (2012).
Where;
y – Financial Performance of the SMEs as measured by ROA

17
Return on assets (ROA) = [net income / total assets]
α – Constant Value
X1 – Short term loan.
X2 – Accounts payable
Ɛ – The error or disturbance term
3.7: Data Presentation
Analyzed data was presented by use of tables, pie charts and graphs using frequencies and
percentages for interpretation.
3.8: Research Ethics
This study acknowledged the importance of ethical issues in a research study and
therefore the researcher observed the ethical issues of honesty, confidentiality, integrity,
and respondents rights while handling and getting information from the sources. The
researcher ensured tolerance and patience throughout the research period. A letter from
the university was used to prove that the data acquired was meant for academic purpose
only.

18
CHAPTER FOUR: RESULTS AND DISCUSSION
4.1 Introduction
This chapter presents the results of the present study on the effect of short term debt
financing on financial performance of SMEs in Bondo Sub County in Kenya. The
presentation of the result has been done in two sections. These include demographic
information and financial performance of SMEs.
4.2 Demographic Results
4.2.1 Response Rate
There was 100% response rate of the targeted business managers. The research intended
to contact 400 managers / owners of SMEs which was actually achieved, which is in line
with mugenda and mugenda (2003), which state that a response of above 50% is
satisfactory to give reliable information.
4.2.2 Gender of Respondents
Table 4.1: Gender of Respondents
Gender of respondents Frequency Percent
Male 177 44.3
Female 223 55.8
Total 400 100.0
Source: Research data 2017
Table 4.1 presents the information on the gender of respondents, in order of frequency
and respective percentage scores. The results reveal that of all the respondents, 177 were
males, constituting 44.3%; while 223 of the study respondents were females, constituting
55.8%. This information reveals that majority of the Small and Medium Enterprises
(SMEs) in Bondo Sub County are managed by women. This information compares with
the global data on Small and Medium Enterprises (SMEs); where according to the Asia-
Pacific Economic Cooperation (APEC) (2016), while SMEs account for a large fraction
of all enterprises across APEC economies, on average, only 37% of SMEs are owned by
women. While international finance corporation (2014) estimate that globally there are
roughly 9.34 formal million women owned SMEs in over 140 assed countries, which is
approximately one third of all formal SMEs.
19
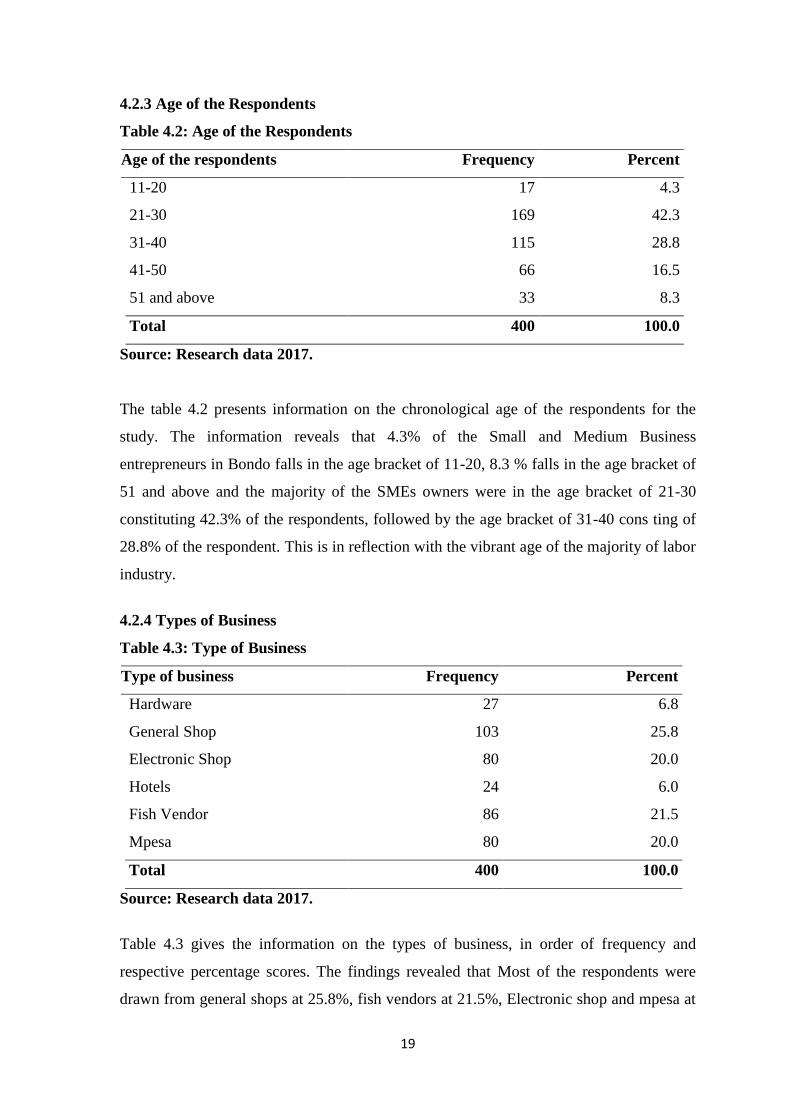
4.2.3 Age of the Respondents
Table 4.2: Age of the Respondents
Age of the respondents Frequency Percent
11-20 17 4.3
21-30 169 42.3
31-40 115 28.8
41-50 66 16.5
51 and above 33 8.3
Total 400 100.0
Source: Research data 2017.
The table 4.2 presents information on the chronological age of the respondents for the
study. The information reveals that 4.3% of the Small and Medium Business
entrepreneurs in Bondo falls in the age bracket of 11-20, 8.3 % falls in the age bracket of
51 and above and the majority of the SMEs owners were in the age bracket of 21-30
constituting 42.3% of the respondents, followed by the age bracket of 31-40 cons ting of
28.8% of the respondent. This is in reflection with the vibrant age of the majority of labor
industry.
4.2.4 Types of Business
Table 4.3: Type of Business
Type of business Frequency Percent
Hardware 27 6.8
General Shop 103 25.8
Electronic Shop 80 20.0
Hotels 24 6.0
Fish Vendor 86 21.5
Mpesa 80 20.0
Total 400 100.0
Source: Research data 2017.
Table 4.3 gives the information on the types of business, in order of frequency and
respective percentage scores. The findings revealed that Most of the respondents were
drawn from general shops at 25.8%, fish vendors at 21.5%, Electronic shop and mpesa at

20
20.0% Hardware at 6.8%, while the least at 6.0% drawn from Hotels industries. This
compares to the global trend which argues that most SMEs jobs are in the service sector,
which accounts for two thirds of economic activities and employment OECD countries.
These businesses includes wholesale and retail trade, the electronic shops, hotel and
restaurants among others, OECD policy brief of (2000).
4.2.5 Age of the Business
Table 4.4: Age of the Business
Age of business Statistic
Mean 6.1175
Minimum 1.00
Maximum 22.00
Range 21.00
Source: Research data 2017.
The oldest SME in Bondo had operated for 22 years while the new SME has been in
operation for 1 year. This gives a range of 21 years. The mean age of operation was
6.1175 years. This compares to what Mason (2009), state that small business
Administration (SBA) keeps the stats on business failures and claims that more than a
half of new business will disappear in the first five years.
4.3 Accounts payable on performance of SMEs.
4.3.1 Correlation between Accounts payable and Return on Asset
Table 4.5: Correlation between Accounts payable and Return on Asset
Accounts
payable
Return on Asset
Accounts payable
Pearson Correlation 1.000
Sig. (2-tailed)
N 400
Return on Asset
Pearson Correlation .223** 1.000
Sig. (2-tailed) .000
N 400 400
**. Correlation is significant at the 0.01 level (2-tailed).
Source: Research data 2017.
Correlation analysis was employed to establish the strength of relationship which exists
between accounts payable and return on assets. The result revealed a significant weak

21
positive relationship between accounts payable and return on asset, r=0.223p<0.001.This
meant that as Accounts payable increases, return on asset also increases. These findings
indicate that there is a relative support for the existence of a positive significant
relationship between accounts payable and return on assets. Sadiq (2017), studied the
impact of working capital management on SMEs performance in Nigeria, secondary data
was collected from financial report and using regression analysis the findings revealed
that accounts payable period, cash conversion cycle and net trading cycle has positive
effect on performance. Achode and Rotch (2016), studied the effects of account payable
as source of financing on performance of listed manufacturing firms at the Nairobi
securities Exchange, using census sampling technique and multiple regression model the
result showed that there is direct positive relationship between accounts payable and
performance of the firm. Madishetti and Kibona (2013) investigated the impact of
receivables and payables management on the profitability of SMEs in Tanzania, using
regression analysis, the result showed that positive relationship is observed between
average payment period and gross operating profit. Seyoum, Testay and Kassahun (2016),
examined working capital management and its impact on profitability : evidence from
food complex manufacturing firms in Addis Ababa, from 2009-2013, using descriptive
statistics and multiple regression analysis, findings show that average days in inventory,
have a significant impact on return on assets. Hassan (2016) examined the effect of trade
receivables and inventory management on SMEs performance in Malaysia. Secondary
data was collected from financial reports and using regression analysis the result revealed
that days account receivables and inventory turnover in days are negatively related to
SMEs profitability.
4.3.2 Correlation between Accounts Payable and ROE.
Table 4.6: Correlation between Accounts payable and ROE
Accounts payable ROE
Accounts payable
Pearson Correlation 1.000
Sig. (2-tailed)
N 400
ROE
Pearson Correlation .307** 1.000
Sig. (2-tailed) .000
N 400 400
**. Correlation is significant at the 0.01 level (2-tailed).
Source: Research data 2017.

22
A correlation analysis between accounts payable and return on equity revealed that there
was a significant moderate positive relationship between accounts payable and return on
equity, r=0.307p<0.001. This meant that as account payable increases, return on equity
also increases. But the available literature indicates that; Rizwan and Shah (2015),
studied the impact of working capital management on firms performance: A case of
textile spinning sector in Pakistan, using panel data with 10 companies as participants,
from 2008-2014 and spearman’s correlation and linear regression analysis, established
weak negative relationship between account receivable turnover, account payable
turnover with ROE and ROA. Awan, Shahid, Hassan and Ahmed (2014), studied the
impact of working capital management on profitability of cement sector in Pakistan,
secondary data was collected from financial reports with 10 cement companies
participating in the study from 2009-2013, using correlation coefficient and multiple
regression analysis, the finding showed that return on equity is negatively correlated with
the cash conversion cycle, current ratio and inventory turnover in days.
4.3.3 Correlation between Accounts payable and Net Profit Margin
Table 4.7: Correlation between Accounts Payable and Net Profit Margin
Accounts payable Net Profit Margin
Accounts payable
Pearson Correlation 1.000
Sig. (2-tailed)
N 400
Net Profit Margin
Pearson Correlation -.624** 1.000
Sig. (2-tailed) .000
N 400 400
**. Correlation is significant at the 0.01 level (2-tailed).
Source : Research data 2017
It was established that there was a significant moderate negative correlation between
Accounts payable and Net Profit Margin, r= -0.624 p<0.001.This meant that when
accounts payable increase then the net profit margin also decreases. Kapkiyai & Mugo
(2015) examined the effect of trade credit on financial performance of small and medium
enterprises: evidence of Eldoret town, Kenya. 50 SMEs were used as participants and
documentary guide was used to collect secondary data. Both correlation and regression
was used to analyze the date. Findings showed that trade credit positively affected
liquidity, profit margin and return on assets.

23
4.4 Regression Analysis
Table 4.8: Regression Analysis
Model Unstandardize
d Coefficients
Standardize
d
Coefficients
t Sig. 95.0%
Confidence
Interval for B
Collinearit
y Statistics
B SE Beta Lower
Bound
Upper
Bound
Tole
ranc
e
VIF
(Constant) .384 .030 12.603 .000 .324 .444
Short term
loan
2.268 .000 .743 20.015 .000 .000 .000 .866 1.15
5
Accounts
payable
2.347 .000 .495 13.351 .000 .000 .000 .866 1.15
5
a. Dependent Variable: Return on Asset
Source: Research data 2017.
y = α + β1 χ1 + β2 χ2 + … + Ɛ; Newell, Elmore & Walker (2012).
Substitutes
y = 0.384 + 2.268 χ1 + 2.347 χ2 + 0.030
Holding other factors constant; if short term loan increases by one unit the firms
performance will go up by 2.268 units.
Holding other factors constant; if accounts payable increases by one unit the firms
performance will go up by2.347
4.5 Short Term Loans on Performance of SMEs.
4.5.1Correlation between Short-term Loan and Return on Assets
Table 4.9: Correlation between Short-Term Loan and Return on Assets
Short term loan Return on Asset
Short term loan
Pearson Correlation 1.000
Sig. (2-tailed)
N 400 400
Return on Asset
Pearson Correlation .561** 1.000
Sig. (2-tailed) .000
N 400 400
**. Correlation is significant at the 0.01 level (2-tailed).
Source: Research data 2017.

24
A correlation analysis between short term loan and return on assets indicates that there
was a significant moderate positive relationship between short-term loan and return on
asset, r=0.561 p<0.001. This meant that as short-term loan increases, return on asset also
increases. This finding is in line with the work of other scholars such as; Kyule and Ngugi
(2014). Looked at the Influence of capital structure on leverage of small and medium size
enterprises in Kenya, Using descriptive survey design and regression analysis model with
430 SMEs participating in the survey, established that there is positive relationship
between the level of leverage and the firms size. Yuba and Zubairu (2015), looking at the
impact of banking sector credit on the growth of small and medium enterprises in Nigeria.
Using time series design and both descriptive and correlation matrix analysis, established
that banking sector has significant impact on the growth of small and medium enterprises
since it has a positive impact on inflation, exchange rate and trade debt. Abor (2005)
studied the effect of capital structure on profitability of listed firms on Ghana stock
exchange, using panel data and regression analysis. The result showed a significantly
positive relation between the ratio of short term debt to total assets and ROE. However, a
negative relationship between the ratio of long term debt to total assets and ROE was
found. While, Asare and Angmor (2015), investigated the effect of debt financing on the
profitability of SMEs in Accra metropolis, using secondary data from 50 SMEs from
2004-2013 and panel research design and multiple regression analysis, the result showed
that short term loan ratio have a significant negative relationship with both profit margin
ratio and return on assets. It also revealed a positive insignificant relation between long
term loan ratio and profit margin but an insignificant negative relation was established
with return on assets.
4.5.2 Correlation between Short-term loan and Return on Equity.
Table 4.10: Correlation between Short-term loan and Return on Equity
Short term loan ROE
Short term loan
Pearson Correlation 1.000
Sig. (2-tailed)
N 400
ROE
Pearson Correlation -.694** 1.000
Sig. (2-tailed) .000
N 400 400
**. Correlation is significant at the 0.01 level (2-tailed).
25
There was a significant moderate negative relationship between short-term loan and
return on equity r=-0.694 p<0.001.This meant that as short-term loan increases, return on
equity decreases.
4.5.3 Correlation between Short-term loan and Net Profit Margin.
Table 4.11: Correlation between Short-term loan and Net Profit Margin
Short term loan Net Profit Margin
Short term loan
Pearson Correlation 1.000
Sig. (2-tailed)
N 400
Net Profit Margin
Pearson Correlation .186** 1.000
Sig. (2-tailed) .000
N 400 400
**. Correlation is significant at the 0.01 level (2-tailed).
Source: Research data 2017.
The correlation analysis between short term loan and net profit revealed that there was a
significant weak positive relationship between short-term loan and net profit margin,
r=0.186 p<0.001.This meant that as short-term loan increases, Net Profit Margin also
increases. But the available data from different scholars indicates that; Dube (2013)
studied the impact of debt financing on productivity of SMEs: A case study of SMEs in
Masvingo urban. Using a sample of 80 SMEs and secondary data from the financial
reports with correlation and regression analysis, the findings showed that debt finance had
a positive impact on productivity of SMEs. A lagathurai (2013) examined capital
structure and financial performance: A study of listed trading companies in Srilanka. The
findings revealed that debt ratio is negatively correlated with net profit, return on equity
and earnings per share. Asare and Angmor (2015), investigated the effect of debt
financing on the profitability of SMEs in Accra metropolis, using secondary data from 50
SMEs from 2004-2013 and panel research design and multiple regression analysis, the
result showed that short term loan ratio have a significant negative relationship with both
profit margin ratio and return on assets. It also revealed a positive insignificant relation
between long term loan ratio and profit margin but an insignificant negative relation was
established with return on assets.

26
4.6 Regression Analysis.
Table 4.12: Regression Analysis
Model Unstandardize
d Coefficients
Standardize
d
Coefficients
t Sig. 95.0%
Confidence
Interval for B
Collinearity
Statistics
B SE Beta Lower
Bound
Upper
Bound
Tole
ranc
e
VIF
(Constant) .384 .030 12.603 .000 .324 .444
Short term
loan
2.268 .000 .743 20.015 .000 .000 .000 .866 1.155
Accounts
payable
2.347 .000 .495 13.351 .000 .000 .000 .866 1.155
a. Dependent Variable: Return on Asset
Source: Research data 2017.
y = α + β1 χ1 + β2 χ2 + … + Ɛ; Newell, Elmore & Walker (2012).
Substitutes
y = 0.384 + 2.268 χ1 + 2.347 χ2 + 0.030
Holding other factors constant; if short term loan increases by one unit the firms
performance will go up by 2.268 units.
Holding other factors constant; if accounts payable increases by one unit the firms
performance will go up by2.347.
4.7 Hypothesis Testing
H01: Account payable has no significant effect on financial performance of Small and
medium enterprises
The p-value p<0.001, CI=95%, we therefore reject the H01 that account payable has no
significant effect on financial performance of Small and medium enterprises. We adopt
the H1 that account payable has a significant effect on financial performance of Small and
medium enterprises.
27
ANOVA
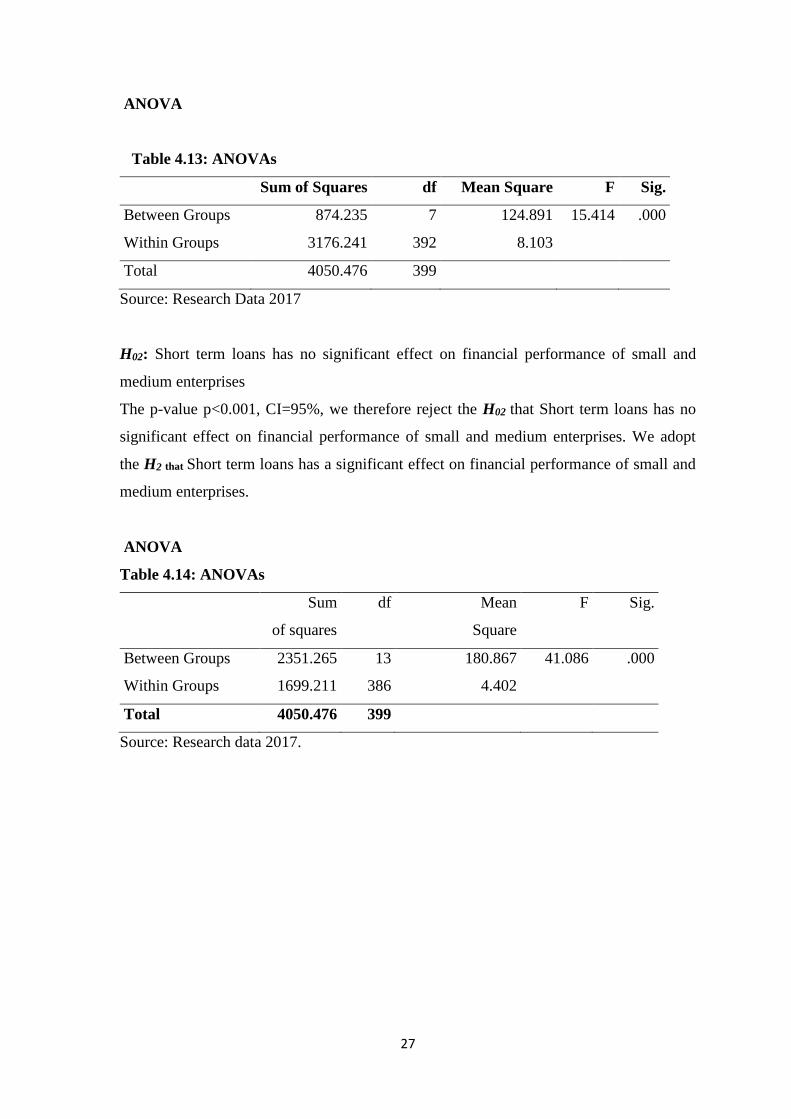
Table 4.13: ANOVAs
Sum of Squares df Mean Square F Sig.
Between Groups 874.235 7 124.891 15.414 .000
Within Groups 3176.241 392 8.103
Total 4050.476 399
Source: Research Data 2017
H02: Short term loans has no significant effect on financial performance of small and
medium enterprises
The p-value p<0.001, CI=95%, we therefore reject the H02 that Short term loans has no
significant effect on financial performance of small and medium enterprises. We adopt
the H2 that Short term loans has a significant effect on financial performance of small and
medium enterprises.
ANOVA
Table 4.14: ANOVAs
Sum
of squares
df Mean
Square
F Sig.
Between Groups 2351.265 13 180.867 41.086 .000
Within Groups 1699.211 386 4.402
Total 4050.476 399
Source: Research data 2017.

28
CHAPTER FIVE
SUMMARY, CONCLUSION AND RECOMMENDATION.
5.1 Introduction
This chapter presented the summary of key findings, which were set out in order with the
study objectives. The objective of the study was: to determine the effect of short term
debt financing on financial performance of SMEs in Bondo sub county.
5.2 Summary
The study established that financial performance of SMEs in Bondo as presented by ROA
showed a significant weak positive relationship with accounts payable. While, it indicates
a significant moderate positive relationship with ROE, it also shows that account payable
has a moderate negative correlation with net profit margin. Over ally, the study showed
that as accounts payable increases the performance of SMEs also increases.
Whereas, short term loan showed a significant moderate positive relationship with ROA,
it indicates a significant moderate negative relationship with ROE and a significant weak
positive relationship with net profit margin. But the study established that as the short
term loan increases the performance of SMEs also increases.
5.3 Conclusion
In light of the findings, the study concludes that accounts payable and short term loans are
important in explaining financial performance of SMEs in Bondo Sub County because
there is significant association between accounts payable, short term loan and financial
performance of SMEs.
Therefore, short term debt financing has a potential of assisting SMEs to boast their
performance since short term debt financing are not open to fluctuations that is economic
conditions that changes the cost of borrowing adversely.
5.4 Recommendation
This research study has revealed that short term debt financing plays a significant role in
financial performance of SMEs. Therefore, SMEs should be encouraged that short term
loans are progressive and are good in enhancing performance of their enterprises. The

29
financial institutions should also be encouraged to advance short term loans to SMEs at
affordable rates to encourage many SMEs to seek for loans.
5.5 Limitations of the Study
A majority of the SMEs are keeping incomplete records and therefore more time
consuming in analyzing the information and some managers were relying on their
memory for certain information. There was also a challenge of financial mix that is the
managers are not able to separate their funds and the business funds.
5.6 Suggestions for Further Research
The researcher suggests that similar study should be done in other regions of the county
for comparison purposes. The study should also be conducted in larger firms /
organizations to allow for generalization of findings.

30
REFERENCES
Abdus, S. (2013). Effects of lease finance on performance of SMEs in Bangladesh.
International Journal of Science and Research, 2 (12), 2319-7064.
Abor, J. (2005). Effects of Capital Structure on Profitability: Empirical analysis of listed
firms in Ghana. Journal of Risk Finance, 6, 438-445.
Achode, M & Rotich, G. (2016. Effects of account payable as source of financing on
performance of listed manufacturing firms at the Nairobi securities Exchange.
International Journal of Research studies in Agricultural Science, 2(4), 24-
32.
Aila F.O. & Ombok B.O.(2015).Validating measures in business research: Practical
implication. International Journal of Science and Engineering, 1 (9).
Alagathurai, J. (2013). Capital structure and financial performance: A study of listed
Trading companies in Srilanka. An International Multidisciplinary Research
Journal, 3(6) 1-13.
Aravid, M. (2016). Influence of working capital metrics on profitability: A critical
examination on Indian manufacturing sector. Kelaniya Journal of
Management,5(1), 58-80
Asare, C. & Angmor, P. L. (2015). The effect of debt financing on profitability of SMEs
in Accra metropolis. ADRRI Journals of Art and Social Sciences, Ghana.13 (2),
1-11.
Ashok, K. & Mishra, C. W. (2009). Factors affecting financial performance of new and
beginning Farmers. Financial Agricultural Review, 69 (2), 160 -179.
Awan, G. Shahid, P., Hassan, J. & Ahmed, W. (2014). Impact of working capital
management on profitability of cement sector in Pakistan. International
Journal of Business and Management Review, 2 (4), 1-20.
Ayuba, B. &Zubairu, M. (2015). Impact of banking sector credit on the growth of small
and medium enterprises in Nigeri. Journal of Resource Development and
Management, 15(1), 2422-8397.
Ayyagari, M., Beck, T. & Demirgüç-Kunt, A. (2007). Small and Medium Enterprises
across the Globe. Small Business Economics, 29. 415-434.
Bello, U., Ahmed, S. & Aliyu, A. (2016). The impact of lease financing on financial
performance of Nigeria oil and gas industry. Research Journal of Finance and
Accounting, 7 (4), 2222-2847.

31
Brumbach, G.B. (1998). Some Ideas, Issues and Predictions about Performance
Management, Public Personnel Management. Winter: 387-402
Crabtree, A.D. & Debusk, G. K. (2008) the effect of adopting the balanced scorecard on
shareholder returns. Advances in Accounting, 24. (1), 8-15.
Damodaran, A. (1999). Applied Corporate Finance. New York: John Wiley and Sons.
Dube, H. (2013), Impact of debt financing on productivity of small and medium scale
enterprises: A case study of SMEs in Masvingo urban. International Journal of
Economics, Business and Finance, 1 (10). 371-381.
Fama, E.F. & French, K.R. (2002). Testing trade off and pecking order predictions about
dividends and debt. Review of Financial studies, 15 (1), 1-33.
Githaiga, P. &Kabiru, C. (2015), Debt Financing Performance of SMES: Evidence from
Kenyan Journal of Economics, Finance, and Accounting, 2(3), 475.
Githire, C. &Muturi, W. (2015). Effect of capital structure on financial performance of
firms in Kenya: Evidence from firms listed at the Nairobi securities exchange.
International Journal of Economics, Commerce and Management, 3 (4).
Guin, L. (2011). “Matching Principle,” Murray State University, Tutorial, 2011.
Hammes, K. (2003). Firm performance, Debt, trade credit and bank loans. Gothenburg:
Gothenburg University.
Hassan, G.A (2016). Effect of trade receivables and inventory management on SMEs
performance in Malaysia. British Journal of Economic, Management and
Trade, 12(4) 1-8.
Ikechukwu, O. & Nwakaego, A. (2015). The effect of accounts payable ratio on financial
performance of food & beverages manufacturing companies in Nigeria.
Journal of Research in Business & Management ,3 (9) 15-21.
Kariuki, C.M. & Ngugi P.K. (2014). The effect of table banking on the performance of
micro and small enterprises in Nairobi County. International Journal of
Current Business and Social Science, 1(2), 339-360.
Kyule, M. C.& Ngugi, K.(2014). Influence of capital structure on leverage of small and
medium size enterprise in Kenya. European Journal of Business
Management, 1 (11), 1-22.
Lebans, M. & Euske, K. (2007). “A conceptual and operational delineation of
performance. Business performance measurement: unifying theories and
integration practice. 123-139.

32
Madishetti, S. & Kibona, D. (2013). Impact of receivables and payables management on
the profitability of SMEs in Tanzania. Journal of Economics and
Management, 2 (3), 9-21.
Mwangi, L.W., Makau, S.M. & Kosimbei, G. (2014). Relationship between capital
structure and performance of non-financial companies listed in the Nairobi
securities exchange, Kenya. Global Journal of Contemporary Research in
Accounting, Auditing & Business Ethics, 1(2), 72-90.
Mwangi, M. & Birundu, E. M. (2015). The effect of capital structure on the financial
performance of small and medium enterprises in Thika sub –county, Kenya.
International Journal of Humanities and Social Science, 5 (1), 151-156.
Myers, S.C. (1984) . Capital structure puzzle. Journal of Finance, 39(1), 575-592.
O’Brien, J. & David, P. (2010). Firm growth and type of debt: the paradox of discretion,
Industrial & Corporate Change, 19 (1), 51-80.57.
Rajan, R. G. & Zingales, L. (1995). What do we know about Capital Structure: Some
Evidence from International Data? Journal of Finance, 1421-1446.
Riawan, S. & Shah, F. (2015). Impact of working capital management on firms
performance: A case of textile spinning sector in Pakistan. International
Journal of Scientific & Engineering Research, 6 (11), 2229-5518.
Sadiq, R. (2017). Impact of working capital management on small and medium
enterprises performance in Nigeria. Arabian Journal of Business and
Management Review, 7(1) 1-5
Seyoum, A., Testay, T. & Kassahun, T. (2016). International Journal of Scientific &
research publications, 6 (6), 2250-3153.
Siminica, M. (2010). Financial diagnosis. Sitech publishing house Craiova.
Wafula, S., Namusonge, S. & Nambuswa, E. (2016). Effect of lease on the financial
performance of the county government of Trans Nzoia. International Journal
of Scientific and research publications,6 (9), 624-631
Wanambisi, A.N. & Bwisa, H. M. (2013). Effects of microfinance lending on business
performance: A survey of micro and small enterprises in Kitale municipality,
Kenya. International Journal of Academic Research in Business and Social
Sciences, 3 (7), 56-67.

33
APPENDICES
Appendix I: Secondary Data Schedule
Instructions:
Kindly fill in the questionnaire where necessary
The information will used for academic purposes only and will be treated with
confidentiality
SECTION A: Demographic information
1. Gender
Male ( ) Female: ( )
2. Age:
Between 11-20( )
Between 21-30 ( )
Between 31-40 ( )
Between 41-50 ( )
51 and above ( )
3. Type of Business
General shop ( )
Mpesa ( )
Hardware ( )
Hotels ( )
Fish vendors ( )
4. Age of Business
SECTION B: Loan able status/Credit position
5. Frequency of loan receipt annually
Year Response Yes or No
Yes No
1 2015
2 2016
3 2017
Total

34
6. Annual credit volume
From the following credit ranges indicate your credit volume as offered by your lender
financial institution
Year R1
2015
2016
2017
7. Repayment Status
State the repayment status of the received credits
Year of issue Enquiry Response Frequency
2015 FR in Year of issue
PR in Year of issue
FR in 2nd Year of issue
Unpaid
2016 FR in Year of issue
PR in Year of issue
FR in 2nd Year of issue
Unpaid
2017 FR in Year of issue
PR in Year of issue
FR in 2nd Year of issue
Unpaid
SECTION C: Financial Performance of SMEs
The following table presents Secondary data schedule with respect to financial indicator
of the SMEs
Year Profit margin Return on Asset Return on Equity
2015
2016
2017

35
Appendix II: Raw Data
SHORT TERM LOAN
ACC. PAYABLE
NET INCOME
AVERAGE ASSET ROA ROE EXPENSES
NET PROFIT
NET PROFIT MARGIN
13000 11000 210000 220243.9 0.95 16.15 3850 206150 0.98
17000 11000 135000 145125 0.93 7.94 3850 131150 0.97
11000 13000 210000 215000 0.98 19.09 4550 205450 0.98
17000 12000 180000 168260.87 1.07 10.59 4200 175800 0.98
17000 12000 195000 186333.33 1.05 11.47 4200 190800 0.98
16000 12000 210000 200666.67 1.05 13.13 4200 205800 0.98
12000 12000 150000 169736.84 0.88 12.5 4200 145800 0.97
16000 11000 285000 272333.33 1.05 17.81 3850 281150 0.99
16000 10000 195000 195000 1 12.19 3500 191500 0.98
15000 11000 210000 205227.27 1.02 14 3850 206150 0.98
16000 12000 195000 190568.18 1.02 12.19 4200 190800 0.98
14000 12000 150000 161250 0.93 10.71 4200 145800 0.97
10000 11000 195000 226621.62 0.86 19.5 3850 191150 0.98
16000 12000 195000 190568.18 1.02 12.19 4200 190800 0.98
15000 10000 210000 215000 0.98 14 3500 206500 0.98
12000 11000 330000 337857.14 0.98 27.5 3850 326150 0.99
15000 12000 315000 294456.52 1.07 21 4200 310800 0.99
14000 12000 195000 182282.61 1.07 13.93 4200 190800 0.98
19000 10000 210000 196304.35 1.07 11.05 3500 206500 0.98
15000 10000 195000 209625 0.93 13 3500 191500 0.98
13000 10000 210000 215000 0.98 16.15 3500 206500 0.98
12000 11000 195000 220657.89 0.88 16.25 3850 191150 0.98
12000 10000 210000 205227.27 1.02 17.5 3500 206500 0.98
17000 10000 195000 195000 1 11.47 3500 191500 0.98
17000 9000 180000 188780.49 0.95 10.59 3150 176850 0.98
16000 10000 105000 125416.67 0.84 6.56 3500 101500 0.97
16000 10000 105000 125416.67 0.84 6.56 3500 101500 0.97
18000 9000 150000 161250 0.93 8.33 3150 146850 0.98
15000 11000 180000 184285.71 0.98 12 3850 176150 0.98
17000 9000 165000 173048.78 0.95 9.71 3150 161850 0.98
19000 10000 120000 125853.66 0.95 6.32 3500 116500 0.97
18000 9000 165000 154239.13 1.07 9.17 3150 161850 0.98
20000 7000 165000 168928.57 0.98 8.25 2450 162550 0.99
17000 10000 165000 168928.57 0.98 9.71 3500 161500 0.98
20000 11000 210000 188125 1.12 10.5 3850 206150 0.98
17000 10000 165000 157666.67 1.05 9.71 3500 161500 0.98
16000 13000 165000 165000 1 10.31 4550 160450 0.97
13000 10000 150000 179166.67 0.84 11.54 3500 146500 0.98
14000 10000 165000 177375 0.93 11.79 3500 161500 0.98
15000 10000 150000 169736.84 0.88 10 3500 146500 0.98
16000 8000 135000 145125 0.93 8.44 2800 132200 0.98

36
17000 10000 165000 173048.78 0.95 9.71 3500 161500 0.98
14000 12000 180000 184285.71 0.98 12.86 4200 175800 0.98
16000 11000 165000 168928.57 0.98 10.31 3850 161150 0.98
17000 12000 195000 171122.45 1.14 11.47 4200 190800 0.98
19000 10000 150000 146590.91 1.02 7.89 3500 146500 0.98
16000 10000 120000 139459.46 0.86 7.5 3500 116500 0.97
16000 10000 180000 180000 1 11.25 3500 176500 0.98
22000 12000 180000 157959.18 1.14 8.18 4200 175800 0.98
18000 12000 180000 168260.87 1.07 10 4200 175800 0.98
18000 12000 180000 164680.85 1.09 10 4200 175800 0.98
16000 12000 180000 172000 1.05 11.25 4200 175800 0.98
16000 12000 180000 172000 1.05 11.25 4200 175800 0.98
20000 12000 180000 164680.85 1.09 9 4200 175800 0.98
18000 12000 180000 154800 1.16 10 4200 175800 0.98
14000 12000 180000 180000 1 12.86 4200 175800 0.98
14000 12000 180000 164680.85 1.09 12.86 4200 175800 0.98
16000 12000 180000 175909.09 1.02 11.25 4200 175800 0.98
18000 8000 180000 184285.71 0.98 10 2800 177200 0.98
16000 10000 180000 184285.71 0.98 11.25 3500 176500 0.98
18000 10000 180000 180000 1 10 3500 176500 0.98
18000 10000 180000 180000 1 10 3500 176500 0.98
14000 12000 180000 188780.49 0.95 12.86 4200 175800 0.98
18000 10000 180000 180000 1 10 3500 176500 0.98
16000 10000 180000 184285.71 0.98 11.25 3500 176500 0.98
16000 10000 180000 180000 1 11.25 3500 176500 0.98
15000 12000 180000 175909.09 1.02 12 4200 175800 0.98
12000 10000 180000 184285.71 0.98 15 3500 176500 0.98
15000 10000 180000 198461.54 0.91 12 3500 176500 0.98
16000 10000 180000 184285.71 0.98 11.25 3500 176500 0.98
20000 7000 180000 164680.85 1.09 9 2450 177550 0.99
20000 8000 180000 180000 1 9 2800 177200 0.98
20000 7000 180000 180000 1 9 2450 177550 0.99
18000 8000 180000 184285.71 0.98 10 2800 177200 0.98
20000 7000 180000 175909.09 1.02 9 2450 177550 0.99
22000 6000 180000 172000 1.05 8.18 2100 177900 0.99
18000 7000 180000 184285.71 0.98 10 2450 177550 0.99
22000 8000 180000 168260.87 1.07 8.18 2800 177200 0.98
18000 8000 180000 168260.87 1.07 10 2800 177200 0.98
20000 8000 180000 172000 1.05 9 2800 177200 0.98
22000 7000 180000 168260.87 1.07 8.18 2450 177550 0.99
18000 8000 180000 184285.71 0.98 10 2800 177200 0.98
20000 7000 180000 161250 1.12 9 2450 177550 0.99
18000 8000 180000 184285.71 0.98 10 2800 177200 0.98
15000 10000 180000 172000 1.05 12 3500 176500 0.98
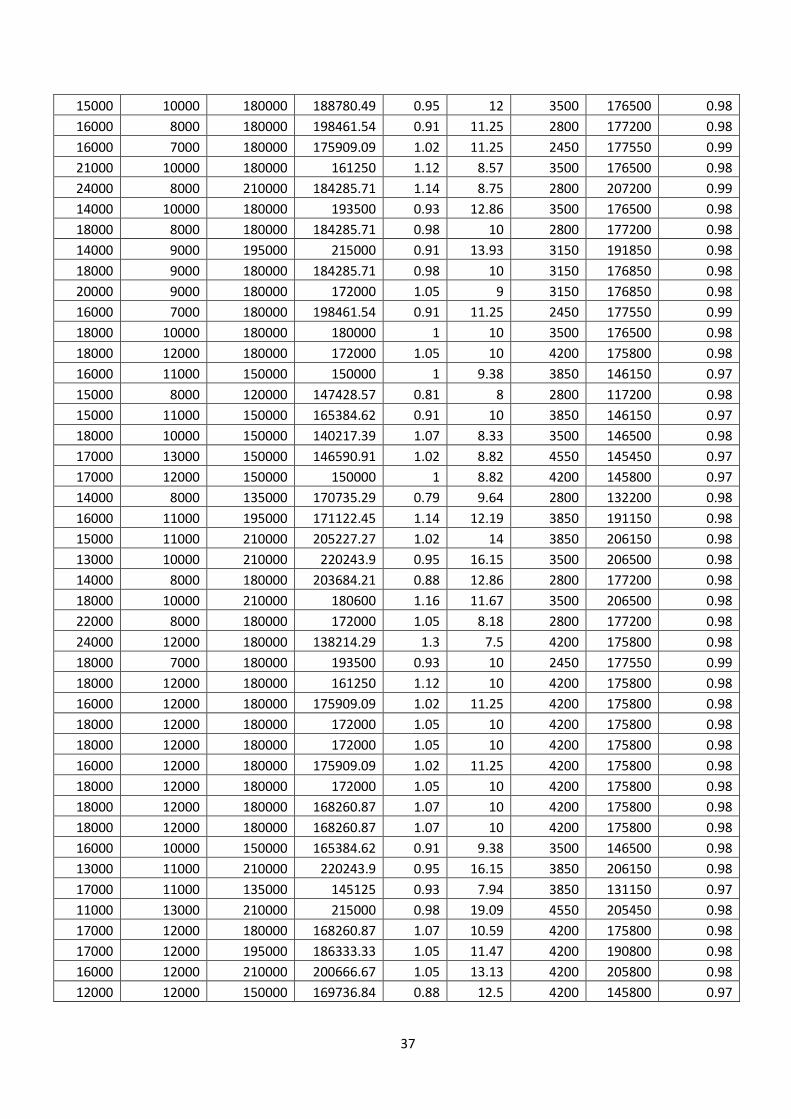
37
15000 10000 180000 188780.49 0.95 12 3500 176500 0.98
16000 8000 180000 198461.54 0.91 11.25 2800 177200 0.98
16000 7000 180000 175909.09 1.02 11.25 2450 177550 0.99
21000 10000 180000 161250 1.12 8.57 3500 176500 0.98
24000 8000 210000 184285.71 1.14 8.75 2800 207200 0.99
14000 10000 180000 193500 0.93 12.86 3500 176500 0.98
18000 8000 180000 184285.71 0.98 10 2800 177200 0.98
14000 9000 195000 215000 0.91 13.93 3150 191850 0.98
18000 9000 180000 184285.71 0.98 10 3150 176850 0.98
20000 9000 180000 172000 1.05 9 3150 176850 0.98
16000 7000 180000 198461.54 0.91 11.25 2450 177550 0.99
18000 10000 180000 180000 1 10 3500 176500 0.98
18000 12000 180000 172000 1.05 10 4200 175800 0.98
16000 11000 150000 150000 1 9.38 3850 146150 0.97
15000 8000 120000 147428.57 0.81 8 2800 117200 0.98
15000 11000 150000 165384.62 0.91 10 3850 146150 0.97
18000 10000 150000 140217.39 1.07 8.33 3500 146500 0.98
17000 13000 150000 146590.91 1.02 8.82 4550 145450 0.97
17000 12000 150000 150000 1 8.82 4200 145800 0.97
14000 8000 135000 170735.29 0.79 9.64 2800 132200 0.98
16000 11000 195000 171122.45 1.14 12.19 3850 191150 0.98
15000 11000 210000 205227.27 1.02 14 3850 206150 0.98
13000 10000 210000 220243.9 0.95 16.15 3500 206500 0.98
14000 8000 180000 203684.21 0.88 12.86 2800 177200 0.98
18000 10000 210000 180600 1.16 11.67 3500 206500 0.98
22000 8000 180000 172000 1.05 8.18 2800 177200 0.98
24000 12000 180000 138214.29 1.3 7.5 4200 175800 0.98
18000 7000 180000 193500 0.93 10 2450 177550 0.99
18000 12000 180000 161250 1.12 10 4200 175800 0.98
16000 12000 180000 175909.09 1.02 11.25 4200 175800 0.98
18000 12000 180000 172000 1.05 10 4200 175800 0.98
18000 12000 180000 172000 1.05 10 4200 175800 0.98
16000 12000 180000 175909.09 1.02 11.25 4200 175800 0.98
18000 12000 180000 172000 1.05 10 4200 175800 0.98
18000 12000 180000 168260.87 1.07 10 4200 175800 0.98
18000 12000 180000 168260.87 1.07 10 4200 175800 0.98
16000 10000 150000 165384.62 0.91 9.38 3500 146500 0.98
13000 11000 210000 220243.9 0.95 16.15 3850 206150 0.98
17000 11000 135000 145125 0.93 7.94 3850 131150 0.97
11000 13000 210000 215000 0.98 19.09 4550 205450 0.98
17000 12000 180000 168260.87 1.07 10.59 4200 175800 0.98
17000 12000 195000 186333.33 1.05 11.47 4200 190800 0.98
16000 12000 210000 200666.67 1.05 13.13 4200 205800 0.98
12000 12000 150000 169736.84 0.88 12.5 4200 145800 0.97

38
16000 11000 285000 272333.33 1.05 17.81 3850 281150 0.99
16000 10000 195000 195000 1 12.19 3500 191500 0.98
15000 11000 210000 205227.27 1.02 14 3850 206150 0.98
16000 12000 195000 190568.18 1.02 12.19 4200 190800 0.98
14000 12000 150000 161250 0.93 10.71 4200 145800 0.97
10000 11000 195000 226621.62 0.86 19.5 3850 191150 0.98
16000 12000 195000 190568.18 1.02 12.19 4200 190800 0.98
15000 10000 210000 215000 0.98 14 3500 206500 0.98
12000 11000 330000 337857.14 0.98 27.5 3850 326150 0.99
15000 12000 315000 294456.52 1.07 21 4200 310800 0.99
14000 12000 195000 182282.61 1.07 13.93 4200 190800 0.98
19000 10000 210000 196304.35 1.07 11.05 3500 206500 0.98
15000 10000 195000 209625 0.93 13 3500 191500 0.98
13000 10000 210000 215000 0.98 16.15 3500 206500 0.98
12000 11000 195000 220657.89 0.88 16.25 3850 191150 0.98
12000 10000 210000 205227.27 1.02 17.5 3500 206500 0.98
17000 10000 195000 195000 1 11.47 3500 191500 0.98
17000 9000 180000 188780.49 0.95 10.59 3150 176850 0.98
16000 10000 105000 125416.67 0.84 6.56 3500 101500 0.97
16000 10000 105000 125416.67 0.84 6.56 3500 101500 0.97
18000 9000 150000 161250 0.93 8.33 3150 146850 0.98
15000 11000 180000 184285.71 0.98 12 3850 176150 0.98
17000 9000 165000 173048.78 0.95 9.71 3150 161850 0.98
19000 10000 120000 125853.66 0.95 6.32 3500 116500 0.97
18000 9000 165000 154239.13 1.07 9.17 3150 161850 0.98
20000 7000 165000 168928.57 0.98 8.25 2450 162550 0.99
17000 10000 165000 168928.57 0.98 9.71 3500 161500 0.98
20000 11000 210000 188125 1.12 10.5 3850 206150 0.98
17000 10000 165000 157666.67 1.05 9.71 3500 161500 0.98
16000 13000 165000 165000 1 10.31 4550 160450 0.97
13000 10000 150000 179166.67 0.84 11.54 3500 146500 0.98
14000 10000 165000 177375 0.93 11.79 3500 161500 0.98
15000 10000 150000 169736.84 0.88 10 3500 146500 0.98
16000 8000 135000 145125 0.93 8.44 2800 132200 0.98
17000 10000 165000 173048.78 0.95 9.71 3500 161500 0.98
14000 12000 180000 184285.71 0.98 12.86 4200 175800 0.98
16000 11000 165000 168928.57 0.98 10.31 3850 161150 0.98
17000 12000 195000 171122.45 1.14 11.47 4200 190800 0.98
19000 10000 150000 146590.91 1.02 7.89 3500 146500 0.98
16000 10000 120000 139459.46 0.86 7.5 3500 116500 0.97
16000 10000 180000 180000 1 11.25 3500 176500 0.98
22000 12000 180000 157959.18 1.14 8.18 4200 175800 0.98
18000 12000 180000 168260.87 1.07 10 4200 175800 0.98
18000 12000 180000 164680.85 1.09 10 4200 175800 0.98

39
16000 12000 180000 172000 1.05 11.25 4200 175800 0.98
16000 12000 180000 172000 1.05 11.25 4200 175800 0.98
20000 12000 180000 164680.85 1.09 9 4200 175800 0.98
18000 12000 180000 154800 1.16 10 4200 175800 0.98
14000 12000 180000 180000 1 12.86 4200 175800 0.98
14000 12000 180000 164680.85 1.09 12.86 4200 175800 0.98
16000 12000 180000 175909.09 1.02 11.25 4200 175800 0.98
18000 8000 180000 184285.71 0.98 10 2800 177200 0.98
16000 10000 180000 184285.71 0.98 11.25 3500 176500 0.98
18000 10000 180000 180000 1 10 3500 176500 0.98
18000 10000 180000 180000 1 10 3500 176500 0.98
14000 12000 180000 188780.49 0.95 12.86 4200 175800 0.98
18000 10000 180000 180000 1 10 3500 176500 0.98
16000 10000 180000 184285.71 0.98 11.25 3500 176500 0.98
16000 10000 180000 180000 1 11.25 3500 176500 0.98
15000 12000 180000 175909.09 1.02 12 4200 175800 0.98
12000 10000 180000 184285.71 0.98 15 3500 176500 0.98
15000 10000 180000 198461.54 0.91 12 3500 176500 0.98
16000 10000 180000 184285.71 0.98 11.25 3500 176500 0.98
20000 7000 180000 164680.85 1.09 9 2450 177550 0.99
20000 8000 180000 180000 1 9 2800 177200 0.98
20000 7000 180000 180000 1 9 2450 177550 0.99
18000 8000 180000 184285.71 0.98 10 2800 177200 0.98
20000 7000 180000 175909.09 1.02 9 2450 177550 0.99
22000 6000 180000 172000 1.05 8.18 2100 177900 0.99
18000 7000 180000 184285.71 0.98 10 2450 177550 0.99
22000 8000 180000 168260.87 1.07 8.18 2800 177200 0.98
18000 8000 180000 168260.87 1.07 10 2800 177200 0.98
20000 8000 180000 172000 1.05 9 2800 177200 0.98
22000 7000 180000 168260.87 1.07 8.18 2450 177550 0.99
18000 8000 180000 184285.71 0.98 10 2800 177200 0.98
20000 7000 180000 161250 1.12 9 2450 177550 0.99
18000 8000 180000 184285.71 0.98 10 2800 177200 0.98
15000 10000 180000 172000 1.05 12 3500 176500 0.98
15000 10000 180000 188780.49 0.95 12 3500 176500 0.98
16000 8000 180000 198461.54 0.91 11.25 2800 177200 0.98
16000 7000 180000 175909.09 1.02 11.25 2450 177550 0.99
21000 10000 180000 161250 1.12 8.57 3500 176500 0.98
24000 8000 210000 184285.71 1.14 8.75 2800 207200 0.99
14000 10000 180000 193500 0.93 12.86 3500 176500 0.98
18000 8000 180000 184285.71 0.98 10 2800 177200 0.98
14000 9000 195000 215000 0.91 13.93 3150 191850 0.98
18000 9000 180000 184285.71 0.98 10 3150 176850 0.98
20000 9000 180000 172000 1.05 9 3150 176850 0.98

40
16000 7000 180000 198461.54 0.91 11.25 2450 177550 0.99
18000 10000 180000 180000 1 10 3500 176500 0.98
18000 12000 180000 172000 1.05 10 4200 175800 0.98
16000 11000 150000 150000 1 9.38 3850 146150 0.97
15000 8000 120000 147428.57 0.81 8 2800 117200 0.98
15000 11000 150000 165384.62 0.91 10 3850 146150 0.97
18000 10000 150000 140217.39 1.07 8.33 3500 146500 0.98
17000 13000 150000 146590.91 1.02 8.82 4550 145450 0.97
17000 12000 150000 150000 1 8.82 4200 145800 0.97
14000 8000 135000 170735.29 0.79 9.64 2800 132200 0.98
16000 11000 195000 171122.45 1.14 12.19 3850 191150 0.98
15000 11000 210000 205227.27 1.02 14 3850 206150 0.98
13000 10000 210000 220243.9 0.95 16.15 3500 206500 0.98
14000 8000 180000 203684.21 0.88 12.86 2800 177200 0.98
18000 10000 210000 180600 1.16 11.67 3500 206500 0.98
22000 8000 180000 172000 1.05 8.18 2800 177200 0.98
24000 12000 180000 138214.29 1.3 7.5 4200 175800 0.98
18000 7000 180000 193500 0.93 10 2450 177550 0.99
18000 12000 180000 161250 1.12 10 4200 175800 0.98
16000 12000 180000 175909.09 1.02 11.25 4200 175800 0.98
18000 12000 180000 172000 1.05 10 4200 175800 0.98
18000 12000 180000 172000 1.05 10 4200 175800 0.98
16000 12000 180000 175909.09 1.02 11.25 4200 175800 0.98
18000 12000 180000 172000 1.05 10 4200 175800 0.98
18000 12000 180000 168260.87 1.07 10 4200 175800 0.98
18000 12000 180000 168260.87 1.07 10 4200 175800 0.98
16000 10000 150000 165384.62 0.91 9.38 3500 146500 0.98
13000 11000 210000 220243.9 0.95 16.15 3850 206150 0.98
17000 11000 135000 145125 0.93 7.94 3850 131150 0.97
11000 13000 210000 215000 0.98 19.09 4550 205450 0.98
17000 12000 180000 168260.87 1.07 10.59 4200 175800 0.98
17000 12000 195000 186333.33 1.05 11.47 4200 190800 0.98
16000 12000 210000 200666.67 1.05 13.13 4200 205800 0.98
12000 12000 150000 169736.84 0.88 12.5 4200 145800 0.97
16000 11000 285000 272333.33 1.05 17.81 3850 281150 0.99
16000 10000 195000 195000 1 12.19 3500 191500 0.98
15000 11000 210000 205227.27 1.02 14 3850 206150 0.98
16000 12000 195000 190568.18 1.02 12.19 4200 190800 0.98
14000 12000 150000 161250 0.93 10.71 4200 145800 0.97
10000 11000 195000 226621.62 0.86 19.5 3850 191150 0.98
16000 12000 195000 190568.18 1.02 12.19 4200 190800 0.98
15000 10000 210000 215000 0.98 14 3500 206500 0.98
12000 11000 330000 337857.14 0.98 27.5 3850 326150 0.99
15000 12000 315000 294456.52 1.07 21 4200 310800 0.99

41
14000 12000 195000 182282.61 1.07 13.93 4200 190800 0.98
19000 10000 210000 196304.35 1.07 11.05 3500 206500 0.98
15000 10000 195000 209625 0.93 13 3500 191500 0.98
13000 10000 210000 215000 0.98 16.15 3500 206500 0.98
12000 11000 195000 220657.89 0.88 16.25 3850 191150 0.98
12000 10000 210000 205227.27 1.02 17.5 3500 206500 0.98
17000 10000 195000 195000 1 11.47 3500 191500 0.98
17000 9000 180000 188780.49 0.95 10.59 3150 176850 0.98
16000 10000 105000 125416.67 0.84 6.56 3500 101500 0.97
16000 10000 105000 125416.67 0.84 6.56 3500 101500 0.97
18000 9000 150000 161250 0.93 8.33 3150 146850 0.98
15000 11000 180000 184285.71 0.98 12 3850 176150 0.98
17000 9000 165000 173048.78 0.95 9.71 3150 161850 0.98
19000 10000 120000 125853.66 0.95 6.32 3500 116500 0.97
18000 9000 165000 154239.13 1.07 9.17 3150 161850 0.98
20000 7000 165000 168928.57 0.98 8.25 2450 162550 0.99
17000 10000 165000 168928.57 0.98 9.71 3500 161500 0.98
20000 11000 210000 188125 1.12 10.5 3850 206150 0.98
17000 10000 165000 157666.67 1.05 9.71 3500 161500 0.98
16000 13000 165000 165000 1 10.31 4550 160450 0.97
13000 10000 150000 179166.67 0.84 11.54 3500 146500 0.98
14000 10000 165000 177375 0.93 11.79 3500 161500 0.98
15000 10000 150000 169736.84 0.88 10 3500 146500 0.98
16000 8000 135000 145125 0.93 8.44 2800 132200 0.98
17000 10000 165000 173048.78 0.95 9.71 3500 161500 0.98
14000 12000 180000 184285.71 0.98 12.86 4200 175800 0.98
16000 11000 165000 168928.57 0.98 10.31 3850 161150 0.98
17000 12000 195000 171122.45 1.14 11.47 4200 190800 0.98
19000 10000 150000 146590.91 1.02 7.89 3500 146500 0.98
16000 10000 120000 139459.46 0.86 7.5 3500 116500 0.97
16000 10000 180000 180000 1 11.25 3500 176500 0.98
22000 12000 180000 157959.18 1.14 8.18 4200 175800 0.98
18000 12000 180000 168260.87 1.07 10 4200 175800 0.98
18000 12000 180000 164680.85 1.09 10 4200 175800 0.98
16000 12000 180000 172000 1.05 11.25 4200 175800 0.98
16000 12000 180000 172000 1.05 11.25 4200 175800 0.98
20000 12000 180000 164680.85 1.09 9 4200 175800 0.98
18000 12000 180000 154800 1.16 10 4200 175800 0.98
14000 12000 180000 180000 1 12.86 4200 175800 0.98
14000 12000 180000 164680.85 1.09 12.86 4200 175800 0.98
16000 12000 180000 175909.09 1.02 11.25 4200 175800 0.98
18000 8000 180000 184285.71 0.98 10 2800 177200 0.98
16000 10000 180000 184285.71 0.98 11.25 3500 176500 0.98
18000 10000 180000 180000 1 10 3500 176500 0.98

42
18000 10000 180000 180000 1 10 3500 176500 0.98
14000 12000 180000 188780.49 0.95 12.86 4200 175800 0.98
18000 10000 180000 180000 1 10 3500 176500 0.98
16000 10000 180000 184285.71 0.98 11.25 3500 176500 0.98
16000 10000 180000 180000 1 11.25 3500 176500 0.98
15000 12000 180000 175909.09 1.02 12 4200 175800 0.98
12000 10000 180000 184285.71 0.98 15 3500 176500 0.98
15000 10000 180000 198461.54 0.91 12 3500 176500 0.98
16000 10000 180000 184285.71 0.98 11.25 3500 176500 0.98
20000 7000 180000 164680.85 1.09 9 2450 177550 0.99
20000 8000 180000 180000 1 9 2800 177200 0.98
20000 7000 180000 180000 1 9 2450 177550 0.99
18000 8000 180000 184285.71 0.98 10 2800 177200 0.98
20000 7000 180000 175909.09 1.02 9 2450 177550 0.99
22000 6000 180000 172000 1.05 8.18 2100 177900 0.99
18000 7000 180000 184285.71 0.98 10 2450 177550 0.99
22000 8000 180000 168260.87 1.07 8.18 2800 177200 0.98
18000 8000 180000 168260.87 1.07 10 2800 177200 0.98
20000 8000 180000 172000 1.05 9 2800 177200 0.98
22000 7000 180000 168260.87 1.07 8.18 2450 177550 0.99
18000 8000 180000 184285.71 0.98 10 2800 177200 0.98
20000 7000 180000 161250 1.12 9 2450 177550 0.99
18000 8000 180000 184285.71 0.98 10 2800 177200 0.98
15000 10000 180000 172000 1.05 12 3500 176500 0.98
15000 10000 180000 188780.49 0.95 12 3500 176500 0.98
16000 8000 180000 198461.54 0.91 11.25 2800 177200 0.98
16000 7000 180000 175909.09 1.02 11.25 2450 177550 0.99
21000 10000 180000 161250 1.12 8.57 3500 176500 0.98
24000 8000 210000 184285.71 1.14 8.75 2800 207200 0.99
14000 10000 180000 193500 0.93 12.86 3500 176500 0.98
18000 8000 180000 184285.71 0.98 10 2800 177200 0.98
14000 9000 195000 215000 0.91 13.93 3150 191850 0.98
18000 9000 180000 184285.71 0.98 10 3150 176850 0.98
20000 9000 180000 172000 1.05 9 3150 176850 0.98
16000 7000 180000 198461.54 0.91 11.25 2450 177550 0.99
18000 10000 180000 180000 1 10 3500 176500 0.98
18000 12000 180000 172000 1.05 10 4200 175800 0.98
16000 11000 150000 150000 1 9.38 3850 146150 0.97
15000 8000 120000 147428.57 0.81 8 2800 117200 0.98
15000 11000 150000 165384.62 0.91 10 3850 146150 0.97
18000 10000 150000 140217.39 1.07 8.33 3500 146500 0.98
17000 13000 150000 146590.91 1.02 8.82 4550 145450 0.97
17000 12000 150000 150000 1 8.82 4200 145800 0.97
14000 8000 135000 170735.29 0.79 9.64 2800 132200 0.98

43
16000 11000 195000 171122.45 1.14 12.19 3850 191150 0.98
15000 11000 210000 205227.27 1.02 14 3850 206150 0.98
13000 10000 210000 220243.9 0.95 16.15 3500 206500 0.98
14000 8000 180000 203684.21 0.88 12.86 2800 177200 0.98
18000 10000 210000 180600 1.16 11.67 3500 206500 0.98
22000 8000 180000 172000 1.05 8.18 2800 177200 0.98
24000 12000 180000 138214.29 1.3 7.5 4200 175800 0.98
18000 7000 180000 193500 0.93 10 2450 177550 0.99
18000 12000 180000 161250 1.12 10 4200 175800 0.98
16000 12000 180000 175909.09 1.02 11.25 4200 175800 0.98
18000 12000 180000 172000 1.05 10 4200 175800 0.98
18000 12000 180000 172000 1.05 10 4200 175800 0.98
16000 12000 180000 175909.09 1.02 11.25 4200 175800 0.98
18000 12000 180000 172000 1.05 10 4200 175800 0.98
18000 12000 180000 168260.87 1.07 10 4200 175800 0.98
18000 12000 180000 168260.87 1.07 10 4200 175800 0.98
16000 10000 150000 165384.62 0.91 9.38 3500 146500 0.98
13000 11000 210000 220243.9 0.95 16.15 3850 206150 0.98
17000 11000 135000 145125 0.93 7.94 3850 131150 0.97
11000 13000 210000 215000 0.98 19.09 4550 205450 0.98
17000 12000 180000 168260.87 1.07 10.59 4200 175800 0.98
17000 12000 195000 186333.33 1.05 11.47 4200 190800 0.98
16000 12000 210000 200666.67 1.05 13.13 4200 205800 0.98
12000 12000 150000 169736.84 0.88 12.5 4200 145800 0.97
16000 11000 285000 272333.33 1.05 17.81 3850 281150 0.99
16000 10000 195000 195000 1 12.19 3500 191500 0.98
15000 11000 210000 205227.27 1.02 14 3850 206150 0.98
16000 12000 195000 190568.18 1.02 12.19 4200 190800 0.98
14000 12000 150000 161250 0.93 10.71 4200 145800 0.97
10000 11000 195000 226621.62 0.86 19.5 3850 191150 0.98
16000 12000 195000 190568.18 1.02 12.19 4200 190800 0.98
15000 10000 210000 215000 0.98 14 3500 206500 0.98
12000 11000 330000 337857.14 0.98 27.5 3850 326150 0.99
15000 12000 315000 294456.52 1.07 21 4200 310800 0.99
14000 12000 195000 182282.61 1.07 13.93 4200 190800 0.98
19000 10000 210000 196304.35 1.07 11.05 3500 206500 0.98
15000 10000 195000 209625 0.93 13 3500 191500 0.98
13000 10000 210000 215000 0.98 16.15 3500 206500 0.98
12000 11000 195000 220657.89 0.88 16.25 3850 191150 0.98
12000 10000 210000 205227.27 1.02 17.5 3500 206500 0.98
17000 10000 195000 195000 1 11.47 3500 191500 0.98
17000 9000 180000 188780.49 0.95 10.59 3150 176850 0.98
16000 10000 105000 125416.67 0.84 6.56 3500 101500 0.97
16000 10000 105000 125416.67 0.84 6.56 3500 101500 0.97

44
18000 9000 150000 161250 0.93 8.33 3150 146850 0.98
15000 11000 180000 184285.71 0.98 12 3850 176150 0.98
17000 9000 165000 173048.78 0.95 9.71 3150 161850 0.98
19000 10000 120000 125853.66 0.95 6.32 3500 116500 0.97
18000 9000 165000 154239.13 1.07 9.17 3150 161850 0.98
20000 7000 165000 168928.57 0.98 8.25 2450 162550 0.99
17000 10000 165000 168928.57 0.98 9.71 3500 161500 0.98