effect of rf magnetic fields and input power on rf ... electric field distribution, max. field in...
TRANSCRIPT

Effect of RF MagneticFields and Input
Power on RFBreakdown Limit
V.A. Dolgashev
SLAC

ContributorsC. Adolphsen, S. Döbert,
C. Nantista, R. Miller,
R. Ruth, S. Tantawi,
J. Wang and
P. Wilson
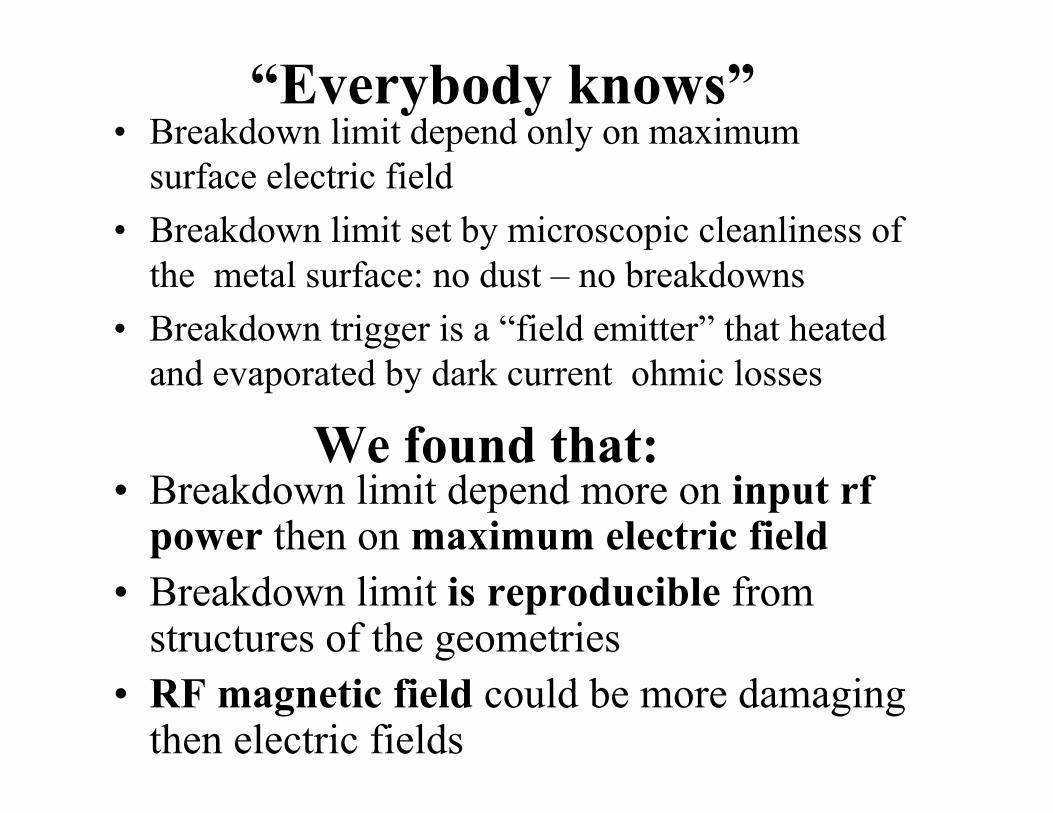
“Everybody knows”• Breakdown limit depend only on maximum
surface electric field
• Breakdown limit set by microscopic cleanliness ofthe metal surface: no dust – no breakdowns
• Breakdown trigger is a “field emitter” that heatedand evaporated by dark current ohmic losses
We found that:• Breakdown limit depend more on input rf
power then on maximum electric field• Breakdown limit is reproducible from
structures of the geometries• RF magnetic field could be more damaging
then electric fields
OUTLINE
• High power RF conditioning• Breakdown limits
–RF magnetic fields:•couplers problem and solution•stainless steel particle
–Input power

High powerconditioning
ofTW53VG3MC
170 ns
100 ns 400 ns240 ns
V.Dolgashev, C. Adolphsen, 10 February 03
50 ns
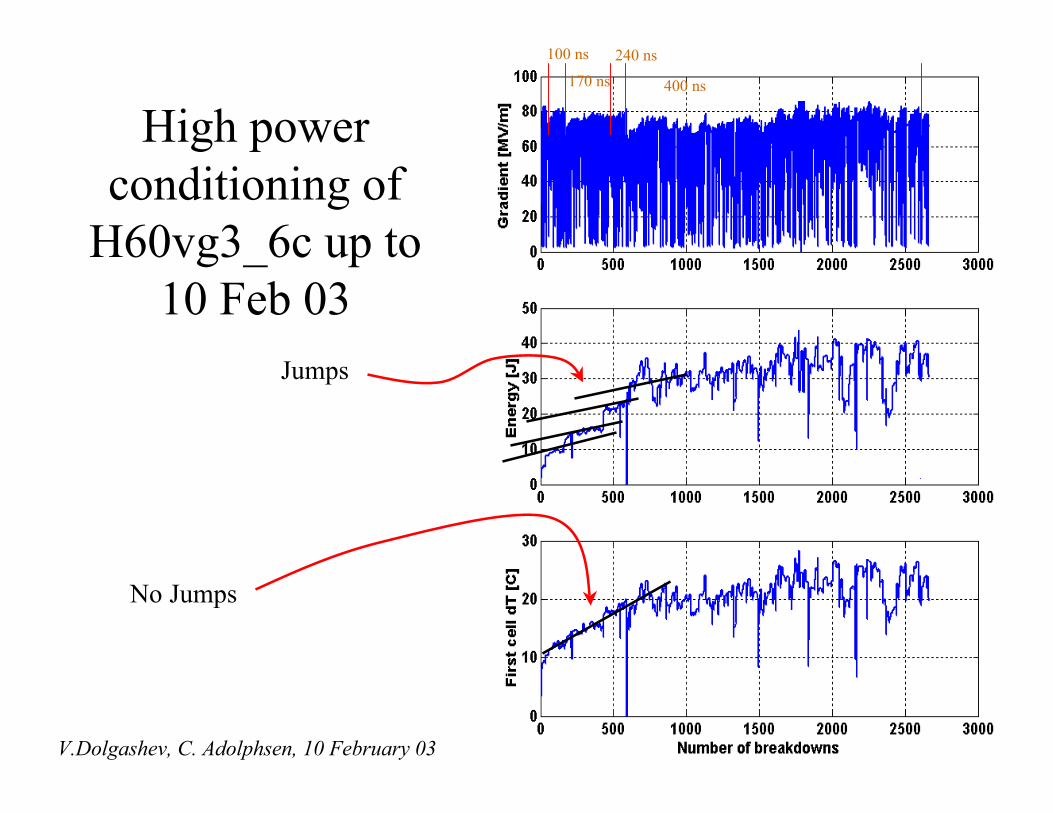
High powerconditioning of
H60vg3_6c up to10 Feb 03
170 ns
100 ns
400 ns
240 ns
V.Dolgashev, C. Adolphsen, 10 February 03
No Jumps
Jumps

High powerconditioning ofH90vg3 up to
10 Feb 03
250 ns170 ns 400 ns
V.Dolgashev, C. Adolphsen, 10 February 03
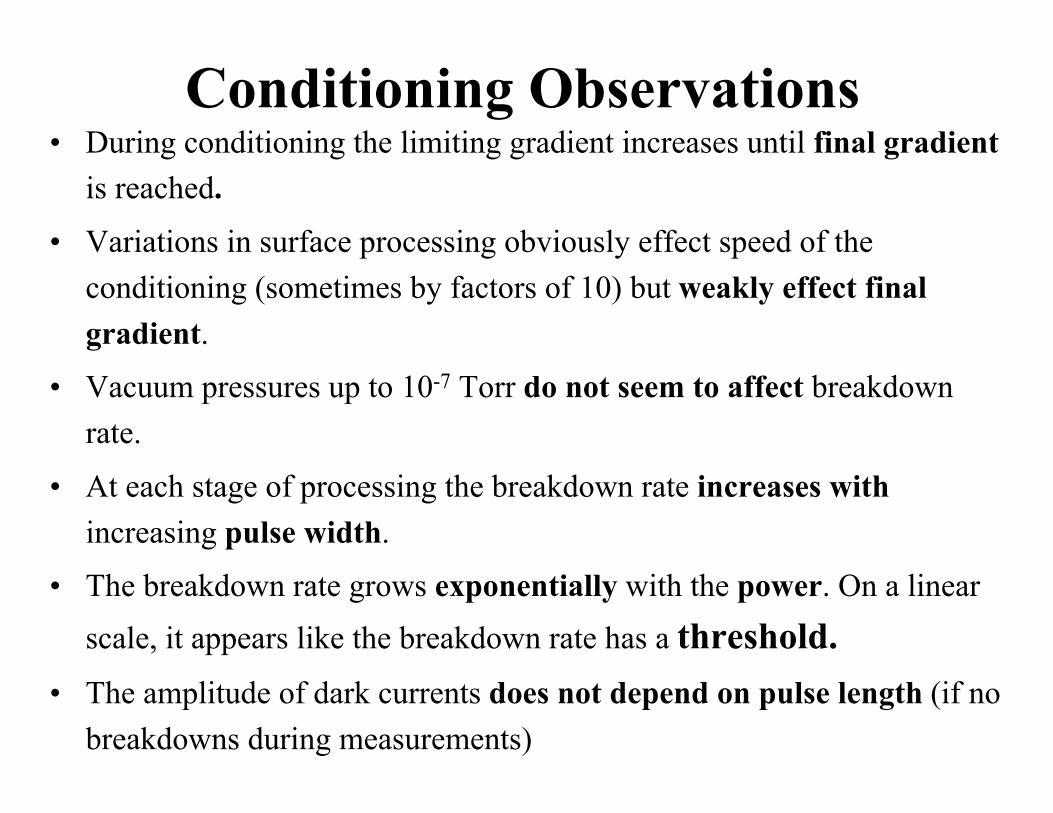
Conditioning Observations• During conditioning the limiting gradient increases until final gradient
is reached.
• Variations in surface processing obviously effect speed of the
conditioning (sometimes by factors of 10) but weakly effect final
gradient.
• Vacuum pressures up to 10-7 Torr do not seem to affect breakdown
rate.
• At each stage of processing the breakdown rate increases with
increasing pulse width.
• The breakdown rate grows exponentially with the power. On a linear
scale, it appears like the breakdown rate has a threshold.
• The amplitude of dark currents does not depend on pulse length (if no
breakdowns during measurements)

RF breakdownsand rf magnetic
fields

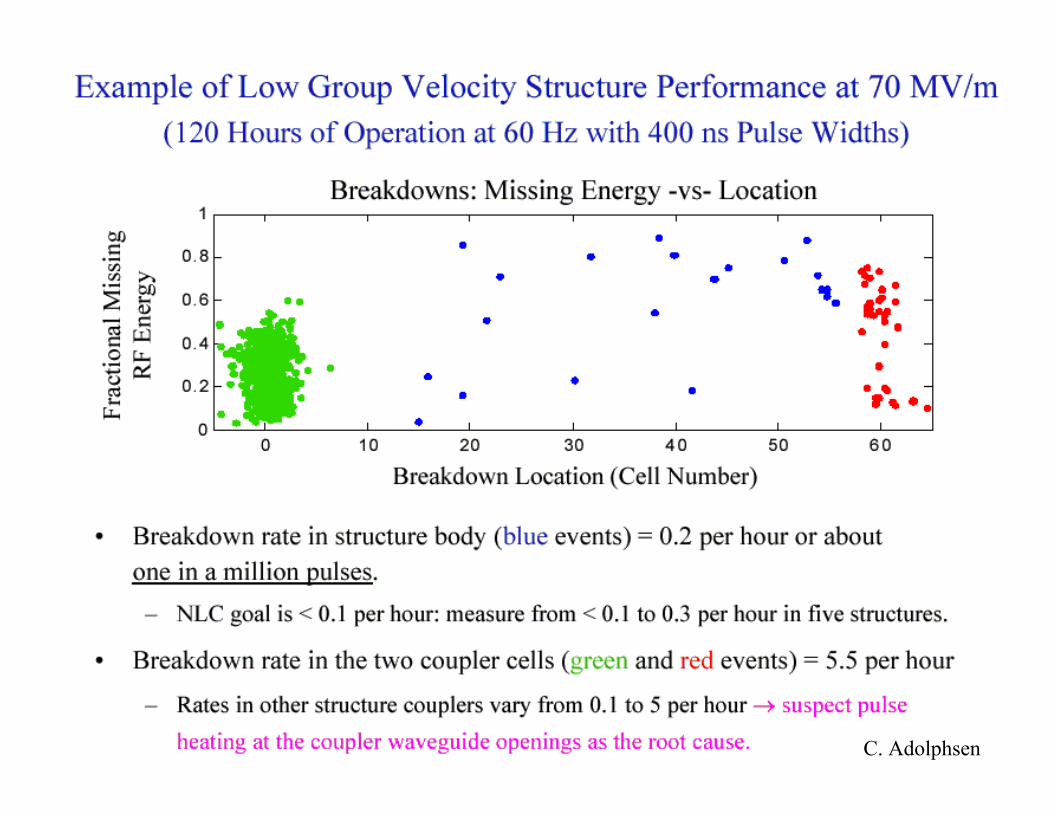
TW structure: Breakdowns duringprocessing and steady-state run
Fra
ctio
nal m
issi
ng r
f en
ergy
C. Adolphsen
C. Adolphsen

Juwen Wang
Coupler geometry
76 _m radii
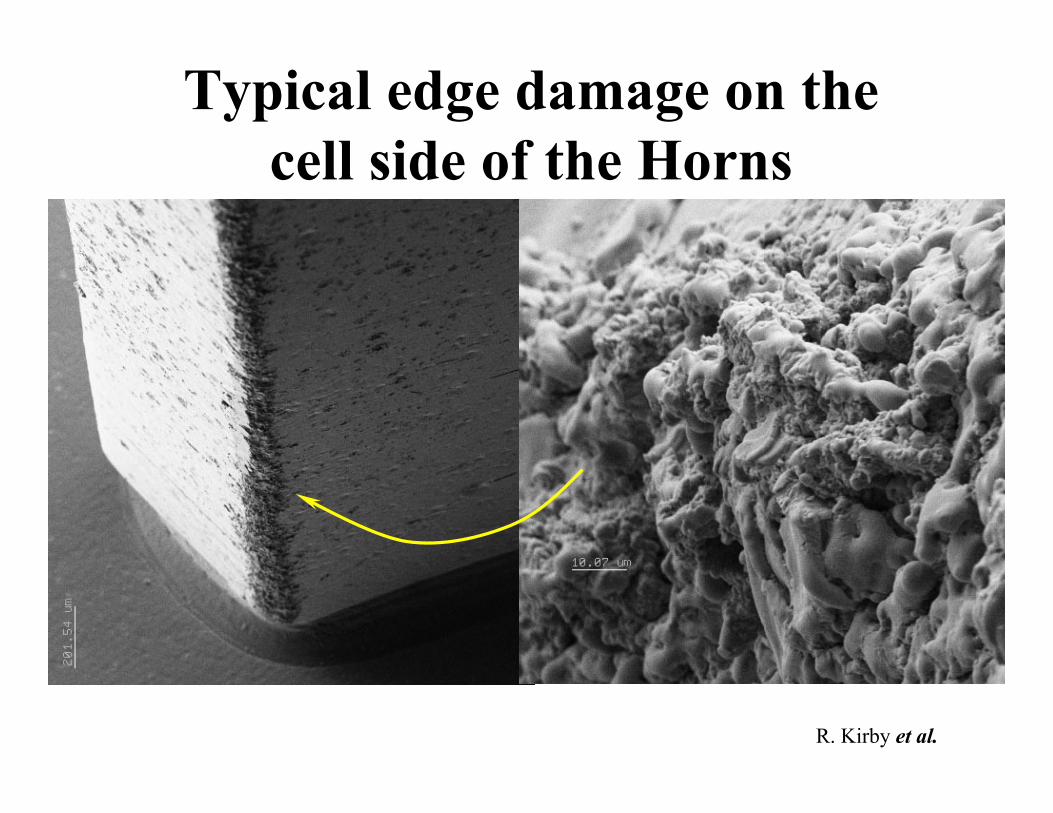
Typical edge damage on thecell side of the Horns
R. Kirby et al.

Typical edge damage on thewaveguide side of the Horns
R. Kirby et al.
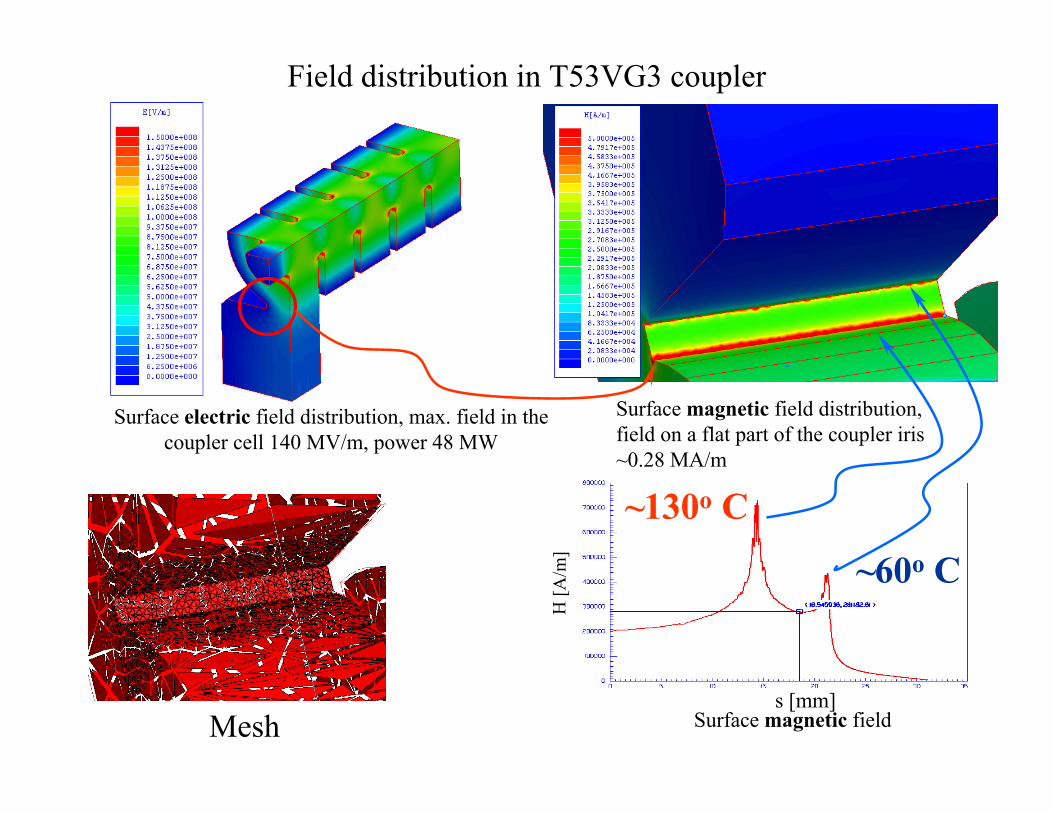
Surface electric field distribution, max. field in thecoupler cell 140 MV/m, power 48 MW
Surface magnetic field distribution,field on a flat part of the coupler iris~0.28 MA/m
Mesh
H [
A/m
]
s [mm]Surface magnetic field
Field distribution in T53VG3 coupler
~130o C
~60o C

Breakdown rate vs. pulse temperature rise
SW structure breakdown rate vs. pulse temperature riseSW565, input rf pulses with different shape and amplitude
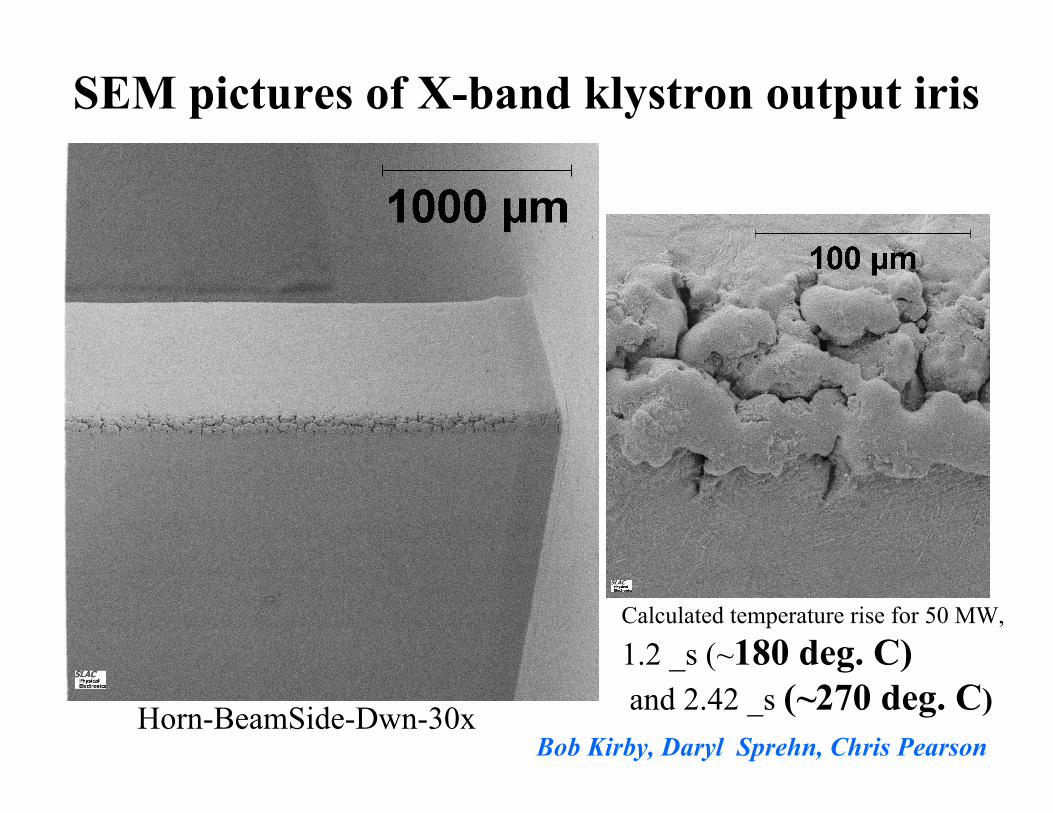
SEM pictures of X-band klystron output iris
Horn-BeamSide-Dwn-30x
Calculated temperature rise for 50 MW,
1.2 _s (~180 deg. C) and 2.42 _s (~270 deg. C)
Bob Kirby, Daryl Sprehn, Chris Pearson

Surface field in input coupler of H60VG3
Surface electric field on theedge of the waveguide to coupler iris,iris rounding 100 _m, Emax ~12 MV/mat 73 MW of input power
(~13 MV/m for 76 _m)
Surface magnetic field,Hmax ~1. MA/m (rounding 100 _m) at 73MWof input power (~1.1 MA/m for 76 _m)
H [
A/m
]
s [mm]
s [mm]
E [
V/m
]

Newcouplers
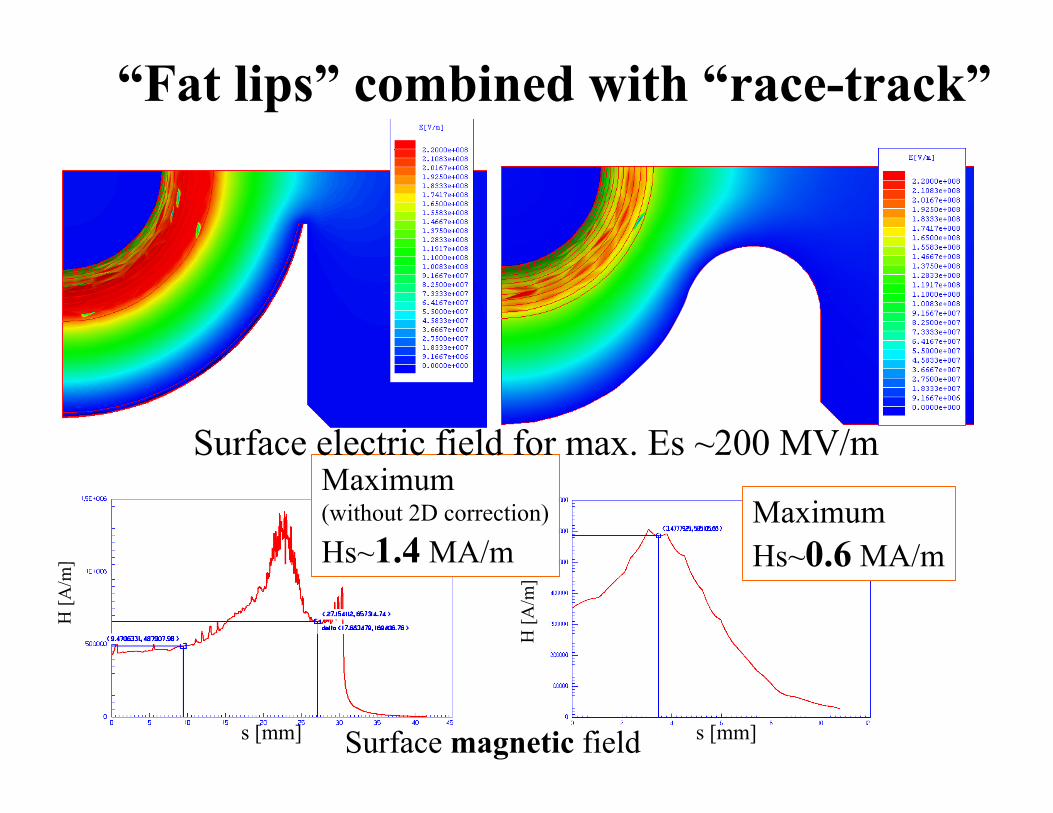
Surface magnetic field
Maximum (without 2D correction)
Hs~1.4 MA/mMaximumHs~0.6 MA/m
H [
A/m
]
s [mm]s [mm]
H [
A/m
]
Surface electric field for max. Es ~200 MV/m
“Fat lips” combined with “race-track”

Fat-lip coupler for SW structure
~30o C
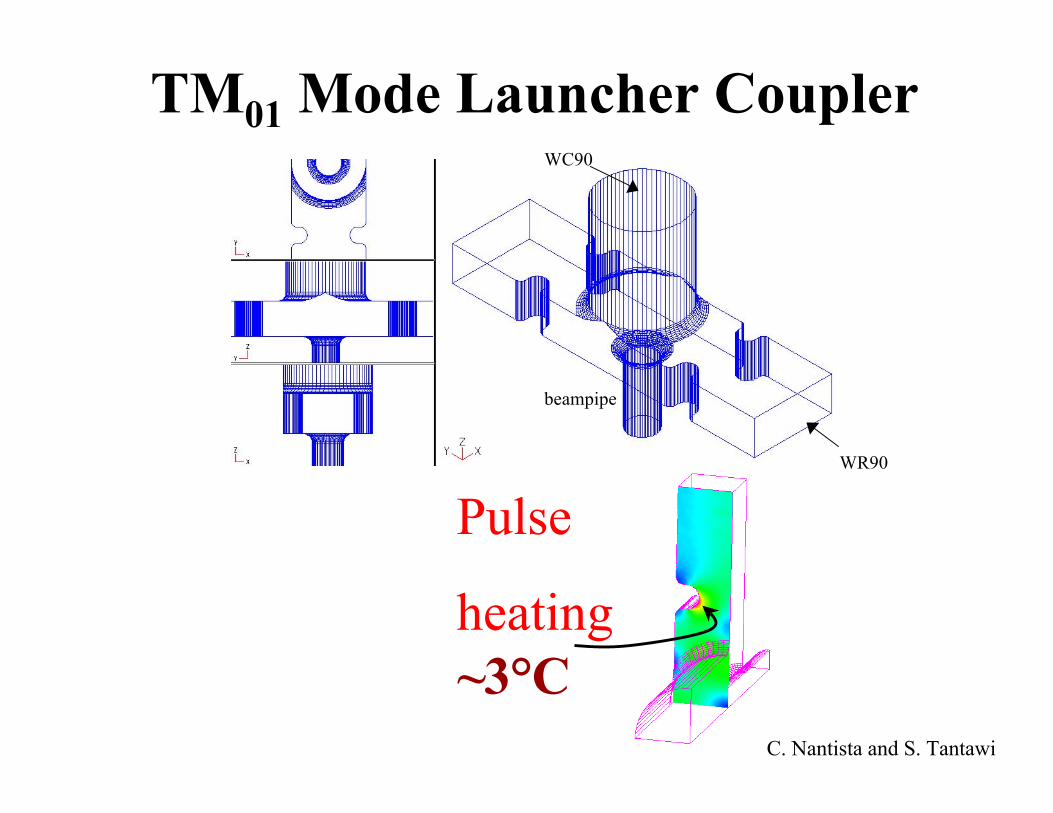
TM01 Mode Launcher Coupler
WR90
WC90
beampipe
Pulse
heating~3°C
C. Nantista and S. Tantawi
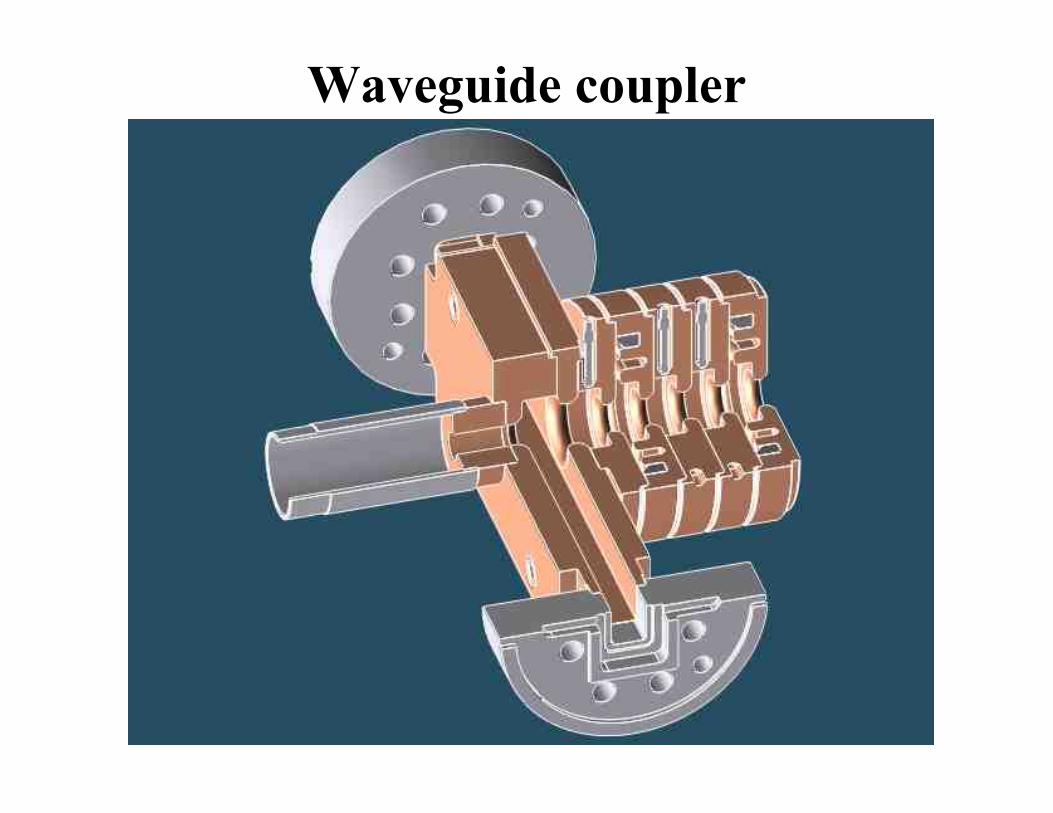
Waveguide coupler

Stainless steelparticle on 2bcell diameter
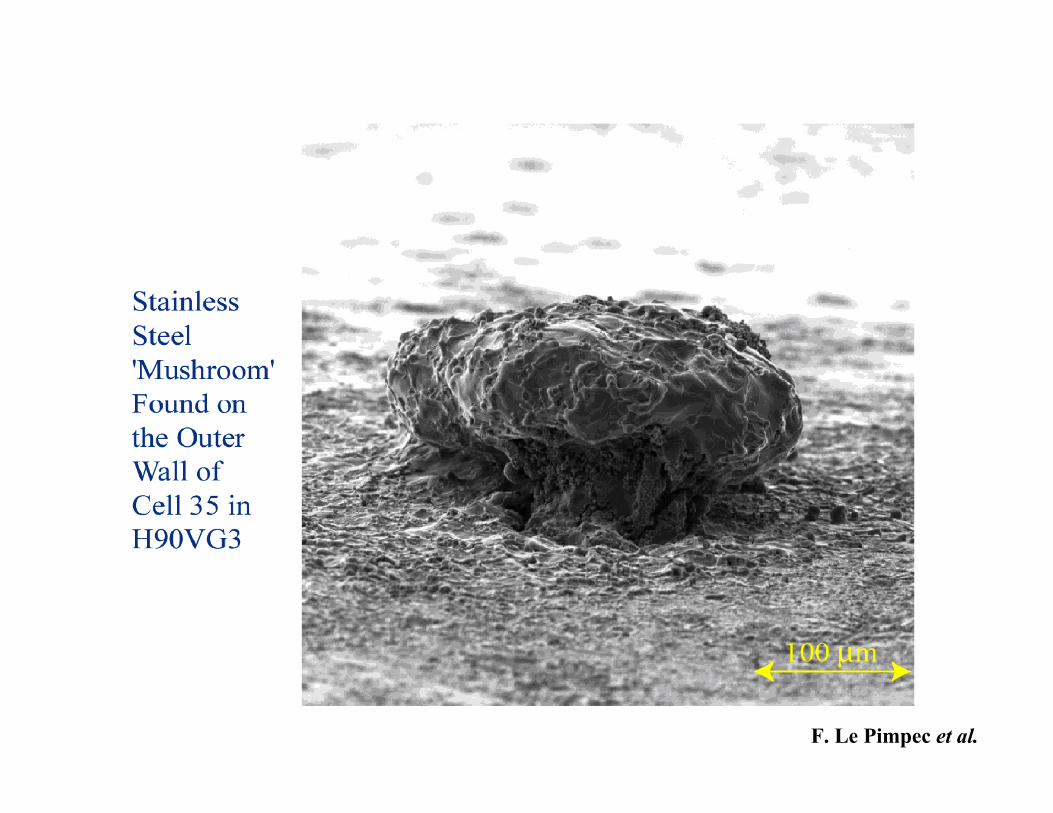
F. Le Pimpec et al.

Stainless steel particle in H90vg3
F. Le Pimpec et al.
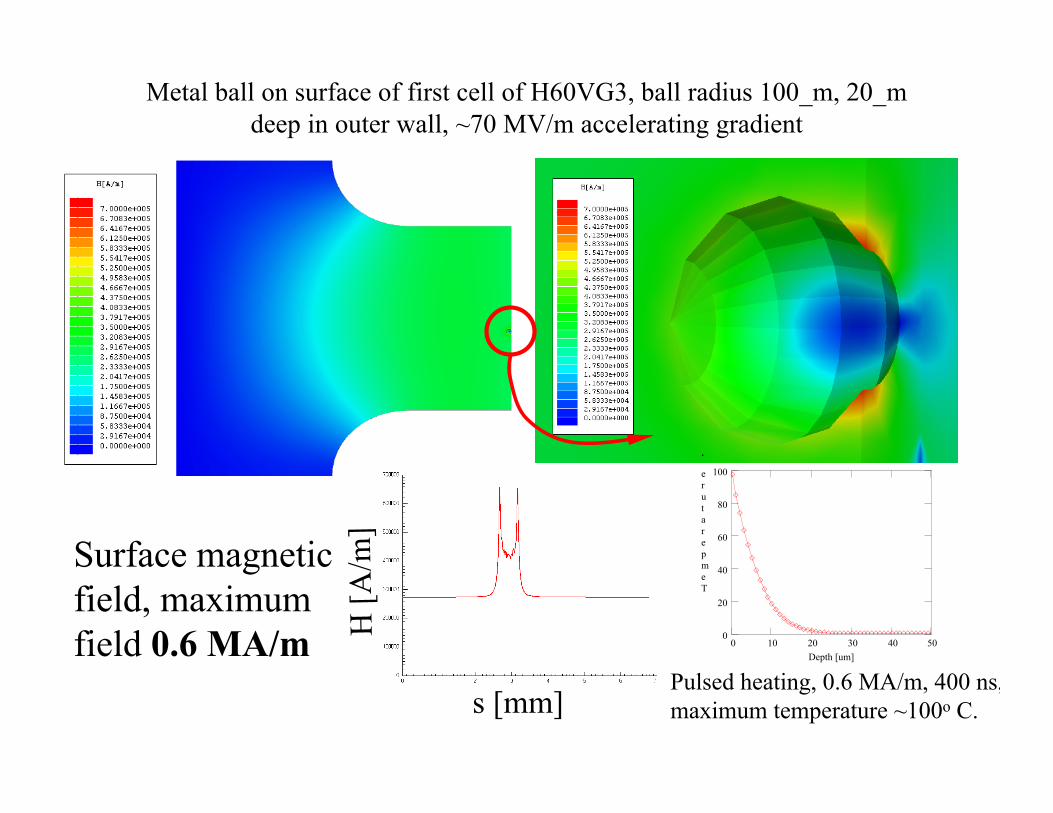
Metal ball on surface of first cell of H60VG3, ball radius 100_m, 20_mdeep in outer wall, ~70 MV/m accelerating gradient
Surface magneticfield, maximumfield 0.6 MA/m H
[A
/m]
s [mm]
0 10 20 30 40 500
20
40
60
80
100
Depth [um]
Temperature [deg.C]
Pulsed heating, 0.6 MA/m, 400 ns,maximum temperature ~100o C.

Metal ball on surface of first cell of H60VG3, ball radius 100 _m, 20 _m deep inouter wall, ~70 MV/m accelerating gradient
Surface electric field, maximumfield ~7 MV/m
E [
V/m
]
s [mm]

“Magnetic” breakdowns
• High rf magnetic fieldproduces damage
• High rf magnetic fields and>10 kV/cm electric fields
produce breakdowns

Input rf powerbreakdown limit:threshold behavior

Steffen Döbert
Breakdown rates for H90VG3 vs. pulse width
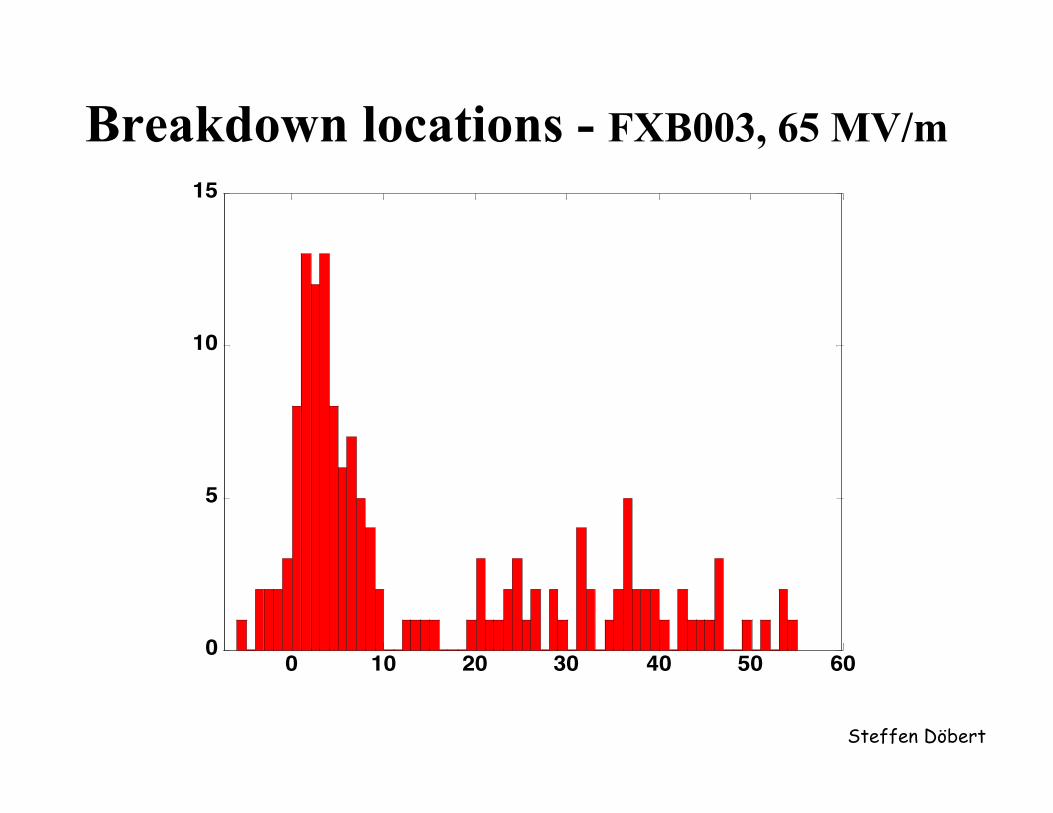
65 MV/m run
No clear hot spots
But typical front bias
0 10 20 30 40 50 600
5
10
15
cell number
Steffen Döbert
Breakdown locations - FXB003, 65 MV/m

0 5 10 15 20 25 300
10
20
30
40
50
60
70
80
90
0 5 10 15 20 25 300
5
10
15
20
25
30
Statistics of “breakdown chains” in H60VG3(6C)with 400 ns Pulses
Num
ber
of T
rips
(16
2 T
otal
)
Time Between Trips (Minutes)(Times > 30 Plotted at 30)
Num
ber
of T
rips
(11
4 T
otal
)
Time Between Trips (Minutes)(Times > 30 Plotted at 30)
65 MV/m 70 MV/m
“breakdown chains”
C. Adolphsen

Comparison of Power*sqrt(pulse widths) for3 accelerating structures
H60vg3_6c
H90vg3
T53vg3MC
Accelerating structures

“Prediction” of M2 structure processingwith “destruction limit” of 100 MW*sqrt(400ns)
Data: Rod Loewen, August, 2000
2000
1500
P [MW]*sqrt(pulse_length [ns])
Forward processing of M2 Structure
0 500 1000 15000
500
1000
1500
2000
2500
3000
Time [ns]
Power [MW]*sqrt(pulse width [ns])
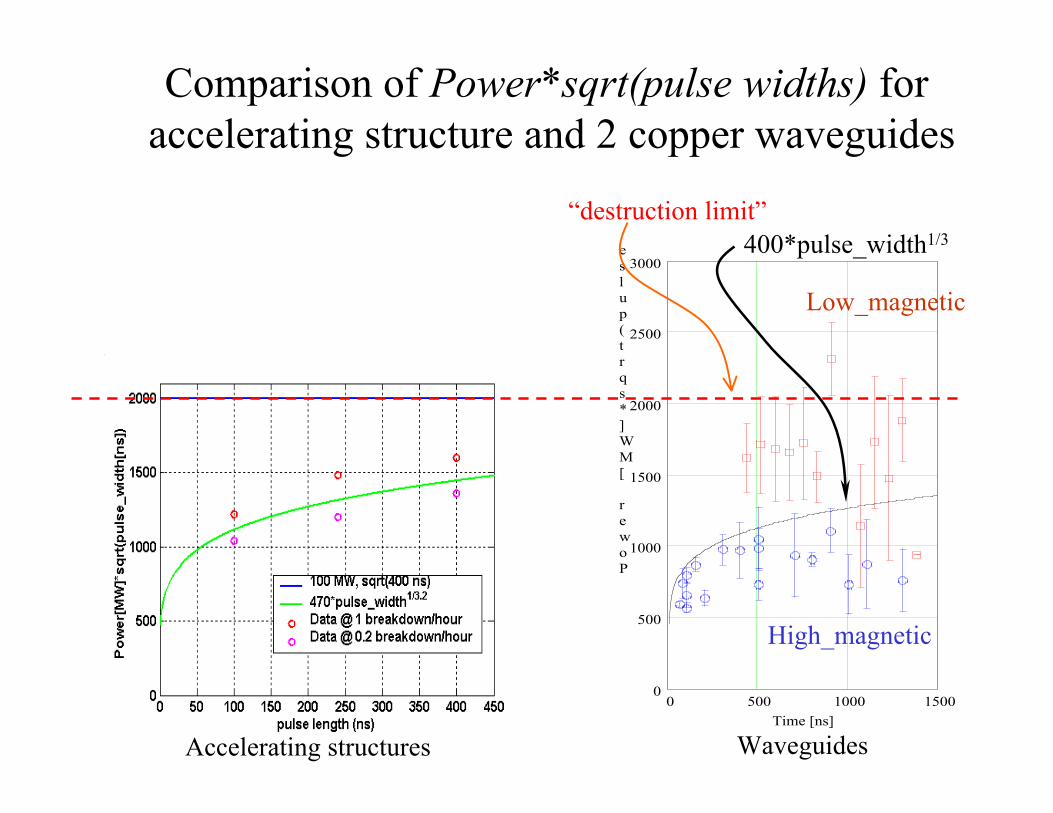
Comparison of Power*sqrt(pulse widths) for accelerating structure and 2 copper waveguides
“destruction limit”400*pulse_width1/3
Low_magnetic
Accelerating structures Waveguides
High_magnetic
Behavior of the“breakdown chains” in
TW structures and Waveguidessuggests that while increasingpower and pulse width we hit a
some kind of threshold in amountof damage due to a breakdown.
And this damage preventsfurther conditioning of the
structures.

Comparison withDC breakdown:
Thresholdbehavior

Conditioning of molybdenumelectrodes at DC
V.Shirokov, Budker INP
Not processedConditioned,
no “breakdown chains”“Breakdown chains”Degraded
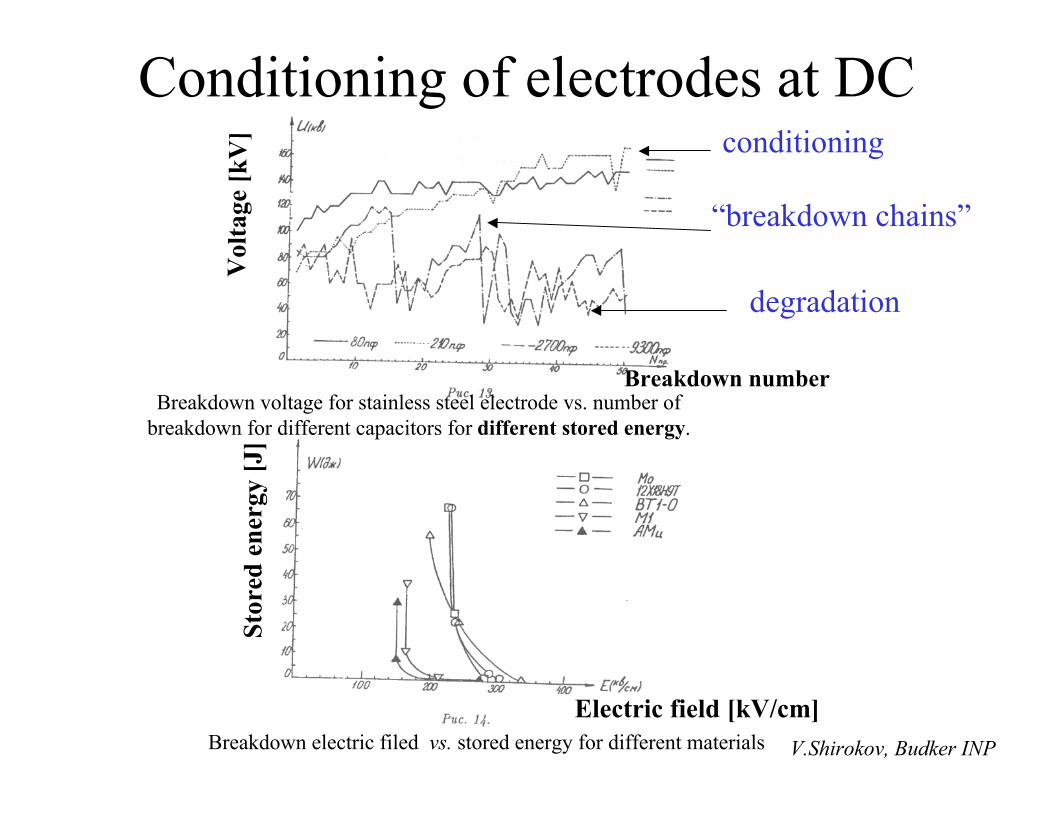
Conditioning of electrodes at DC
V.Shirokov, Budker INP
Breakdown voltage for stainless steel electrode vs. number ofbreakdown for different capacitors for different stored energy.
Breakdown electric filed vs. stored energy for different materials
Vol
tage
[kV
]
Breakdown number
Electric field [kV/cm]
Stor
ed e
nerg
y [J
]“breakdown chains”
conditioning
degradation
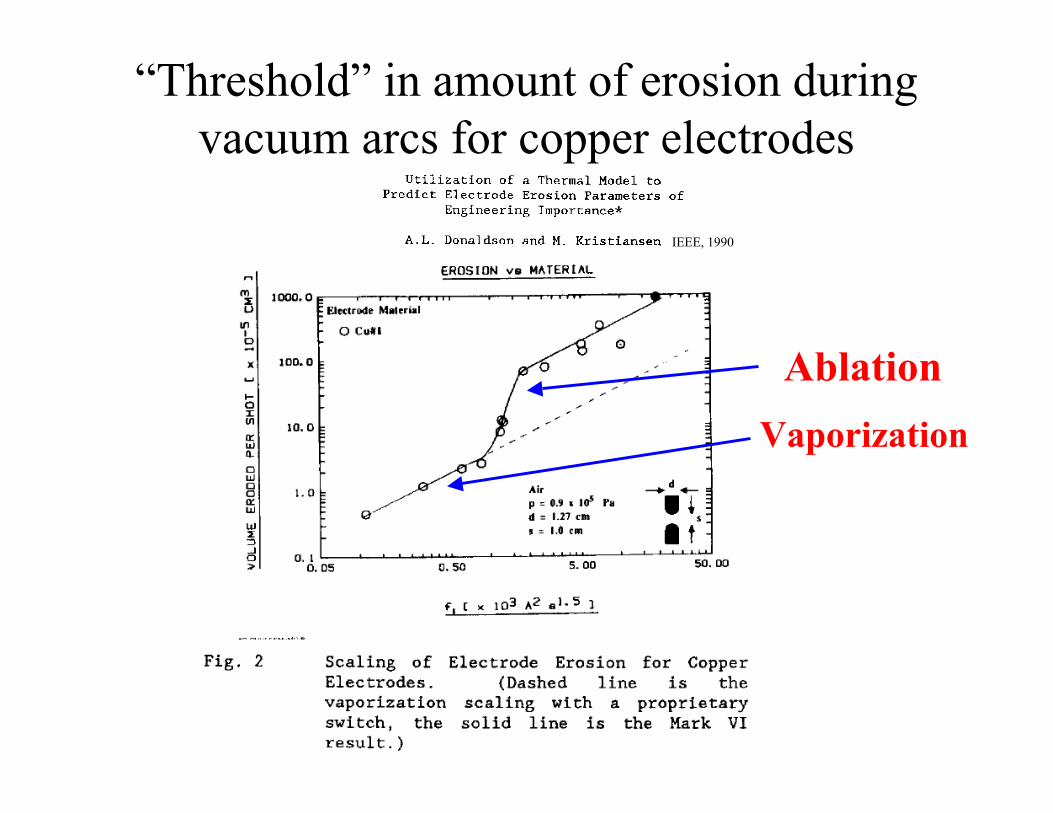
“Threshold” in amount of erosion duringvacuum arcs for copper electrodes
Vaporization
Ablation
IEEE, 1990
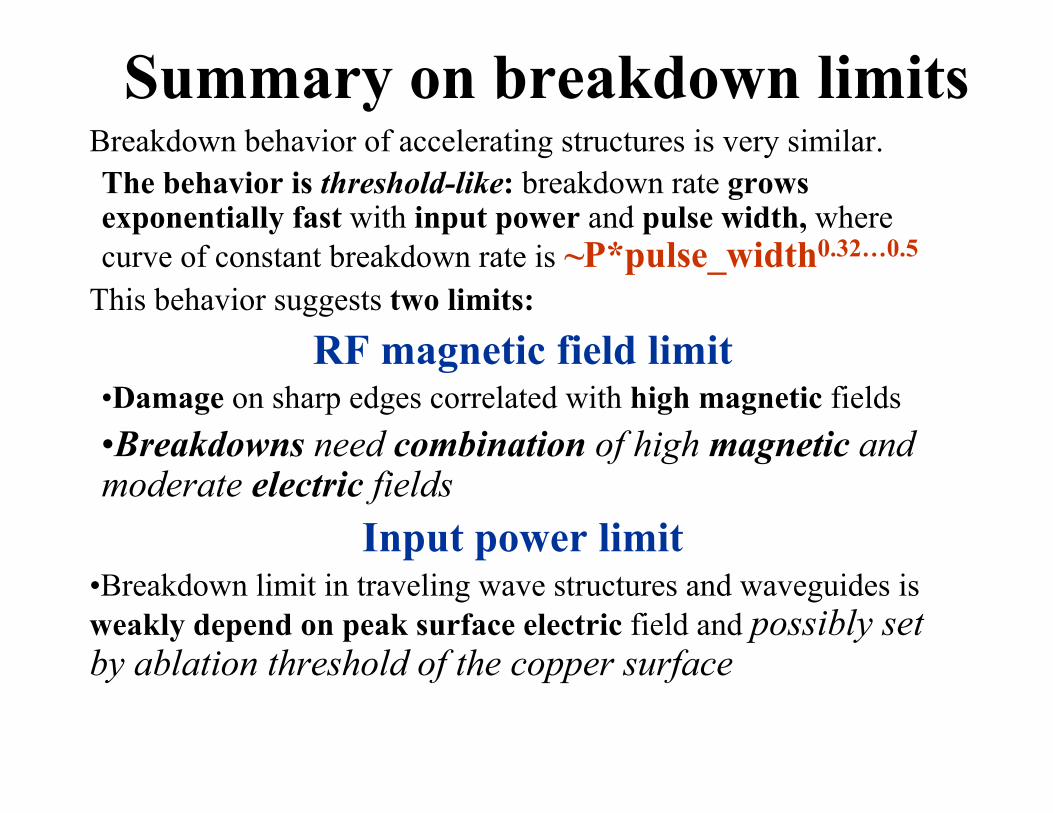
Summary on breakdown limitsBreakdown behavior of accelerating structures is very similar.The behavior is threshold-like: breakdown rate growsexponentially fast with input power and pulse width, wherecurve of constant breakdown rate is ~P*pulse_width0.32…0.5
This behavior suggests two limits:
RF magnetic field limit•Damage on sharp edges correlated with high magnetic fields
•Breakdowns need combination of high magnetic andmoderate electric fields
Input power limit•Breakdown limit in traveling wave structures and waveguides isweakly depend on peak surface electric field and possibly setby ablation threshold of the copper surface

What we can do?
Experiments on breakdown limit• Different geometries
– Compare SW and TW structures– Waveguides
• Different materials– Whole metal structures– Bi-metal structures– Alloys and metal compounds
Experiments on breakdown trigger• Pulse heating• Nature of dark currents• Different materials
Theoretical particle-thermo-mechanical models