effect of providing free glasses on chidren's educational outcomes
DESCRIPTION
For researchTRANSCRIPT
Effect of providing free glasses on children’seducational outcomes in China: cluster randomizedcontrolled trial
OPEN ACCESS
Xiaochen Ma graduate student 1 2, Zhongqiang Zhou graduate student 3, Hongmei Yi professor 4,Xiaopeng Pang professor 5, Yaojiang Shi professor 6, Qianyun Chen research assistant 3, Mirjam EMeltzer biostatistician 3, Saskia le Cessie professor 7 8, Mingguang He professor 3, Scott Rozelleprofessor 9, Yizhi Liu professor 3, Nathan Congdon professor 3 10
1Department of Agriculture and Resource Economics, University of California, Davis, Davis, CA, USA; 2Stanford Center For International Development,Stanford University, Stanford, CA, USA; 3Key Laboratory of Ophthalmology and Division of Preventive Ophthalmology, Zhongshan OphthalmicCenter, Sun Yat-sen University, Guangzhou, China; 4Center for Chinese Agricultural Policy, Institute of Geographical Sciences and Natural ResourcesResearch, Chinese Academy of Sciences, Beijing, China; 5School of Agricultural Economics and Rural Development, Renmin University of China,Beijing, China; 6School of Economic Management, Xibei University, Xi’an, China; 7Department of Clinical Epidemiology, Leiden University MedicalCenter, Leiden, Netherlands; 8Department of Medical Statistics and Bioinformatics, Leiden University Medical Center, Leiden, Netherlands; 9FreemanSpogli Institute of International Studies, Stanford University, Stanford, CA, USA; 10ORBIS International, New York, NY, USA
AbstractObjective To assess the effect of provision of free glasses on academicperformance in rural Chinese children with myopia.
Design Cluster randomized, investigator masked, controlled trial.
Setting 252 primary schools in two prefectures in western China,2012-13.
Participants 3177 of 19 934 children in fourth and fifth grades (meanage 10.5 years) with visual acuity <6/12 in either eye without glassescorrectable to >6/12 with glasses. 3052 (96.0%) completed the study.
InterventionsChildren were randomized by school (84 schools per arm)to one of three interventions at the beginning of the school year:prescription for glasses only (control group), vouchers for free glassesat a local facility, or free glasses provided in class.
Main outcome measures Spectacle wear at endline examination andend of year score on a specially designed mathematics test, adjustedfor baseline score and expressed in standard deviations.
Results Among 3177 eligible children, 1036 (32.6%) were randomizedto control, 988 (31.1%) to vouchers, and 1153 (36.3%) to free glassesin class. All eligible children would benefit from glasses, but only 15%wore them at baseline. At closeout glasses wear was 41% (observed)and 68% (self reported) in the free glasses group, and 26% (observed)and 37% (self reported) in the controls. Effect on test score was 0.11
SD (95% confidence interval 0.01 to 0.21) when the free glasses groupwas compared with the control group. The adjusted effect of providingfree glasses (0.10, 0.002 to 0.19) was greater than parental education(0.03, −0.04 to 0.09) or family wealth (0.01, −0.06 to 0.08). This differencebetween groups was significant, but was smaller than the prespecified0.20 SD difference that the study was powered to detect.
Conclusions The provision of free glasses to Chinese children withmyopia improves children’s performance on mathematics testing to astatistically significant degree, despite imperfect compliance, althoughthe observed difference between groups was smaller than the study wasoriginally designed to detect. Myopia is common and rarely corrected inthis setting.
Trial Registration Current Controlled Trials ISRCTN03252665.
IntroductionPoor vision is the most common impairment affecting schoolaged children in the developing world, comprising 48% of alldisability among children aged 5 to 9 years in the India censusof 2001.1 The leading and most easily remedied cause of visualimpairment (visual acuity <6/18) among children is refractiveerror, affecting 12.8 million children aged between 5 and 15years, half of whom live in China.2 Spectacles provide a safeand inexpensive treatment. Several studies report that children
Correspondence to: N Congdon, State Key Laboratory of Ophthalmology, and Translational Research in Equitable Eyecare, Zhongshan OphthalmicCenter, Sun Yat-sen University, Guangzhou, China [email protected]
Extra material supplied by the author (see http://www.bmj.com/content/349/bmj.g5740?tab=related#datasupp)
Distribution of spherical equivalent refractive errors
No commercial reuse: See rights and reprints http://www.bmj.com/permissions Subscribe: http://www.bmj.com/subscribe
BMJ 2014;349:g5740 doi: 10.1136/bmj.g5740 (Published 23 September 2014) Page 1 of 12
Research
RESEARCH
with uncorrected refractive errors have lower scores on a varietyof motor and cognitive tests,3-6 and that improvements in readingmay occur when vision problems are corrected.6 7
However, the relation between academic achievement andrefractive error may be complex. Hyperopia (far sightedness),causing difficulty in seeing close objects, is more likely to causereading problems and is the focus of many studies of refractiveerror and school performance.5 6 Myopia (near sightedness)causes difficulty in seeing distant objects and is more commonin school aged children, particularly in Asia.8-10 Myopia isresponsible for more than 90% of poor vision among childrenin China.8 9 Prevalence of myopia may exceed 60% in ruralareas9 11 and 80% in ethnically Chinese urban populations,12 andtwo thirds or more of rural Chinese children with myopia arewithout accurate correction.13 The high prevalence of myopiaamong Chinese children seems to be due in part to high levelsof near work related to school and limited time spent outdoors.14Barriers to accessing refractive care include cost and poor qualityof available glasses and lack of knowledge about myopia andthe benefits of its correction.15
It also seems that higher scholastic attainment is associated withrisk of myopia.14 Thus, the directionality of cause and effectbetween myopia and school performance is unclear. Myopiawill not cause difficulties with near reading except in extremecases, but it could prevent material on a blackboard from beingclearly seen. A recent review of school vision screening practicesfound no randomized trials examining the impact of correctingmyopia on school performance.16 Such trials are needed owingto the scope of the myopia problem; the effect of myopia onclassroom learning is not well understood, and the randomizedcontrolled study design can clarify any causal associationbetween the correction of myopia and school outcomes.We carried out a cluster randomized, factorial design, controlledtrial in rural western China to evaluate the effect of teachingabout the value of glasses and providing free spectacles on ratesof glasses wear and school performance. Cluster randomizationwas used because of the difficulty of assigning children todifferent interventions at one school. We hypothesized thateducation promoting the wearing of glasses aimed at schoolchildren with correctable refractive error, their teachers, andparents, and providing such children with free spectacles, wouldincrease children’s glasses wear (intermediary hypothesis) andimprove their academic performance (main hypothesis).
MethodsSettingThe study was carried out in two neighboring areas of westernChina. Tianshui prefecture is a deprived area17 in one of China’slowest resource provinces,18 Gansu. Yulin prefecture is arelatively affluent area,19 in middle income18 Shaanxi province.
Sampling and eligibility criteriaWe obtained a list of all 435 primary schools in the twoprefectures from local education bureaus. For logistical reasonswe excluded those with fewer than 50 or more than 150 studentsin the fourth and fifth grade combined (19% of sample frame).This is because screening at the larger schools could not bereliably completed in a day, which would have interfered withthe screening schedule, whereas smaller schools would beexpected to have fewer than 10 children requiring glasses, belowour power requirements.We randomly selected one school fromeach township in the sample, and within each school werandomly selected one class in each of the fourth and fifth grades
(likely age range 9-12 years). Children at the 252 selectedschools were eligible if they had an uncorrected (withoutglasses) visual acuity of ≤6/12 in either eye and their refractiveerror met the cut-offs shown to be associated with significantlygreater improvement in visual acuity when corrected20 (myopia≤−0.75 diopters (D), hyperopia ≥2.00 D, or astigmatism(non-spherical refractive error) ≥1.00 D); and visual acuitycould be improved to >6/12 in both eyes with glasses.
QuestionnairesAt baseline (September 2012, beginning of the school year),enumerators administered questionnaires to children on age,sex, glasses wear, awareness of refractive status, belief thatwearing glasses harms vision (a common misapprehension inChina13 21), boarding at school, and parental migration andeducation. A parental questionnaire asked about ownership of13 selected items as an index of family wealth. Mathematicsteachers were asked to state whether the blackboard (potentiallynot clearly seen by myopic children) was used for all, most,about half, little, or none of teaching.
Visual acuity assessmentChildren underwent baseline visual acuity screening at schoolby a nurse and trained assistant. Visual acuity was testedseparately for each eye without refraction at 4 m using earlytreatment diabetic retinopathy study charts22 (Precision Vision,La Salle, IL) in a well lighted, indoor area. These charts arepreferred in vision research because of regular progression inletter size and uniform spacing between lines. The measuredvisual acuity is based on the precise number of letters read andthus is more accurate and repeatable than with Snellen chartsemployed in routine clinical practice.If children correctly identified the orientation of at least four offive optotypes on the 6/60 line, they were examined on the 6/30line, then the 6/15 line, and then line by line to 6/3. We definedvisual acuity for an eye as the lowest line on which four of fiveoptotypes were read correctly. If the top line could not be readat 4 m, the participant was tested at 1 m and the measured visualacuity was divided by 4.
Refraction (measurement of glasses power)Children with uncorrected visual acuity ≤6/12 in either eyeunderwent cycloplegia (paralysis of accommodation (focusingat near) accompanied by pupil dilation) with up to three dropsof cyclopentolate 1% in each eye after anesthesia with topicalproparacaine hydrochloride 0.5%, to prevent inaccuraterefraction. Children then underwent automated refraction(Topcon KR 8900, Tokyo, Japan) with subjective refinementby a local refractionist, previously trained by experiencedoptometrists from Zhongshan Ophthalmic Center.
Randomization and interventionsThis was a cluster randomized, factorial design, controlled trial,with schools as the clusters. In October 2012, after the baselinesurvey and vision screening but before refraction, eligiblechildren were randomized by school to receive one of threeinterventions:
• Free spectacles, based on the child’s measured refractivepower and dispensed at school by the study optometrist.A letter with information about the free glasses programand including the child’s prescription was sent to parents.Eighty four schools were allocated to the free glasses group.
No commercial reuse: See rights and reprints http://www.bmj.com/permissions Subscribe: http://www.bmj.com/subscribe
BMJ 2014;349:g5740 doi: 10.1136/bmj.g5740 (Published 23 September 2014) Page 2 of 12
RESEARCH

• Vouchers bearing the child’s name, school, and glassesprescription, exchangeable for free glasses at the localcounty hospital, at a median distance from children’stownships of 30 km (range 1-105 km). Parents wereresponsible for paying the transportation costs. Voucherscould not be exchanged or sold, and students were requiredto produce school identification to redeem them. Childrenwhose families did not redeem their vouchers received freeglasses at study closeout, though this was not previouslyannounced. Eighty four schools were allocated to thevoucher group.
• A glasses prescription and letter to the parents informingthem of the refractive status of their child, with free glassesprovided only at closeout, although this was not previouslyannounced. Eighty four schools were allocated to thecontrol group.
Within each group, schools were randomized in October 2012to receive an educational intervention promoting spectacle wear(education group) or no education. There were six groups of 42schools in this 3×2 factorial design. Schools were stratified bythree variables, information on which was collected during thebaseline survey and screening: county; the total number ofstudents in grades 4 and 5; and the number of students failingvision screening in grades 4 and 5.Within each stratum a schoolwas randomly assigned to one of the six treatment arms.Stratification and random assignment were carried out at acentral location (Stanford University, Stanford, CA) using Rsoftware (R Foundation for Statistical Computing, Vienna,Austria).Participants (students, parents, and teachers) and enumeratorswere not informed of either the overall design of the study orthe explicit treatment arm assignment. Participants were toldonly that this was a study of vision care among rural, schoolaged children. Only one school was selected in each township,minimizing the possibility of cross arm communication andcontamination.
Educational interventionChildren at education group schools watched a 10 minutedocumentary style video and were given a booklet of cartoons,followed by a classroom discussion led by study staff. Allchildren in the selected classes, regardless of vision status,participated. These materials showed children experiencing thebenefits of glasses and teachers explaining that glasses do notharm vision. Teachers and parents viewed a presentation atschool on the safety and benefits of glasses, accompanied by abrochure with similar information, and posters with similarcontent were hung in classrooms. All materials delivered tochildren, teachers, and parents were designed to convey thesame set of messages: that myopia is common in China, thatglasses provide the safest andmost effective treatment of myopiafor children, and that wearing glasses does not harm children’seyes. Study staff returned in December 2012 to reinforce thesemessages, which were based on previous research in ruralChina.13 21 23
Outcome assessment: mathematics test andglasses wearSeparate mathematics tests appropriate for children in the fourthand fifth grades were administered on printed paper by researchstaff at baseline and closeout (May-June 2013: end of the schoolyear). Local educators assisted with the selection of questionsfrom items developed for the Trends in InternationalMathematics and Science Study (http://timss.bc.edu/home/pdf/
TP_About.pdf). The examination was timed (25 minutes) andproctored by two study enumerators at each school.Mathematicswas chosen for testing to reduce the effect of home learning onperformance and to better focus on classroom learning. Atcloseout, spectacle wear was assessed through unannounceddirect examinations. Children also described their own spectaclewear as “always,” “only for studying,” or “usually not worn.”Study staff were masked to group assignment.
Sample sizeUsing Optimal Design software,24 we determined that a samplesize of 252 schools with a minimum of 10 students for eachschool conferred 90% power, with an α of 0.05, intraclasscorrelation of 0.15, and explained variation by covariates (R2)of 0.50, to detect a difference of 0.20 standard deviations inendline math score between intervention arms and the controlgroup.
Statistical analysisWe standardized baseline and endline math score for each gradeseparately to give a mean of 0 and SD of 1 among control groupchildren at baseline. Baseline wear of glasses was defined ashaving glasses at school. We calculated family wealth bysumming the value, as reported in the China Rural HouseholdSurvey Yearbook (Department of Rural Surveys, NationalBureau of Statistics of China, 2013), of items on the list of 13owned by the family. Refractive power was defined throughoutas the spherical equivalent—that is, the spherical power plushalf the cylindrical power.All analyses were performed using Stata 12.0 (StataCorp,College Station, TX), calculating robust standard errors to adjustfor clustering by school.25 We compared randomization groupsby intention to treat using multiple linear regression, withendline math score as the main outcome for the main hypothesisand intervention arms and baseline math score as covariates.Other baseline variables were investigated as predictors for mathscore, with the final model including intervention arms andvariables associated with baseline math score at P≤0.20. Forthe intermediary hypothesis on glasses wear, the primaryoutcome was observed wear at closeout and the secondaryoutcome was self reported wear (“only for studying” or“always,” compared with “mostly not worn”). For intention totreat analyses with wear as outcome, we used generalized linearmodels with Poisson regression to estimate the relative risk forintervention arms, adjusting for baseline wear and othercovariates. We used one way analysis of variance to estimatethe intraclass correlation coefficient as a measure of clusteringof endline math score and glasses wear within school.
Missing dataTo satisfy the requirements of intention to treat analysis that allenrolled children should be included in analyses, we carried outimputation of missing data: we imputed age (n=3) using thegrade specific mean age. Missing data for spherical equivalentrefractive error (n=2) were replaced by the median sphericalequivalent for the associated level of visual acuity, and missingdata for boarding at school at baseline (yes/no) (n=3) werereplaced by the data for boarding at school at endline.We used multiple imputation in Stata as described previously26to impute several data at baseline: math score (n=1),outmigration of father (n=24), outmigration of mother (n=41),family wealth (n=145), education level of father (n=14),education of mother (n=23), and awareness of being myopic(n=20). Data imputed at endline were math score (n=125), self
No commercial reuse: See rights and reprints http://www.bmj.com/permissions Subscribe: http://www.bmj.com/subscribe
BMJ 2014;349:g5740 doi: 10.1136/bmj.g5740 (Published 23 September 2014) Page 3 of 12
RESEARCH
reported wear of glasses (n=123), and observed wear of glasses(n=123). We used linear regression for continuous variables,logistic regression for binary variables, and ordinal logisticregression for ordinal variables. For each variable we useddifferent models, selecting the independent variables based onpredictive value and availability of data. Themultiple imputationapproach created 20 copies of the data in which missing valueswere imputed by chained equations.26 Final results were obtainedby averaging these 20 datasets using Rubin’s rules, whichensured that the standard errors for all regression coefficientstook into account uncertainty in the imputations as well asuncertainty in the estimation.26
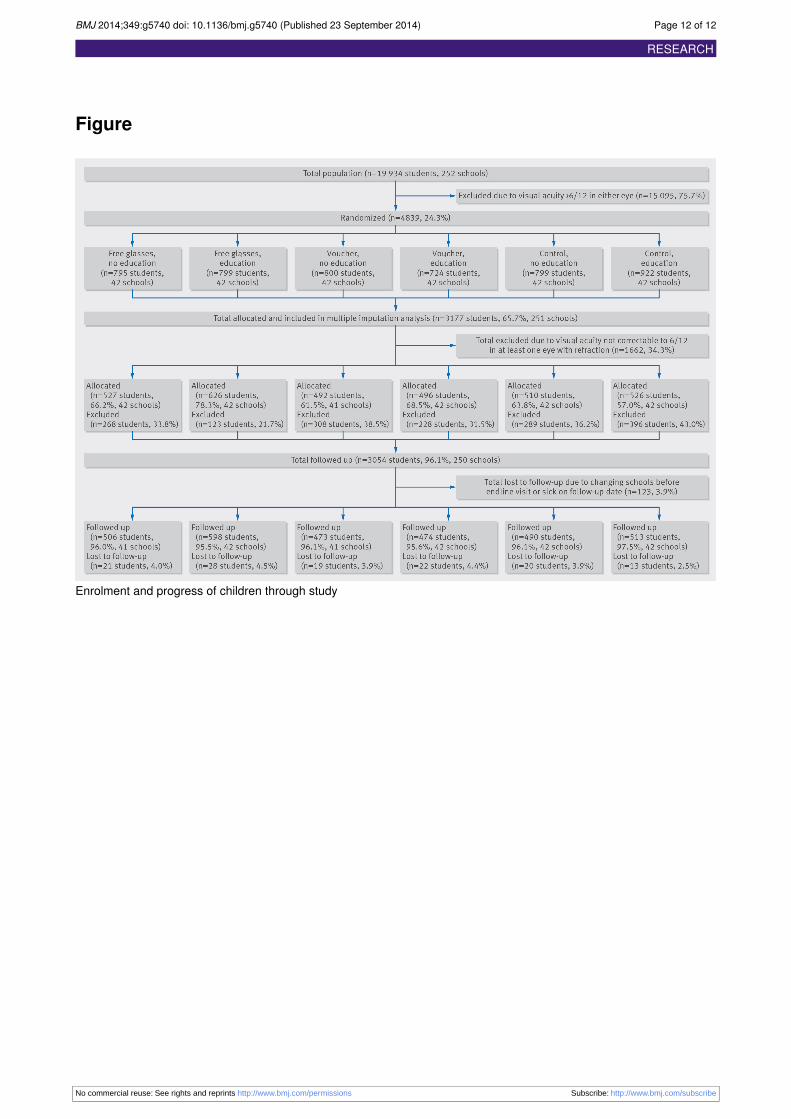
ResultsAmong 19 934 children screened at 252 selected schools, 4839(24.3%) failed visual acuity screening and were randomized(figure⇓). A total of 3177 (65.4%) children in 251 schools wereeligible for allocation (visual acuity improving with refraction);one school was excluded because there were no children at thatschool that met the inclusion criteria. The voucher group hadlower baseline math scores than the control and free glassesgroups. Tables 1⇓ and 2⇓ show the distribution of various factorsbetween groups at baseline. The supplementary figure showsthe distribution of refractive power among children allocatedin the trial.In the 251 schools, intention to treat analyses were performedon all 1036 children in the control group, 988 in the vouchergroup, and 1153 in the free glasses group. Among 123 missingchildren, 26 (21%) were at home the day of follow-up, 90 (73%)had transferred to other schools, and 7 (6%) had withdrawnfrom school. Children with follow-up did not differ in anybaseline variables from those without follow-up (data notshown).All eligible children would benefit from glasses, but only 15%wore them at baseline. At closeout the wear of glasses was 41%(observed) and 68% (self reported) in the free glasses group and26% (observed) and 37% (self reported) among controls.Table 3⇓ gives the baseline, endline, and change in themathematics score by study group. Intention to treat analysesshowed a significant difference in endline score adjusted forbaseline score of 0.11 SD (95% confidence interval 0.01 to 0.21,P=0.03) for the free glasses group and 0.04 (−0.05 to 0.14,P=0.35) for the voucher group compared with controls. Theunadjusted intraclass correlation coefficient for endline mathscore was 0.12; adjusted for baseline scores it was 0.07.In intention to treat models adjusting for baseline math score,allocation to the free glasses group, younger age, residence inShaanxi, and parental education were significantly associatedwith higher endline math score. Allocation to the voucher group,sex, refractive error, family wealth, boarding at school, andparental migration for work were unassociated with endlinescore (table 4⇓). In the full multiple model, baseline score,allocation to the free glasses group (0.10 SD, 95% confidenceinterval 0.002 to 0.19, P=0.04), younger age, and residence inShaanxi remained associated with endline score (table 4). Thisdifference between groups in testing was statistically significantbut smaller than the 0.20 SD prespecified difference that thestudy was powered to detect.In a post hoc exploratory analysis stratifying by classroom blackboard use, effect size was larger for children in classroomswhere blackboards were utilized more regularly: among 156(4.9%) children in classrooms where the blackboard was usedfor all teaching, the free glasses group scored 0.45 SD (0.11 to0.80, P=0.01) higher than controls, among 982 (31.0%) children
using the blackboard for most or all teaching, the free glassesgroup scored 0.23 SD (0.04 to 0.42, P=0.02) higher thancontrols, among 2181 (68.8%) children using the blackboardhalf or more of the time the difference was 0.14 SD (0.03 to0.26, P=0.01), and among 988 (31.2%) children receiving littleor no blackboard teaching, the difference was −0.01 (−0.17 to0.14, P=0.87).Table 5⇓ shows baseline and endline observed and self reportedglasses wear among children in the trial. The provision of bothfree glasses and vouchers increased the wearing of glassescompared with controls, as measured by both observed and selfreported wear. The educational intervention increased selfreported but not observed wear (table 5). No interaction wasfound between the glasses and education interventions on eitheroutcome. Results of analyses using multiple imputation werevery similar to results of analyses using only participants withcomplete data (data not shown).
DiscussionIn this trial, a statistically significant impact on math test scoreswas found by intention to treat analysis among Chinese childrenrandomized to receive free glasses, although this differencebetween groups was smaller than the prespecified differencethat the study was powered to detect. This effect size was alsosmaller than the difference between the voucher and free glassesgroups at baseline (0.14 SD). The observed effect size of 0.11SD is the equivalent of approximately half a semester ofadditional learning, based on a previous report27 that averageannual gains for students between the fourth and fifth gradeswas 0.4 SD. Allocation to the free glasses group had a greatereffect on math test scores than either parental education orfamily wealth and was similar to the effect of residence inmiddle income Shaanxi compared with much lower incomeGansu. The fact that effect size increased with increasingclassroom blackboard use (a post hoc analysis) adds biologicalplausibility, as reliance on blackboards created greater demandson distance vision for myopic children.The voucher intervention was explored because vouchers arelogistically easier to implement than school based distributionof glasses. We speculate that the non-significant effect on testscores in the voucher group was due to the combined influenceof slightly lower rates of glasses wear in the voucher comparedwith free glasses group, and slightly shorter opportunity forglasses wear to affect learning in the voucher group owing tothe logistics of securing spectacles (although 85% of familiesdid redeem their vouchers in the first three weeks after receivingthem).We observed a statistically significant impact of providingglasses on academic performance even though compliance withwear was imperfect. New approaches to encourage the use ofglasses may increase academic benefits of providing glasses.In a separate trial we are studying teacher incentives to promotethe use of glasses in the classroom.
Strengths and limitations of this studyStrengths of this study include population based sampling, arandomized controlled design, and high participation andfollow-up rates, all of which increase confidence in the findings.However, all schools were in rural northwest China, whichlimits external validity with reference to other populations.Other weaknesses include that is was not practical to mask theparticipants. Compliance with glasses was imperfect, and wedid not assess the day to day use of glasses, making it difficult
No commercial reuse: See rights and reprints http://www.bmj.com/permissions Subscribe: http://www.bmj.com/subscribe
BMJ 2014;349:g5740 doi: 10.1136/bmj.g5740 (Published 23 September 2014) Page 4 of 12
RESEARCH
to accurately gauge effect size among children with the mostregular wear.Two of our inclusion criteria, enrolling children already wearingglasses (n=463, 15.0%) and those with poor vision in only oneeye (n=402, 12.7%), might have decreased the effect size. Weincluded (and re-refracted) children who already wore glassesin view of reports of the poor quality of glasses in rural China.28Excluding these groups did not change our results (data notshown).
Comparison with other studiesWe searched the PubMed database in January 2014 for articlesin any language published since 1970, using the terms“correction” cross indexedwith “refractive error” and “myopia”;“school,” “educational,” and “academic”; and “impact,”“outcomes,” and “performance.” Some uncontrolled studieshave reported lower achievement scores among children withuncorrected, mostly hyperopic, refractive error,3-6 though aSingapore study of predominantly myopic children found noassociation between distance visual acuity and later academicperformance.29We found no randomized trials dealing with theimpact of correcting refractive error on school performance,nor did a recent systematic review.16
A recent unpublished review (Improving learning in primaryschools of developing countries: a meta-analysis of randomizedexperiments http://academics.wellesley.edu/Economics/mcewan/PDF/meta.pdf, accessed 17 January 2014) of randomized trialswith educational outcomes in primary schools in the developingworld listed 60 health related trials, including 22 of deworming,with a mean effect size of 0.013 SD, and 38 of nutritional ormicronutrient supplementation, with a mean effect size of 0.035SD. It would seem that the effect size on education outcomeswith the provision of glasses in this study compares favorablywith that of other health related interventions.
Conclusions and policy implicationsMyopia is common among rural Chinese children and increaseswith age.14 Even in these relatively young children, 1 in 6(15.9%) had poor vision due to refractive error. Only 15% ofthese children who needed glasses had them, and the numberusing glasses could be nearly doubled by providing them freecompared with giving a prescription (table 4). Data from ourbaseline survey showed that among children who owned glassesthe median price paid was approximately $60. This representsnearly half the monthly income for rural families in China, $130in 2012.30While cost is a major barrier for families in obtainingglasses, high quality spectacles can be purchased in bulk forless than $5, which wouldmake them affordable for governmentprograms. In fact, as a result of this project, pilot programs havenow started in Shaanxi and Gansu Provinces to provide freeglasses to children, with the possibility of expansion ifsuccessful.China’s rural health insurance system (the New CooperativeMedical Scheme) covered 96% of rural dwellers by 2011,31 andhas begun experimenting in limited areas with providing freeglasses. Results of our trial suggest this inexpensive interventioncan increase academic outcomes to a statistically significantextent. The amount of the effect on testing outcomes was lessthan the prespecified size our study was designed to detect, butis greater in classrooms where blackboards are used extensively.As an important reason for non-wear of glasses in China is thewidespread perception that wearing glasses can harm children’svision,13 32 we will present data in a separate paper on the effect
of providing glasses on one year change in uncorrected visualacuity.
Contributors: XCM and SR designed the study, collected and analyzedthe data, and revised the manuscript. ZQZ, HMY, YJS, and QYCcollected the data and revised the manuscript. XPP, MGH, and YLdesigned the study and revised themanuscript. MEM and SlC analyzedthe data and revised the manuscript. NC designed the study, collectedand analyzed the data, and wrote the manuscript. He is guarantor. Allof the authors had full access to all of the data in the study and takeresponsibility for the integrity of the data and the accuracy of the dataanalysis.Funding: This study was funded by OneSight (Mason, OH),Luxottica-China (Shanghai), Essilor-China(Shanghai), CLSA (AsiaPacific Markets; Hong Kong), Charity Aid Foundation (Sydney), and ananonymous donor (Hong Kong). NC is supported by a Thousand ManPlan grant from the Chinese government. The study sponsors had norole in study design; the collection, analysis, and interpretation of data;the writing of the report; or the decision to submit the paper forpublication.Competing interests: All authors have completed the ICMJE uniformdisclosure form at www.icmje.org/coi_disclosure.pdf and declare: thefree glasses used in this study were supplied by OneSight,Luxottica-China, and Essilor-China, producers of frames and lenses inChina who also provided financial support for the study; the authorshave no other financial relationships with any organisations that mighthave an interest in the submitted work in the previous three years; andno other relationships or activities that could appear to have influencedthe submitted work.Ethical approval: This study was approved by the institutional reviewboards at Stanford University (Palo Alto, USA) and the ZhongshanOphthalmic Center (Guangzhou, China). Permission was received fromlocal boards of education in each region and the principals of all schools.The presented data are anonymized and risk of identification is low.The principles of the Declaration of Helsinki were followed throughout.Data sharing: The full dataset and statistical code are available at www.stanford.edu/REAP with open access.Transparency: NC (the manuscript’s guarantor) affirms that themanuscript is an honest, accurate, and transparent account of the studybeing reported; that no important aspects of the study have been omitted;and that any discrepancies from the study as planned (and, if relevant,registered) have been explained.
1 Dimension of Disability in India, chapter 4, table 4.3 (b). 2013. http://mospi.nic.in/Mospi_New/upload/disablity_india_statistical_data_11mar2011/Chapter%204-Dimension_Disability.pdf.
2 Resnikoff S, Pascolini D, Mariotti SP, Pokharel GP. Global magnitude of visual impairmentcaused by uncorrected refractive errors in 2004. Bull World Health Organ 2008;86:63-70.
3 Krumholtz I. Results from a pediatric vision screening and its ability to predict academicperformance. Optometry 2000;71:426-30.
4 Atkinson J, Anker S, Nardini M, Braddick O, Hughes C, Rae S, Wattam-Bell J, AtkinsonS. Infant vision screening predicts failure on motor and cognitive tests up to school age.Strabismus 2002;10:187-98.
5 WilliamsWR, Latif AH, Hannington L, Watkins DR. Hyperopia and educational attainmentin a primary school cohort. Arch Dis Childhood 2005;90:150-3.
6 Roch-Levecq AC, Brody BL, Thomas RG, Brown SI. Ametropia, preschoolers’ cognitiveabilities, and effects of spectacle correction. Arch Ophthalmol 2008;126:252-8.
7 Johnson R, Nottingham D, Stratton R, Zaba J. The vision screening of academically andbehaviorally at-risk pupils. J Behavioral Optom 1996;7:39-42.
8 HeM, Zeng J, Liu Y, Xu J, Pokharel GP, Ellwein LB. Refractive error and visual impairmentin urban children in southern China. Invest Ophthalmol Vis Sci 2004;45:793-9.
9 He M, Huang W, Zheng Y, Huang L, Ellwein LB. Refractive error and visual impairmentin school children in rural southern China. Ophthalmology 2007;114:374-82.
10 Murthy GV, Gupta SK, Ellwein LB, Muñoz SR, Pokharel GP, Sanga L, et al. Refractiveerror in children in an urban population in New Delhi. Invest Ophthalmol Vis Sci2002;43:623-31.
11 Congdon NG, Wang Y, Song Y, Choi K, Zhang M, Zhou Z, et al. Visual disability, visualfunction andmyopia among rural Chinese secondary school children: the Xichang PediatricRefractive Error Study (X-PRES) Report #1. Invest Ophthalmol Vis Sci 2008;49:2888-94.
12 Wu HM, Seet B, Yap EP, Saw SM, Lim TH, Chia KS. Does education explain ethnicdifferences in myopia prevalence? A population-based study of young adult males inSingapore. Optom Vis Sci 2001;78:234-9.
No commercial reuse: See rights and reprints http://www.bmj.com/permissions Subscribe: http://www.bmj.com/subscribe
BMJ 2014;349:g5740 doi: 10.1136/bmj.g5740 (Published 23 September 2014) Page 5 of 12
RESEARCH

What is already known on this topic
Studies have shown that reading can be improved in children after refractive correction of hyperopia but the impact of myopia (nearsightedness) on classroom learning is not well understoodHigher scholastic achievement may increase the risk of myopia, so the direction of cause and effect between myopia and schoolattainment is not clearNo randomized trials have assessed the impact of myopia on academic achievement or determined the direction of any cause and effect
What this study adds
By intention to treat analysis, children randomized to receive glasses over a school year had statistically significantly higher scores ona mathematics test than control children, though the observed disparity was smaller than the prespecified difference that the study waspowered to detectThese effects were seen despite the fact that many children randomized to receive glasses did not wear them, and spectacle wearincreased even among control children as a result of our study activitiesEffect size increased with increasing blackboard use during teaching. This is biologically plausible owing to greater demands on distancevision in myopic children, and of practical importance in areas such as rural China where blackboards are widely used because of lackof money for textbooks
13 Congdon N, Zheng MW, Sharma A, Choi K, Song Y, Zhang MZ, et al. Prevalence anddeterminants of spectacle nonwear among rural Chinese secondary schoolchildren: theXichang Pediatric Refractive Error Study report 3. Arch Ophthalmol 2008;126:1717-23.
14 Morgan IG, Ohno-Matsui K, Saw SM. Myopia. Lancet 2012;379:1739-48.15 Sharma A, Congdon N, Patel M, Gilbert C. School-based approaches to correction of
refractive error in children. Surv Ophthalmol 2012;57:272-83.16 Mathers M, Keyes M, Wright M. A review of the evidence on the effectiveness of children’s
vision screening. Child Care Health Dev 2010;36:756-80.17 Baidu Encyclopedi. Article on Tianshui. 2013. http://baike.baidu.com/view/14548.htm. [In
Chinese.]18 Wikipedia list of Chinese administrative divisions by GDP per capita in 2012. http://en.
wikipedia.org/wiki/List_of_Chinese_administrative_divisions_by_GDP_per_capita.19 Baidu Encyclopedia. Article on Yulin. 2013. http://baike.baidu.com/view/52250.htm. [In
Chinese.]20 Congdon N, Patel N, Esteso P, Chikwembani F, Webber F, Msithini R, et al. The
association between refractive cutoffs for spectacle provision and visual improvementamong school-aged children in South Africa. Br J Ophthalmol 2008;92:13-8.
21 Li L, Lam J, Lu Y, Ye Y, Lam DS, Gao Y, et al. Attitudes of students, parents, and teacherstowards glasses use in rural China. Arch Ophthalmol 2010;128:759-65.
22 Ferris FL 3rd, Kassoff A, Bresnick GH, Bailey I. New visual acuity charts for clinicalresearch. Am J Ophthalmol 1982;94:91-6.
23 Congdon N, Li L, Zhang M, Yang A, Gao Y, Griffiths S, et al. Randomized, controlled trialof an educational intervention to promote spectacle use in rural China: the See Well toLearn Well Study. Ophthalmology 2011;118:2343-50.
24 Optimal Design Software for Multi-level and Longitudinal Research (Version 3.01). 2011.www.wtgrantfoundation.org.
25 Zou G. A modified Poisson regression approach to prospective studies with binary data.Am J Epidemiol 2004;159:702-6.
26 Royston P. Multiple imputation of missing values. Stata J 2004:227-41.27 Hill CJ, Bloom HS, Black R, Lipsey MW. Empirical benchmarks for interpreting effect sizes
in research. MDRC working papers on research methodology. 2014. www.mdrc.org/publications/459/full.pdf.
28 Zhang MZ, Lv H, Gao Y, Griffiths S, Sharma A, Lam DSC, et al. Visual morbidity due toinaccurate spectacles among school-children in rural China: the See Well to Learn WellProject, Report #1. Invest Ophthalmol Vis Sci 2009;50:2011-7.
29 Dirani M, Zhang X, Goh LK, Young TL, Lee P, Saw SM. The role of vision in academicschool performance. Ophthalmic Epidemiol 2010;17:18-24.
30 Survey in China shows a wide gap in income. 2014. www.nytimes.com/2013/07/20/world/asia/survey-in-china-shows-wide-income-gap.html.
31 Liang X, Guo H, Jin C, Peng X, Zhang X. The effect of New Cooperative Medical Schemeon health outcomes and alleviating catastrophic health expenditure in China: a systematicreview. PLoS One 2012;7:e40850.
32 Li L, Lam J, Lu Y, Ye Y, Lam DS, Gao Y, et al. Attitudes of students, parents, and teacherstowards glasses use in rural China. Arch Ophthalmol 2010;128:759-65.
Accepted: 6 September 2014
Cite this as: BMJ 2014;349:g5740This is an Open Access article distributed in accordance with the Creative CommonsAttribution Non Commercial (CC BY-NC 3.0) license, which permits others to distribute,remix, adapt, build upon this work non-commercially, and license their derivative workson different terms, provided the original work is properly cited and the use isnon-commercial. See: http://creativecommons.org/licenses/by-nc/3.0/.
No commercial reuse: See rights and reprints http://www.bmj.com/permissions Subscribe: http://www.bmj.com/subscribe
BMJ 2014;349:g5740 doi: 10.1136/bmj.g5740 (Published 23 September 2014) Page 6 of 12
RESEARCH
Tables
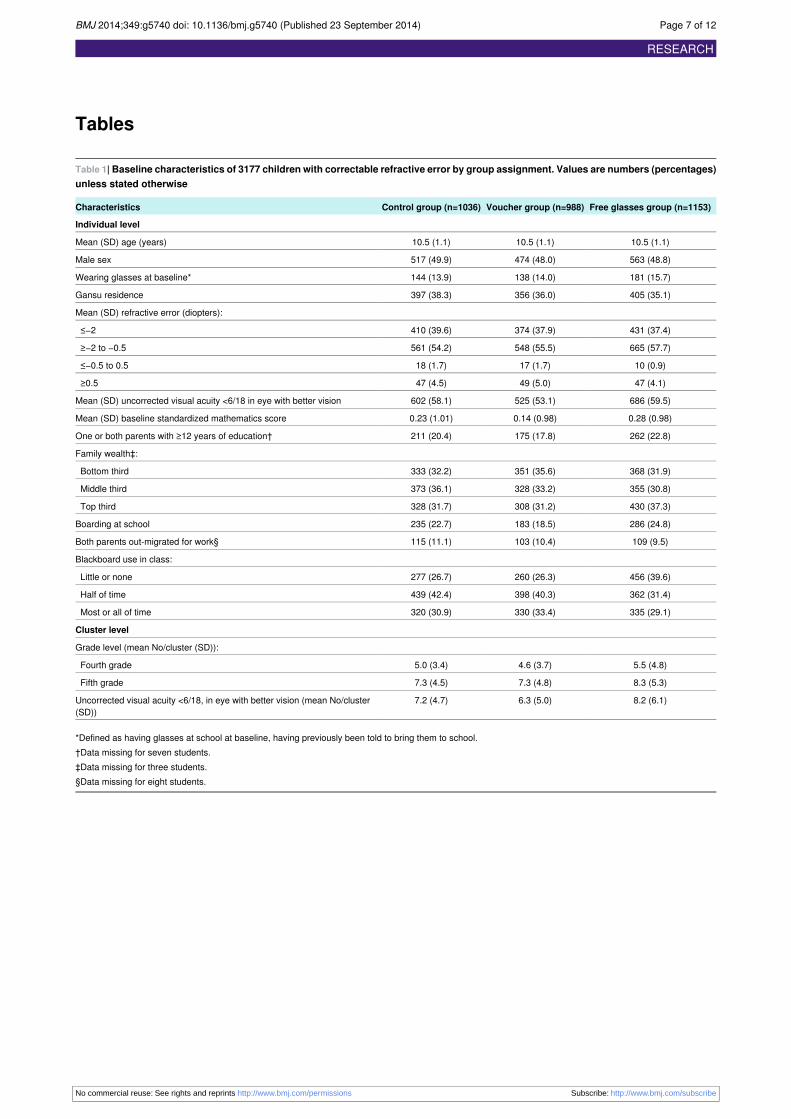
Table 1| Baseline characteristics of 3177 children with correctable refractive error by group assignment. Values are numbers (percentages)unless stated otherwise
Free glasses group (n=1153)Voucher group (n=988)Control group (n=1036)Characteristics
Individual level
10.5 (1.1)10.5 (1.1)10.5 (1.1)Mean (SD) age (years)
563 (48.8)474 (48.0)517 (49.9)Male sex
181 (15.7)138 (14.0)144 (13.9)Wearing glasses at baseline*
405 (35.1)356 (36.0)397 (38.3)Gansu residence
Mean (SD) refractive error (diopters):
431 (37.4)374 (37.9)410 (39.6)≤−2
665 (57.7)548 (55.5)561 (54.2)≥−2 to −0.5
10 (0.9)17 (1.7)18 (1.7)≤−0.5 to 0.5
47 (4.1)49 (5.0)47 (4.5)≥0.5
686 (59.5)525 (53.1)602 (58.1)Mean (SD) uncorrected visual acuity <6/18 in eye with better vision
0.28 (0.98)0.14 (0.98)0.23 (1.01)Mean (SD) baseline standardized mathematics score
262 (22.8)175 (17.8)211 (20.4)One or both parents with ≥12 years of education†
Family wealth‡:
368 (31.9)351 (35.6)333 (32.2)Bottom third
355 (30.8)328 (33.2)373 (36.1)Middle third
430 (37.3)308 (31.2)328 (31.7)Top third
286 (24.8)183 (18.5)235 (22.7)Boarding at school
109 (9.5)103 (10.4)115 (11.1)Both parents out-migrated for work§
Blackboard use in class:
456 (39.6)260 (26.3)277 (26.7)Little or none
362 (31.4)398 (40.3)439 (42.4)Half of time
335 (29.1)330 (33.4)320 (30.9)Most or all of time
Cluster level
Grade level (mean No/cluster (SD)):
5.5 (4.8)4.6 (3.7)5.0 (3.4)Fourth grade
8.3 (5.3)7.3 (4.8)7.3 (4.5)Fifth grade
8.2 (6.1)6.3 (5.0)7.2 (4.7)Uncorrected visual acuity <6/18, in eye with better vision (mean No/cluster(SD))
*Defined as having glasses at school at baseline, having previously been told to bring them to school.†Data missing for seven students.‡Data missing for three students.§Data missing for eight students.
No commercial reuse: See rights and reprints http://www.bmj.com/permissions Subscribe: http://www.bmj.com/subscribe
BMJ 2014;349:g5740 doi: 10.1136/bmj.g5740 (Published 23 September 2014) Page 7 of 12
RESEARCH
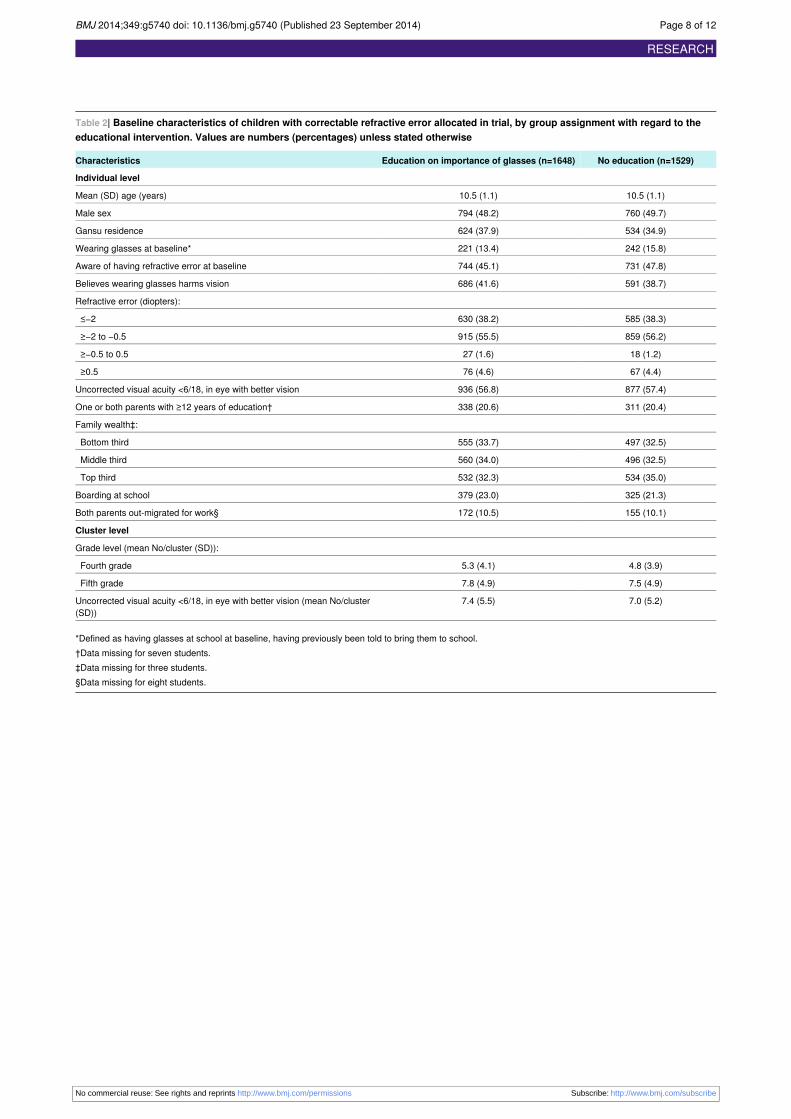
Table 2| Baseline characteristics of children with correctable refractive error allocated in trial, by group assignment with regard to theeducational intervention. Values are numbers (percentages) unless stated otherwise
No education (n=1529)Education on importance of glasses (n=1648)Characteristics
Individual level
10.5 (1.1)10.5 (1.1)Mean (SD) age (years)
760 (49.7)794 (48.2)Male sex
534 (34.9)624 (37.9)Gansu residence
242 (15.8)221 (13.4)Wearing glasses at baseline*
731 (47.8)744 (45.1)Aware of having refractive error at baseline
591 (38.7)686 (41.6)Believes wearing glasses harms vision
Refractive error (diopters):
585 (38.3)630 (38.2)≤−2
859 (56.2)915 (55.5)≥−2 to −0.5
18 (1.2)27 (1.6)≥−0.5 to 0.5
67 (4.4)76 (4.6)≥0.5
877 (57.4)936 (56.8)Uncorrected visual acuity <6/18, in eye with better vision
311 (20.4)338 (20.6)One or both parents with ≥12 years of education†
Family wealth‡:
497 (32.5)555 (33.7)Bottom third
496 (32.5)560 (34.0)Middle third
534 (35.0)532 (32.3)Top third
325 (21.3)379 (23.0)Boarding at school
155 (10.1)172 (10.5)Both parents out-migrated for work§
Cluster level
Grade level (mean No/cluster (SD)):
4.8 (3.9)5.3 (4.1)Fourth grade
7.5 (4.9)7.8 (4.9)Fifth grade
7.0 (5.2)7.4 (5.5)Uncorrected visual acuity <6/18, in eye with better vision (mean No/cluster(SD))
*Defined as having glasses at school at baseline, having previously been told to bring them to school.†Data missing for seven students.‡Data missing for three students.§Data missing for eight students.
No commercial reuse: See rights and reprints http://www.bmj.com/permissions Subscribe: http://www.bmj.com/subscribe
BMJ 2014;349:g5740 doi: 10.1136/bmj.g5740 (Published 23 September 2014) Page 8 of 12
RESEARCH
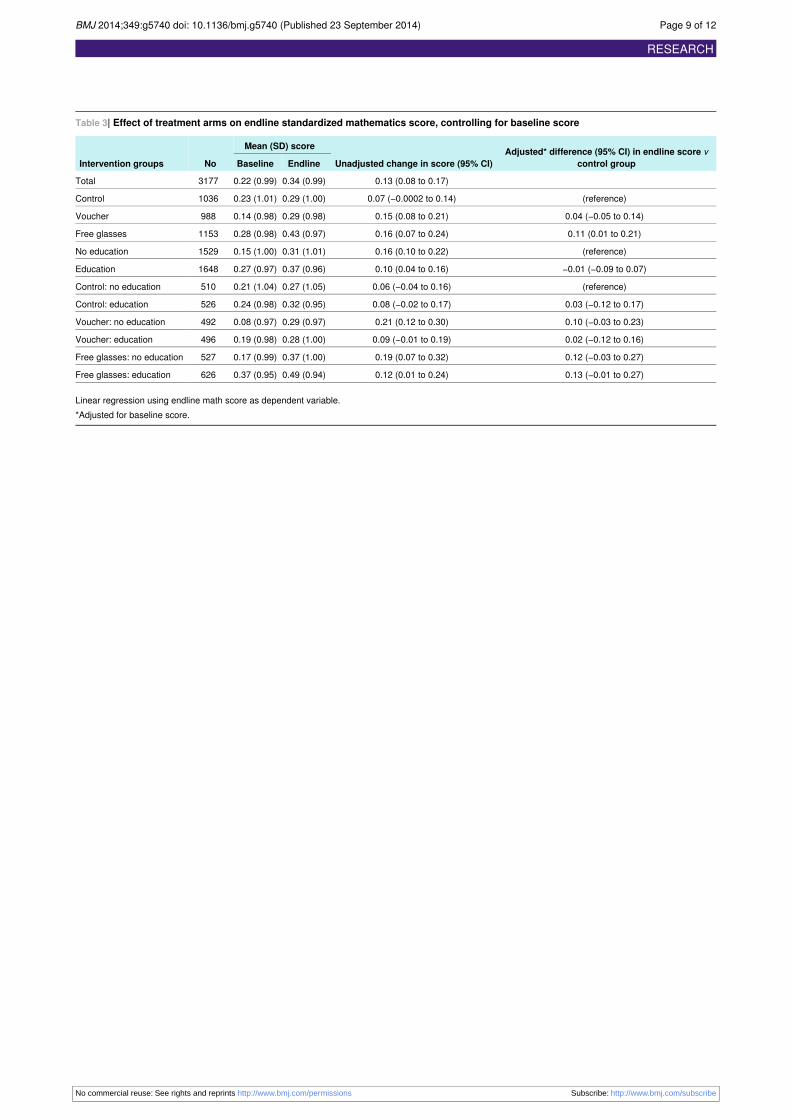
Table 3| Effect of treatment arms on endline standardized mathematics score, controlling for baseline score
Adjusted* difference (95% CI) in endline score vcontrol groupUnadjusted change in score (95% CI)
Mean (SD) score
NoIntervention groups EndlineBaseline
0.13 (0.08 to 0.17)0.34 (0.99)0.22 (0.99)3177Total
(reference)0.07 (−0.0002 to 0.14)0.29 (1.00)0.23 (1.01)1036Control
0.04 (−0.05 to 0.14)0.15 (0.08 to 0.21)0.29 (0.98)0.14 (0.98)988Voucher
0.11 (0.01 to 0.21)0.16 (0.07 to 0.24)0.43 (0.97)0.28 (0.98)1153Free glasses
(reference)0.16 (0.10 to 0.22)0.31 (1.01)0.15 (1.00)1529No education
−0.01 (−0.09 to 0.07)0.10 (0.04 to 0.16)0.37 (0.96)0.27 (0.97)1648Education
(reference)0.06 (−0.04 to 0.16)0.27 (1.05)0.21 (1.04)510Control: no education
0.03 (−0.12 to 0.17)0.08 (−0.02 to 0.17)0.32 (0.95)0.24 (0.98)526Control: education
0.10 (−0.03 to 0.23)0.21 (0.12 to 0.30)0.29 (0.97)0.08 (0.97)492Voucher: no education
0.02 (−0.12 to 0.16)0.09 (−0.01 to 0.19)0.28 (1.00)0.19 (0.98)496Voucher: education
0.12 (−0.03 to 0.27)0.19 (0.07 to 0.32)0.37 (1.00)0.17 (0.99)527Free glasses: no education
0.13 (−0.01 to 0.27)0.12 (0.01 to 0.24)0.49 (0.94)0.37 (0.95)626Free glasses: education
Linear regression using endline math score as dependent variable.*Adjusted for baseline score.
No commercial reuse: See rights and reprints http://www.bmj.com/permissions Subscribe: http://www.bmj.com/subscribe
BMJ 2014;349:g5740 doi: 10.1136/bmj.g5740 (Published 23 September 2014) Page 9 of 12
RESEARCH

Table 4| Linear regression model of potential predictors of endline math score
Full model† (n=3169)Model adjusted for baseline math score (n=3177)
Characteristics P valueRegression coefficient (95%
CI)P valueRegression coefficient* (95% CI)
<0.0010.56 (0.53 to 0.59)<0.0010.59 (0.57 to 0.62)Baseline standardized mathematicsscore (SD)
Intervention group (control group asreference)
0.420.04 (−0.05 to 0.13)0.350.04 (−0.05 to 0.14)Voucher
0.040.10 (0.002 to 0.19)0.030.11 (0.01 to 0.21)Free glasses
<0.001−0.14 (−0.17 to −0.11)<0.001−0.14 (−0.17 to −0.11)Age (years)
——0.58−0.02 (−0.07 to 0.04)Male sex
——0.250.05 (−0.03 to 0.12)Wearing glasses at baseline
0.003−0.13 (−0.22 to −0.04)<0.001−0.17 (−0.25 to −0.08)Gansu residence
Refractive error (≥−0.5 D to 0.5 D asreference):
——0.370.14 (−0.16 to 0.43)≤−2 D
——0.540.10 (−0.21 to 0.40)−2 D to −0.5 D
——0.450.12 (−0.19 to 0.43)≥0.5 D
0.400.03 (−0.04 to 0.09)0.030.07 (0.008 to 0.13)One or both parents with ≥12 yearsof education‡
Family wealth (poorest third asreference)§:
0.380.03 (−0.04 to 0.10)0.110.06 (−0.01 to 0.13)Middle third
0.830.01 (−0.06 to 0.08)0.050.07 (0.001 to 0.14)Top third
0.490.03 (−0.05 to 0.11)0.200.05 (−0.03 to 0.14)Boarding at school
——0.680.02 (−0.07 to 0.11)Both parents out-migrated for work¶
D=diopter.*Except for regression coefficient for baseline math score (simple regression), coefficients for different variables are for multiple models with endline math scoreas dependent variable, adjusted for baseline math score.†Including variables associated with endline math score P<0.20 in model also including baseline math score.‡Data missing for seven students.§Data missing for three students.¶Data missing for eight students.
No commercial reuse: See rights and reprints http://www.bmj.com/permissions Subscribe: http://www.bmj.com/subscribe
BMJ 2014;349:g5740 doi: 10.1136/bmj.g5740 (Published 23 September 2014) Page 10 of 12
RESEARCH
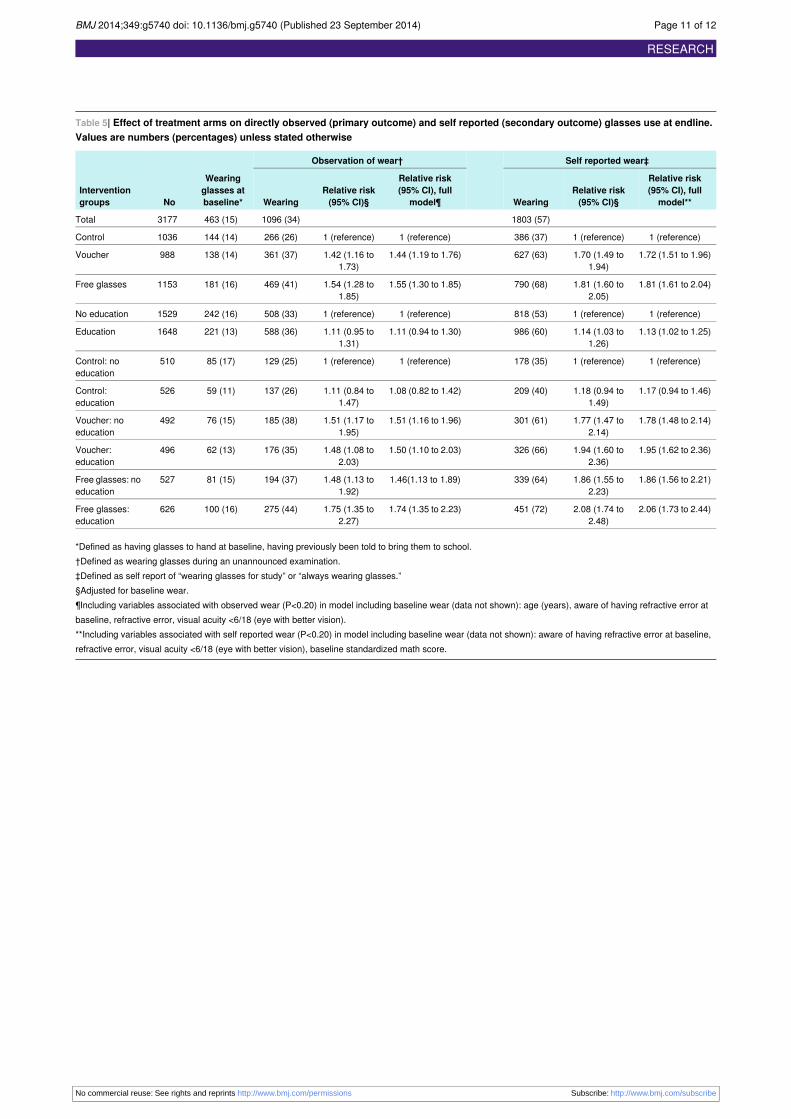
Table 5| Effect of treatment arms on directly observed (primary outcome) and self reported (secondary outcome) glasses use at endline.Values are numbers (percentages) unless stated otherwise
Self reported wear‡Observation of wear†
Wearingglasses atbaseline*No
Interventiongroups
Relative risk(95% CI), fullmodel**
Relative risk(95% CI)§Wearing
Relative risk(95% CI), full
model¶Relative risk(95% CI)§Wearing
1803 (57)1096 (34)463 (15)3177Total
1 (reference)1 (reference)386 (37)1 (reference)1 (reference)266 (26)144 (14)1036Control
1.72 (1.51 to 1.96)1.70 (1.49 to1.94)
627 (63)1.44 (1.19 to 1.76)1.42 (1.16 to1.73)
361 (37)138 (14)988Voucher
1.81 (1.61 to 2.04)1.81 (1.60 to2.05)
790 (68)1.55 (1.30 to 1.85)1.54 (1.28 to1.85)
469 (41)181 (16)1153Free glasses
1 (reference)1 (reference)818 (53)1 (reference)1 (reference)508 (33)242 (16)1529No education
1.13 (1.02 to 1.25)1.14 (1.03 to1.26)
986 (60)1.11 (0.94 to 1.30)1.11 (0.95 to1.31)
588 (36)221 (13)1648Education
1 (reference)1 (reference)178 (35)1 (reference)1 (reference)129 (25)85 (17)510Control: noeducation
1.17 (0.94 to 1.46)1.18 (0.94 to1.49)
209 (40)1.08 (0.82 to 1.42)1.11 (0.84 to1.47)
137 (26)59 (11)526Control:education
1.78 (1.48 to 2.14)1.77 (1.47 to2.14)
301 (61)1.51 (1.16 to 1.96)1.51 (1.17 to1.95)
185 (38)76 (15)492Voucher: noeducation
1.95 (1.62 to 2.36)1.94 (1.60 to2.36)
326 (66)1.50 (1.10 to 2.03)1.48 (1.08 to2.03)
176 (35)62 (13)496Voucher:education
1.86 (1.56 to 2.21)1.86 (1.55 to2.23)
339 (64)1.46(1.13 to 1.89)1.48 (1.13 to1.92)
194 (37)81 (15)527Free glasses: noeducation
2.06 (1.73 to 2.44)2.08 (1.74 to2.48)
451 (72)1.74 (1.35 to 2.23)1.75 (1.35 to2.27)
275 (44)100 (16)626Free glasses:education
*Defined as having glasses to hand at baseline, having previously been told to bring them to school.†Defined as wearing glasses during an unannounced examination.‡Defined as self report of “wearing glasses for study” or “always wearing glasses.”§Adjusted for baseline wear.¶Including variables associated with observed wear (P<0.20) in model including baseline wear (data not shown): age (years), aware of having refractive error atbaseline, refractive error, visual acuity <6/18 (eye with better vision).**Including variables associated with self reported wear (P<0.20) in model including baseline wear (data not shown): aware of having refractive error at baseline,refractive error, visual acuity <6/18 (eye with better vision), baseline standardized math score.
No commercial reuse: See rights and reprints http://www.bmj.com/permissions Subscribe: http://www.bmj.com/subscribe
BMJ 2014;349:g5740 doi: 10.1136/bmj.g5740 (Published 23 September 2014) Page 11 of 12
RESEARCH
Figure
Enrolment and progress of children through study
No commercial reuse: See rights and reprints http://www.bmj.com/permissions Subscribe: http://www.bmj.com/subscribe
BMJ 2014;349:g5740 doi: 10.1136/bmj.g5740 (Published 23 September 2014) Page 12 of 12
RESEARCH