effect of pedestrian-oriented design benefits to land value · effect of pedestrian-oriented design...
TRANSCRIPT

Effect of pedestrian-oriented design benefits to land value
C.-N. Li1 & Y.-K. Hsieh2 1Department of Natural Resources, Chinese Culture University, Taiwan 2Graduate Institute of Architecture and Urban Design, Chinese Culture University, Taiwan
Abstract
The widespread use of private vehicles has caused urban sprawl leading to increasingly serious global warming, climate anomalies and energy shortages, and road construction cannot have unlimited expansion. Therefore, all countries regard Transit-oriented Development (TOD) as a coping strategy. However, up to now, it has been found, gradually, that many of the benefits of TOD development are difficult to achieve. Accordingly, this research focuses on the key contexts and development effectiveness of TOD planning and firstly through the way of literature review to identify the represent variables, use hierarchical linear model (HLM), regard Taipei metropolitan area as the object of empirical study, discuss the relationship of TOD planning efficiency with land price. This study found that the TOD features of “travel times”, “bus node number”, the “total area of parks”, “number of stores” and “number of land use zoning” are closely associated with land value. The analysis results can serve as the reference for the MRT construction to work out the planning strategy. Keywords: transit-oriented development, land prices, urban design benefit, hierarchical linear analysis.
1 Introduction
With the widespread use of private motor vehicles and large amounts of carbon dioxide emission, global warming, climate anomalies and energy shortages are increasingly serious, which also gradually makes the world aware of the potential crisis. As the result, in early 1990, advanced countries in Europe developed new urbanism into the planning and design idea of transit-oriented
Public Mobility Systems 137
www.witpress.com, ISSN 1755-8336 (on-line) WIT Transactions on State of the Art in Science and Engineering, Vol 78, © 2014 WIT Press
doi:10.2495/978-1-84564-908-1/013
development (TOD). Up to now, TOD has become a new urban mode of land using and transportation integration [1] and various empirical cases showed that the TOD development can bring about a lot of achievements. But in fact, is TOD planning really bringing huge benefits? Through solid evidence in the four major cities of Miami, San Francisco, Washington and Portland, it has be verified that expectations of TOD development like reducing the financial burden and problems arising from TOD developing, as well as a lot of expected interests, are all difficult to achieve. Seeing from the current construction and planning of Taipei MRT, the total amount of construction funds is 277 billion NTD, in which the vast land costs have not been included. However, what should be questioned is that, the related researches in the past more than ten years, have demonstrated that TOD is positive for the public transport journeys, and the rest related benefits are still lack of empirical research, but today’s transportation engineering construction cost prefers to use the concept of land development gains and tax increment financing mechanisms (tax increment financing, TIF), attempting to monetize the overall development benefit around the station and classify it as the effect of TOD, and collecting tax levy of external benefit produced by the TOD area in the future. With no full confirmation of benefits, nor related empirical research on how much contribution of TIF collect tax comes from the achievements of TOD, the benefits of TOD have been excessively expected and up-surged under the help of billow of climate change, and the cost of financial injections is also increasingly high, which is likely to become a big concern in the future urban development. This study found that the same issue is to be facing no matter in the TOD development process of America or the implementation of TOD planning concept in Taiwan. But fortunately, not only Taiwan city is suitable for implementing TOD concept, but as Taipei MRT has opened for about 20 years, the benefits of long-term essence and unsubstantial benefits are also in preparation. However, in addition to improving the public transport journeys, if there is no related empirical research test whether the relationship between the efficiency produced and self-liquidating exists, TOD’s planning objectives will be just a vision that unable to be implemented, and whether today’s TOD planning method is reasonable still can’t be inspected. Therefore, this study focuses on the TOD development effectiveness, and through a large number of domestic and foreign literature review, attempts to summarize the TOD development context to deeply explore the TOD overall efficiency presentation, and then discuss the relationship between these efficiency and land value so as to find out the key influence factors. This article will be divided into the following paragraphs to discuss, (1) summarize a TOD represent variables by literature review; (2) research design: use hierarchical linear model (HLM), dividing it into administrative region range and the range of TOD area in order to research the relationship between TOD planning efficiency in Taipei metropolitan area and land price; (3) empirical analysis: take in the statistical data to examine whether variables can be reflected on the land value; (4) work out the development strategy according to the results of analysis; (5) the
138 Public Mobility Systems
www.witpress.com, ISSN 1755-8336 (on-line) WIT Transactions on State of the Art in Science and Engineering, Vol 78, © 2014 WIT Press
research results can serve as reference of the planning units when providing planning strategy.
2 Literature review
From the above issues, this study firstly bases on the 5D planning and design concept of TOD, comprehensively organizes the development benefits that can be produced for the follow-up study of the influence with the self-liquidating effect; and discusses the difference between Hierarchical Linear modeling (HLM for short) and general regression model, to examine whether the assumption in our study of hierarchical relations is a success; finally summarizes representative research variables from the literatures, to preliminarily discuss whether the variables can reflect the relationship between the benefit and self-liquidating for the model operation and the empirical analysis using in this research. Land value is based on traffic accessibility, but the relationship between investment benefits brought by transportation and land added value generated by is still lack of proper evaluation [2]. However, the research result of Xiaosu and Hong [3] confirmed the interaction between TOD development and real estate development, where TOD walking environment is positively related to the surrounding housing prices, such as reducing 5 minutes walking distance, the land value around stations will increase by 9.3%, which accords with the Mathur and Ferrell [4] study that every 50% reduction of the distance between TOD and residential, the average housing sales price will increase 3.2%, and that the price of TOD will increase by 18.5% with the forming of environment, all the results showed the impact of TOD on housing prices will decline rapidly with distance. In addition, the TOD development can bring additional benefits, as pointed out by the Ratner and Goetz [5] study that, Denver, relying on the car and road transportation, was led to the development of suburbanization and low density, which caused a sharp decline of urban population (fell to only 25% in 1990), but Denver began to develop toward TOD mode since 1997, and by 2010, the high density development brought about by TOD, has made Denver create nearly 18,000 residential suites, 490,000 m2 business area, 520,000 m2 office space, and 570,000 m2 medical space. Thus, benefits produced by TOD development mode can effectively promote the development of the region, and drive the local real estate appreciation, thereby increase fiscal levy, to achieve the virtuous cycle of investment and self-liquidating (Figure 1). Therefore, it is necessary to carefully assess TOD area development effectiveness, contribution brought about by improving land value [6, 7], actively review the increased land value after improving accessibility. Especially when in metropolitan areas, it can effectively promote the economic and social development according to the land value influence, to make resources fully utilized, and promote the city towards close development, so as to reduce car use, and then form sustainable development [8–10]. TOD produces benefits Produce self-liquidating effect The pedestrian-oriented Urban design Business aggregation and local economic development Convenient traffic and improvement in pedestrian accessibility Improvement in
Public Mobility Systems 139
www.witpress.com, ISSN 1755-8336 (on-line) WIT Transactions on State of the Art in Science and Engineering, Vol 78, © 2014 WIT Press
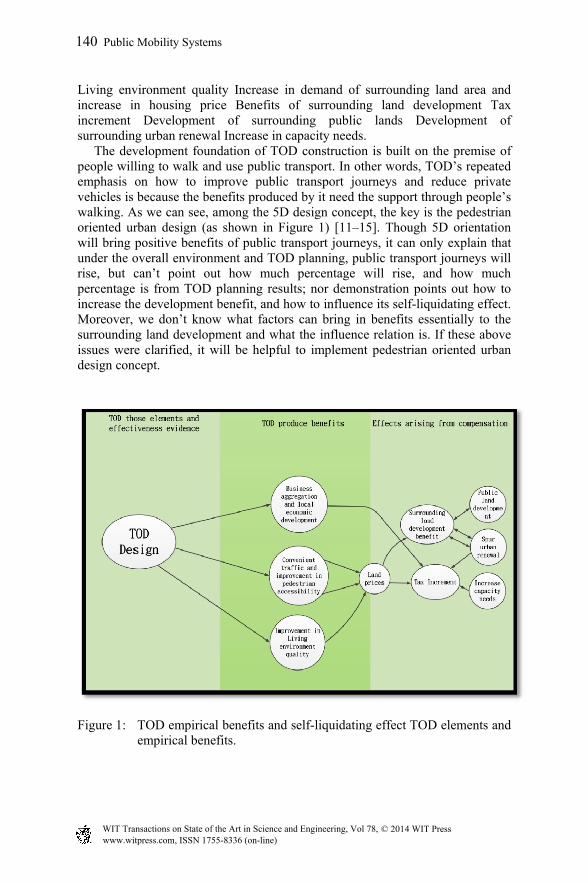
Living environment quality Increase in demand of surrounding land area and increase in housing price Benefits of surrounding land development Tax increment Development of surrounding public lands Development of surrounding urban renewal Increase in capacity needs. The development foundation of TOD construction is built on the premise of people willing to walk and use public transport. In other words, TOD’s repeated emphasis on how to improve public transport journeys and reduce private vehicles is because the benefits produced by it need the support through people’s walking. As we can see, among the 5D design concept, the key is the pedestrian oriented urban design (as shown in Figure 1) [11–15]. Though 5D orientation will bring positive benefits of public transport journeys, it can only explain that under the overall environment and TOD planning, public transport journeys will rise, but can’t point out how much percentage will rise, and how much percentage is from TOD planning results; nor demonstration points out how to increase the development benefit, and how to influence its self-liquidating effect. Moreover, we don’t know what factors can bring in benefits essentially to the surrounding land development and what the influence relation is. If these above issues were clarified, it will be helpful to implement pedestrian oriented urban design concept.
Figure 1: TOD empirical benefits and self-liquidating effect TOD elements and empirical benefits.
140 Public Mobility Systems
www.witpress.com, ISSN 1755-8336 (on-line) WIT Transactions on State of the Art in Science and Engineering, Vol 78, © 2014 WIT Press

3 Research design
To clarify the TOD development features and its effects, this study has summarized the related predicting variables represented by TOD features. In respect of affecting performance evaluation, this study will take the land value for outcome variable, but the land value is interfered by many factors (such as artificial, etc.). Therefore, this study will regard the announced current land value as the data to evaluate the land value, and take the Hierarchical Linear Model as the main analysis method. The instructions are as below. To explore the influence of the pedestrian oriented urban design on the benefit of land development, Hierarchical Linear Model (HLM) is adopted in this study as the main analysis method. The following will organize and explain for HLM.
3.1 Hierarchical Linear Model (HLM) and General Linear Model (GLM)
“Business aggregation and local economic development" driven by pedestrian oriented urban design to “benefit of land development” is of a data structure on the second floor, such as the predicting data of business aggregation, assumed for total commercial floor area of TOD, the data of individual TOD area will impact on the surrounding land development benefits, but because an area contains multiple TOD areas, total commercial floor area of the overall TOD area between different areas is bound to vary, and will still have different influences on the city land development benefits. If use the traditional regression analysis method, it could cause dilemma, and statistical problems may occur in regardless of choosing which one, and this data structure is called nesting phenomenon. As the following formulae (1) and (2), (3) show:
GLM:Y ⋯ (1)
HLM:Level 1: (2)
Level 2:β r u (3)
Seeing from formula (1), General Linear Model can only discuss the influence of independent variables on dependent variables. But seeing from formulae (2) and (3), except for discussing the error term of level 1 (individual level), HLM adds the error term 0 of the whole level through the intercept 0 , and by the calculation of the interclass correlation coefficient
(ICC) to determine whether the influence of hypothesis is significant or not, so as to examine if the variable needs hierarchical analysis. Therefore, this research choosing hierarchical linear model can unscramble whether the factors of two levels of local and urban have significant influence on the land development benefit.
Public Mobility Systems 141
www.witpress.com, ISSN 1755-8336 (on-line) WIT Transactions on State of the Art in Science and Engineering, Vol 78, © 2014 WIT Press

3.1 Research on variable set
Summarized by this study, TOD planning benefits explanation surface can be divided into 3 directions: “promote business aggregation and local economic development”, “promote traffic convenience and pedestrian accessibility” and “improve living environment quality”, and regarding overall level (20 administrative regions) and individual level (98 TOD areas) as the research object, its research framework is as shown in Figure 2. Among them, overall level explanatory variables (administrative level): (1) promote the business aggregation and local economic development: “employment population”; (2) promote traffic convenience and pedestrian accessibility: “number of MRT stations” and “length of road”; (3) improve living environment quality: “public facilities area”. Individual level explanatory variables (TOD area level): (1) promote the development of business cluster and local economy: “number of stores” within 500 meters of TOD area; (2) promote traffic convenience and pedestrian accessibility: “bus node number” and “travel times” within 500 meters of TOD area; (3) improve living environment quality: “total area of parks” and “number of land use zoning” within 500 meters of TOD area.
Figure 2: TOD hierarchy research structure.
142 Public Mobility Systems
www.witpress.com, ISSN 1755-8336 (on-line) WIT Transactions on State of the Art in Science and Engineering, Vol 78, © 2014 WIT Press

4 Empirical analysis
The interclass correlation coefficient (ICC) analysis can be used to indicate the proportion of the variance between groups in total variation, representing the degree of a variable variance can be explained by differences between groups. It can also be used to present the degree of correlation between dependent variables and groups, and its calculation formula is as follows:
ρ=τ / τ σ (4)
where: τ = the error variations of level two; σ = the error variations of level one.
Show the percentage of the variation between groups (τ ) in the overall variation (τ σ ). Therefore, if the ICC value is too low, it indicates the variation of level two is too small, then general regression analysis shall be available. If based on the criterion and conclusion prescribed by the research of Cohen (1988), the ICC value can be ignored if it is less than 0.059, and if more than 0.059 the HLM analysis model needs to be used. The judgment standard for the ICC value shall be that, less than 0.059 is a low interclass correlation, 0.059 to 0.138 is moderate interclass correlation, high interclass correlation is greater than 0.138. If the ICC value is greater than 0.138, which stands for vary variables, i.e. there is obvious difference between groups, so the effect of group is not allowed to be ignored. In addition, also by means of variation between groups and within group, calculate the reliability, which can be used to measure if the estimates of samples in different administrative region can serve as indicators of real administrative region. Its calculation formula is as follows:
reliability τ / τ σ /n (5) where: τ = the error variations of level two; σ = the error variations of level one; n = degree of freedom.
Finally, as for the calculated results of ICC value test and the reliability of this study (table 6), the analysis of the variables shows: first on the result variable of “average announced land current value in TOD area”, the ICC value is 0.5104; and the ICC value on predicting variable of the “average daily journey times” is 0.1599, the ICC value of the “bus node number” is 0.4987, the ICC value of the “number of convenience stores” is 0.3600, the ICC value of the “total number of classes of land use” is 0.4598, and all the above belong to
Public Mobility Systems 143
www.witpress.com, ISSN 1755-8336 (on-line) WIT Transactions on State of the Art in Science and Engineering, Vol 78, © 2014 WIT Press

the high interclass correlation, but the ICC value of the “total area of parks” is 0.1096, belonging to moderate interclass correlation. Therefore, the various variables used in this study have passed the ICC values inspection of the first phase. In the process of the first phase analysis, estimates with single factor variance analysis model with stochastic effect, has the following analysis objectives:
1. If there is any significant difference between the “current announced land value”, “travel times”, the “bus node number”, “total area of parks”, “number of stores”, ”number of land use zoning” in the TOD area in different administrative regions?
2. How much percentage of the total variance in each variable is caused by the variation of overall level (region)?
3. If regard the estimated sample mean in different administrative regions as the average index of the real administrative region, how about the credibility?
Based on the above analysis, this study will focus on output result table, and take the “TOD area announced land current value” (results variables) as an example to conduct the result analysis introduction, the analytic results are as shown in table 6. From the output result table, it can be seen that the average current land value announced of the 98 TOD areas in Taipei metropolitan area (Taipei City and New Taipei City) is 306,000 Yuan, the estimated standard error is 2.611, the T value is 11.718, and P value < 0.001, thus 95% confidence interval is:
30.602-1.96(2.611), 30.602+1.96(2.611) = (25.484, 35.719)
In addition, as it can be seen in Table 1, between administrative regions, variationτ is up to 0.001 significant Level-l, representing the average current announced land value in all the TOD areas has a significant change, and by means of administrative range variation (τ ) with the TOD area variation (σ ), input to the formula (2) for calculation, interclass correlation coefficient is available ρ= τ / τ σ 319.741/ 319.741 306.749 0.5104, representing 51.04% of the total variance of the current land value announced is caused by administrative region differences. Measuring based on the Cohen defined standard, the results variance used by this study in Level-1, is high interclass correlation. In addition, the reliability calculation of the sample mean of each administrative region is 0.954, which shows that when regards the estimated sample mean in different region as the real average index of the administrative region, the credibility is quite high.
144 Public Mobility Systems
www.witpress.com, ISSN 1755-8336 (on-line) WIT Transactions on State of the Art in Science and Engineering, Vol 78, © 2014 WIT Press

Table 1: Level-1 – the analysis result table of null model.
TOD District announced current land value
One-way ANOVA model with random effects/unconditional model with random intercept Fixed Effect Coefficient Standard error t value p value
TOD District announced current land value of the average, 30.602 2.611 11.718 <0.001
Random Effect Standard Deviation Approx. d.f. X2 p value
TOD District announced current land value, 319.741 20 135.368 <0.001 level-1, 306.749
ICC 0.5104 reliability coefficient 0.9542
Journey times Fixed Effect Coefficient Standard error t value p value
Journey times the average of the daily average, 19.078 2.554 7.467 <0.001
Random Effect Standard Deviation Approx. d.f. X2 p value Daily average trip times, 59.588 20 36.871 <0.012 level-1, 313.003
ICC 0.1599 reliability coefficient 0.7920
Bus nodes Fixed Effect Coefficient Standard error t value p value
The average number of bus nodes, 5.075 0.624 8.126 <0.001
Random Effect Standard Deviation Approx. d.f. X2 p value
Bus nodes, 6.613 20 116.8 <0.001 level-1, 6.648
ICC 0.4987 reliability coefficient 0.9521
The total area of the park Fixed Effect Coefficient Standard error t value p value
The average of the total area of the park, 1.345 0.399 3.368 <0.023
Random Effect Standard Deviation Approx. d.f. X2 p value
The total area of the park, 1.137 20 34.384 <0.003 level-1, 9.234
ICC 0.1096 reliability coefficient 0.7112
Number of stores Fixed Effect Coefficient Standard error t value p value
The average number of stores, 4.169 0.727 5.729 <0.001
Random Effect Standard Deviation Approx. d.f. X2 p value Number of stores, 7.508 20 85.059 <0.012
level-1, 13.35
ICC 0.3600 reliability coefficient 0.9184
Number of land use zoning Fixed Effect Coefficient Standard error t value p value
Land use the average of the total number of classes, 3.835 0.32 11.961 <0.001
Random Effect Standard Deviation Approx. d.f. X2 p value Total number of categories of land use, 1.625 20 106.004 <0.012 level-1, 1.909
ICC 0.4598 reliability coefficient 0.9445
Public Mobility Systems 145
www.witpress.com, ISSN 1755-8336 (on-line) WIT Transactions on State of the Art in Science and Engineering, Vol 78, © 2014 WIT Press

5 Conclusions
Development and promotion of TOD in Taiwan urban has been for more than twenty years, its related research only focuses on the TOD planning for promoting the public transport times, other policy effects such as economic development, increasing habitability and residence selection and improving environmental quality, expanding living environment have no related empirical research to be examined. Accordingly, this study takes, taking Taipei city TOD area as scope, using HLM to investigate the relationship among TOD planning elements, development effectiveness and land value. On this basis, according to the results of this study, the following conclusions and suggestions are proposed. The instructions are as follows:
5.1 TOD features are high interclass correlation, available to explain the relationship with land value
The investigation data of the announced land current value are from the 98 TOD districts within 20 administrative regions of Taipei metropolitan area, which means the nesting data are within the administrative regions. In terms of the overall level, it has a certain self-correlation degree, if verify the impact of TOD features on land value with the traditional regression analysis, the interclass correlation coefficient in each administrative region will be ignored, that is ignoring the correlation among the TOD areas. Generally, if the interclass correlation were ignored, it will lead to the effect of TOD features on land value. Therefore, with the null model, this study further estimates the interclass correlation coefficient of sample data, and then confirms the correlation among the study samples, which shall not be ignored.
5.2 The MRT transport times is not the influencing element of land value
Through the results of this study analysis, we found that “transport times” does not have a significant impact on land value as expected. And throughout the TOD development strategy, still more through enhancing the land use intensity within 300 meters of MRT stations, while the 500-meter range decreases gradually as the main programming method, to attract people to the station center and increase the public transport journey times, but the journey times only shows that it can increase the internal returns, while the influence of external benefit is not absolute. As for the reasons, we can find the area of high journeys indicates long distance moving to the destination, such as Nanshijiao Station and Yongning Station, in which residents need to take the MRT to downtown Taipei, though central site tour number increases dramatically, it is only due to the aggregation of journeys of many areas.
5.3 Suggestion
Based on the results of this study, if go further in the future, the administrative region shall be segmented to neighborhood or township level, to take the effects
146 Public Mobility Systems
www.witpress.com, ISSN 1755-8336 (on-line) WIT Transactions on State of the Art in Science and Engineering, Vol 78, © 2014 WIT Press

of TOD features to neighborhood into account, that is under the consideration of the features of different administrative regions, the change of situation of TOD features and land value of neighborhoods, to establish three levels of linear model analysis, the considered elements will be more complete. In addition, based on the results of this study, more influencing elements can be evolved, influence relations of which can be clarified with HLM analysis model. As for the selection of research variable, it can through expert questionnaire (AHP) conduct variable selection and weight, and it is suggested that the access object can be divided into four dimensions of industry, government agencies, academia, and the public, and only in this way can it be representative.
References
[1] Cervero, R. (1996). Mixed land uses and commuting: evidence from the American Housing Survey. Transportation Research A 30 (5), 361–377.
[2] Medda F. (2012). Land value capture finance for transport accessibility: a review. Journal of Transport Geography 25: 154–161.
[3] Xiaosu MA, Hong K. LO. (2013). On joint railway and housing development strategy. Transportation Research Part B.
[4] Mathur S., Ferrell C. (2013). Measuring the impact of sub-urban transit-oriented developments on single-family home values. Transpn Res A 42–55.
[5] Ratner K.A., Goetz A.R. (2013). The reshaping of land use and urban form in Denver through transit-oriented development. Cities 30: 31–46.
[6] Peterson G.E. (2009). Unlocking Land Values to Finance Urban Infrastructure. The World Bank, Washington, DC.
[7] Levinson D.M., Istrate E. (2011). Access for Value: Financing Transportation Through Land Value Capture. Brookings Institute, Transportation Research Board.
[8] Krause A. L., Bitter C. (2012). Spatial econometrics, land values and sustainability: Trends in real estate valuation research. Cities 29: S19–S25.
[9] Brown-Luthango M. (2011). Capturing land value increment to finance infrastructure investment: possibilities for South Africa. Urb. For. 22, 37–52.
[10] Prem Chhetri P, Jung Hoon Han, Shobhit Chandra, Jonathan Corcoran. (2013). Mapping urban residential density patterns: Compact city model in Melbourne. Australia. City, Culture and Society 4: 77–85.
[11] Squires G., Lord, A. (2012). The transfer of Tax Increment Financing (TIF) as an urban policy for spatially targeted economic development initiatives. Land Use Policy 29 (4), 817–826.
[12] Zhao Z.J., Larson K. (2011). Special assessments as a value capture strategy for public transit finance. Public Works Manag. Policy 16, 320–340.
[13] Ballaney S., Patel, B. (2009). Using the Development Plan-Town Planning Scheme Mechanism to Appropriate Land and Build Urban Infrastructure. In: India Infrastructure Report. Oxford University Press, New Delhi.
Public Mobility Systems 147
www.witpress.com, ISSN 1755-8336 (on-line) WIT Transactions on State of the Art in Science and Engineering, Vol 78, © 2014 WIT Press
[14] Gee G.C., Takeuchi D.T. (2004). Traffic stress, vehicular burden and well-being: A multilevel analysis. Social Science & Medicine 59: 405–414.
[15] Cervero R., Duncan M. (2002). Land Value Impacts of Rail Transit Services in Los Angeles County. Report prepared for National Association of Realtors, Urban Land Institute.
148 Public Mobility Systems
www.witpress.com, ISSN 1755-8336 (on-line) WIT Transactions on State of the Art in Science and Engineering, Vol 78, © 2014 WIT Press