effect of outflow on spring and summertime … nursery areas for many estuarine and marine fishes;...
TRANSCRIPT

American Fisheries Society Symposium 39:49–65, 2004© Copyright by the American Fisheries Society 2004
49
Effect of Outflow on Spring and SummertimeDistribution and Abundance of Larval and Juvenile
Fishes in the Upper San Francisco Estuary
MICHAEL DEGE
Central Valley Bay-Delta Branch, California Department of Fish and Game4001 North Wilson Way, Stockton, California 95205-2486, USA
LARRY R. BROWN
U.S. Geological Survey, Placer Hall, 6000 J Street, Sacramento, California 95819-6129, USA
Abstract.—We analyzed data on spring and summertime larval and juvenile fish distri-bution and abundance in the upper San Francisco Estuary (SFE), California between1995 and 2001. The upper SFE includes the tidal freshwater areas of the Sacramento–SanJoaquin Delta downstream to the euryhaline environment of San Pablo Bay. The sam-pling period included years with a variety of outflow conditions. Fifty taxa were col-lected using a larval tow net. Two common native species, delta smelt Hypomesustranspacificus and longfin smelt Spirinchus thaleichthys, and four common alien taxa,striped bass Morone saxatilis, threadfin shad Dorosoma petenense, gobies of the genusTridentiger, and yellowfin goby Acanthogobius flavimanus, were selected for detailedanalysis. Outflow conditions had a strong influence on the geographic distribution ofmost of the species, but distribution with respect to the 2 psu isohaline (X2) was notaffected. The distribution patterns of delta smelt, longfin smelt, and striped bass wereconsistent with larvae moving from upstream freshwater spawning areas to down-stream estuarine rearing areas. There were no obvious relationships of outflow withannual abundance indices. Our results support the idea of using X2 as an organizingprinciple in understanding the ecology of larval fishes in the upper SFE. Additionalyears of sampling will likely lead to additional insights into the early life history ofupper SFE fishes.
Introduction
Fish movement and distribution patterns aregoverned by biotic and abiotic factors as wellas behavioral or life history characteristics(Harvey 1987; Baldwin et al. 2002). Many lar-val fish are planktonic in their early stages anddepend on hydrodynamic processes, amongother factors, for dispersal into suitable rear-ing areas (Floyd et al. 1984; Robinson et al.1998). The upper San Francisco Estuary (SFE)includes the tidal freshwater areas of the Sac-ramento–San Joaquin Delta downstream to the
euryhaline environment of San Pablo Bay (Fig-ure 1). Like other estuaries (Moyle and Cech1999), the upper SFE provides highly produc-tive nursery areas for many estuarine andmarine fishes; however, patterns of distribu-tion and dispersal of the larvae and early ju-veniles of many fishes within the estuary havenot been well documented.
Declines (from early 1980s to present) haveoccurred in a number of upper SFE fish popu-lations (Herbold et al. 1992; Jassby et al. 1995;Matern et al. 2002). Earlier researchers hadfound significant relationships between someupper SFE fishes and freshwater inflow(Turner and Chadwick 1972; Stevens 1977;Stevens and Miller 1983), although, these re-
* Corresponding author: [email protected]

50 DEGE AND BROWN
FIGURE 1. Map of the upper San Francisco Estuary showing (top panel) the 20-mm Survey samplingstations (black circles) and area groupings (bottom panel; A–G) by geographic and hydrological influ-ence.

EFFECT OF OUTFLOW ON DISTRIBUTION AND ABUNDANCE OF LARVAL AND JUVENILE FISHES 51
lationships have weakened as fish popula-tions have declined (Kimmerer 2002a). Thosestudies focused on changes in freshwater in-flow as the cause of fish population declines;however, numerous other changes have oc-curred in the SFE.
Similar to other estuaries, the SFE has beenhighly altered by human activities (Nichols etal. 1986). In the last 150 years, approximately80% of tidal wetlands in San Francisco Bayhave been lost, as have 95% in the delta (TheBay Institute 1998). Water management activi-ties in the upper SFE and its tributary systemsin response to increased needs for freshwaterexports have been especially important inmodifying the hydrology of the system (Jassbyand Powell 1994; Arthur et al. 1996; Kimmerer2002b). Further alterations include introduc-tions of alien species (Carlton et al. 1990;Nichols et al. 1990; Alpine and Cloern 1992;Kimmerer and Orsi 1996; Greiner 2002) andchanges in water quality (Nichols et al. 1986;Jassby et al. 1995; Kuivila and Foe 1995;Hornberger et al. 1999). These and otherchanges have likely contributed to observeddeclines in fish populations in the SFE(Bennett and Moyle 1996).
Environmental conditions in the upperSFE vary in response to seasonal outflow. Ingeneral, higher outflows are negatively relatedto electroconductivities (EC, a surrogate forsalinity) and water temperatures. In the up-per SFE, the position of the 2 psu isohaline(X2) is of particular interest. The X2 is mea-sured as the distance up the axis of the estu-ary to the location where the daily averagenear-bottom salinity is 2 psu. Location of X2in the estuary has significant statistical rela-tionships with many estuarine resources(Jassby et al. 1995; Kimmerer 2002a, 2002b),including several species of fish. Ecologicalprocesses that generate these relationshipsare not well established (Kimmerer 2002b).Published studies regarding X2 have prima-rily focused on annual measures of X2 posi-tion and organism abundance (Jassby et al.1995; Kimmerer 2002a, 2002b) or on detailedstudies of organism behavior at or near X2(Bennett et al. 2002; Kimmerer et al. 2002).
The objective of this study was to investi-gate distribution and abundance trends forfishes commonly captured by the 20-mm Sur-
vey (description follows) during the springand summer from 1995 to 2001. Specifically,we ask the following questions:
1. How are small (<20 mm fork length [FL])and large (≥20 mm FL) size-classes ofcommon fishes distributed in the upperSFE both in an absolute sense (distancefrom the ocean) and with regard to X2 po-sition, and how are distributions affectedby outflow?
2. Are annual abundance indexes (see Meth-ods) of the common species statisticallycorrelated with outflow conditions or eachother?
The 20-mm Survey was designed prima-rily to sample young-of-year delta smeltHypomesus transpacificus (20 mm FL), a federal-and state-listed threatened species (Moyle2002), throughout their historic spring andsummer range. Data on the distribution andabundance of 20-mm delta smelt, along withother data, are used to evaluate the entrain-ment risk for delta smelt at the Central ValleyProject (CVP) and State Water Project (SWP)pumping facilities located in the southerndelta (Figure 1). In addition to data on deltasmelt, the 20-mm Survey provides data on thelarvae and juveniles of a number of other fishesutilizing the upper SFE (Table 1).
Study Area
The SFE is located in central California andencompasses an area extending from the cit-ies of Sacramento and Stockton in the East tothe Pacific Ocean in the West (Figure 1). TheSacramento and San Joaquin rivers, drainingmore than 40% of the state’s surface area, pro-vide the majority of freshwater to the system.These two rivers join, forming the Sacra-mento–San Joaquin Delta, a network of morethan 1,100 km of tidal channels and sloughs(Turner and Kelley 1966). Outflow from thedelta enters a series of shallow tidal bays, in-cluding the Honker, Grizzly, and Suisun bays.Outflow then enters shallow San Pablo Bay,the northernmost portion of San FranciscoBay, before reaching central San Francisco Bayand exiting to the Pacific Ocean through theGolden Gate. The upper SFE includes the re-gion from the delta to San Pablo Bay. The cli-

52 DEGE AND BROWN
TABLE 1. Common name, species name, native status, habitat, total catch, and percentage of totalcatch for all species captured over the study period (1995–2001) from the upper San Francisco Estuary(asterisk indicates study fish).
Common name Species name Native?a Habitatb Catch Percent*Longfin smelt Spirinchus thaleichthys Yes E 289,686 36*Gobies, Tridentiger Tridentiger spp. No E 187,556 23*Striped bass Morone saxatilis No E, AN 95,148 12*Yellowfin goby Acanthogobius flavimanus No E, S 92,036 11*Threadfin shad Dorosoma petenense No F 55,328 7Pacific herring Clupea pallasi Yes S 21,103 3*Shimofuri goby Tridentiger bifasciatus No F, E 15,509 2*Delta smelt Yes E 12,561 2Northern anchovy Engraulis mordax Yes S 10,376 1White catfish Ameiurus catus No F 8,824 1Prickly sculpin Cottus asper Yes E, F 6,088 <1Channel catfish Ictalurus punctatus No F 4,953 <1Bay goby Lepidogobius lepidus Yes S 4,352 <1American shad Alosa sapidissima No AN 1,903 <1Threespine stickleback Gasterosteus aculeatus Yes AN, E, F 1,411 <1Cheekspot goby Ilypnus gilberti Yes S 1,195 <1Splittail Pogonichthys macrolepidotus Yes E, F 765 <1Starry flounder Platichthys stellatus Yes E 686 <1Centrarchid spp. – F 368 <1Inland silverside Menidia beryllina No E, F 255 <1Longjaw mudsucker Gillichthys mirabilis Yes E 239 <1Topsmelt Atherinops affinis Yes E, S 228 <1White croaker Genyonemus lineatus Yes S 221 <1Smelt spp. – – 219 <1Pacific staghorn sculpin Leptocottus armatus Yes S 213 <1Sacramento sucker Catostomus occidentalis Yes F 173 <1Common carp Cyprinus carpio No F 124 <1White sturgeon Acipenser transmontanus Yes AN 120 <1Wakasagi Hypomesus nipponensis No E, F 113 <1Cyprinid spp. – – 109 <1Catfish spp. – F 88 <1Jacksmelt Atherinopsis californiensis Yes S 78 <1Chinook salmon Oncorhynchus tshawytscha Yes AN 77 <1Plainfin midshipman Porichthys notatus Yes S 72 <1Bigscale logperch Percina macrolepida No F 64 <1Arrow goby Clevelandia ios Yes S 60 <1Largemouth bass Micropterus salmoides No F 38 <1Goby spp. – – 21 <1Bluegill sunfish Lepomis macrochirus No F 19 <1Rainwater killifish Lucania parva No E 17 <1Sculpin spp. – – 10 <1Tule perch Hysterocarpus traski Yes E, F 10 <1Bay pipefish Syngnathus leptorhynchus Yes S 9 <1Lampreys spp. – – 9 <1River lamprey Lampetra ayresi Yes AN 9 <1Shokihaze goby Tridentiger barbatus No E 9 <1Black crappie Pomoxis nigromaculatus No F 8 <1Western mosquitofish Gambusia affinis No F 7 <1Pacific lamprey Lampetra tridentata Yes AN 5 <1

EFFECT OF OUTFLOW ON DISTRIBUTION AND ABUNDANCE OF LARVAL AND JUVENILE FISHES 53
mate of the area is Mediterranean, character-ized by mild wet winters and hot dry sum-mers. Typically, high runoff during the winterand spring followed by low runoff during thesummer and fall cause seasonal variations insalinity intrusion from the ocean.
Methods
Fish sampling
The 20-mm Survey began in 1995 and is on-going. Based on historical records and resultsof other sampling programs, a network of 48fixed sampling stations was established toencompass the historic spring and summerrange of delta smelt (Figure 1). These sitesalso included a variety of habitats availablein the system: river channels, backwatersloughs, shallow bays, and flooded islands.During the study period, sampling generallybegan during the first neap tidal period inearly spring or when water conditions al-lowed the safe use of towed gear (March–April). Surveys were initiated every otherweek during the sampling season. Samplingcontinued until delta smelt larval–juvenilecatch declined to low levels (i.e., a few indi-viduals at just a few stations) and the distri-bution shifted such that entrainment of deltasmelt at the pumping facilities located in thesouth delta became unlikely based on pastexperience (July–August). A single survey of
the sampling stations usually required 6 d;however, logistical problems, such as boat orgear failures, extended some surveys into thefollowing week. Annually, between 8 and 10surveys were conducted.
The conical plankton net used in the sur-veys is 5.1 m long with a mouth opening of 1.5m2. The net is constructed of 1,600-µm knotlessnylon delta mesh and is mounted on aweighted tow frame with skids. Fish are col-lected in a removable 2.2-L collection jarscreened with 474-mm stainless steel wirebolting cloth. A General Oceanics flowmeteris mounted in the mouth of the net to estimatethe volume (m3) of water sampled. To samplethe entire water column, three 10-min, stepped(1.2 m per step) oblique tows are completed ateach station. After each tow, the entire sampleis transferred to a labeled holding jar contain-ing 10% formalin neutralized (pH 7) with so-dium borate. All larval fish were identified tospecies or lowest possible taxon (Wang 1986)and counted. The first 300 fish (1995–1998),100 fish (1999–2000), or 50 fish (2001) fromeach tow were randomly selected and mea-sured (FL) to the nearest millimeter, except alldelta smelt are measured.
Outflow conditions and X2 position
Daily outflow data were compiled from theCalifornia Department of Water Resources’(DWR) Dayflow program for the complete pe-
TABLE 1. continued
Common name Species name Native?1 Habitat2 Catch Percent
Goldfish Carassius auratus No F 4 <1Sacramento blackfish Orthodon microlepidotus Yes F 4 <1Speckled sanddab Citharichthys stigmaeus Yes S 3 <1Golden shiner Notemigonus crysoleucas No F 2 <1Black bullhead Ameiurus melas No F 1 <1Hitch Lavinia exilicauda Yes F 1 <1Sacramento Ptychocheilus grandis Yes F 1 <1
pikeminnowSmallmouth bass Micropterus dolomieu No F 1 <1White crappie Pomoxis annularis No F 1 <1a Yes, Native; No, Alien species; –, only species are classified.b Habitat: E, estuarine; AN, anadromous; F, freshwater; S, saltwater.

54 DEGE AND BROWN
riod of record (1955–2001; available online athttp://www.iep.ca.gov/dayflow/index.html).These data were then summarized as dailyaverages and plotted against the daily outflowfor each year of sampling (Figure 2). Yearswhen sampling period outflow was consis-tently above the average for the period ofrecord were classified as high outflow (Table2). Years when sampling period outflow wasconsistently below the average were classifiedas low outflow (Table 2). Years when samplingperiod outflow was consistently near or fluc-tuated around the average outflow were clas-sified as average outflow (Table 2). The mostunusual year was 1997, when a major stormresulted in a record amount of outflow early inthe season, but by February dry conditions pre-vailed (Figure 2). Location of X2 position wascalculated from the DWR Dayflow program(available online at http://www.iep.ca.gov/dayflow/index.html). The X2 position repre-sents the average daily distance (km) of X2 fromthe Golden Gate (i.e., Pacific Ocean).
Study fish
We restricted detailed analyses to six taxa(study fish) that we defined as common (Table1). Common taxa were present during everyyear of the study and had more than 10,000individuals in the total catch. Although manylarval gobies of the genus Tridentiger could notbe identified to species, we assume that thevast majority were shimofuri goby. Theshokihaze goby is a new alien species in thesystem (only nine juveniles and adults col-lected during the study period) and has notyet become abundant (Greiner 2002). Twomarine species, northern anchovy and Pacificherring were considered common, but wereremoved from further analysis because the up-per SFE represents only a minor seasonal partof the spawning and rearing habitat for thespecies.
Delta smelt and longfin smelt Spirinchusthaleichthys are native species. The other fourtaxa are aliens (Dill and Cordone 1997).Striped bass was intentionally introduced intothe SFE in 1879. Threadfin shad was inten-tionally introduced to California in 1954 andwas established in the SFE by the early 1960s.Tridentiger spp. and yellowfin goby were not
intentional introductions and likely arrivedvia ballast water (shimofuri goby detected in1985, shokihaze goby detected in 1997, andyellowfin goby detected in 1963; Dill andCordone 1997). These fishes are all pelagic (lar-vae only for gobies), making them susceptibleto the gear.
Distribution of fishes
To account for ontogenetic changes, the com-mon species were grouped into small andlarge size-classes using a 20-mm cutoff. Thiscutoff size was selected because it marks thetransformation from the larval to the juvenilestage for most of the study fish. The gobieswere exceptions because they become benthicand are less vulnerable to the net at around 15mm. Therefore, analysis of data for gobies waslimited to the smaller than 20-mm group.
For each survey, mean location of the popu-lation of each species size-class was calculatedby multiplying the distance of a station fromthe Golden Gate (km) by the abundance (fish/10,000 m3) of the species size-class at that site,summing across all stations, and then divid-ing by total abundance. We calculated distancefrom X2 for the population for each survey bysubtracting the mean position of X2 over thetime period of the survey from the weightedmean distance of X2 from the Golden Gate (km).The seven stations in the Napa River (Figure 1)were excluded from the analysis because a sepa-rate X2 develops in the Napa River Estuary in-dependent of X2 in the upper SFE.
Weighted means (±1 SD) were plotted (notshown) and examined to determine a subsetof means for analysis by repeated measuresanalysis of variance (ANOVA) for each spe-cies size-class. For each species size, data wereexamined to determine the longest series ofmeans common to each year and outflow con-dition class. A series was not allowed to in-clude gaps (surveys with no catch) or periodsof widely fluctuating mean location based onfew captures. Within outflow conditions, sur-veys from each year were selected that wereapproximately coincident in time (within aweek). These constraints resulted in a maxi-mum of seven surveys occurring in a data se-ries. The selection process resulted in dataseries being selected for each outflow condi-

EFFECT OF OUTFLOW ON DISTRIBUTION AND ABUNDANCE OF LARVAL AND JUVENILE FISHES 55
0
2500
5000
7500
10000
12500
1995
Ou
tflo
w
(m3/s
)
1996
0
2500
5000
7500
10000
12500
20-mm Survey Periods
Historic Daily Average Outflow
0
2500
5000
7500
10000
12500
1997
Ou
tflo
w
(m3/s
)
1998
0
2500
5000
7500
10000
12500
0
2500
5000
7500
10000
12500
1999
Ou
tflo
w
(m3/s
)
Oct
Nov
Dec
Jan
Feb
Mar
Apr
May
Jun
Jul
Aug
Sep
2000
0
2500
5000
7500
10000
12500
0
2500
5000
7500
10000
12500
Oct
Nov
Dec
Jan
Feb
Mar
Apr
May
Jun
Jul
Aug
Sep
2001
Ou
tflo
w
(m3/s
)
FIGURE 2. California water year (1 October–30 September) net outflow and historic (1955–2001) dailyaveraged net outflow through the upper San Francisco Estuary.
56 DEGE AND BROWN
tion that might be offset by several calendarweeks from the data series for other outflowconditions for the same species size-class (seeFigure 3). We assume that the series corre-spond to similar stages in the development ofthe population in response to different out-flow conditions, especially for those speciessize-classes for which most of the surveys wereincluded. The assumption is especially appli-cable to the latter portion of each series of sur-veys because the termination of sampling waskeyed to the abundance of delta smelt. The re-sulting data series for distance from theGolden Gate and distance from X2 were ana-lyzed by repeated measures ANOVA usingSYSTAT 10.2 (SYSTAT Software, Inc. 2002).
As implemented in this study, the re-peated measures ANOVA evaluates the maineffect of outflow condition on distance fromthe Golden Gate and distance to X2. The analy-sis also tests the effect of survey number (here-inafter referred to as “time”) and interactionsbetween outflow condition and time. A sig-nificant time effect would indicate that dis-tance changed over the series of surveys in-cluded in a data series. A significant inter-action indicates that the effect of time differedbetween outflow conditions. For example, dis-tance from the Golden Gate might change morerapidly at one outflow condition compared tothe other two outflow conditions.
Annual abundance indices
An annual index of abundance was generatedfor each of the study fish. For each survey dur-ing a year, the station abundance values weremultiplied by a weight factor based on an es-timate of the volume of water represented bythat station (Chadwick 1964). These weighted
abundances were then averaged within sevengeographical areas (Figure 1). These averagevalues were then summed by survey. The fi-nal index was the sum of the values from allsurveys in a year (divided by 1,000 for conve-nience). Associations between species andoutflow conditions and among species wereevaluated using Pearson’s correlation coeffi-cient (r).
Results
More than 812,000 larval and juvenile fish rep-resenting at least 24 families and 50 specieswere collected over the study period (somespecies in the families Cyprinidae, Centrarch-idae, and Gobiidae are difficult to identifyduring the larval stage and were oftengrouped). Annual catches ranged from 38,856to 340,230. The study fish accounted for747,824 or 92% of all fishes collected (Table 1).
Distribution
Delta smelt.—Abundance at individualstations throughout the study period rangedfrom 0 (no catch) to 1,600 fish per 10,000 m3.Compared to the other common fishes underinvestigation, delta smelt had the lowest meanabundance per station (21 fish/10,000 m3) overthe study period. Mean size of all delta smeltcaptured was 21.9 mm (SD = 10.2).
Small delta smelt occurred earlier and far-ther upstream than large delta smelt (Figures3 and 4). This indicates that the surveys werestarted early in the recruitment of larvae toearly juveniles. Both small and large deltasmelt were generally distributed upstream ofX2 (Figure 3); however, large delta smelt werecentered closer to X2 than small delta smelt.
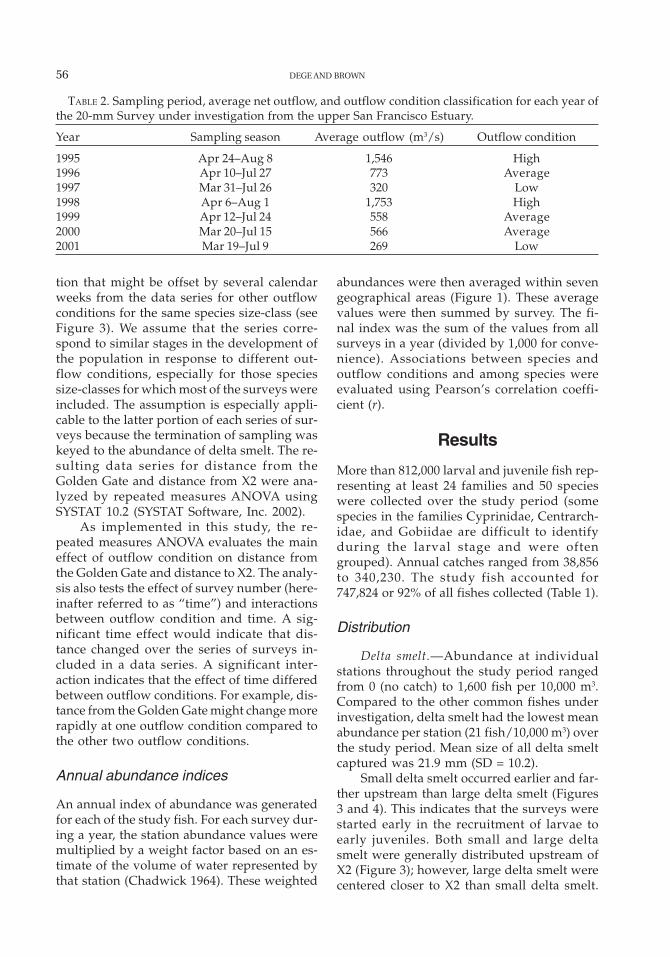
TABLE 2. Sampling period, average net outflow, and outflow condition classification for each year ofthe 20-mm Survey under investigation from the upper San Francisco Estuary.
Year Sampling season Average outflow (m3/s) Outflow condition
1995 Apr 24–Aug 8 1,546 High1996 Apr 10–Jul 27 773 Average1997 Mar 31–Jul 26 320 Low1998 Apr 6–Aug 1 1,753 High1999 Apr 12–Jul 24 558 Average2000 Mar 20–Jul 15 566 Average2001 Mar 19–Jul 9 269 Low

EFFECT OF OUTFLOW ON DISTRIBUTION AND ABUNDANCE OF LARVAL AND JUVENILE FISHES 57
20
40
60
80
100
120
Dis
tance
(km
)
High outflowAverage ouflowLow outflow
Small delta smelt
Dis
tance
(km
)
April May June July
High outflowAverage ouflowLow outflow
0
20
40
60
80
100 Large delta smelt
Dis
tance
(km
)
0
20
40
60
80
High outflowAverage ouflowLow outflow
Small longfin smelt
Dis
tance
(km
)
April May June July
High outflowAverage ouflowLow outflow
0
20
40
60
80Large longfin smelt
Dis
tan
ce (
km
)
High outflowAverage ouflowLow outflow
20
40
60
80
100
Small striped bass
Dis
tan
ce (
km
)
April May June July
High outflowAverage ouflowLow outflow
20
40
60
80
100Large striped bass
Dis
tan
ce (
km
)
High outflowAverage ouflowLow outflow
50
70
90
110
130
Dis
tan
ce (
km
)
April May June July
High outflowAverage ouflowLow outflow
0
20
40
60
80
100
Small threadfin shad
Small Tridentiger spp.
FIGURE 3. Mean (±1 SE) distance of the center of populations of small (<20 mm FL) and large (≥20 mmFL) fishes from the Golden Gate (upper three data sets) and from the position of the 2 psu isohaline(lower three data sets) for three outflow conditions. The high and low outflow conditions include 2years of data, and the average outflow condition includes 3 years of data.

58 DEGE AND BROWN
These patterns are consistent with the generallife history of delta smelt (Moyle 2002). Spawn-ing occurs in freshwater with the larvae gradu-ally moving downstream to the brackish wa-ter (1–7 parts per thousand [ppt]) habitat ofjuveniles and adults.
Seven survey periods were selected forquantitative analysis of small delta smelt posi-tion (Figure 3). This included most of the avail-able data. Five survey periods were selected forquantitative analysis of large delta smelt posi-tion (Figure 3). The selection of large delta smeltdata were mainly constrained by the averageoutflow year 1996 during which significantcatches did not occur until mid-May.
Small delta smelt showed statistically sig-nificant differences among outflow conditionsin distance from the Golden Gate (F2,4 = 12.5; P= 0.019) but not for distance from X2 (P > 0.05).The population was centered closer to theGolden Gate at higher outflow; however, bythe end of the sampling period, the position ofthe population at different outflow conditionsconverged (Figure 3). The mean distance fromthe Golden Gate at the time of the final ana-lyzed survey was 86 km. The time trend wassignificant for both distance from Golden Gate(F6,24 = 3.3; P = 0.017) and distance from X2(F6,24 = 8.8; P < 0.001). There was also a signifi-cant interaction of the time trend with outflowcondition for both parameters (F12,24 = 3.2; P =0.007 and F12,24 = 2.7; P = 0.017, respectively).The interaction can be attributed to a trend ofdeclining distance from the Golden Gate orX2 during normal and low outflow conditionsin contrast to fairly constant distances overtime during high outflow conditions.
As for small delta smelt, large delta smeltshowed statistically significant differencesamong outflow conditions in distance fromthe Golden Gate (F2,4 = 12.0; P = 0.020) but notfor distance from X2 (P > 0.05). Large deltasmelt also tended to be centered closer to theGolden Gate during high outflow years (Fig-ure 3). The population converged to X2 overthe season, but the range in final position overthe final survey period analyzed was some-what wider than for smaller delta smelt witha mean position closer to the Golden Gate (78km). The time trend was significant for bothdistance to Golden Gate (F4,16 = 11.9; P < 0.001)and distance to X2 (F4,16 = 46.5; P < 0.001) re-flecting decreasing distances over time. Theinteraction between time and outflow condi-tion was only significant for distance from X2(F8,16 = 2.7; P = 0.041). This likely reflects a morelinear convergence of the population towardX2 during average outflow conditions com-pared to low and high outflow conditions (Fig-ure 3)
Longfin smelt.—Longfin smelt was the mostcommon species sampled by the 20-mm Sur-vey and was the only other native fish besidesdelta smelt to contribute more than 1% of thetotal catch over the study period (Table 1).Longfin smelt had the highest mean abun-dance per station over the study period of allstudy fish (555 fish/10,000 m3), with abun-dance ranging from 0 to 90,346 fish/10,000m3 at individual stations. The mean size oflongfin smelt captured in the 20-mm Surveywas 20.2 mm (SD = 7.2).
Both small and large longfin smelt wereclosely associated with X2 (Figures 3). Large
Dis
tan
ce (
km
)
April May June July
High outflowAverage ouflowLow outflow
-20
0
20
40
60
80
Small yellowfin goby
FIGURE 3. continued

EFFECT OF OUTFLOW ON DISTRIBUTION AND ABUNDANCE OF LARVAL AND JUVENILE FISHES 59
longfin smelt were consistently found seawardof X2 during the latter part of the samplingseason (Figure 3). Only four survey periodswere selected for quantitative analysis of smalllongfin smelt position (Figure 3). The selec-tion was mainly constrained by only sporadiccatches of small longfin smelt starting in midto late May, depending on outflow condition.Longfin smelt spawn earliest of all the studyfish with most spawning taking place betweenJanuary and April (Moyle 2002). Thus, the foursurvey periods selected likely represent theend of the reproductive season for this spe-cies. In contrast, seven survey periods were
selected for quantitative analysis of largelongfin smelt position (Figure 3). These peri-ods included the majority of the availabledata.
There was a statistically significant dif-ference among outflow conditions for smalllongfin smelt for distance to the Golden Gate(F2,4 = 17.0; P = 0.011) but not for distance to X2(P > 0.05). As outflow increased the popula-tion was centered closer to the Golden Gate;however, the population was always closelyassociated with X2. For both distance toGolden Gate and distance to X2, the time trendwas not significant overall (P > 0.05), but there
0
50
100
150
200
250
Delta smelt
0
50
100
150
200
250
300
350
400
Striped bass
0
200
400
600
800
1000
1995 1996 1997 1998 1999 2000 2001
Tridentiger spp.
0
200
400
600
800
1000
1200
1400
1600
1800
Longfin smelt
0
50
100
150
200
250
300
350
400
Threadfin shad
1995 1996 1997 1998 1999 2000 2001
0
200
400
600
800
1000
Yellowfin goby
Annual A
bundance
Indic
es
FIGURE 4. The 20-mm Survey annual abundance indices for the study fish (1995–2001).

60 DEGE AND BROWN
was a significant interaction between the timetrend and outflow condition (F6,12 = 3.4; P =0.034 and F6,12 = 4.1; P = 0.017, respectively).There was not a consistent pattern among theoutflow conditions. Distances increased overthe four survey periods during low outflowconditions, increased and then decreased dur-ing average outflow condition, and decreasedand then stayed fairly constant during highoutflow conditions (Figure 3).
Large longfin smelt also showed statisti-cally significant differences among outflowconditions for distance to the Golden Gate (F2,4
= 38.5; P = 0.002) but not for distance to X2 (P> 0.05). As for small longfin smelt, the popu-lation was centered around X2; however, thepopulation tended to be located seaward ofX2 during the latter part of the survey period.Time was only a significant factor for distanceto X2 (F6,24 = 5.3; P = 0.001), and the interactionwas not significant for either parameter (bothP > 0.05). The time trend for distance to X2was clearly indicated by the transition of thecenter of the population from landward to sea-ward of X2; however, the form of the responsewas not consistent among any of the outflowconditions. Longfin smelt are anadromous,and the population of late juvenile and adultlongfin smelt tends to be located in San Fran-cisco Bay (Moyle 2002), which likely accountsfor the movement of the center of the popula-tion from landward to seaward of X2 duringthe latter part of the season.
Striped bass.—Abundance of striped bassranged from 0 to 11,529 fish/10,000 m3 at in-dividual stations over the study period with amean abundance per station of 159 fish/10,000 m3. The mean size of striped bass cap-tured during the study was 13.2 mm (SD =8.2). This relatively small mean size reflectsthe dominance of small striped bass in thecatch.
Populations of small striped bass wereconsistently centered upstream of X2 underall outflow conditions (Figure 3). Large stripedbass also tended to occur upstream of X2; how-ever, the population of large striped bass wascentered somewhat closer to X2 than the smallstriped bass (Figure 3). Six survey periods werechosen for quantitative analysis of smallstriped bass (Figure 3). These periods includedthe majority of the data and were primarily
constrained by sporadic catches during theearly part of the surveys. Only three surveyperiods were selected for quantitative analy-sis of large striped bass (Figure 3). The mainconstraint was limited catches during the ear-lier portion of the survey period under all out-flow conditions.
Distance from the Golden Gate differedsignificantly among outflow conditions forsmall striped bass (F2,4 = 26.5; P = 0.005), butdistance from X2 did not (P > 0.05). The popu-lation was centered farther upstream at loweroutflows (Figure 3). The time trend was sig-nificant for distance to Golden Gate (F5,20 =13.7; P < 0.001) but not for distance to X2 (P >0.05). The distance to Golden Gate tended toincrease as the season progressed (Figure 3).The interaction of time with outflow condi-tion was not significant for distance to GoldenGate (P > 0.05) but was significant for distanceto X2 (F10,20 = 4.5; P = 0.002). Through the sea-son, the distance to X2 tended to decline athigh outflow, stay constant at average outflow,and increase at low outflow (Figure 3).
Neither distance to Golden Gate nor dis-tance to X2 exhibited statistically significantdifferences among outflow conditions for largestriped bass (both P > 0.05). The time trend wassignificant for both distance to Golden Gate (F2,8
= 27.7; P < 0.001) and distance to X2 (F2,8 = 52.8;P < 0.001) as was the interaction of time withoutflow condition (F4,8 = 16.6; P = 0.001 and F4,8= 14.8; P = 0.001, respectively). The data seriesanalyzed for large striped bass was highly con-strained, and it is unclear how representativethe data are for the behavior of the population.The survey period may simply not be longenough to provide a good representation of thepopulation of large striped bass. In California,striped bass may begin spawning in April, butpeak spawning occurs in May and June (Moyle2002). Sampling, which is keyed to delta smeltabundance, may end as large striped bass arebecoming abundant.
Threadfin shad.—Abundance of threadfinshad ranged from 0 to 59,374 fish/10,000 m3
at individual stations over the study periodwith a mean abundance per station of 94 fish/10,000 m3. Mean size of threadfin shad cap-tured during the survey was 12.1 mm (SD =5.3), reflecting the dominance of small fish inthe catch.

EFFECT OF OUTFLOW ON DISTRIBUTION AND ABUNDANCE OF LARVAL AND JUVENILE FISHES 61
Small threadfin shad were primarily dis-tributed upstream of X2 (Figure 3). Except forsporadic small catches close to X2 during theearliest part of the sampling period, mostthreadfin shad were far upstream of X2. Spo-radic catches of threadfin shad in 1999 limitedquantitative analysis to three survey periodsfor small threadfin shad (Figure 3). Examina-tion of the raw data suggested that these threesurveys were generally representative of thebehavior of the population based on years withmore extensive catches. Catches of large thread-fin shad were very inconsistent, especially dur-ing average outflow years, and no quantitativeanalysis was done for large threadfin shad.Large threadfin shad may be less vulnerable tothe sampling gear because they form denseschools in contrast to the larvae, which are moredispersed (Wang 1986).
There was a significant difference amongoutflow periods for distance to Golden Gate(F2,4 = 68.3; P = 0.001) but not for distance toX2 (P > 0.05). Higher outflows were associ-ated with decreased distance to the GoldenGate. The time trend and interaction were notsignificant for either distance parameter (all P> 0.05).
Tridentiger spp.—Abundances of Trident-iger spp. ranged from 0 to 110,262 fish/10,000m3 at individual stations over the study pe-riod and included the highest catch per sta-tion for all of the study fish. Mean abundanceper station over the study period was the sec-ond highest among the study fish at 488 fish/10,000 m3. As explained in the Methods,Tridentiger spp. includes both T. bifasciatus andT. barbatus; however, based on juvenile andadult abundances in another SFE survey, T.barbatus remains rare compared to T. bifasciatus(Greiner 2002).
Because of sporadic catches early in theseason during several years, quantitativeanalysis was limited to three survey periods(Figure 3). As for threadfin shad, the selectionof data for analysis was constrained by lim-ited catches early in the season in most years.Neither distance measured exhibited signifi-cant differences among outflow condition (allP > 0.05). Similarly, neither the time trend northe interaction of time with outflow conditionwere statistically significant (all P > 0.05). Thelack of consistent early season data are likely
the result of differences in timing of spawn-ing among outflow seasons. Moyle (2002) in-dicates that spawning occurs from Marchthrough August. Some catches did occur inMarch and April in the 20-mm Survey; how-ever, Tridentiger spp. did not become a consis-tent part of the catch until late May (Figure 3).Thus, the sampling program may not give anaccurate depiction of the mean position of thepopulation of Tridentiger spp.
Yellowfin goby.—Abundances of yellow-fin goby ranged from 0 to 51,985 fish/10,000m3 at individual stations over the study pe-riod. Mean abundance per station over thestudy period was 212 fish/10,000 m3. Thisspecies tends to spawn earlier than theTridentiger spp., as is evident from capturesduring the early portion of the survey periodfor all outflow conditions.
Yellowfin goby was captured consistentlythrough the survey period, and the mean posi-tion of the population was closely associatedwith X2 (Figure 3). Six survey periods were se-lected for quantitative analysis, including themajority of the available data (Figure 3). Out-flow condition and the time trend were statisti-cally significant in the analysis of distance toGolden Gate (F2,4 = 8.9; P = 0.034 and F5,20 = 6.7;P = 0.001). The population was centered far-ther upstream during lower flows. The centerof the population moved landward as the sea-son progressed. Nothing was statistically sig-nificant in the analysis of distance to X2.
Annual abundance indices
There were few obvious patterns in the an-nual abundance indices (Figure 4). The corre-lation between annual abundance index andoutflow (Table 2) was not significant for anyspecies (all P > 0.05). The delta smelt indextended to be highest in average years. This isconsistent with the hypotheses that duringhigh outflow years (1995 and 1998) larvae aretransported too far downstream and beyondshallow nursery areas (located between theconfluence and Suisun Bay) and that duringlow outflows (1997 and 2001) the residencetime of delta smelt is increased in the centraland south delta where they are subjected tohigher water temperatures and increased en-trainment at the SWP and CVP (Moyle 2002).

62 DEGE AND BROWN
However, the range in the abundance index isnot particularly broad between high and lowindex values. Also, conclusions about highoutflow years must be tentative because of thelack of data from San Pablo Bay.
Longfin smelt had some of the highest in-dex values among the study fish (Figure 4).As with delta smelt, the highest index valuesoccurred during average outflow years.Longfin smelt have a very strong associationwith X2 (Jassby et al. 1995; Kimmerer 2002a,2002b) with the species doing very well dur-ing high outflow years. The low value for theindex during high outflow years is likely dueto large numbers of fish residing in San PabloBay where they would not be sampled by the20-mm Survey.
The annual abundance index for stripedbass had no clear associations with seasonaloutflow conditions, although each low out-flow season (1997 and 2001) had a lower in-dex than the previous year (Figure 4). The an-nual abundance index for threadfin shad washighest during low outflow conditions (Fig-ure 4). This was likely due to warmer tempera-tures being attained earlier during low out-flow conditions, leading to earlier spawningand larger populations of young-of-year fish.
The annual abundance index for the go-bies did not show any clear patterns. Yellow-fin goby was very abundant in a high outflowyear (1995) and an average outflow year(2000). Tridentiger spp. were most abundantin the two low outflow years (1997 and 2001)and an average year (2000).
The only significant correlation amongspecies was between striped bass and yellow-fin goby (Table 2). The significant correlationwas largely due to high values for both spe-cies in 1995 and 2000. The cause for the coin-cidence of these high values is unknown. It isespecially surprising given that yellowfingoby spawns in a more brackish area down-stream of the study area (San Pablo Bay) andmuch of the striped bass spawning occursupstream of the study area (Sacramento River).
Discussion
The 20-mm Survey, implemented primarily asa monitoring tool, provided significant infor-mation on the early life history of important
native and alien species in the upper SFE. Theresults of our analyses showed that the geo-graphic position (distance from Golden Gate)of pelagic larval and early juvenile stage fishwas influenced by outflow conditions; how-ever, no species size-class exhibited statisti-cally significant differences in X2 positionwith outflow conditions. These results are con-sistent with studies showing that larval fishes,including striped bass, longfin smelt, yellow-fin goby, and delta smelt, exhibit local verticaland horizontal migratory behaviors that tendto keep them near the low salinity zone char-acterized by X2 (Bennett et al. 2002). This rela-tionship of fish populations with X2 also sup-ports the idea that manipulating the positionof X2 through water management actions willalter the position of fish populations (Kim-merer 2002b). Such manipulations may bedesirable because the abundance or survivalof several fishes has been linked to the posi-tion of X2 within the estuary (Jassby et al. 1995;Kimmerer 2002a), even if the specific mecha-nisms and processes responsible for this im-portance have not yet been well established(Kimmerer 2002a).
Unfortunately, the usefulness of the 20-mmSurvey data were limited for some species size-classes, primarily those that did not correspondin time with high abundances of large and smalldelta smelt. In particular, peak abundances oflarge striped bass and Tridentiger spp. and bothsizes of threadfin shad may well have occurredafter the conclusion of sampling. In addition,sampling apparently started too late in the sea-son for characterization of small longfin smeltdistribution. Longfin smelt begins spawningthe earliest of all of the species with mostspawning occurring from February to April.Peak delta smelt spawning generally occurs inApril and May (Moyle 2002).
It is interesting that the most complete dataseries were generally obtained for estuarinespecies exhibiting migratory behavior. Deltasmelt, longfin smelt, and striped bass all mi-grate from the estuary to freshwater for spawn-ing and the larvae then move with net outflowtoward X2 (Moyle 2002). The gradual conver-gence of populations of small and large deltasmelt on X2 (Figure 3) or slightly landwardposition of small and large striped bass (Fig-ure 3) can likely be explained by patterns in

EFFECT OF OUTFLOW ON DISTRIBUTION AND ABUNDANCE OF LARVAL AND JUVENILE FISHES 63
upstream recruitment. The bulk of delta smeltspawning is completed during the survey pe-riod, and the bulk of the young fish havemoved out of the freshwater portion of theDelta into the area of X2 by the end of sam-pling. Recruitment of upstream striped basslarvae likely continued for a more extendedperiod, resulting in the center of the popula-tion being located somewhat landward of X2.Yellowfin gobies require salinities of 5 ppt orhigher for successful reproduction (Wang1986) and show a reverse migration withadults moving from Suisun Bay and otherupstream areas to San Pablo Bay where sa-linities allow successful spawning to occur(Fleming 1999). Yellowfin goby larvae appar-ently move upstream into the delta using tidalcurrents (Wang 1986). This upstream move-ment was most apparent in low outflow years(Figure 3).
The annual abundance indices suggestedfew relationships between species and outflowconditions or between species. The lack of cor-relation of species abundances with outflowor among species may be real or simply anartifact of small sample size (N = 7). Given thecomplexity of the system, the factors control-ling species abundances are likely numerousand interactive (Bennett and Moyle 1996),making it unlikely that such simple relation-ships exist. The index itself has several short-comings. Most important, the sampling pro-gram often starts after many of the species havestarted spawning so many fish are missed.Further, for some species, the survey starts atdifferent stages of the spawning season, de-pending on outflow conditions. Finally, anyfish in San Pablo Bay, especially importantduring high outflow conditions, are missed.It seems unlikely that these problems will beaddressed because the design of the survey isdriven by logistical and safety limitations.
As in the upper SFE, studies in other ar-eas show that estuarine species are often abun-dant in low salinity zones (Dodson et al. 1989;Sirois and Dodson 2000), contributing to theidea that such zones serve as important nurs-ery areas for young fishes (Miller et al. 1985;Sirois and Dodson 2000; North and Houde2001). The physical and behavioral mecha-nisms responsible for moving young fishesinto estuarine nursery areas and the reten-
tion of fishes in such areas have been a mainfocus of research interest (Weinstein et al.1980; Miller et al. 1985; Boehlert and Mundy1988; Laprise and Dodson 1989a, 1989b;McGurk 1989; Sclafani et al. 1993; Bennett etal. 2002). It seems reasonable to assume thatin most estuaries, the annual and seasonaldevelopment of low salinity zones and theirassociated biological populations would pro-ceed on similar trajectories each year, perhapsvarying in geographic position within theestuary depending on climatological factors.However, this assumption deserves exami-nation given the ability of human water man-agement activities, particularly diversions, toseverely deplete freshwater inflows to estu-aries with associated effects on biological re-sources (e.g., Aleem 1972; Micklin 1988). Ourability to characterize the annual and sea-sonal dynamics of the relationships of youngfishes with a low salinity zone over an ex-tended time period (7 years) appears to besomewhat unique in the literature. Most stud-ies examining such relationships are limitedto a few sampling periods during a few years.For example, North and Houde (2001) ob-served consistent relationships between fishlarvae and a low salinity zone and estuarineturbidity maximum in Chesapeake Bay butonly had data for a limited number of sam-pling periods (two or three) for 2 years.Kimmerer (2002b) examined 10 likely mecha-nisms for the effects of flow on biota in theSFE and found variable support for each andconcluded that the effects of flow probablyvary among species. In this context of eco-logical uncertainty combined with the highvalue of water in California, few assumptionsremain unchallenged, and the results of ouranalyses will be useful in the understandingthe effects of water management activities onestuarine fish populations.
Despite the difficulties with assessingannual abundance, the 20-mm Survey, de-signed primarily to monitor a single species,has provided valuable insights into the earlylife history of several ecologically importantspecies in the upper SFE. In particular, ouranalyses highlighted the importance of X2 asan organizing principle for understandinglarval fish ecology in the upper SFE. Addi-tional years of sampling will surely result in
64 DEGE AND BROWN
new insights and better understanding of thepatterns of distribution and abundance ofearly life stages of fish in this complex andhighly modified estuary.
Acknowledgments
We would like to thank K. Fleming who pro-vided guidance and technical support and R.Mayfield for contributions to the paper. Lo-gistical support was provided by K. Ambro-sini-Martinelli, M. Bryant, D. Crystal, K. Flow-ers, D. Holden, A. Holmes, N. Kalsa, L. Lynch,P. Macias, G. Schmidt, M. Silva, R. Soto, G.Webb, and S. Yuen. The Interagency Ecologi-cal Program provided program funding andoversight. The 20-mm Survey would not bepossible without the numerous seasonal andscientific aides that assisted with the field aswell as the laboratory components of this fast-paced and demanding monitoring program.
References
Aleem, A. A. 1972. Effect of river outflow managementon marine life. Marine Biology 15:200–208.
Alpine, A. E., and J. E. Cloern. 1992. Trophic interac-tions and direct physical effects control phytoplank-ton biomass and production in an estuary. Limnol-ogy and Oceanography 37:946–955.
Arthur, J. F., M. D. Ball, and M. Y. Baughman. 1996.Summary of federal and state water project envi-ronmental impacts in the San Francisco Bay-DeltaEstuary, California. Pages 445–495 in J. T.Hollibaugh, editor. San Francisco Bay: the ecosys-tem. American Association for the Advancementof Science, San Francisco.
Baldwin, C. M., D. A. Beauchamp, and C. P. Gubala.2002. Seasonal and diel distribution and move-ment of cutthroat trout from ultrasonic telemetry.Transactions of the American Fisheries Society131:143–158.
Bennett, W. A., and P. B. Moyle. 1996. Where have all thefishes gone? Interactive factors producing fish de-clines in the Sacramento-San Joaquin Estuary.Pages 519–542 in J. T. Hollibaugh, editor. San Fran-cisco Bay: the ecosystem. American Associationfor the Advancement of Science, San Francisco.
Bennett, W. A., W. J. Kimmerer, and J. R. Burau. 2002.Plasticity in vertical migration by native and exoticestuarine fishes in a dynamic low-salinity zone.Limnology and Oceanography 47:1496–1507.
Boehlert, G. W., and B. C. Mundy. 1988. Roles of behav-ioral and physical factors in larval and juvenile fishrecruitment to estuarine nursery areas. Pages 51–
67 in M. P. Weinstein, editor. Larval fish and shell-fish transport through inlets. American FisheriesSociety, Symposium 3, Bethesda, Maryland.
Carlton, J. T., J. K. Thompson, L. E. Schemel, and F. H.Nichols. 1990. Remarkable invasion of San Fran-cisco Bay (California, USA) by the Asian clam,Potamocorbula amurensis. 1. Introduction and dis-persal. Marine Ecology Progress Series 66:81–94.
Chadwick, H. K. 1964. Annual abundance of youngstriped bass, Roccus saxatilis, in the Sacramento-San Joaquin Delta. California Fish and Game50:69–99.
Dill, A. W., and A. J. Cordone. 1997. History and statusof introduced fishes in California, 1871–1996. Cali-fornia Department of Fish and Game, Fishery Bul-letin 178, Sacramento, California.
Dodson, J. J., J. C. Dauvin, R. Ingram, and D. B.D’Anglejan. 1989. Abundance of larval rainbowsmelt (Osmerus mordax) in relation to the maxi-mum turbidity zone and associated macroplank-tonic fauna of the middle St. Lawrence Estuary.Estuaries 12:66–81.
Fleming, K. 1999. Gobiidae. Pages 349–368 in J. J. Orsi,editor. Report on the 1980–1995 fish, shrimp, andcrab sampling in the San Francisco Estuary, Cali-fornia. California Department of Water Resources,Interagency Ecological Program, Technical Report63, Sacramento, California.
Floyd, K. B., R. D. Hoyt, and S. Timbrook. 1984. Chro-nology of appearance and habitat partitioning bystream larval fishes. Transactions of the AmericanFisheries Society 113:217–223.
Greiner, T. A. 2002. Records of the shokihaze goby,Tridentiger barbatus (Günther), newly introduced intothe San Francisco Estuary. California Fish and Game88:68–74.
Harvey, B. C. 1987. Susceptibility of young-of-the-yearfishes to downstream displacement by flooding.Transactions of the American Fisheries Society116:851–855.
Herbold, B., A. D. Jassby, and P. B. Moyle. 1992. Statusand trends report on aquatic resources in the SanFrancisco Estuary. San Francisco Estuary Project,U.S. Environmental Protection Agency, Oakland,California.
Hornberger, M. I., S. N. Luoma, A. van Geen, C. Fuller,and R. Anima. 1999. Historical trends of metals inthe sediments of San Francisco Bay, California: anoverview. Marine Chemistry 64:39–55.
Jassby, A. D., and T. M. Powell. 1994. Hydrodynamicinfluences on interannual chlorophyll variability inan estuary: upper San Francisco Bay-Delta (Cali-fornia, USA). Estuarine, Coastal, and Shelf Science39:595–618.
Jassby, A. D., W. J. Kimmer, S. G. Monismith, C. Armor,J. E. Cloern, T. M. Powell, J. R. Schubel, and T. J.Vendlinski. 1995. Isohaline position as a habitatindicator for estuarine populations. EcologicalApplications 5:272–289.
Kimmerer, W. J. 2002a. Effects of freshwater flow on

EFFECT OF OUTFLOW ON DISTRIBUTION AND ABUNDANCE OF LARVAL AND JUVENILE FISHES 65
abundance of estuarine organisms: physical effectsor trophic linkages. Marine Ecology Progress Series243:39–55.
Kimmerer, W. J. 2002b. Physical, biological, and man-agement responses to variable freshwater flow intothe San Francisco Estuary. Estuaries 25:1275–1290.
Kimmerer, W. J., J. R. Burau, and W. A. Bennett. 2002.Persistance of tidally-oriented vertical migrationby zooplankton in a temperate estuary. Estuaries25:359–371.
Kimmerer, W. J., and J. J. Orsi. 1996. Changes in the zoop-lankton of the San Francisco Bay Estuary since theintroduction of the clam, Potamocorbula amurensis.Pages 403–424 in J. T. Hollibaugh, editor. San Fran-cisco Bay: the ecosystem. American Association forthe Advancement of Science, San Francisco.
Kuivila, K. M., and C. G. Foe. 1995. Concentrations, trans-port and biological effects of dormant spray pesti-cides in the San Francisco Estuary, California. Envi-ronmental Toxicology and Chemistry 14:1141–1150.
Laprise, R., and J. J. Dodson. 1989a. Ontogenetic changesin the longitudinal distribution of two species oflarval fish in a turbid well-mixed estuary. Journalof Fish Biology 35(Supplement A):39–47.
Laprise, R., and J. J. Dodson. 1989b. Ontogeny and im-portance of tidal vertical migrations in the retentionof larval smelt Osmerus mordax in a well-mixed es-tuary. Marine Ecology Progress Series 55:101–111.
Matern, S. A., P. B. Moyle, and L. C. Pierce. 2002. Nativeand alien fishes in a California estuarine marsh:twenty-one years of changing assemblages. Trans-actions of the American Fisheries Society 131:797–816.
McGurk, M. D. 1989. Advection, diffusion and mortal-ity of Pacific herring larvae, Clupea harengus pallasi,in Bamfield Inlet, British Columbia. Marine Ecol-ogy Progress Series 51:1–18.
Micklin, P. P. 1988. Desiccation of the Aral Sea: a watermanagement disaster in the Soviet Union. Science241:1170–1176.
Miller, J. M., L. B. Crowder, and M. L. Moser. 1985.Migration and utilization of estuarine nurseries byjuvenile fishes: an evolutionary perspective. Con-tributions to Marine Science 27:338–352.
Moyle, P. B. 2002. Inland fishes of California. Revisedand expanded. University of California Press, Ber-keley.
Moyle, P. B., and J. J. Cech, Jr. 1999. Fishes: an introduc-tion to ichthyology, 4th edition. Prentice Hall,Englewood Cliffs, New Jersey.
Nichols, F. H., J. E. Cloern, S. N. Luoma, and D. H.Peterson. 1986. The modification of an estuary.Science 231:567–573.
Nichols. F. H., J. K. Thompson, and L. E. Schemel. 1990.
Remarkable invasion of San Francisco Bay (Cali-fornia, USA) by the Asian clam, Potamocorbulaamurensis. 2. Displacement of a former commu-nity. Marine Ecology Progress Series 66:95–101.
North, E. W., and E. D. Houde. 2001. Retention of whiteperch and striped bass larvae: biological-physicalinteractions in Chesapeake Bay estuarine turbiditymaximum. Estuaries 24:756–769.
Robinson, A. T., R. W. Clarkson, and R. E. Forrest. 1998.Dispersal of larval fishes in a regulated river tribu-tary. Transactions of the American Fisheries Soci-ety 127:772–786.
Sclafani, M. C., C. T. Taggart, and K. R. Thompson.1993. Condition, bouyancy and the distribution oflarval fish: implications for vertical migration andretention. Journal of Plankton Research 15:413–435.
Sirois, P., and J. J. Dodson. 2000. Critical periods andgrowth-dependent survival of larvae of an estua-rine fish, the rainbow smelt, Osmerus mordax. Ma-rine Ecology Progress Series 203:233–245.
Stevens, D. E. 1977. Striped bass (Morone saxatilis) yearclass strength in relation to river flow in the Sacra-mento-San Joaquin Estuary, California. Transac-tions of the American Fisheries Society 106:34–42.
Stevens, D. E., and L. W. Miller. 1983. Effects of riverflow on abundance of young chinook salmon,American shad, longfin smelt, and delta smelt inthe Sacramento-San Joaquin River system. NorthAmerican Journal of Fisheries Management 3:425–437.
SYSTAT Software, Inc. 2002. SYSTAT 10.2, Statistics I.SYSTAT Software, Inc. Richmond, California.
The Bay Institute. 1998. From the Sierra to the sea. TheBay Institute of San Francisco, San Rafael, Cali-fornia.
Turner, J. L., and H. K. Chadwick. 1972. Distributionand abundance of young-of-the-year striped bass,Morone saxatilis, in relation to river flow in the Sac-ramento-San Joaquin Estuary. Transactions of theAmerican Fisheries Society 101:442–452.
Turner, J. L., and D. W. Kelley. 1966. Ecological studiesof the Sacramento-San Joaquin Delta, Part II, fishesof the delta. California Department of Fish andGame, Fish Bulletin 136, Sacramento, California.
Wang, J. C. S. 1986. Fishes of the Sacramento-San JoaquinEstuary and adjacent waters, California: a guideto their early life histories. California Departmentof Water Resources, Interagency Ecological Pro-gram, Technical Report 9, Sacramento, California.
Weinstein, M. P., S. L. Weiss, R. G. Hodson, and L. R.Gerry. 1980. Retention of three taxa of postlarvalfishes in an intensively flushed tidal estuary, CapeFear River, North Carolina. U.S. Fishery Bulletin78:419–436.
