effect of nutrients on extracellular...
TRANSCRIPT
i
EFFECT OF NUTRIENTS ON EXTRACELLULAR POLYMERIC SUBSTANCE PRODUCTION AND SLUDGE CHARACTERISTICS
by
Pham Thi Hoa
A thesis submitted in partial fulfilment of the requirement for the Degree of Master of Engineering.
Examination committee: Prof. C. Visvanathan (Chairman) Dr. Sudip K Rakshit Dr. Seung-Huan Lee Nationality: Vietnamese Previous Degree: Bachelor of Engineering (Chemical)
Ho Chi Minh City University of Technology Viet Nam Scholarship Donor: Asian Development Bank
Asian Institute of Technology School of Environment, Resources and Development
Thailand August 2002

ii
Acknowledgements I would like to express my high appreciation and faithful gratitude to my advisor, Prof. C. Visvanathan for his valuable guidance, suggestion and encouragement through the time of the study. I also wish to express deepest sincere thanks to Dr. S. K. Rakshit and Dr. S-H. Lee for their valuable comments, critical ideas and serving as members to examination committee. I am gratefully acknowledgement Asian Development Bank (ADB) for his financial support. Without this support, I could not manage to finish the graduate study. A special thank is extended to lab supervisors, Ms. Salaya, Mr. Peter and Mr. Chai, technicians Khun Verin, Khun Tam and others. Sincere acknowledgement is dedicated to Dr. N. P. Dan for his kindly suggestion and guidance. I also would like to thank to Miss Loshnee for helping me to edit this thesis. Over and above, I wish to offer respectfully this thesis to my beloved parents, who nourish and teach me, laying the trust on my study progress. Last but not least, many thanks go to my friends who are always by my side during the study.
iii
Abstract This study aimed to investigate the effects of nutrients (nitrogen and phosphorus) on EPS production, sludge settling and dewatering. Several sludge and wastewater samples were collected to analyze. The relationship between the involving factors and EPS production, the effects of EPS on sludge properties, and the effects of nutrients on EPS were investigated. The survey study revealed that although filamentous microorganism was found in most sludge samples, they did not always cause sludge bulking. It could be served as backbone for the sludge flocs. EPS production was different at various operational conditions. EPS production was found lower in anaerobic processes than in aerobic ones. It was also observed that attached growth system produced lower EPS than suspended growth. The reduction of EPS in attached growth could be caused by the absorption of EPS on the media and/or the reduction of excretion EPS from the attached microorganism. Nutrient content in feed seemed to have no direct correlation with EPS production and sludge properties. EPS variation could be directly linked to SVI values, but not with CST and effluent quality. Several lab-scale batch experiments were conducted to investigate the more detailed effect of nitrogen and phosphorus content on EPS and its components related to sludge settling and dewatering. Nutrient effect was done in the wide range of nutrient deficiency and excess. COD removal was found stable and average reached 93% for all reactors. From the sludge analysis, it was apparent that EPS components (protein and carbohydrate) affected sludge properties more than total EPS. Within two EPS components, protein affected sludge properties more than carbohydrate. Nitrogen affected both protein and carbohydrate while phosphorus only affected carbohydrate. Both nitrogen deficiency (COD:N < 100:2) and nitrogen excess (COD:N > 100:10) improves sludge properties. Nitrogen excess caused another problem with high nitrogen content in the effluent. Optimum phosphorus ratio was in the range of COD:P of 100:3 to 100:5 at which sludge properties including settling, dewatering and clarifying were improved.
iv
Table of Contents
Chapter Title Page
Title Page i Acknowledgements ii Abstracts iii Table of Contents iv
List of Tables vi List of Figures vii List of Abbreviation ix
1 Introduction 1
1.1 Background 1
1.2 Objectives of the study 2
1.3 Scopes of the study 2
2 Literature Review 3
2.1 Introduction 3
2.2 Bioflocculation and EPS in activated sludge process 3
2.3 Extracellular polymeric substances 5
2.3.1 Concept of EPS 5 2.3.2 EPS compositions 5 2.3.3 Ecological function of EPS: Adhesion and cohesion 5 2.3.4 Differently of EPS in activated process and anaerobic process 6 2.3.5 Effects of EPS in biological process 7 2.3.6 EPS extraction methods. 14
2.4 Factors effecting on EPS production and sludge settling and dewatering properties 16
2.4.1 Substrate composition (carbon sources) 16 2.4.2 Sludge load 17 2.4.3 Sludge age or sludge retention time (SRT) 18 2.4.4 Dissolved oxygen (DO) 21 2.4.5 Temperature 21 2.4.6 pH 22 2.4.7 Cations 22
2.5 Role of nutrients and their effects on EPS and sludge properties 23

v
3 Methodology 26
3.1 Introduction 26
3.2 Survey Study 27
3.3 Lab-scale Experimental Study 28
3.3.1 Feed wastewater 29 3.3.2 Seed sludge 29 3.3.3 Parametric study: pH values 29 3.3.4 Experimental Set-up 30 3.3.5 Sludge characterization study 32 3.3.6 Statistical analysis 32 3.3.7 Analytical methods 32
4 Result and discussion 35
4.1 EPS in bioflocculation and dewatering: An analytic approach 35
4.2 General characteristics of the plants and the sludge samples 35
4.2.1 EPS extraction 38 4.2.2 Multi correlation among EPS, sludge properties and plant
operation conditions 38 4.2.3 Effect of operations conditions on total EPS 41 4.2.4 Effect of nutrient on EPS production and sludge properties 43
4.3 Effects of nutrients on EPS production: Laboratory Analysis 45
4.3.1 Overall performance of reactors 45 4.3.2 Parametric study: pH value 47 4.3.3 Sludge characteristic study 49 4.3.4 Influence of nutrients on EPS compositions 51 4.3.5 Influence of EPS compositions on sludge properties with the
changing of nutrients 57 4.3.6 Effects of nutrients on sludge properties 58
5 Conclusions and Recommendations 65
5.1 Conclusion 65
5.2 Recommendation 66
Reference 70 Appendix 75

vi
List of Tables
Table Title Page 2.1 Compositions of EPS of activated sludge floc and range of
component concentration (Flemming and Wingender, 2001) 5 2.2 Composition of EPS from agar-grown biofilm of Pseudomonas
aeruginosa (Flemming and Wingender, 2001) 5 2.3 Relationship between the amount of EPS from activated sludge
and sludge settleability from the literature (Urbain et al., 1993) 10 2.4 Comparison of EPS yield for three different extraction
procedures (Frølund et al., 1998) 15 2.5 Summary in extraction method 15 2.6 Existing relationship between sludge settlement and nutrients
(Forster, 1985) 23 2.7 Effect of nutrients (COD:N:P) on the composition of EPS and
physicochemical properties of microbial floc (Bura et al., 1998) 24 3.1 Measured parameters at sampling points 28 3.2 Investigated operating conditions 28 3.3 Composition of feed wastewater (Modified from Chao and
Kienath, 1979) 29 3.4 Operating conditions of batch reactors 30 3.5 Variations of COD:N:P ratio in the experimental study 30 3.6 Parameters and their analysis methods 34 4.1 Wastewater characteristics of the surveyed samples 36 4.2 Mean values, standard deviations (SD) for the variables from 36 4.3 Qualitative scale for the presence of filamentous microorganism 37 4.4 EPS production, wastewater and sludge characteristics 38 4.5 Descriptive Statistics 39 4.6 Linear coefficients of the correlation statistically significant at a
0.95 probability level (α = 5 %), i.e. r ≥ 0.5 39 4.7 Characteristics of feed sludge taken from Chong Nonsi WWTP 45 4.8 Summary of performance of mixed bacteria reactors 46 4.9 COD removal data 47 4.10 EPS production and its components 52 4.11 Descriptive statistic with different phosphorus concentration 54 4.12 ANOVA result with different phosphorus concentration 54 4.13 Descriptive statistic with different nitrogen concentration 54 4.14 ANOVA result with different nitrogen concentration 55 4.15 Sludge properties at different nutrient concentration in feed. 57 4.16 Correlations between sludge properties and EPS, EPS
components. 58 4.17 Nitrogen and phosphorus content in the feed and in effluent in
all reactors 61

vii
List of Figures
Figure Title Page
2.1 Floc structure 4 2.2 The sludge floc: EPS (dark colour) is bridging the cells (Shin et
al., 2001) 4 2.3 Accumulation of exocellular polymers with phase of growth in
activated process (A) and anaerobic process (B) (Glucose as carbon source) 7
2.4 A possible structure for activated sludge flocs 9 2.5 Relationship between effluent suspended solids and EPS
production 10 2.6 Effect of carbohydrate content of EPS on CST (Houghton et al.
(2000)) 11 2.7 The variations in the carbohydrate content of EPS in relation to
the SVI 11 2.8 Schematic illustration of membrane biofouling process 13 2.9 Variation of SVI with sludge age for different substrates 17 2.10 Effect of process loading intensities on SVI 17 2.11 Effect of PLI on EPS production 18 2.12 Total EPS mass per MLVSS versus sludge age 18 2.13 Effect of SRT on the production of EPS components under
stable operating conditions (Liao et al., 2001). 19 2.14 Effect of SRT on total EPS content and the proportion of EPS
components during stable operating conditions (Liao et al., 2001) 20
2.15 Variation of SVI as a function of sludge age 20 2.16 Relationship between capillary suction time and sludge age 20 2.17 A general model for flocs built by floc-forming activated sludge
bacteria 21 2.18 Effect of F/M ratio on the production of sludge protein 24 2.19 Effect of nitrogen and phosphorus on total EPS and EPS
components 25 3.1 Flowchart of different phases of experimental study 26 3.2 Flow chart of the survey study. 27 3.3 Sampling points in wastewater treatment plants 27 3.4 Flow chart of the experimental study. 28 3.5 Operation mode of SBR process 31 4.1 Effect of EPS production on SVI value 40 4.2 Effect of EPS production on CST value 40 4.3 Relationship between EPS and effluent SS 41 4.4 EPS production and sludge properties in suspended and attached
growth (MBR1: suspended growth; MBR2: attached growth) 43 4.5 Effect of nitrogen on EPS production 43 4.6 Effect of phosphorus on EPS production 44 4.7 Effect of nitrogen on sludge settling and dewatering 44 4.8 Effect of phosphorus on sludge settling and dewatering 44 4.9 Variation of COD removal, biomass in the reactors which
COD:N:P of 100:5:1 47

viii
4.10 pH profile of two reactors: 1) Nitrogen present; 2) High phosphorus level 48
4.11 COD profile of the reactors which had COD:N:P= 100:5:1 49 4.12 The color changing with the increasing of nitrogen (COD:N =
100:1; 100:2; 100:3; 100:5) at the phosphorus level of 4mg/L (COD:P = 100:0.5) Error! Bookmark not defined.
4.13 The color changing with the changing of nitrogen and phosphorus content (COD:N:P = 100:3:5; 100:10:0.5; 100:100:1; 100:10:2) 50
4.14 Activated sludge and EPS (EPS is the white substances, black dots are biomass) 50
4.15 EPS production and its components content with the increasing of nitrogen at phosphorus concentration of 4 mg/L 51
4.16 EPS production and its components content with the increasing of nitrogen at phosphorus concentration of 8 mg/L 52
4.17 EPS production and its components content with the increasing of nitrogen at phosphorus concentration of 16 mg/L 53
4.18 EPS production and its components content with the increasing of phosphorus concentration at nitrogen concentration of 24 mg/L 53
4.19 Partial regression between nitrogen and protein 55 4.20 Partial regression between phosphorus and protein 55 4.21 Partial regression between nitrogen and carbohydrate 56 4.22 Partial regression between phosphorus and carbohydrate 56 4.23 Effects of nitrogen on sludge settling or SVI value at different
phosphorus concentration 59 4.24 Effects of nitrogen on sludge dewatering or CST value at
different COD:P ratios 59 4.25 Effects of nitrogen on sludge clarifying or effluent turbidity at
different COD:P ratios 60 4.26 The variation of nitrogen and phosphorus content in effluent
versus nitrogen and phosphorus content in the feed. 62 4.27 Effect of phosphorus concentration in the feed on sludge settling
at COD:N ratio of 100:3 62 4.28 Effect of phosphorus concentration in the feed on sludge
dewatering at COD:N ratio of 100:3 63 4.29 Effect of phosphorus concentration in the feed on sludge
clarifying at COD:N ratio of 100:3 63 4.30 Relationship between phosphorus content and EPS carbohydrate 64

ix
List of Abbreviations
EPS Extracellular Polymeric Substance Q Flow Rate VLR Volumetric Loading Rate Ve Aeration Tank Volume Vs Settling Tank Volume SVI Sludge Volume Index CST Capillary Suction Time HRT Hydraulic Retention Time SRT Sludge Retention Time MLSS Mixed Liquor Suspended Solid MLVSS Mixed Liquor Volatile Suspended Solid MBR Membrane Bioreactor AS Activated Sludge WWTPs Wastewater Treatment Plants DM Dry Matter TOC Total Organic Carbon ge Glucose equivalent CER Cation Exchange Resin PLI Process Loading Intensity BOD Biological Oxygen Demand COD Chemical Oxygen Demand EDTA Eethylenedianetetraacetic acid P Significance level F F-test Y Yield coefficient

1
Chapter 1
1 Introduction 1.1 Background
In wastewater treatment systems, biological treatment process is one of the most important and popular systems that have been used for domestic and industrial wastewater treatment until now. Organic waste is converted to more stable inorganic form by the application of various biological treatment processes. Among the numerous available methods, the activated sludge process is one of the major biological wastewater treatment techniques. This process consists of two units: a bioreactor where organic waste is digested by microorganisms, and sedimentation basin where activated sludge is separated from the treated effluents. The first is the complete assimilation of the suspended and colloidal organic material by the active mass of microorganisms to a final end product of carbon dioxide, water, and inert material in the aerated biological reactor. This phase is the carbon source utilization phase. The second phase is the flocculation of the microorganisms and others suspended or colloidal components into a readily settleable mass. Thus a clear, low biochemical oxygen demand (BOD) effluent can be obtained and this phase plays an important role in production a high-quality effluent. Biological aggregation provides a convenient and effective method for solid-liquid separation of microbial species from mixed liquor medium after they have fulfilled their metabolic role. Flocculation of biomass is responsible for changes in supernatant turbidity and variation in settling and dewatering properties. Therefore the overall function of the activated sludge process depends largely on good flocculation and sedimentation behavior of the sludge. At least 25 % of the activated sludge treatment units concern with settling problems (SVI ≥ 150 or 200 ml/g) (Urbain et al., 1993). Poor settlement of activated sludge leads to a discharge of suspended solid into the receiving water as well as the operational problems in wastewater treatment plants. The problems in activated sludge process originate from deflocculating of biomass in the sedimentation basin due to lack of the natural extracellular polymeric substance (EPS) flocculants (Sheintuch et al., 1986). It was reported that the EPS produced by bacteria have an important role in controlling the flocculation and floc properties including settling and dewatering (Bura et al., 1998). EPS is macromolecular compounds that found in the intercellular space of microbial aggregates. They originate from microorganisms (excretion and lysis) and wastewater (biosorption). It was studied that EPS is the major components of activated sludge flocs matrix. The mechanism of the biological flocculation is interpreted as the result of the interaction of those polymers that have sufficiently accumulated at the microbial surface during endogenous growth. The EPS present a dominant bridging mechanism between the floc components- cellular, bioorganic, and inorganic. By controlling EPS production, the settling and dewatering of biomass can be improved. There may be many factors affecting on the EPS production such as control operation condition (sludge retention time, pH, ratio of food/microoganism F/M, hydraulic retention time etc…). It was found that one of the methods to control EPS is controlling the nutrients of the feed wastewater. The nature and concentration of nutrients effect the biodegradation of organic waste. Nutrients are necessary components for the growth of bacteria and they can also stimulate the production of surface biopolymers EPS, which related to settlement

2
of the sludge. Until now, there are a few studies on the effects of nutrient balance (COD:N:P) on EPS production and composition and settling and dewatering of sludge. By optimizing the nutrients ratio, EPS can be controlled. Thus the efficiency of the secondary treatment process can be improved. This study focuses on the effect of nutrients (nitrogen and phosphorus) on EPS and on sludge settleability and dewaterability. 1.2 Objectives of the study
The objectives of this study are: 1 To survey the biological sludge properties from different wastewater treatment plants
(WWTPs) and lab-scale reactors and to investigate the treatment plant operation with the EPS concentration.
2. To investigate the effects of nutrients (nitrogen and phosphorus) on EPS. 1.3 Scopes of the study
This study contains two phases. 1) Survey phase; 2) Experimental phase. 1. In the survey phase, properties of biological sludge and wastewater characteristics from
15 WWTPs and 4 lab-scale reactors were sampled and analyzed. In addition, information their operating conditions was also collected. The relationship between EPS and affecting factors was evaluated by statistical analysis.
2. In the experimental phase, lab-scale batch reactors were used. The compositions of feed wastewater includes
• Glucose as carbon source. • Inorganic salt NH4Cl as nitrogen source, and K2HPO4 as phosphorous source.
Variations of COD:N:P ratio were conducted to find out the optimum COD:N:P ratio.
Based on the settling and dewatering characteristics of sludge, the optimum COD:N:P value was investigated.

3
Chapter 2
2 Literature Review 2.1 Introduction
This chapter reviews the literature on the following areas: 1) Bioflocculation and EPS in activated sludge process; 2) Extracellular polymeric substances (Concept of EPS, EPS compositions and functions); 3) EPS in aerobic and anaerobic process; 4) EPS’s effect in biological system; 5) EPS extraction methods; 6) Factors effecting EPS and sludge properties; and 7) Role of nutrients and their effects on EPS and sludge properties. 2.2 Bioflocculation and EPS in activated sludge process
Biological processes are more and more applied to treat wastewater nowadays. Firstly, organic waste is introduced into the reactor where aerobic bacteria are maintained in suspension. In the reactor, the bacterial culture carry out the conversion in general accordance with the stoichiometry shown in the reaction (2.1) and (2.2) Oxidation and synthesis: bacteria COHNS + O2 + Nutrients CO2 + NH3 + C5H7NO2 + other end products (2.1) (organic (new bacterial matter) cell) Endogenous respiration: bacteria C5H7NO2 + 5O2 5CO2 + 2H2O + NH3 + energy (2.2) (cells) In the aeration tank, a portion of the organic waste is used by the aerobic and facultative bacteria to obtain energy for the synthesis of the organic material in to new cells. Only a portion of the original waste is actually oxidized to low-energy compounds such as NO3
-, SO4
2- and CO2, the remainder is synthesized into the cellular material. Also, many intermediate products are formed before the end products (Metcalf & Eddy, 1991).
Further, although it is important that bacteria decompose the organic waste as quickly as possible, it is also important that they form a satisfactory floc, which is a prerequisite for the effective separation of the biological solids in the settling unit. It is therefore necessary to fully understand floc formation. To get high treatment efficiency, the flocs and effluent must be separated by good settlement. The settled biomass is largely returned to the aeration tank to maintain low F/M ratio. Low F/M ratio which makes the bacterial cells easily aggregate is not only for flocs formation but also to ensure treatment process to proceed quickly. There were several investigation have been carried out on the formation and structure of floc. However, they are complicated and not yet completely understood. There are many factors concerning in floc formation (Eikelboom, 2000):
• Slime polymer compounds produced by bacteria like glue for sticking cells together.

4
• Bacteria are negative charge. Thus they are bond with positively charged ions such as Ca2+, Mg2+ to form flocs.
• Some bacteria form a network of extremely thin filaments (fibrils) around their cells. This network will contribute to the bonding of the cells and to entrapment of other bacteria and particles. Figure 2.1 shows the structure of sludge floc.
PO43-
Divalent cation
COO-
bacteria cell
EPS
Figure 2.1 Floc structure Li and Ganczarczyk (1989) studied about the structure of activated flocs. It was found that large amount of EPS of microbial origin which were the end products in the Equation (2-1) were present within activated sludge flocs. Many microbial cells were completely surrounded by the polymers. Figure 2.2 shows the microstructures of the microbial floc that were examined using transmission electron microscopy (Shin et al., 2001).
Figure 2.2 The sludge floc: EPS (dark colour) is bridging the cells (Shin et al., 2001) Microorganisms, water and EPS are irregulately dispersed within the flocs. EPS are the major component within the floc. EPS are elastic and can be squeezed under hydaulic pressure to make water paths more favorable to the passing flow (Li and Ganczarczyk, 1989).
5
2.3 Extracellular polymeric substances 2.3.1 Concept of EPS
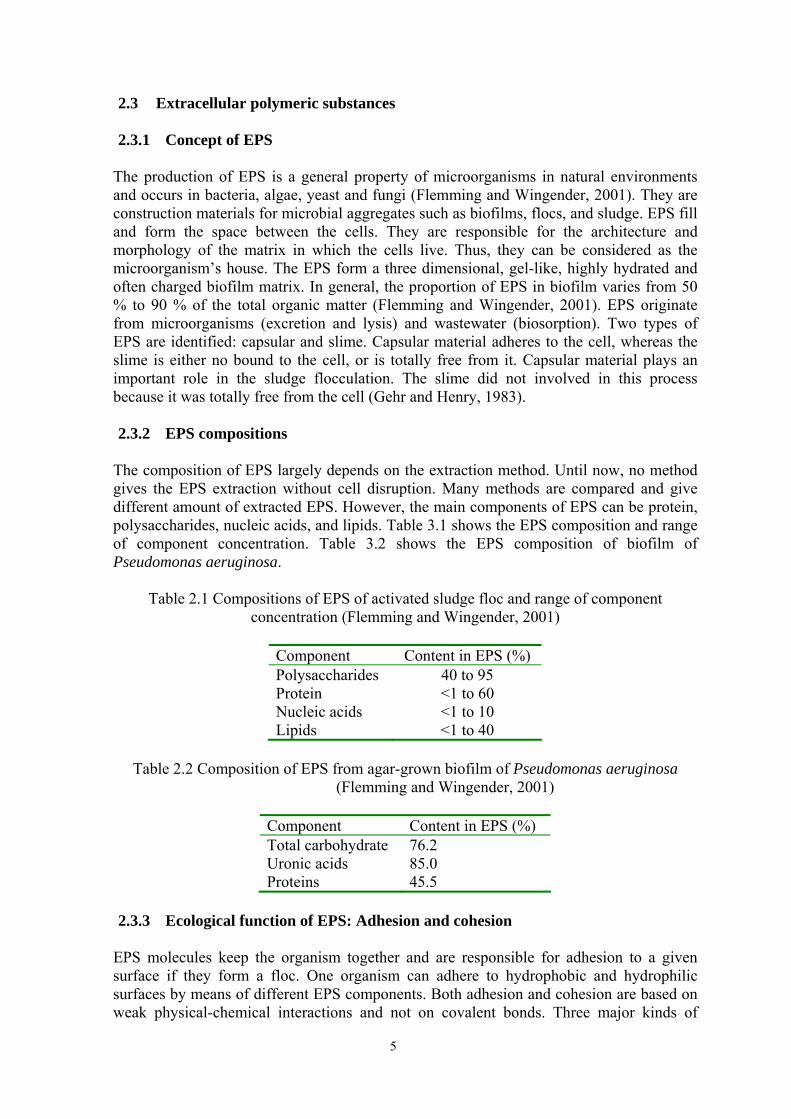
The production of EPS is a general property of microorganisms in natural environments and occurs in bacteria, algae, yeast and fungi (Flemming and Wingender, 2001). They are construction materials for microbial aggregates such as biofilms, flocs, and sludge. EPS fill and form the space between the cells. They are responsible for the architecture and morphology of the matrix in which the cells live. Thus, they can be considered as the microorganism’s house. The EPS form a three dimensional, gel-like, highly hydrated and often charged biofilm matrix. In general, the proportion of EPS in biofilm varies from 50 % to 90 % of the total organic matter (Flemming and Wingender, 2001). EPS originate from microorganisms (excretion and lysis) and wastewater (biosorption). Two types of EPS are identified: capsular and slime. Capsular material adheres to the cell, whereas the slime is either no bound to the cell, or is totally free from it. Capsular material plays an important role in the sludge flocculation. The slime did not involved in this process because it was totally free from the cell (Gehr and Henry, 1983). 2.3.2 EPS compositions
The composition of EPS largely depends on the extraction method. Until now, no method gives the EPS extraction without cell disruption. Many methods are compared and give different amount of extracted EPS. However, the main components of EPS can be protein, polysaccharides, nucleic acids, and lipids. Table 3.1 shows the EPS composition and range of component concentration. Table 3.2 shows the EPS composition of biofilm of Pseudomonas aeruginosa.
Table 2.1 Compositions of EPS of activated sludge floc and range of component concentration (Flemming and Wingender, 2001)
Component Content in EPS (%) Polysaccharides Protein Nucleic acids Lipids
40 to 95 <1 to 60 <1 to 10 <1 to 40
Table 2.2 Composition of EPS from agar-grown biofilm of Pseudomonas aeruginosa
(Flemming and Wingender, 2001)
Component Content in EPS (%) Total carbohydrate Uronic acids Proteins
76.2 85.0 45.5
2.3.3 Ecological function of EPS: Adhesion and cohesion
EPS molecules keep the organism together and are responsible for adhesion to a given surface if they form a floc. One organism can adhere to hydrophobic and hydrophilic surfaces by means of different EPS components. Both adhesion and cohesion are based on weak physical-chemical interactions and not on covalent bonds. Three major kinds of

6
adhesion force are electrostatical interactions, hydrogen bonds and dispersion forces. The individual of all these interactions is relatively small compared to a covalent C-C bond. However, the total binding energy of weak interaction between EPS molecules multiplied by a large number with binding sites available in the macromolecules add up to bond values exceeding those of covalent C-C bonds. Three types of binding forces are expected to contribute to the overall stability of floc and biofilm. The result is the formation of a three dimensional, gel-like network of EPS structure and the properties may vary dynamically as the microorganism respond to changes in environmental conditions (Flemming and Wingender, 2001). The floc which is dominated by polysaccharides with carboxyl groups, calcium acts as an important bridging ion which increases the stability of the network significantly. It is also the case for copper and iron. EPS are not totally insoluble in water. A certain amount of EPS is lost to the effluent in wastewater treatment system and contributes to process parameters such as an increase in COD.
2.3.4 Differently of EPS in activated process and anaerobic process
EPS in anaerobic sludges are different from activated sludge. Morgan et al. (1989) showed that EPS yield from digested sludge around 4 % of total dried sludge solid, considerablely less than that reported for activated sludge. Jia et al (1996) found that each gram of suspended solids in UASB granules contained less EPS (10 to 20 mg) than those in activated sludge (70 to 90 mg). It was explained by Morgan et al. (1990) that under anaerobic conditions, bacteria might quickly degrade bacteria biopolymers, forming CO2 and CH4 as by products. In addition, the production of exopolysaccharides was restricted in methanogenic bacteria while anaerobic sludges possess a strong population of methanogenics. Methanogenic bacteria do not possess peptidoglycan in their cell walls. One essential component to peptidoglycan synthesisis is a lipid carrier molecule (undecaprenyl phosphate). This lipid carrier has also been implicated in the release of exopolysaccharides and capsule formation. In methanogens, this component might be missing and so exopolysaccharides in addition to peptidoglycan synthesis would be limited. Jia et al. (1996) investigated many batch reactors for anaerobic sludge with three different carbon sources. The result showed that EPS and their main components (protein and carbohydrate) production depend on the growth phase of microorganism. They increased at the beginning of all batches when the microorganisms were in the profilic-growth phase, having high substrate concentration and F/M ratio. They are gradually returned to their initial levels when the microorganism was in the declined-growth phase, as the substrate became depleted.
Horn et al. (2001) reported that EPS can serve as carbon source and energy source during the substrate limited conditions. So the lower concentrations of EPS are present in anaerobic systems. It was reported that EPS production reached the maximum level and maintain nearly constant during endogenous phase or declined phase in aerobic system (Pavoni et al., 1972). While it decreased to the initial levels when the microorganisms were in the declined-growth phase in the anaerobic system (Figure 2.3).

7
Figure 2.3 Accumulation of exocellular polymers with phase of growth in activated
process (A) and anaerobic process (B) (Glucose as carbon source) The EPS composition also differs between aerobic and anaerobic system. In activated sludge, the dominant component of EPS is carbohydrate. However, in general, anaerobic sludge tends to have higher concentration of protein in their extracted polymers. Morgan et al. (1990) quoted protein:carbohydrate ratios of approximate 3:1 for digested sludge EPS while this ratio of 0.7:1 for activated sludge. 2.3.5 Effects of EPS in biological process
a. Effect of EPS on sludge surface charge and hydrophobicity
Floc in activated sludge usually carries negative charge at neutral pH, usually between -10 to -20 mV (Jia et al., 1996). This was due to the ionization of the anionic functional groups, such as carboxylic and phosphate, on the sludge surface. If the electronegativity of the floc surface was sufficient large (larger than the upper limit –20 mV), repulsion might occur and hold the particle far apart that would cause the sludge settling properties to deteriorate (Morgan et al., 1989). Biopolymers were thought to be influential in determining the sludge surface charge. Since EPS are polymer accumulated on the surface of microorganisms, it is most likely that the surface charge is due to the EPS’s functional groups, which carry either positive or negative charge depending on the nature of groups and pH. At neutral pH, functional groups such as carboxylic and phosphate carry negative charge, while those like amino groups carry positive charge. Therefore, surface charge of sludge was strongly dependent on the EPS’s chemical group composition and concentration (Jia et al., 1996). Morgan et al. (1989) reported that the higher yield of the EPS correlating with the greater value of overall electronegativity of the sludge surface. Activated sludge yields more EPS than anaerobic sludge and also have more negatively charge sludge surface. This suggested that the amount of EPS could be responsible for determining the sludge surface charge characteristic of the sludge. In addition, the nature or physico-chemical properties of EPS also influent in sludge surface charge. Negatively surface charge decreased with the increasing of protein:carbohydrate ratio. So it supported that high concentration of anionic surface biopolymers (carbohydrate) can consequently be correlated with deteriorating sludge settling characteristics because of the influence of the floc-repulsion.
Hours of growth
EPS
(mg/
g M
LSS)
0.1
0.2
0.
3 0
.4
20 40 60 80 100 140
EPS
(mg/
g M
LVSS
)
5 1
0 1
5 2
0 2
5 3
0 3
5
Hours of growth
Protein
Carbohydrate
10 20 30 40
A B

8
Not only carbohydrate but also protein was found to have effect on surface charge of anaerobic sludge (Jia et al, 1996). The negative charge was found to increase linearly with the proteinaceous fraction of EPS for sludge degrading propionate, butyrate. For sludge degrading glucose, EPS increased linearly with an increase in total EPS content, regardless of the individual contents of protein of carbohydrate. b. Hydrophobic and hydrophilic properties of sludge surface
Hydrophobicity interactions involve in the mechanisms of floc forming based on bacteria aggregation and adhesion. Jorand et al. (1998) reported that hydrophobic interactions involve in the cohesion form flocs of sludge. Hydrophobic effect originated from the behaviors of entities (particles or molecules) incapable of electrostatic interaction or cannot establish hydrogen bonds with water. So hydrophobic properties of sludge make them drawn together in water. Hydrophobicity can be contributed by other factors and EPS components (Liao et al., 2001). Hydrophobicity and surface charge are not influenced by the total EPS content of the sludge. But the proportion of EPS components (protein/total carbohydrates) is more important than the quantities of individual EPS components in flocculation. The evidences that hydrophobic interactions play an important role in flocculation forming and settlement of sludge were observed by many studies (Jorand et al, 1998).
• The adhesion to the flocs is dependent on the overall hydrophobicity. Hydrophobic bacteria are preferred to adhere to the flocs (Jorand et al. (1994); Zita and Hermansson (1997)).
• It was showed by spectroscopic that hydrophobic zones presence in activated sludge flocs.
• Hydrophobic cells presence in the activated sludge and their variation depend on the cell’s physiological state.
• The activated sludge flocs trap the low soluble organic compounds. • The existence of a positive link between sludge settleability and floc
hydrophobicity (Urbain et al., 1993) • The significant increase in flocculation when short alkyl chains were grafted on
synthesis polymers.
Zita and Hermansson (1997) observed that there was a strong correlation between hydrophobicity of cells and their degree of attachment to activated sludge flocs. Microorganism with different hydrophobicities was found to occur in activated sludge flocs. The role of hydrophobic EPS participating in organization of flocs was studied (Jorand et al., 1998). EPS was indicated that possessed both hydrophobic and hydrophilic properties. EPS can involve in cohesion of flocs because: (i) Hydrophilic chains (polysaccharides) create a matrix in which bacteria are embedded and (ii) Hydrophobic heteropolymers create bridges or reticular points between polysaccharides. EPS compositions include mainly proteins (dominant), carbohydrates, DNA. By using XAD-8 resin to separate EPS into groups of different polarity, it is obtained that in EPS, at least 7 % of dissolved carbon and 12 % of the proteins can be considered hydrophobic. So a significant proportion of EPS is hydrophobic and hydrophobic fraction is proteins but not carbohydrates. The cohesion of activated sludge flocs is controlled by the ratio between hydrophilic exopolymers in which bacteria are embedded and hydrophobic interactions. There is coexisting of hydrophobic and hydrophilic bacteria that release significant

9
exopolymers in the flocs. The presence of hydrophobic bacteria can make the good conditions for settlement (Jorand et al., 1994). Hydrophobicity is different regarding the type of microorganism and nutrients conditions. They can shift the hydrophobic/hydrophilic balance (Jorand et al., 1994). Production of hydrophobic substances has an important role in good settleability and dewaterability. In order to increase the efficiency of activated sludge process, it is necessary to estimate the mechanism of the hydrophobic substance production. c. Effect on settleability and dewatering ability of activated sludge
Many researchers investigated the role of EPS in sludge properties. Most of the proposed mechanisms for bioflocculation are based on the complex interactions between these high molecular weight polymers which bond electro-statically and physically to microbial surfaces. The sequencing bridging that occurs between bacterial cells and other particulate materials forms a heterogeneous matrix which allow settlement of the floc. Such a mechanism is widely reported in aerobic conditions and has been suggested that it could be important to the anaerobic digesters (Morgan et al., 1989). In some cases, the surface polymers can take part in chemical reactions which in fact help to bind the floc together. One obvious way was by the esterification of carboxyl groups. These groups occur at the sludge surfaces as a result of the formation either of glucuronic acid containing polysaccharides or poly-β-hydroxy-butyric acid (Figure 2.4) (Forster and Dallas-Newton, 1980).
Figure 2.4 A possible structure for activated sludge flocs
Gulas et al. (1979) reported that the presence of EPS is in the thickening sludge realized from flotation processes of activated sludge. Conditioning of the sludge solids is a direct function of EPS content of the sludge. The specific resistances of the sludge inversely related to the biological polymer content on basis. EPS are responsible for the aggregation of bacteria cells. The mechanism is not simple bridging type but may also include charge neutralization phenomena. Pavoni et al. (1972) described the basic mechanism of the floc formation activated sludge is the interaction of the high molecular weight exocellular polymers by electrostatic physical bonding between cells producing three-dimension matrix of sufficient magnitude to settle under quiescent conditions.

10
EPS act to bridge between cell surface and therefore initiate floc/biofilm formation (Bura et al. 1998). However the presence of high EPS concentration may results in poor settling (bulking phenomenon) or dewatering condition (i.e. increasing sludge volume index SVI, or capillary suction time CST) in conventional AS processes (Liao et al., 2001). This can be partially explained by steric forces arising from the EPS. The EPS molecules extended out from cell surfaces and therefore physically prevent the cells from forming close contact. The EPS may also form a dense gel that resists the expression of water from gel pores. Chao and Keinath (1979) found that biopolymers are directly related to clarification efficiency. The influence of quantity of EPS on clarification is illustrated by Figure 2.5.
0
50
100
150
200
250
300
0.01 0.03 0.05 0.07EPS (g glucose/g MLSS)
Efflu
ent S
S (m
g/l)
Figure 2.5 Relationship between effluent suspended solids and EPS production
(Chao and Keinath, 1979) The relationship between EPS and SVI was different from many studies. The results were not easily comparable, but it depended on the experimental conditions. There were in most case a positive linear relationship between SVI and EPS. Table 2.3 showed some results.
Table 2.3 Relationship between the amount of EPS from activated sludge and sludge settleability from the literature (Urbain et al., 1993)
Reference SVI range
(ml. g-1) EPS units Linear regression analysis
Urbain et al. (1993) Forster (1971) Magara et al. (1976) Kiff (1978) Chao and Keinath (1979) Goodwin and Forster (1985)
69 - 315 46 - 190 37 - 152 65 - 400 100- 725 175- 345
mg ge. l-1 g ge.100g DM-1 g TOC.100g DM-1 mg EPS. 100g DM-1 mg ge.100g DM-1 mg ge.100g TOC-1
SVI = 3.46EPS + 14.90 SVI = 3.04EPS + 48.99 SVI = 4.25EPS – 6.28 SVI = 57.60EPS – 27.34 No relation SVI = -19.03EPS + 6.47
ge: glucose equivalents; DM: dry matter content of the sludge; TOC: total organic carbon. Gulas et al. (1979) reported that specific resistance (the more specific resistance, the less dewaterability) per unit of float solids increase as unit polymer content decrease. In addition, Houghton et al. (2000) observed that there was the strong, positive correlation between EPS and dewaterability, as measured using the CST, of anaerobic system if the sludge examined were produced under similar conditions. EPS were extracted from six laboratory scale anaerobic digesters operated, as matched pairs, over a range of retention time: 10, 15 and 30 days. Both EPS and their composition were found to have positive

11
effect on dewatering of the sludge. As the level of EPS in the sludge increased, the sludge became harder to dewater (Figure 2.6).
10
13
16
19
22
25
10 12 14 16 18 20 22 24EPS carbohydrate content (%)
CST
(s) S
S=1
g/L
Figure 2.6 Effect of carbohydrate content of EPS on CST (Houghton et al. (2000))
EPS compositions have different effects on sludge characteristics. The main compositions of EPS are carbohydrate, protein, DNA and lipid. Figure 2.7 showed that between the compositions of EPS, carbohydrate appeared to affects the sludge dewaterability, the sludge became harder to dewater as the carbohydrate content increased. Urbain et al. (1993) reported that all constituents of EPS positively correlated with sludge settleability. High concentrations of proteins, polysaccharides and DNA resulted in a reduced of sludge settleability.
Settleability of sludge was affected more by the composition of EPS rather than the amount of EPS produced (Bura et al., 1998). This report also showed the correlation between compositions of EPS on settleability of activated sludge. There was a strong positive correlation between DNA and SVI. The highest SVI values corresponded to the highest concentration of DNA.
The effect of carbohydrate fraction on sludge settleability was conflicting in different reports. The positive correlation between carbohydrate and SVI was found by Forster, 1971. Carbohydrate contents of EPS increase with an increase of SVI were shown in Figure 2.7.
30507090
110130150170190210
5 15 25 35 45Carbohydrate (% TSS)
SVI (
ml/g
)
Figure 2.7 The variations in the carbohydrate content of EPS in relation to the SVI
(Forster et al., 1971)

12
It was reported that not all polysaccharides extracted from sludge flocs contributed to floc formation. Only mucopolysaccharide composed of glucosamine, glucose, mannose, galactose, and rhamnose, which was only 10 % of the total polysaccharides isolated from the floc contributed to floc formation, whereas the other 90 % of the polysaccharides could not be shown to play a role in floc formation (Tago and Aida, 1977). It was concluded that mucopolysaccharide comprised the films mesh bridging cell to cell and form the floc by results got from scanning electron microscopy. The mucopolysaccharide isolated from the floc of the bacteria strain no. 12, isolated from a phenol-adapted activated sludge was used in this study. This polymer was soluble in water and, the solution was highly viscous, and when the polymer was precipitated with ethanol, it appeared gelatinous.
The inversely result was found by Goodwin and Forster (1985). By examining the relationship between composition of activated sludge surface and their settlement characteristics, the result showed that the carbohydrate fraction increases as settlement improved (decrease SVI). Reversibly, Bura et al. (1998) reported the SVI was not correlated to carbohydrate content of EPS. Not only the separated compositions but also the combination have the effect on sludge characteristics. The increasing of ratio of the carbohydrate to protein in EPS worsened the sludge settling. The significant increase of this ratio and SVI occurred at all reactors in this study. The higher ratio caused the bulking of sludge (Shin et al., 2001). The effect of remaining compositions (lipid and protein) was also investigated. The proportion of lipid in the EPS increases as SVI increases. While no relationship appeared to exist between the sludge settlement properties and the protein content of EPS. d. EPS and sludge bulking
Because of involving in sludge settling, therefore EPS content has correlation with bulking phenomena of sludge. Beccari et al. (1980) studied the relationship between bulking and physicochemical-biological properties of activated sludge. Experimentation was divided into two distinct periods of 100 days each. In the first period, every decrease or increase in EPS was matched with a decrease or increase in SVI. In the second period, the SVI and EPS clashed: an increase in SVI corresponded to a decrease in EPS. It was supposed that there is an optimum value of EPS production: for increasing doses up to this value, system flocculation improves progressively, while for doses above this value, this process worsens gradually. Conditions during the first period brought about an average EPS production which higher than the optimum value, so it lead to worsening of sludge flocculation with the increase in EPS (increase in SVI). In the second period, average EPS production was below the suitable value, therefore, a reduction in SVI corresponded to an increase in EPS, i.e., an improvement in bioflocculation. Shin et al. (2001) reported the effect of carbohydrate and protein in EPS on sludge characteristics. The result shows that the higher ratio of carbohydrate to protein caused the bulking of the sludge, hence it is not favorable for sludge settling.
Moreover, EPS were found to have a direct effect on sludge bulking. There existed an optimum dose of EPS. Below this level, with an increasing of EPS, system flocculation process improved progressively. While for those above the optimum value, sludge settling
13
worsens gradually. The diverse correspondences between sludge settling and EPS which above optimum dose could be interpreted by likening EPS behavior to that of a polyelectrolyte (of suitable ionic character) in the coagulation-flocculation process of particles suspension. While the destabilization of suspension and agglomeration of the particles were particularly satisfactory only with optimum polyelectrolyte doses (or, in any case, with minimal dosage ranges) (Beccari et al., 1980) e. Effect on membrane biological reactor: Biofouling
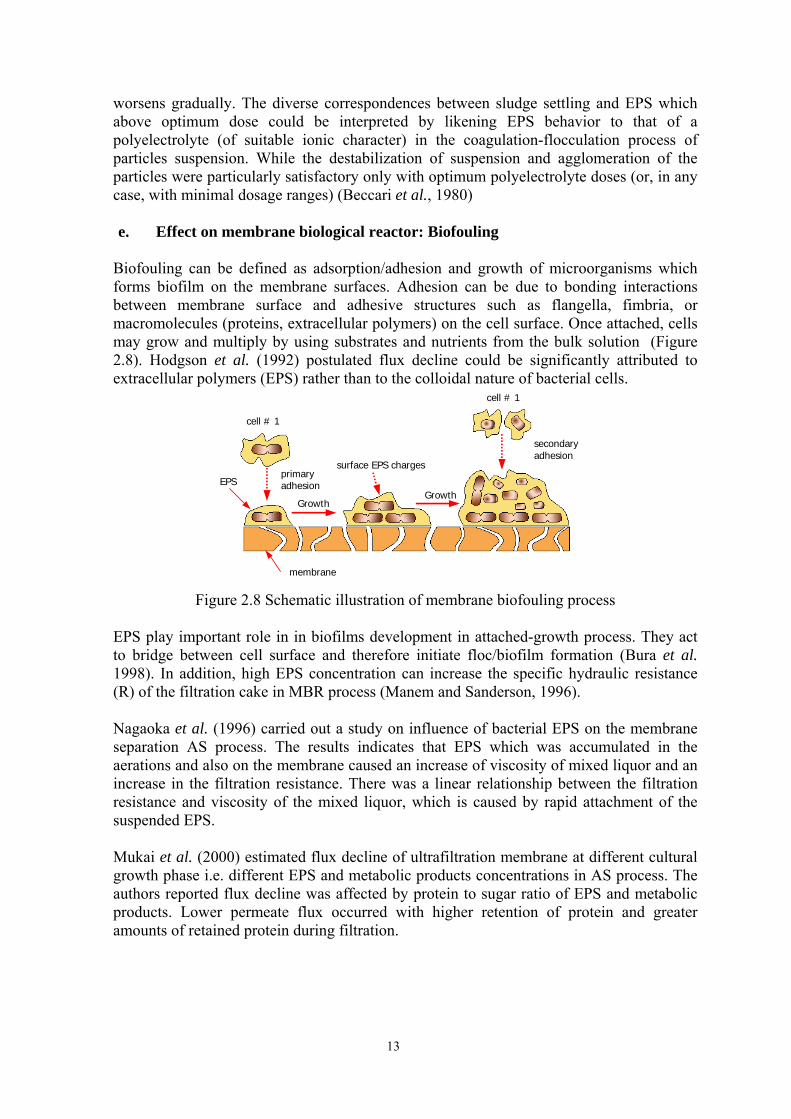
Biofouling can be defined as adsorption/adhesion and growth of microorganisms which forms biofilm on the membrane surfaces. Adhesion can be due to bonding interactions between membrane surface and adhesive structures such as flangella, fimbria, or macromolecules (proteins, extracellular polymers) on the cell surface. Once attached, cells may grow and multiply by using substrates and nutrients from the bulk solution (Figure 2.8). Hodgson et al. (1992) postulated flux decline could be significantly attributed to extracellular polymers (EPS) rather than to the colloidal nature of bacterial cells.
cell # 1
primary adhesion EPS
surface EPS charges
cell # 1
GrowthGrowth
secondary adhesion
membrane
Figure 2.8 Schematic illustration of membrane biofouling process EPS play important role in in biofilms development in attached-growth process. They act to bridge between cell surface and therefore initiate floc/biofilm formation (Bura et al. 1998). In addition, high EPS concentration can increase the specific hydraulic resistance (R) of the filtration cake in MBR process (Manem and Sanderson, 1996). Nagaoka et al. (1996) carried out a study on influence of bacterial EPS on the membrane separation AS process. The results indicates that EPS which was accumulated in the aerations and also on the membrane caused an increase of viscosity of mixed liquor and an increase in the filtration resistance. There was a linear relationship between the filtration resistance and viscosity of the mixed liquor, which is caused by rapid attachment of the suspended EPS. Mukai et al. (2000) estimated flux decline of ultrafiltration membrane at different cultural growth phase i.e. different EPS and metabolic products concentrations in AS process. The authors reported flux decline was affected by protein to sugar ratio of EPS and metabolic products. Lower permeate flux occurred with higher retention of protein and greater amounts of retained protein during filtration.

14
2.3.6 EPS extraction methods. Many methods for EPS extraction have included regular centrifugation, EDTA, ultracentrifugation, steaming extraction, regular centrifugation with formaldehyde (Zhang et al., 1999), sonication, sonication with cation exchange resin (Dignac et al., 1998, Wuertz et al., 2001), crown ether (Wuertz et al., 2001) and glutaraldehyde (Azeredo et al., 1998).
Gerh and Herry (1983) reported that there were five main steps of the EPS extraction:
1. Concentration of biomass and removal of extraneous matter; 2. Stripping of the capsule from the cell:
a. Chemical stripping: NaOH, H2SO4, NH4OH, formaldehyde or CTAB b. Physical stripping: heating, blending, ultrasound, chromatogram sprayer
3. Precipitation 4. Collection 5. Purification
The blending or physical stripping by blending followed by centrifugation was more successful at removing capsular material than chemical stripping by K2HPO4. High-speed centrifugation alone did not result in the capsule being stripped by the cell. And DNA measurements showed that cell disruption had not occurred. Repeatability was found to be within about 5 %. However it is not all the capsular material be extracted on the first pass. Further work in this area was required. Brown and Lester (1980) made the comparison between five different extraction methods and combinations of two of these methods were compared on the cultures of activated sludge and Klebsiella aerogenes. High-speed centrifugation was the most effective extraction method for the Klebsiella aerogenes culture due to small amount of cell disruption and relative high EPS yield. Steaming treatment was the most effective method for EPS extraction from activated sludge because it released a significant quantity of EPS from the flocs and cause less cellular disruption than ethylenedianetetraacetic acid (EDTA) and sodium hydroxide treatments. Sodium hydroxide treatment cause large disruption in all cultures. Ultrasonication released low concentrations of EPS but cause no significant cell disruption. Thus it could be used as primary treatment in conjunction with other extraction method. Azeredo et al., (1998) reported that three extractions methods included steaming, sonication and combined sonication with Dewex resin were compared with a new method using glutaraldehyde. The extraction was effectively estimated by measuring the total protein, TOC (proteins and polysaccharides) constituent of the extracted polysaccharides. It was also found that sonication promoted the excretion of large quantities of proteins indicating cellular lysis or breakage of the cell membrane. Glutaraldehyde was the most suitable method for biopolymer extraction because it produced a high TOC/protein ratio (smallest quantity of protein) and had no disruptive effect on the biomass. The yield of biopolymer extracted increased with the volume of glutaraldehyde added to the sludge. Frølund et al. (1998) extracted EPS from activated sludge using cation exchange resin (CER). CER extraction procedure is partly chemical (removal of divalence cations such as Ca2+) and partly mechanical due to the applied shear. The result showed that CER was more efficient for releasing EPS than two other commonly methods (thermal heating and sodium hydroxide extraction) in term of yield and minimal disruption of the exopolymers.
15
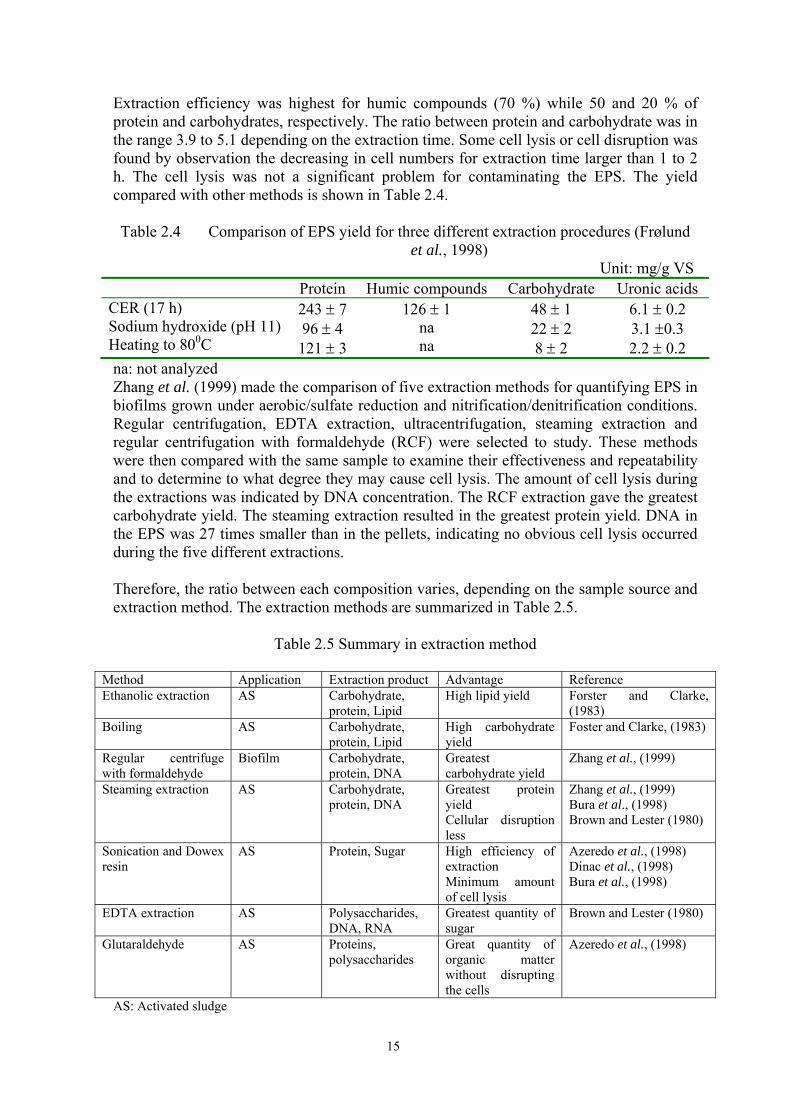
Extraction efficiency was highest for humic compounds (70 %) while 50 and 20 % of protein and carbohydrates, respectively. The ratio between protein and carbohydrate was in the range 3.9 to 5.1 depending on the extraction time. Some cell lysis or cell disruption was found by observation the decreasing in cell numbers for extraction time larger than 1 to 2 h. The cell lysis was not a significant problem for contaminating the EPS. The yield compared with other methods is shown in Table 2.4. Table 2.4 Comparison of EPS yield for three different extraction procedures (Frølund
et al., 1998) Unit: mg/g VS
Protein Humic compounds Carbohydrate Uronic acids CER (17 h) Sodium hydroxide (pH 11) Heating to 800C
243 ± 7 96 ± 4 121 ± 3
126 ± 1 na na
48 ± 1 22 ± 2 8 ± 2
6.1 ± 0.2 3.1 ±0.3 2.2 ± 0.2
na: not analyzed Zhang et al. (1999) made the comparison of five extraction methods for quantifying EPS in biofilms grown under aerobic/sulfate reduction and nitrification/denitrification conditions. Regular centrifugation, EDTA extraction, ultracentrifugation, steaming extraction and regular centrifugation with formaldehyde (RCF) were selected to study. These methods were then compared with the same sample to examine their effectiveness and repeatability and to determine to what degree they may cause cell lysis. The amount of cell lysis during the extractions was indicated by DNA concentration. The RCF extraction gave the greatest carbohydrate yield. The steaming extraction resulted in the greatest protein yield. DNA in the EPS was 27 times smaller than in the pellets, indicating no obvious cell lysis occurred during the five different extractions. Therefore, the ratio between each composition varies, depending on the sample source and extraction method. The extraction methods are summarized in Table 2.5.
Table 2.5 Summary in extraction method
Method Application Extraction product Advantage Reference Ethanolic extraction AS Carbohydrate,
protein, Lipid High lipid yield Forster and Clarke,
(1983) Boiling AS Carbohydrate,
protein, Lipid High carbohydrate yield
Foster and Clarke, (1983)
Regular centrifuge with formaldehyde
Biofilm Carbohydrate, protein, DNA
Greatest carbohydrate yield
Zhang et al., (1999)
Steaming extraction AS Carbohydrate, protein, DNA
Greatest protein yield Cellular disruption less
Zhang et al., (1999) Bura et al., (1998) Brown and Lester (1980)
Sonication and Dowex resin
AS Protein, Sugar High efficiency of extraction Minimum amount of cell lysis
Azeredo et al., (1998) Dinac et al., (1998) Bura et al., (1998)
EDTA extraction AS Polysaccharides, DNA, RNA
Greatest quantity of sugar
Brown and Lester (1980)
Glutaraldehyde AS Proteins, polysaccharides
Great quantity of organic matter without disrupting the cells
Azeredo et al., (1998)
AS: Activated sludge

16
2.4 Factors effecting on EPS production and sludge settling and dewatering properties
2.4.1 Substrate composition (carbon sources)
The substrate composition influenced the settling and dewatering characteristics of the sludge. The waste composition associated with sludge settling is due to the changes in the microorganism composition and EPS accumulations. Particularly with high carbohydrate wastes, large accumulation of polysaccharides may lead to stable microbial suspensions. In addition, the structure of polysaccharides produced is expected to vary with the chemical composition of organic waste. In the presence of natural polymers, such as dextrans, levans and certain lytic polymers, may improve sludge settleability and compaction. EPS production was different with different carbon sources. It was strongly dependent on the biodegradability of substrates. The effect of easily biodegradable carbon source glucose on EPS production and sludge settleability was done by Jorand et al. (1994). They found that the addition to the activated sludge of easily degradable nutrients such as glucose increased both exopolymer production and the sludge volume index. The effect of many different carbon sources was investigated by many authors. Pavoni et al. (1972) reported that the production and ratio of compositions of exocellular polymers produced is different for different carbon source in activated sludge. They investigated four different carbon sources (glucose, nutrient broth, salicylic acid, and acetic acid). EPS produced was different. For example, exocellular polymers produced in the nutrient broth culture possessed a significantly higher percentage of proteinaceous material than did the polymers from others substrate systems; however, all polymers possessed the major components similarity (protein, carbohydrate, DNA, and RNA). It was explained that the microbial species digested different carbon sources, so the predominant species of the various heterogeneous cultures should differ and, therefore, the specific EPS produced should differ. Lovett et al. (1983) investigated the effect of different substrates on settling and dewatering characteristics of sludge. In this study, the results of many studies involved in different substrates were compared with their result that using meat substrate. Figure 2.9 shows that different carbon sources have different effects on SVI.

17
Figure 2.9 Variation of SVI with sludge age for different substrates
2.4.2 Sludge load Sludge load was found to affect on EPS production and sludge properties. One measurement of sludge load is process loading intensity which is the daily flow rate of the substrate into the reactor per unit biomass in the reactor. Chao and Keinath (1979) established the influence of process loading rate (PLI) on EPS production and on sludge characteristics. A continuous flow with recycling sludge was used to generate the activated sludge. Reactors were run with synthetic wastewater. MLSS was maintained at 1500 mg l-1 for all runs. The relationship between PLI and SVI is shown in Figure 2.10. There were two PLI ranges for which the sludge had relative low SVI levels or good settling is noted. Bulking sludge occurs at PLI ranges 0.6 to 1.3 g COD/g MLSS days as well as > 1.8 g COD/g MLSS day.
0100200300400500600700800900
0 1 2 3PLI (g COD/g MLSS-day)
SVI (
ml/g
)
Figure 2.10 Effect of process loading intensities on SVI
Domestic sewage (Pitman, 1975)
Glucose substrate (Bisogni and Lawrence, 1971)
Glucose substrate (Chao and Keinath, 1979)
Abattoir wastes (Heddle, 1977)
200
400
650
850
SVI (
ml g
-1)
5 10 15 20
θc (days)
Meat concentration (Lovett et al., 1983)

18
In addition, PLI also effects on EPS production. This influence is shown on Figure 2.11. EPS decreases when PLI increase.
00.010.020.030.040.050.060.070.08
0 0.5 1 1.5 2 2.5 3PLI (g COD/g MLSS day)
EPS
(g g
luco
se/g
MLS
S)
Figure 2.11 Effect of PLI on EPS production
The frequency of sludge load changing also has effect on sludge properties. The highest CST values were obtained during a shorter period when the loading changed strongly several times in the study of Eriksson et al. (1992). In this study, they evaluated the sludge properties in two different lines of an activated sludge plant. The frequency and the strong change in sludge load lead to development of younger of sludge and thus higher filtration resistance.
2.4.3 Sludge age or sludge retention time (SRT)
Many investigations studied about the effects of sludge age on EPS and sludge characteristics. In general, low sludge age is associated with rapid rates of microbiological growth and high rates of sludge production and wastage. High sludge age is associated with slower growth and low rates of sludge production (Lovett et al., (1983)). EPS production under continuous-flow conditions decreases and increases as sludge age increases. Figure 2.12 shows the relationship between the production of EPS to biomass concentration and sludge age (Gulas et al., 1979).
1 3 5 7 9 11 13 15
110
100
90
80
70
60
50
40
30
Sludge age (Days)1 3 5 7 9 11 13 15
110
100
90
80
70
60
50
40
30
Sludge age (Days) Figure 2.12 Total EPS mass per MLVSS versus sludge age
It was explained by dividing into two regions. The left region which was at high specific growth rates, the bacterial cells present within the activated sludge might undergo autolysis
Tota
l EPS
mas
s/M
LVSS
(m
g/g)

19
activity releasing biological polymer into the medium. As the sludge age increased, autolysis of the cells was slow. The right region indicated a slow increase in the polymer content. This response more closely agreed with the classical theory of polymer production during endogenous respiration of cell. It was noted that at low sludge age, large amount of polymer was present with pin-point sludge flocs. It could be explained by different type of biopolymer (for example, anionic, cationic, and amopholytic) and difference molecular weight of the polymer for different sludge age. At low sludge age, bacteria were produced low molecular weight polymers whose agglutative properties were deficient. So it produced pin-point sludge flocs. As the sludge age increased, bacteria cells release high molecular weight polymers which were more amenable to efficient flocculation of the biomass. In addition, Eriksson (1992) observed at higher sludge ages the bacterial cells are surrounded by EPS in more aggregates. Conversely, Liao et al. (2001) found that amount of EPS not affected by SRT but the components of EPS and physicochemical properties of floc (hydrophobicity and surface charge). The result obtained from this study showing that the total amount of EPS was independent on sludge age. The production of EPS was not only limited to the stationary and endogeneous phases of sludge associated with high sludge age, but also a large amount of EPS was produced at lower SRTs. However, the effect of SRT on EPS is a change in the proportion of components but not the total EPS content. In this study, synthetic wastewater contained glucose and inorganic salts with COD: N: P of 100: 5: 1 were used. The effect of SRT on EPS was estimated by using four parallel laboratory-scale sequencing batch reactors, operated at SRT of 4, 6, 9, 12, 16, 20. Carbon substrate oxidation profiles were similar in each of the SBRs at all SRTs. The carbohydrate content and protein content varied with SRTs. Carbohydrate was greater and protein was lower at lower SRTs (4 and 9 d) when compared to EPS content at high SRTs (>9 d). And there was no significant different in DNA content of EPS at all sludge age. Total carbohydrate content decrease with an increase of SRT from 4 d to 9 d but reach constant level at SRTs of 12 d to 20 d. Ratio of proteins to carbohydrates increase when SRT increased from 4 to 12 d and level out at SRTs of 16 and 20 d. SRT also had effect on SVI. Larger SVI (poorer compression) and a higher frequency of non-filamentous bulking situation occur at low SRT of 4 d (Figure 2.13; 2.14).
Figure 2.13 Effect of SRT on the production of EPS components under stable operating
conditions (Liao et al., 2001).

20
Figure 2.14 Effect of SRT on total EPS content and the proportion of EPS components during stable operating conditions (Liao et al., 2001)
The effect of SRT on sludge properties seems not the same between many authors. Bisogni and Laurence (1971) reported that, at low sludge age, solids settled more readily as sludge age decreased. Chao and Keinath (1979) reported that the normal sludge occurred at sludge age above 5 days and near 2 days while zoogloea bulking sludge was noted at 2 to 5 days. The influence of sludge age on the settling of sludge in this study is show in Figure 2.15.
0100200300400500600700800
0 2 4 6 8 10 12Sludge age (days)
SVI (
ml/g
)
Figure 2.15 Variation of SVI as a function of sludge age
Sludge dewaterability was investigated less than sludge settleability. Gulas et al. (1979) reported that sludge age has effect on sludge dewatering which is shown in Figure 2.16.
Figure 2.16 Relationship between capillary suction time and sludge age (Gulas and Bond, 1979)
Cap
illar
y su
ctio
n tim
e
Sludge age (days)
Raw Sludge

21
In addition, a general model for activated sludge floc properties at different sludge ages or sludge load was proposed (Eriksson et al. (1992)) which was described in Figure 2.17. This study showed that the sludge filtration resistant and EPS production both depended on sludge age and sludge load. The EPS production is low and cell growth high at low sludge age while at high sludge age the cells growth more slowly but instead produce more EPS. The weaker bound EPS, the more filtration resistant.
Figure 2.17 A general model for flocs built by floc-forming activated sludge bacteria (Eriksson et al., 1992).
2.4.4 Dissolved oxygen (DO)
DO had direct effect on the growing of microorganism, thus it certainly affected EPS production, EPS composition and sludge settlement. Shin et al. (2001) found that total EPS increased to very significant level in a high DO activated sludge reactor. Not only EPS production but their properties also changed at elevated oxygen concentrations. The proportionality of EPS compositions or ratio of carbohydrate to protein which was the important factor in changing properties of cell surfaces depended on the level of DO. This ratio increased with the increasing of DO and caused poor settling characteristics. An evaluation of EPS compositions revealed that DO level have a more profound effect on carbohydrate as opposed to protein. The high airflow rate increased carbohydrate levels whilst protein level remains fairly constant. In addition, oxygen level also affected the hydrophobicity of cell surface of bacteria sludge. Palmgren et al. (1998) showed that oxygen limitation generally caused a lowering of the cell surface hydrophobicity especially in the stationary phase of growth. The effect of oxygen limitation could be explained that under oxygen limitation there was a carbon surplus in the system. This excess carbon could be used for exopolymers production coating the cell surfaces and thereby “masking” hydrophobic cites, and lowering the apparent cell surface hydrophobicity. From a wastewater treatment point of view, it was noted that oxygen limitation (DO < 0.1 ppm) caused a decrease in the cell surface hydrophobicity. A lower hydrophobicity might result in decreased solid-liquid separation efficiency. 2.4.5 Temperature
Çetin and Sürücü (1990) reported that the relationship between temperature and settlement of sludge was mainly due to the changes in the structure of bacterial growth at different
High Sludge load Low Low Sludge age High
Residual turbidity
Filtration resistance
Weakly bound EPS
Strongly bound EPS

22
temperatures. On the other hand, temperature also had effect on protein and lipid structure. So that led to the changes in cell membrane and EPS structure and functioning. It also made changes EPS charges which resulted in low flocculation abilities and hence low settleability at high temperatures. In addition, at high temperature the viscosity of exocellular materials also decrease and may also slow down efficient bioflocculation. Sludge volume index tests showed that as the temperature of the reactors was increased, SVI values decreased. Goodwin and Forster (1985) examined the effect of varying extraction temperature on the composition of EPS obtained from activated sludge. This study revealed that the temperature used controlled the composition of the polymeric mixture. The compositions of polymers produced at 100 0C were correlated with settlement properties. The result showed that the proteinaceous fraction is sensitive to extraction temperature, with temperature above 70 to 80 0C the protein level increased significantly. However, temperature has little effect on lipid and polysaccharide fractions.
2.4.6 pH
Another factor affecting the function of EPS on bacterial biofloc is pH. For most bacteria, and thus for most wastewater treatment processes, the pH limit for growth is between 4 and 9. The pH level affects enzymatic activity as well as growth rate. The pH level has effects on EPS which are anionic and non-ionic in nature at most pH values. The increasing of pH, i.e. addition of negative charge ions, causes an increase in the number of available reactive sites on non-ionic exocellular polymers and the polymer length. Because of this polymer chain elongation occurring, polymers become of sufficient length to bridge the distances between the cells. This enhances biofloculation and reduces the culture turbidity. On the other hand, SVI decreased with increasing pH (Çetin and Sürücü, 1990). 2.4.7 Cations
Many researchers have shown that the floc formation is as a result of a combination of cations and EPS. Since both the cell surfaces and EPS are negatively charged at neutral pH, the binding between polymers and cell surfaces is counteracted by the electrostatic repulsion unless cations are present. Divalent cations act as a bridge between negatively charged sites and the sludge floc structure is proposed to be a three dimensional exopolymers matrix (a gel) kept together by divalent cations with varying selectivity to the matrix (Ca2+> Mg 2+) (Bruus et al., 1992). Higgin and Novak (1997) reported that the settling and dewatering of the activated sludge depended on both the concentrations and ratios of cations in the feed. When present in the feed, cations became incorporated within the microbe-biopolymer network, creating a dense floc that is more resistance to shear. This results in increasing settling and dewatering properties of sludge. The divalent cations appear to bind mainly protein within the floc matrix. Some activated sludge systems needed both calcium and magnesium in the feed while others only required one of these cations to have good settling and dewatering properties. A minimum of 0.7 to 2.0 meq/L each of calcium and magnesium was necessary for acceptable settling and dewatering. Increasing the feed concentrations of calcium and magnesium above this level improved the floc strength, settling and dewatering properties. However, improvements were greater when an equal concentration of cations was added to the feed.

23
In addition, monovalent cations such as sodium and potassium also have effect on the sludge settling and dewatering properties. The addition of sodium to the feed resulted in a deterioration in settling and dewatering properties when the monovalent to divalent cation ratio exceeded approximately 2 : 1, expressed on an equivalent basic. However, the deterioration could be reversed by increasing the calcium and magnesium concentration in the feed which reduced the monovalent to divalent cation ratio below 2 : 1 (Higgin and Novak, 1997). Murthy and Novak (1998) studied the effects of potassium ion on sludge settling, dewatering and effluent properties. Potassium ion is shown to play an important role in sludge properties. The concentration of potassium affected the concentration of readily extractable (slime) proteins in the floc and the proteins in the surrounding solution. An increase in this cation’s concentration beyond nutrients requirements associated with an increase in soluble protein. It is also seen that soluble protein increase led to the deterioration in sludge dewatering properties (increase CST). Conversely, an increase in concentration of potassium ion associated the increase in slime protein with improvement the settling properties of sludge. Potassium is the only ion that is positively correlated with slime protein and polysaccharide. Correspondingly, sodium ions were not positively correlated with polymers, although this cation was associated with deterioration in dewatering property and negative correlated with floc density. Calcium ions were positively correlated with floc density and negatively correlated with polysaccharides. 2.5 Role of nutrients and their effects on EPS and sludge properties
Nutrients can affect activated sludge in two ways. At first, nutrients are the necessary elements for the growth of bacteria. Second, changes in the nutrient balance were known to stimulate the production of surface biopolymer in pure bacterial culture. So it was not unreasonable to suppose that similar processes occur in activated sludge. There were many researches investigated the relationship between nutrient and sludge settlement. Table 2.6 shows the results of some studies.
Table 2.6 Existing relationship between sludge settlement and nutrients (Forster, 1985)
Source Relationship Hattingh (1963) Forster (1968) Forster and Dallas-Newton (1980) Wagner (1982a) Wagner (1982b) Clark and Forter (1983) Wu et al. (1982)
SVI & (BOD/N; BOD/P) SVI & (NH3-N/PO4-P) SVI & (BOD; NH3-N; PO4-P; MLSS) SVI & (P/MLSS) SVI & (P/N) SVI & (BOD, NH3-N; PO4-P; MLSS) SVI & (COD/N; sludge loading rate)
Wu et al. (1982) examined the filterability of activated sludge in response to growth conditions. The activated sludge pilot plant was used with synthetic waste. The reactors were nitrogen-rich (COD:N of 5.3:1.0) and nitrogen-deficient (COD:N of 106:1.0) conditions. The results show that nitrogen content affect both sludge properties and EPS production. Low nitrogen concentration produces sludge with a higher specific resistance to filtration or decreases the sludge dewaterability. In addition, nitrogen-restricted activated sludge has high carbohydrate content and surface charge but low protein content compares to nitrogen-rich sludge. The result is shown in Figure 2.18.

24
Figure 2.18 Effect of F/M ratio on the production of sludge protein and sludge carbohydrate (Wu et al., 1982)
Bura et al. (1998) found that COD:N:P ratio influent on hydrophobicity, surface charge and EPS composition of microbial flocs. Four bench-scale sequencing batch reactors were fed synthetic wastewater at different COD:N:P ratios (100:5:1; 100:5:0; 100:5:2; 100:1:1). The reactors were operated with SRT of 6 d, pH 6.8 to 7.5, temperature of 27 0C and dissolved oxygen of 5 to 6 mg O2/ L. Phosphorus depleted and P-limited conditions resulted in a decrease in surface charge but increase in EPS. Table 2.7 and Figure 2.19 show the effect of nutrient on EPS and physicochemical properties of sludge flocs. Besides of effecting on sludge properties, nutrients were found have direct effect on biopolymers production and composition. Forster (1985) investigated the effect of nutrient and EPS on sludge settlement by investigation many full-scale plants in England.. The result showed that the settlement, surface charge, the floc ecology and the amounts of the biopolymers in the sludge (both protein and carbohydrate) all depended on the balance of the nutrients in the feed and the rate at which the substrate was fed to the reactor. In other words, the nutrient balance can affect the two parameters which influent the settling of the sludge: the species and the surfaces. Although no apparent relationship could be demonstrated, there were some nutrient combination which produced good settlement and some combination which produced poor settlement.
Table 2.7 Effect of nutrients (COD:N:P) on the composition of EPS and physicochemical
properties of microbial floc (Bura et al., 1998)
COD:N:P 100:5:1 100:5:0 100:5:2 100:1:1
Protein (mg/g VSS) Carbohydrate (mg/g VSS) Uronic Acids (mg/g VSS) DNA (mg/g VSS) Total EPS (mg/g VSS) Surface charge (meq/g VSS)
85.00 28.20 1.20 0.52
114.92 -0.30
106.00 50.00 0.00 6.50
162.50 -0.08
98.80 58.30 9.80 0.94
167.84 -0.13
20.30 28.10 4.50 0.34
53.24 -0.15
Slud
ge c
arbo
hydr
ate,
% D
ry w
eigh
t
Slud
ge p
rote
in, %
Dry
wei
ght
F/M ratio, lb COD/lb MLSS-day
Nitrogen-deficient activated
Nitrogen-rich activated
Protein
Carbohydrate
Carbohydrate
Protein

25
0
20
40
60
80
100
120
140
160
180
100 :5 :0 100 :5 :0.2 100 :5 :1 100 :1 :1 100 :5 :1COD:N:P
mg/
g VS
S
P roteinCarbohydrateEPS
Figure 2.19 Effect of nitrogen and phosphorus on total EPS and EPS components
(Bura et al., 1998) Nutrients likely affect both microorganism growth and stimulating EPS. But only a few nutrients ratios were investigated and the results are unclear. Further indepth study should be conducted to assess their importance. EPS in biological system can be summarized by Figure 2.20
Molecular weightPROTEINCARBOHYDRATEDNALipid
Biomass
Biological System
Sludge Floc
EPS
pHSRTDONUTRIENTSOrganic Loading
SLUDGE PROPERTIESSettlingDewateringResistant filtration
Attached growthSUSPENDED GROWTHAerobicAnaerobicAnoxic
Figure 2.20 Figure EPS in biological system

26
Chapter 3
3 Methodology 3.1 Introduction
This research work was carried out two phases: Phase I: Field survey study: In this study, the effect of operating conditions and different types of wastewater on EPS and sludge characteristics were investigated. In addition, the relationships between the sludge properties (CST, SVI) and sludge EPS was investigated. Phase II: Lab-scale experimental study: The effect of nutrient balances on EPS production and its components related to sludge characteristics by using sequencing batch reactors were examined. Fig 3.1 shows flowchart of different phases of this study.
Figure 3.1 Flowchart of different phases of experimental study
Relationship between sludge properties, EPS and operational conditions of biological waste treatment reactors
Effect of nutrients on EPS and sludge properties
Study
• Effect of nutrients on EPS • Effect of EPS on sludge characteristics
concerning operational problems

27
3.2 Survey Study Figure 3.2 shows the survey flow chart.
Figure 3.2 Flow chart of the survey study.
Figure 3.3 Sampling points in wastewater treatment plants
Data collection
(operational conditions)
Statistical analysis
Analysis
HRT, SRT, MLSS, DO
Q (m3/d)
VLR (kg COD/m3.d)
EPS, MLSS
SVI, CST
1 COD, BOD
N, P, pH, SS
Sampling (Activated sludge,
Influent and effluent wastewater)
Relationship between sludge properties & operational conditions
Filamentous bacteria
15 WWTPs & 4 lab-scale
Dewatering Thickening
Pretreatment Aeration tank Secondary
sedimentation tank Advanced treatment
EffluentInfluent 1 2 3
: : Sampling point

28
Samples were taken from the fifteen WWTPs and four lab-scale reactors. Three sampling points where are shown in Figure 3.3. They involve:
• Influent to the aeration tank (1) • Mixed liquor of activated sludge (2) • Effluent after aeration tank (3)
Grab sampling was used in this survey. Samples were preserved in cooler boxes (4 0C) during transportation to the AIT laboratory. Parametric analysis includes measuring pH, COD, BOD, total EP, SVI, CST, MLSS, nitrogen and phosphorus. Samples were analyzed within 6 h after collecting. Table 3.1 and 3.2 presents the parameters measured at each sampling point and recorded operating conditions.
Table 3.1 Measured parameters at sampling points
Sampling point Parameters 1 2 3
COD, BOD, TKN, P pH, SVI, CST, EPS, MLSS, filamentous index. COD, SS
Table 3.2 Investigated operating conditions
Parameters Symbol Unit Flow rate Volumetric loading rate Hydraulic retention time Sludge retention time Mixed liquor suspended solid F/M ratio
Q VLR HRT SRT MLSS F/M
m3/d kg BOD/m3.d hour day mg MLSS/ L kg BOD/ kg MLSS. d
3.3 Lab-scale Experimental Study
In this study, lab-scale two-litter batch reactors were used. COD:N:P variation runs were conducted. Inorganic nitrogen source was utilized in these runs. Figure 3.3 presents the flow chart of the experimental study.
Figure 3.4 Flow chart of the experimental study.
Optimum COD:N:P
Feed waste
COD:N:P variation runs
COD= 800 mg/L; SRT= 10 d; HRT= 6 h

29
3.3.1 Feed wastewater The feed wastewater contained glucose as the carbon source and necessary nutrients for microorganism growth. The COD concentration of 800 mg/L was maintained constant throughout the trial. The pH level was adjusted to optimum value for bacterial growth (6.8 to 7.5). DO concentration of the mixed liquor was maintained at least 2 mg O2/L. The composition of the feed wastewater is presented in Table 3.3.
Table 3.3 Composition of feed wastewater (Modified from Chao and Kienath, 1979)
(*) Coresponding to COD of 800 mg/L (**) Corresponding to COD concentration of 800 mg/L and BOD20 concentration of 713 mg/L (Biodegradability of glucose is 0.95 g BOD20/g
glucose (Henze et al., 1997)).
3.3.2 Seed sludge
Seed sludge was taken from one of the activated sludge system (Chong nonsi WWTP). The characteristics of the seed sludge were determined prior to start-up of lab-scale experiments. The initial seed sludge concentration of the first batch runs were in the range of 6000 to 7000 mg MLSS/L. 3.3.3 Parametric study: pH values
With the addition of nitrogen and phosphorus, pH of the reactor was changed. To maintain optimum pH of 6.5 to 7.5 for bacteria, the change in pH with increasing of nitrogen and phosphorus was investigated. The experiments were run under the same conditions with the main experiments (two liters batch reactors; COD of 800 mg/L; MLSS of 7000 mg/L). The experimental procedures are summarized below: Adding substrate: Glucose feed wastewater of which COD of 800mg/L with certain concentration of nitrogen and phosphorus was prepared as feed. Record pH: pH value was measured every 1 hour. Adjust pH value: H2SO4 (0.1N) or NaOH (0.1N) was added dropwise into the mixture until the pH reached the desired value of 7.
Components Concentration (mg/L) Glucose NH4Cl (NH4)2SO4 KH2PO4 CaCl2 MgCl2.6H2O Yeast extract FeCl3 MCl2.4H2O ZnCl2 CuCl2.6H2O Na2B4O7.10H2O Na3.citrate
750(*)
150 12.7 33.8 9.4 45 37.5 1.1 0.8 0.6 0.6 0.2 5.6

30
3.3.4 Experimental Set-up
The batch reactors were glass vessel with an effective volume of 2 L. SBR mode was applied for all experimental runs. This mode involved in five stages in sequence: fill, aeration, settle, draw and withdraw. The operation mode is presented in Figure 3.4. The operating conditions of the experimental batch runs are presented in Table 3.4. Table 3.4 Operating conditions of batch reactors
Parameters Units Values Initial COD concentration Temperature Sludge retention time (SRT) Hydraulic retention time (HRT) pH MLSS (Sludge concentration) F/M
mg/L 0C day hour - mg/L g COD/ g MLSS.d
800 25 to 32 10 6 6.8 to 7.5 6000 to 7000 0.4 to 0.6
At each run, nitrogen and phosphorous were fed with the concentrations corresponding to COD:N:P ratio as presented in Table 3.5.
Table 3.5 Variations of COD:N:P ratio in the experimental study
COD:N COD:P
100:1 100:2 100:3 100:5 100:7
100:10 100:12 100:15
100:0.5 * * * * * * * * 100:1 * * * * * * * * 100:2 * * * * 100:3 * 100:5 * 100:7 * 100:10 *
The operation sequence of the sequencing batch reactor is showed in Figured 3.5. The wasted sludge was withdrawn according to SRT of 10 d. The wasted sludge rate is calculated by following formula:
eww
rc XQQXQ
XV)( −+
=θ Equation 3.1
Where: Q = Wastewater feed rate, L/d Xe = Suspended solids in supernatant, mg/L X = Mixed liquor suspended solids in the batch, mg/L Qw = Sludge waste rate, L/d Vr = Volume of batch, L θc = Sludge retention time, d It is assumed the effluent will not contain suspended solid. Hence, Xe = 0. Equation 3.1 thus reduces to
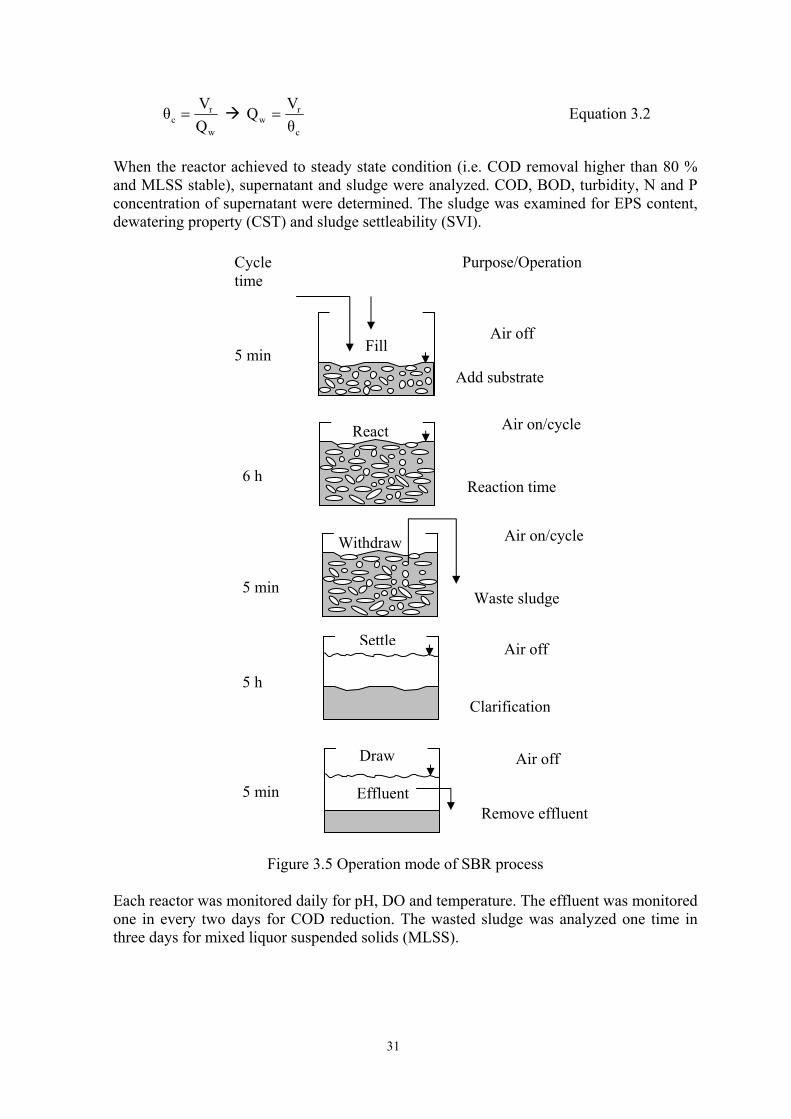
31
w
rc Q
Vθ = c
rw θ
VQ = Equation 3.2
When the reactor achieved to steady state condition (i.e. COD removal higher than 80 % and MLSS stable), supernatant and sludge were analyzed. COD, BOD, turbidity, N and P concentration of supernatant were determined. The sludge was examined for EPS content, dewatering property (CST) and sludge settleability (SVI).
Figure 3.5 Operation mode of SBR process Each reactor was monitored daily for pH, DO and temperature. The effluent was monitored one in every two days for COD reduction. The wasted sludge was analyzed one time in three days for mixed liquor suspended solids (MLSS).
Cycle time
5 min
Air off
Clarification
6 h Reaction time
Air on/cycle
Add substrate
Air off
Air off
5 min
5 h
Remove effluent
React
Effluent
Draw
Settle
Fill
Purpose/Operation
Waste sludge 5 min
Air on/cycle Withdraw

32
3.3.5 Sludge characterization study In this study the variation of sludge characteristics with different nutrient type and concentration were investigated in two-liter-batch reactors by fill-and-draw process. The batch reactors were run at SRT of 10 days and HRT of 6 hours. They were later acclimatized at different nitrogen and phosphorus concentrations. The sludge was sampled when each batch reached the steady state condition (i.e. COD removal was above 80 % with a stable MLSS value). The sludge was examined for EPS content, dewatering property (CST) and sludge settleability (SVI). 3.3.6 Statistical analysis
Statistic SPSS software was applied to analyze the experimental data obtained. Data analyzing is computed by means of multiple regression analysis between y and x variables (Box et al., 1978 quoted by Urbain et al., 1993; Sponza, 2002; Joseph et al., 1998). Multiple regression analysis was used to determine the correlation between SVI, CST, Effluent turbidity and total EPS, protein, carbohydrate; between EPS components and nitrogen and phosphorus content of the feed wastewater. The linear correlation was assessed with R2 Durbin-Watson statistic (Joseph et al, 1998). R2 is the regression coefficient and reflects statistical significant between dependent and independent variables. Differences between dependent (SVI, CST, effluent turbidity, EPS and its components) and independent (protein, carbohydrate, nitrogen, phosphorus) variables were determined by an analysis of variance (F-test) statistic (α = 0.05) In order to avoid autocorrelations, care had been taken to use absolute units, i.e. mass per liter effluent, mass per g SS of sludge, excepted data from the settling (ml/g SS) and dewatering tests (s/g SS). 3.3.7 Analytical methods
All analyses were conducted as defined in Standard Methods (APHA et al., 1995). Microscopic examination (Eikelboom., 2000) The relative density of filamentous microorganisms was evaluated by microscope observation and quantified by comparing with the Filament Index (FI). A scale of 0 to 5 was used (from none to very many filaments). Low magnification (100×) was used (Dick H. Eikelboom, 2000). Determination of sludge dewaterability Sludge dewaterability was measured using the Capillary Suction Time (CST) test (Triton-Type 165 CST) using standard filter papers supplied by Triton Electronics. All test were carried out at room temperature using the 18 mm sludge reservoir. The CST value recorded for each sludge was standardized to a SS concentration of 1g/L as detailed in Standard Method 2710G (APHA, 1995).
33
Extraction of extracellular polymeric substances (EPS) EPS was extracted by two methods, glutaraldehyde and thermal extraction. For the glutaraldehyde method (Azeredo et al., 1998), activated sludge was centrifuged at 4500 rpm in 20 min and washed with water prior to extraction. Sludge after washing was resuspended in 30 ml of 3 % (v/v) glutaraldehyde. The sludge suspension was incubated overnight at 4 0C. Sample was centrifuged at 4500 rpm for 20 min. The supernatant was collected and filtrated and then determine EPS. The EPS in the supernatant was precipitated using three volume of solvent mixture of acetone and ethanol (3 vol: 1 vol) and left over night. The precipitate of EPS was measured by filter like measuring suspended solid. The second method for EPS extraction was thermal extraction, similar to that of Morgan et al. (1990). A measured volume of sludge solid was concentrated by low speed centrifugation (2000 rpm) for 10 minutes and resuspended in distilled water before being heated at 80 0C for 1 h. To reduce the bacterial lysis and consequent release of intracellular products, thermal treatment at 80 0C was used instead of using 100 0C. The extracted polymers were harvested by removal of the sludge solids separated by centrifugation first at 2000 rpm for 10 minutes and then at 5000 rpm for 20 minutes. The EPS in the supernatant was divided onto two parts. EPS from one part was precipitated out from the supernatant by adding three parts solvent mixture of acetone and ethanol (3 vol: 1 vol) to one part supernatant and standing overnight at 4 0C. The quantity of polymer extracted was measured by filtering like measuring suspended solid, as determined using Standard Method 2540D (APHA, 1995). The other part was analyzed EPS compositions. Analysis EPS compositions After extraction, EPS solution was ready for analyzing the components. EPS compositions including polysaccharides and proteins were measured. Polysaccharides (mg/g SS) were measured by the phenol-sulfuric method with glucose as standard described by Dubois et al. (1956). Proteins (mg/g SS) were analyzed immediately after extraction following Buiret method of (Rodney (1993)). Table 3.6 lists parameters and their analysis methods in this study.
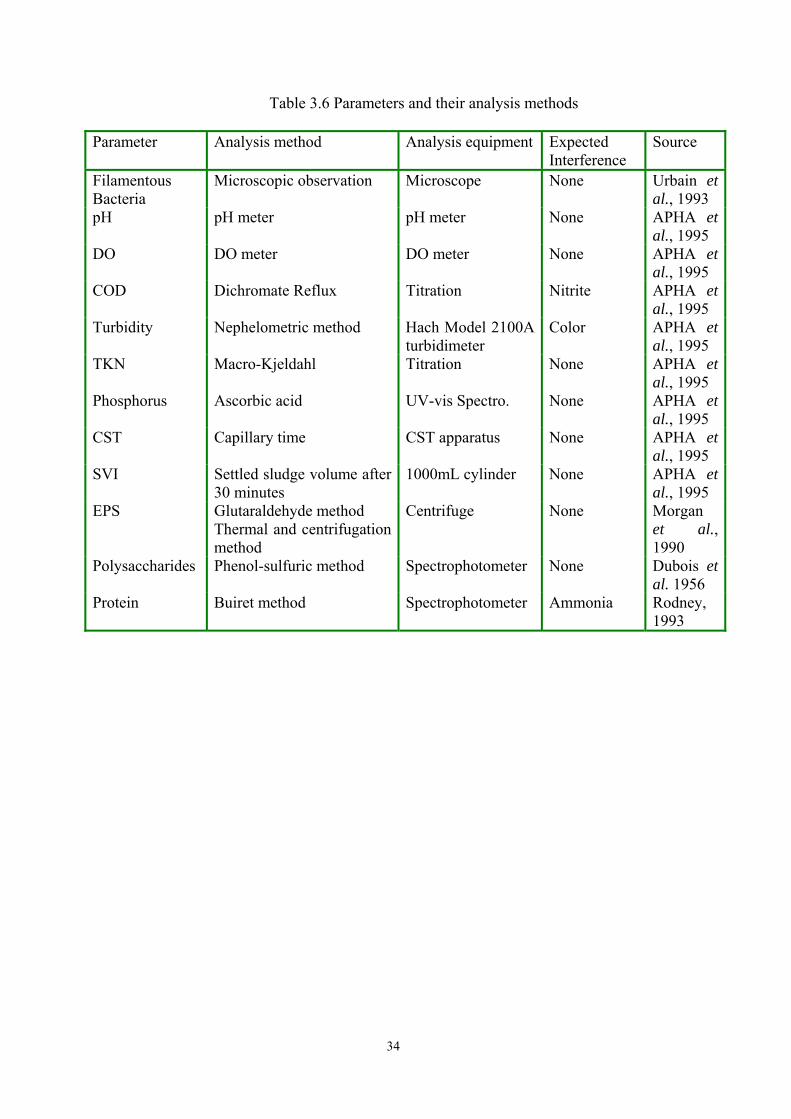
34
Table 3.6 Parameters and their analysis methods
Parameter Analysis method Analysis equipment Expected Interference
Source
Filamentous Bacteria
Microscopic observation Microscope None Urbain et al., 1993
pH pH meter pH meter None APHA et al., 1995
DO DO meter DO meter None APHA et al., 1995
COD Dichromate Reflux Titration Nitrite APHA et al., 1995
Turbidity Nephelometric method Hach Model 2100A turbidimeter
Color APHA et al., 1995
TKN Macro-Kjeldahl Titration None APHA et al., 1995
Phosphorus Ascorbic acid UV-vis Spectro. None APHA et al., 1995
CST Capillary time CST apparatus None APHA et al., 1995
SVI Settled sludge volume after 30 minutes
1000mL cylinder None APHA et al., 1995
EPS Glutaraldehyde method Thermal and centrifugation method
Centrifuge None Morgan et al., 1990
Polysaccharides Phenol-sulfuric method Spectrophotometer None Dubois et al. 1956
Protein Buiret method Spectrophotometer Ammonia Rodney, 1993

35
Chapter 4
4 Result and discussion In the literature there is limited information available on the effect of environmental
conditions and operating variables on EPS production, not only amount but also types of EPS, and sludge properties, particularly in relation to sludge settling and dewatering. Such information would be useful in obtaining a more comprehensive understanding of the role of EPS in bioflocculation and dewatering. To control EPS production, there are many factors necessary to be considered. Between many factors affecting on EPS production, nutrients was considered as an important factor (Forster, 1983; Sponza, 2002). This study examines effects of EPS in relation to the operations of WWTPs and effects of nutrients (nitrogen and phosphorus) on EPS production related to sludge properties. The study was conducted in two phases. The first phase was survey study. Wastewater and sludge samples were collected from 15 WWTPs and four lab-scale reactors and analyzed in laboratory. The relationship between nutrients, EPS with sludge settling and dewatering which were measured by SVI (Sludge Volume Index) and CST (Capillary Suction Time) was examined. The second phase was laboratory study. Twenty-six batch reactors were conducted with different nutrient ratios to examine effects of nutrients on EPS production. 4.1 EPS in bioflocculation and dewatering: An analytic approach
4.2 General characteristics of the plants and the sludge samples
Nineteen activated sludge and wastewater samples were taken from fifteen WWTPs in Thailand and four lab-scale reactors at Asian Institute of Technology laboratory (plants description and the plant flow chart are presented in Appendix A). All plants were sampled once. Operational conditions of those places were taken. Wastewater characteristics and the biological properties of each plants and reactors were analyzed in the laboratory. In this study, 10 parameters were analyzed in the laboratory including wastewater compositions (BOD, COD, N, P, Effluent SS), sludge properties (SVI, CST), floc composition (biomass analysis, EPS) and filamentous microorganism. It was difficult to get all necessary information. Many WWTPs just operated the process depend on labor experience. Therefore the operation conditions from many WWTPs were lacking. Table 4.1 shows the characteristics of wastewater that entered to the aeration tank.
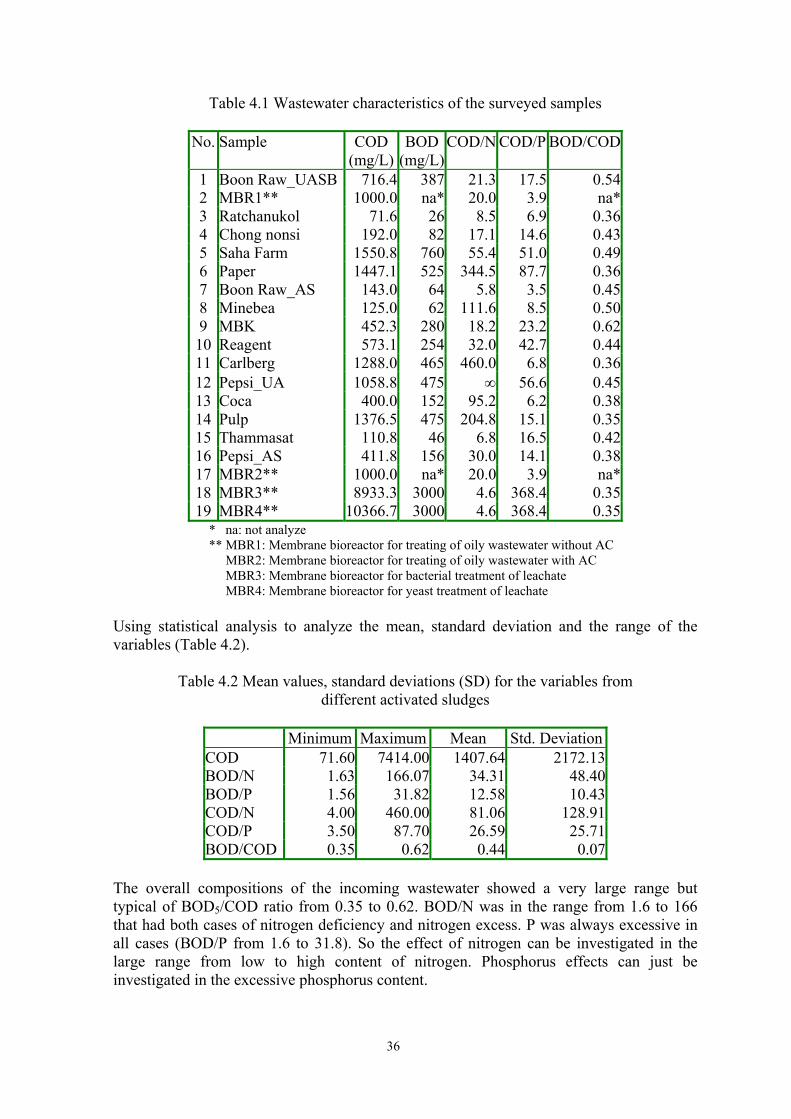
36
Table 4.1 Wastewater characteristics of the surveyed samples
No.
Sample
COD (mg/L)
BOD(mg/L)
COD/N
COD/P
BOD/COD
1 Boon Raw_UASB 716.4 387 21.3 17.5 0.542 MBR1** 1000.0 na* 20.0 3.9 na*3 Ratchanukol 71.6 26 8.5 6.9 0.364 Chong nonsi 192.0 82 17.1 14.6 0.435 Saha Farm 1550.8 760 55.4 51.0 0.496 Paper 1447.1 525 344.5 87.7 0.367 Boon Raw_AS 143.0 64 5.8 3.5 0.458 Minebea 125.0 62 111.6 8.5 0.509 MBK 452.3 280 18.2 23.2 0.6210 Reagent 573.1 254 32.0 42.7 0.4411 Carlberg 1288.0 465 460.0 6.8 0.3612 Pepsi_UA 1058.8 475 ∞ 56.6 0.4513 Coca 400.0 152 95.2 6.2 0.3814 Pulp 1376.5 475 204.8 15.1 0.3515 Thammasat 110.8 46 6.8 16.5 0.4216 Pepsi_AS 411.8 156 30.0 14.1 0.3817 MBR2** 1000.0 na* 20.0 3.9 na*18 MBR3** 8933.3 3000 4.6 368.4 0.3519 MBR4** 10366.7 3000 4.6 368.4 0.35
* na: not analyze ** MBR1: Membrane bioreactor for treating of oily wastewater without AC MBR2: Membrane bioreactor for treating of oily wastewater with AC MBR3: Membrane bioreactor for bacterial treatment of leachate MBR4: Membrane bioreactor for yeast treatment of leachate
Using statistical analysis to analyze the mean, standard deviation and the range of the variables (Table 4.2).
Table 4.2 Mean values, standard deviations (SD) for the variables from different activated sludges
Minimum Maximum Mean Std. Deviation COD 71.60 7414.00 1407.64 2172.13BOD/N 1.63 166.07 34.31 48.40BOD/P 1.56 31.82 12.58 10.43COD/N 4.00 460.00 81.06 128.91COD/P 3.50 87.70 26.59 25.71BOD/COD 0.35 0.62 0.44 0.07
The overall compositions of the incoming wastewater showed a very large range but typical of BOD5/COD ratio from 0.35 to 0.62. BOD/N was in the range from 1.6 to 166 that had both cases of nitrogen deficiency and nitrogen excess. P was always excessive in all cases (BOD/P from 1.6 to 31.8). So the effect of nitrogen can be investigated in the large range from low to high content of nitrogen. Phosphorus effects can just be investigated in the excessive phosphorus content.

37
BOD5/COD ratios gave the information about the biodegradability of wastewater. If BOD5/COD ratio ranged lower than 0.35, the wastewater could be degraded slowly or with difficulty (Sponza, 2002 ). Table 4.1 showed BOD5/COD from all samples in the typical range that can be biodegradable by microorganism. Microscope observation showed that filamentous microorganism presented in nearly all samples, except for MBR3 and MBR4. Filamentous index varied from none to high level (from 0 to 5). Table 4.3 showed the filamentous index, SVI value and EPS production in the sludge samples.
Table 4.3 Qualitative scale for the presence of filamentous microorganism in the sludge samples.
No. Sample EPS (mg/g) SVI (ml/g) Filament index2 1 Boon Raw_UASB 3.7 not settle 2 2 MBR1 30.3 48.7 Not detect 3 Ratchanukol 30.0 51.3 4 4 Chong nonsi 12.9 75.0 1 5 Saha Farm 18.5 79.1 2 6 Paper 27.0 88.5 4 7 Boon Raw_AS 11.2 163.6 2 8 Minebea 32.8 173.6 3 9 MBK 57.0 190.8 2 10 Reagent 70.1 192.0 3 11 Carlberg 52.9 192.3 5 12 Pepsi_UASB 5.2 277.0 2 13 Coca 60.0 291.7 4 14 Pulp 7.0 339.6 2 15 Thammasat 69.7 382.8 3 16 Pepsi_AS 93.9 455.6 3 17 MBR2 25.7 30.0 Not detect 18 MBR3 na1 Not settle 0 19 MBR4 na1 Not settle 0
1 na: can not detect 2 Filament index in the range of 0 to 5 (Not presence to proliferation).
According to microscopic observation of the sludge, filamentous bacteria always presented even with low SVI values and 13 out of nineteen sludge showed SVI values higher than 150 mg/L which was considered as a limit for bulking (Table 4.3). Filamentous bacteria were not always causing sludge bulking. It could be explained that the present of filament in each sample supported to some extent role of filament structures as a backbone for the structure of the flocs (Urbain et al., 1993). When filamentous organism incorporated into the aggregate this affected the floc by acting as a backbone to which microorganism and other particles attached. At the moderate rates of filament growth or the low filament number, larger floc resulted and this did not negative affect settling. When the filamentous organisms increased beyond the floc boundaries and this was coupled with porosity of the big floc this affected sludge settling negatively (Sponza, 2002).

38
4.2.1 EPS extraction EPS in activate sludge was extracted by glutaraldehyde extraction method. EPS varied from 3.7 to 93.9 mg/g SS (Table 4.3) except for two samples from the membrane bioreactors that treated landfill leachate could not extract EPS because of the contamination of brownish black color of leachate. The amount of EPS represented a small fraction of the activated sludge mass. For the glutaraldehyde extraction method, EPS accounted less than 8 % of the sludge dry weight. It agreed with Beccari et al. (1980) and Clarke and Forster (1982) that even with a drastic extraction method procedure such as heat treatment, EPS still accounted for less than 14 % of the sludge dry weight. The limitation of this extraction method was that EPS in glutaraldehyde solvent could not directly measure protein and carbohydrate because of the contamination of glutaraldehyde solvent. In addition, precipitated EPS could not be diluted completely in distilled water. Therefore EPS compositions could not be measured for this extraction method. Because of that, the separately effect of each components of EPS could not evaluated and the cell disruption level which can measured by the DNA level in the EPS extracted solution could not be compared. 4.2.2 Multi correlation among EPS, sludge properties and plant operation
conditions The effects of EPS on sludge properties were investigated under multi correlation with many other factors including operational conditions, type of wastewater, wastewater compositions. Table 4.4 showed the EPS production, characteristic of wastewater and sludge.
Table 4.4 EPS production, wastewater and sludge characteristics
No.
Sample
EPS (mg/g)
SVI (ml/g)
CST(s/g)
MLSS (mg/L)
SS (mg/L)
pH
1 Boon Raw_UASB 3.7 not settle 2.7 27540 60.0 5.9 2 MBR1 30.3 48.7 3.7 8800 0.0 7.0 3 Ratchanukol 30.0 51.3 1.8 3900 40.0 7.3 4 Chong nonsi 12.9 75.0 0.8 11960 10.0 6.8 5 Saha Farm 18.5 79.1 3.6 9200 20.0 7.0 6 Paper 27.0 88.5 18.7 520 70.0 5.9 7 Boon Raw_AS 11.2 163.6 4.1 4340 50.0 7.1 8 Minebea 32.8 173.6 4.7 2420 10.0 7.1 9 MBK 57.0 190.8 12.5 3250 30.0 7.1 10 Reagent 70.1 192.0 8.3 2060 50.0 6.2 11 Carlberg 52.9 192.3 2.6 4420 10.0 6.5 12 Pepsi_UA 5.2 277.0 4.5 2744 10.0 6.3 13 Coca 60.0 291.7 2.9 2400 60.0 7.1 14 Pulp 7.0 339.6 16.1 2120 50.0 6.5 15 Thammasat 69.7 382.8 7.4 2090 20.0 7.4 16 Pepsi_AS 93.9 455.6 6.3 1800 40.0 7.0 17 MBR2 25.7 30 1.8 6220.0 0.0 7.0 18 MBR3 - not settle - 8933.3 0 3.6 19 MBR4 - not settle - 10366.7 0 7

39
Table 4.5 Descriptive Statistics
Minimum Maximum Mean Std. Deviation MLSS 520.00 27540.00 5634.35 6434.71 EPS 3.70 93.90 36.93 27.12 SVI 30.00 455.60 198.11 133.71 CST 0.80 18.70 6.30 5.21 SS 0.00 70.00 31.18 22.88 pH 3.60 7.40 6.62 0.86
The analytical results showed that sludge samples varied from normal sludge to bulking and difficult to dewatering sludges. SVI varied in the range of 30 to 455.6 ml/g (the limit for sludge bulking is SVI > 150 ml/g SS) and CST varied from 0.8 to 18.7 s/g SS. The pH level was almost in the range of 6-7.5, except for MBR4 yeast culture that had low pH of 3.6. Multiple regression analysis was used to investigate the multiple effects of many factors on sludge characteristics. It had been performed on data with SVI, CST, SS as the dependent variables and 7 independent variables, namely the filamentous index, total EPS, MLSS, BOD/COD, BOD/N, BOD/P, pH to investigate the relationship between many parameters on the dependent variables. Table 4.6 showed the descriptive statistic of the analyzing Table 4.6 Linear coefficients of the correlation statistically significant at a 0.95 probability
level (α = 5 %), i.e. r ≥ 0.5
SVI CST SS EPS MLSS COD/N COD/P BOD/COD pH Filament Index
SVI 1.000 - - - - - - - - -CST .220 1.000 - - - - - - - -SS .327 .450 1.000 - - - - - - -EPS .580* .051 .022 1.000 - - - - - -MLSS -.618* -.421 .017 -.475 1.000 - - - - -COD/N -.004 .356 .115 -.009 -.259 1.000 - - - -COD/P -.016 .533* .298 -.155 -.159 .326 1.000 - - -BOD/COD .128 -.437 -.194 .132 .349 -.559* -.238 1.000 - -PH -.060 -.346 -.398 .340 -.319 -.483 -.598* .244 1.000 -Filament Index .032 .036 .176 .479 -.400 .611 -.021 -.275 .005 1.000* Correlation is significant at the 0.05 level (2-tailed). The statistical results (Table 4.6 and Figure 4.1) presented that there was positive correlation between EPS and SVI (R2 = 0.580, P = 0.006). The non-linear correlation between SVI and EPS followed the following Equation:
SVI = -0.0013 × EPS3 + 0.274476 × EPS2 – 11.722 × EPS + 236.92 Equation 4.1 (R2 = 0.56) Similar positive correlation between EPS and SVI was reported by many authors (Urbain et al. (1993), Forster (1971), and Chao and Keinath (1979)).

40
050
100150200250300350400450500
0 20 40 60 80 100EPS (mg/g MLSS)
SVI
Figure 4.1 Effect of EPS production on SVI value
Statistical analysis showed that EPS seemed to have no correlation with CST (R2 = 0.051) and SS (R2 = 0.022). COD/P (R2 = 0.533; P = 0.011) was found to have correlation with CST (Figure 4.2)
CST = 0.14 × COD/P + 3.4 (Model summarize: R2 = 0.37; P = 0.022)
0
2
4
6
8
10
12
14
16
18
20
0 20 40 60 80 100EPS (mg/g MLSS)
CST
(s)
Figure 4.2 Effect of EPS production on CST value

41
No correlation was found between SS and any parameters included EPS (Figure 4.3).
0
10
20
30
40
50
60
70
80
0 20 40 60 80 100EPS (mg/g MLSS)
SS (m
g/L)
Figure 4.3 Relationship between EPS and effluent SS
EPS seemed only have correlation with SVI but the correlation was not strong (R2 of 0.337). EPS was found to have no correlation with CST and SS. It can be said that total EPS seem not have correlation with sludge properties. The results seem inversely with many previous studies. In literature, effect of operational conditions on EPS could be found because of fixing the other parameters. In this study, the difference of all parameters between samples made difficult to find the relationships. The reasons also could be the sampling and analytical schedule was extremely random, therefore it was difficult to evaluate the operation situation of these plants. In addition, not enough information about operation conditions was able to collect such as SRT, HRT. Therefore the simultaneous effects on EPS production related to sludge properties could not be obtained. The exact value could not be obtained because many plants just operated depend on labor experiment. Filamentous microorganism always presented in most sludge samples but it was not had correlation with sludge properties (R2= 0.032; 0.036; 0.176 and P = 0.420; 0.479; 0.345 for SVI, CST, and SS, respectively). It could be showed that filamentous microorganism could be the backbone for the sludge flocs. 4.2.3 Effect of operations conditions on total EPS
The simultaneous effects of involving factors on EPS production were investigated by multiple regression analysis (stepwise method). It had been performed on data with EPS as the dependent variables and 5 independent variables, namely MLSS, COD, COD/N, COD/P, pH, BOD/COD. The result showed that all independent variables did not have correlation with EPS except for MLSS. There were some correlation between EPS and MLSS, pH, COD but not strong. Using multi regression (stepwise method) to investigate the effect of those factors on EPS production, but no effect can be presented by the analyzing result. It was inversely with

42
many previous worked which investigated the effects separately of those factors on EPS production. That could be caused by many reasons. Firstly there were many factors affecting EPS production such as the dominant microorganism in the process, operational conditions (pH, SRT, HRT, DO) and the characteristics of incoming wastewater (biodegradability, nutrient contents presented, toxicity, cation contents). The effects of those factors were controversial. In this study, as sufficient information was not able to collect, the simultaneous effects of the involving factors could not be obtained. In addition, the sampling schedule was random, so it might be not represent for the normal operation conditions of those plants. a. EPS in aerobic and anaerobic process
The result of EPS production in aerobic and anaerobic process presented the significant difference of those two systems. In anaerobic process, EPS was found vary from 3.7 to 5.2 mg/L (mean of EPS was 4.45) while EPS in aerobic system was found vary from 7 to 93.9 mg/L (mean of EPS was 41.27). F-test statistics showed that EPS differed in the anaerobic from aerobic process and these differences were significant (df = 1; F = 3.83; P = 0.069). It agreed with many authors that EPS yield from digested sludge around 4 % of total dried sludge solid (Morgan et al. (1989)) or 10-20 mg/g of UASB granules sludge (Jia et al (1996)), considerablely less than that EPS from activated sludge which had 70-90 mg/g (Jia et al (1996)). It can be explained that under anaerobic conditions, bacteria may quickly degrade bacteria biopolymers, forming CO2 and CH4 as by products. In addition, the production of exopolysaccharides was restricted in methanogenic bacteria while anaerobic sludges possess a strong population of methanogenics. Methanogenic bacteria do not possess peptidoglycan in their cell walls. One essential component to peptidoglycan synthesisis is lipid carrier molecule (undecaprenyl phosphate). This lipid carrier has also been implicated in the release of exopolysaccharides and capsule formation. In methanogens, this component might be missing, so exopolysaccharides in addition to peptidoglycan synthesis would be limited (Morgan et al., 1990). In addition, Horn et al. (2001) found that EPS can serve as carbon source and energy source during the substrate limited conditions. It can also be explained by the difference in yield coefficient in two systems (Casey (1997); Metcalt and Eddy (1991)). The yield coefficient of anaerobic process (Y = 0.05) is significant lower than aerobic process (Y = 0.5). Biomass produced slower in anaerobic process; therefore EPS produced could be degraded in anaerobic system. So the lower concentrations of EPS were present in anaerobic systems. b. EPS in suspended and attached growth
Analysis results from the lab-scale reactors MBR2 and MBR1 that treated oily wastewater with and without using powder activated carbon (PAC) showed that there was significant difference of EPS production and sludge properties in those two systems (Figure 4.5). In the process using activated carbon as a media for attached growth (MBR2), EPS production was lower and sludge settling and dewatering was better. The reduction of EPS content might have been caused by the adsorption and/or attachment of extractable EPS to the PAC surface or the reduction in the excretion of EPS from the attached microorganism than the suspended growth ones by the physical change of microorganism (Kim et al., 1998). It could be concluded that lesser content of EPS was also one of the reasons for better sludge settling and dewatering.

43
0
10
20
30
40
50
60
MBR1 MBR2Reactors
EPS (mg/g SS)SVI (ml/g)CST (s/g SS)
Figure 4.4 EPS production and sludge properties in suspended and attached growth
(MBR1: suspended growth; MBR2: attached growth) 4.2.4 Effect of nutrient on EPS production and sludge properties
In the examining the results, the main question that need to be answered was- do these data signify that a genuine relationship could exist between nutrient balance and sludge settling and dewatering or they merely mean that a variety of the relationships can be obtained. The results showed there exist no direct correlation between nutrients (nitrogen and phosphorus), EPS production and sludge properties. However, there were some nutrient combinations that were associated with changing of EPS production (Figure 4.5; 4.6), poor settling and difficult to dewatering (Figure 4.7; 4.8). This result offered some correlation of the results obtained by Forster (1985). Although this trend rather than precise relationship, it must be recognized that the data originated from full-scale plants which were not subject to the type or the degree of control which is done on the laboratory units. Also the sampling and analytical schedule was extremely random. This will need further investigation preferable at a single work with a daily sampling and analytical program so that the more detail effect of nutrient concentration on EPS production related to sludge characteristic can be evaluated.
0
10
20
30
40
50
60
70
80
90
100
0 5 10 15 20 25 30 35 40 45N ratio (BOD:N = 100:N)
EPS
(mg/
g)
Figure 4.5 Effect of nitrogen on EPS production
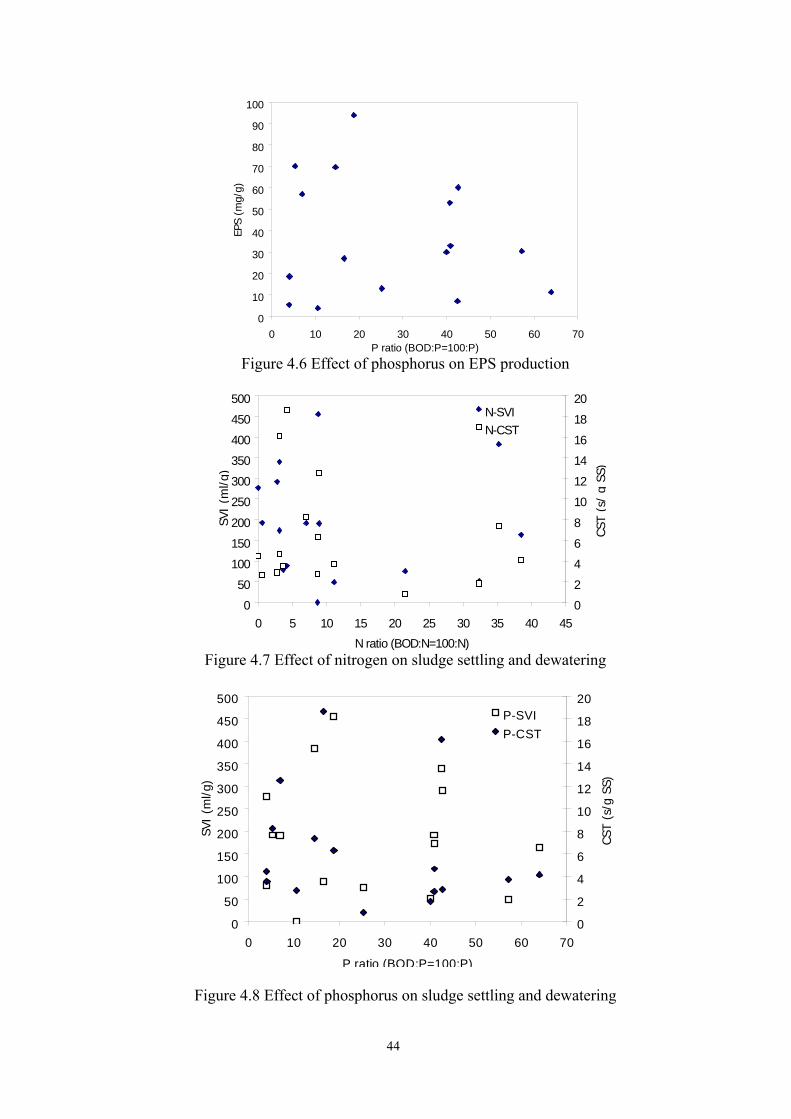
44
0
10
20
30
40
50
60
70
80
90
100
0 10 20 30 40 50 60 70P ratio (BOD:P=100:P)
EPS
(mg/
g)
Figure 4.6 Effect of phosphorus on EPS production
050
100150200250300350400450500
0 5 10 15 20 25 30 35 40 45N ratio (BOD:N=100:N)
SVI (
ml/g
)
02468101214161820
CST
(s/ g
SS)
N-SVIN-CST
Figure 4.7 Effect of nitrogen on sludge settling and dewatering
0
50
100150
200250
300350
400
450500
0 10 20 30 40 50 60 70P ratio (BOD:P=100:P )
SVI (
ml/g
)
0
2
46
810
1214
16
1820
CST
(s/g
SS)
P -SVIP -C ST
Figure 4.8 Effect of phosphorus on sludge settling and dewatering
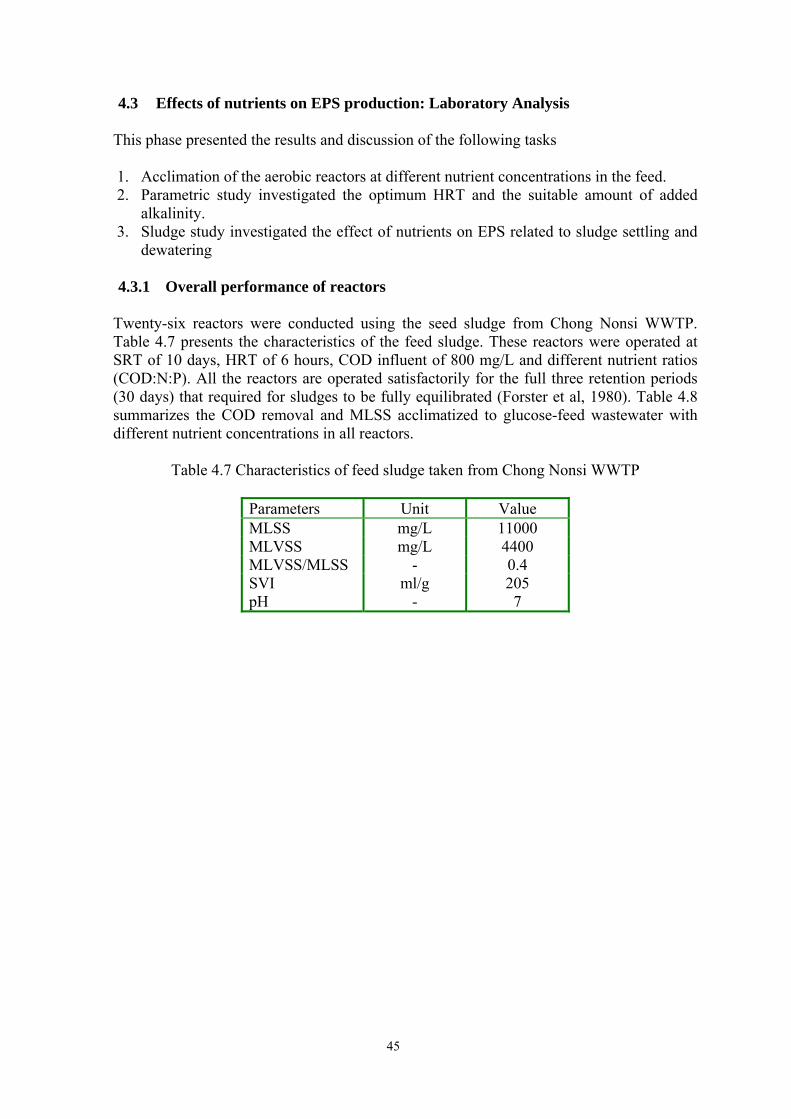
45
4.3 Effects of nutrients on EPS production: Laboratory Analysis This phase presented the results and discussion of the following tasks 1. Acclimation of the aerobic reactors at different nutrient concentrations in the feed. 2. Parametric study investigated the optimum HRT and the suitable amount of added
alkalinity. 3. Sludge study investigated the effect of nutrients on EPS related to sludge settling and
dewatering 4.3.1 Overall performance of reactors
Twenty-six reactors were conducted using the seed sludge from Chong Nonsi WWTP. Table 4.7 presents the characteristics of the feed sludge. These reactors were operated at SRT of 10 days, HRT of 6 hours, COD influent of 800 mg/L and different nutrient ratios (COD:N:P). All the reactors are operated satisfactorily for the full three retention periods (30 days) that required for sludges to be fully equilibrated (Forster et al, 1980). Table 4.8 summarizes the COD removal and MLSS acclimatized to glucose-feed wastewater with different nutrient concentrations in all reactors.
Table 4.7 Characteristics of feed sludge taken from Chong Nonsi WWTP
Parameters Unit Value MLSS mg/L 11000 MLVSS mg/L 4400 MLVSS/MLSS - 0.4 SVI ml/g 205 pH - 7

46
Table 4.8 Summary of performance of mixed bacteria reactors
Reactors No.
COD:N:P CODinf. (mg/L)
CODeff. (mg/L)
CODrem.( %)
MLSS (mg/L)
F/M (g COD/ g MLSS.day)
1 100:0:0 800 330 59 3140 1.02 2 100:1:0.5 797 44 94 4975 0.64 3 100:2:0.5 794 38 95 5420 0.59 4 100:3:0.5 796 41 95 5460 0.58 5 100:5:0.5 791 32 96 6420 0.49 6 100:7:0.5 792 33 96 6580 0.48 7 100:1:1 796 41 95 5700 0.56 8 100:2:1 794 38 95 5540 0.57 9 100:3:1 791 32 96 6380 0.50 10 100:5:1 795 40 95 6160 0.52 11 100:7:1 791 32 96 6420 0.49 12 100:3:0 800 29 96 5540 0.58 13 100:3:2 795 40 95 6460 0.49 14 100:3:3 792 34 96 6555 0.48 15 100:3:5 796 41 95 6780 0.47 16 100:3:7 787 24 97 6730 0.47 17 100:3:10 789 29 96 6430 0.49 18 100:10:0.5 807 63 92 6550 0.49 19 100:12:0.5 808 65 92 7900 0.41 20 100:15:0.5 805 59 93 7080 0.45 21 100:10:1 804 59 93 7280 0.44 22 100:12:1 809 68 92 6800 0.48 23 100:15:1 804 58 93 7300 0.44 24 100:10:2 805 60 93 7280 0.44 25 100:12:2 798 46 94 8500 0.38 26 100:15:2 804 57 93 7840 0.41
The data from the above are average value of at least 3 batches that obtained steady state COD glucose = 0.95×BOD (Henze et al., 1997). Thus COD:N:P ≈ BOD:N:P COD removal profile and microorganism growth rate The performance of the reactors was monitored mainly by the COD removal efficiency and growth rate of microorganism (MLSS). COD removal was calculated based on the difference between total COD influent-total COD effluent. Table 4.9 and Figure 4.9 present the COD removal data for one typical reactors (COD:N:P of 100:5:1). The other reactors are presented in Appendix C.

47
Table 4.9 COD removal data
Time (day) CODinf (mg/L) CODefl (mg/L) COD remove ( %) MLSS (mg/L) 1 793 35.0 96 7020 3 791 31.6 96 5 790 29.0 96 6220 7 786 21.0 97 9 786 21.5 97 11 790 30.0 96 13 790 31.0 96 15 797 43.3 95 6720 17 793 36.0 95 19 790 30.5 96 6500 21 796 41.6 95 23 793 35.0 96 25 800 49.8 94 6920 27 796 42.0 95 29 793 36.0 95 31 796 41.0 95 6160
Mean 792 35.0 96 6590
0
20
40
60
80
100
120
0 5 10 15 20 25 30 35Time (days)
COD
(mg/
L)
5500
5700
5900
6100
6300
6500
6700
6900
7100
MLS
S (m
g/L)
COD efl
COD remove
MLSS
Figure 4.9 Variation of COD removal, biomass in the reactors which COD:N:P of 100:5:1
COD reduction in these reactors was very stable during the operational period. The average value for COD removal is from 93 to 97 %. The growth rate was different with different nutrient contents in the feed.
4.3.2 Parametric study: pH value
This study focused on several operation parameters for the acclimatized mixed bacteria batch cultures. They were pH, HRT. The changing of pH value under different nutrient ratios was investigated. Based on the pH profile, a suitable buffer solution can be used to maintain pH level of 6.5-8 for aerobic bacteria. HRT study was conducted to find out the optimum operation time for COD removal. Based on COD removal, a suitable HRT value for bacteria treatment was determined. The HRT and pH study were conducted in the

48
mixed bacteria batch culture using the fill-and-draw process at the biomass concentration of 7000 mg/L. a. pH study
The pH profile of different reactors was different. With the present of nitrogen, even with low concentration (COD:N = 100:1), pH reduce with time or the amount sodium hydroxide needed to adjust pH to wanted level increased. Inversely, with the presence of high phosphorus concentration (COD:P ≥ 100:3), pH of the reactors increase or the amount of sulfuric acid needed to adjust pH to the wanted level increase. Figure 4.10 showed the pH profile of the 2 reactors which had COD:N:P of 100:3:0.5 (low nitrogen, low phosphorus) and 100:3:3 (low nitrogen, high phosphorus), respectively.
0
2
4
6
8
1 0
1 2
0 1 2 3 4 5 6T im e (h o u r s )
Na
OH
1N
(m
l)
0
2
4
6
8
1 0
1 2
1 4
1 6
1 8
H2
SO
4 1
N (
ml)
N i t r o g e n (C O D :N :P = 1 0 0 :3 : 0 . 5 )
P h o s p h o ru s (C O D :N :P = 1 0 0 : 3 : 3 )
Figure 4.10 pH profile of two reactors: 1) Nitrogen present; 2) High phosphorus level The pH decreased in the reactors that had the presence of nitrogen due to nitrification in the process. Nitrification results from the oxidation of ammonia by Nitrosomonas to nitrite and the subsequent oxidation of nitrite to nitrate by Nitrobactors bacteria and produced H+ that caused decreasing pH. The conversion can be showed by Reaction 4.1 and 4.2: Phosphorus caused the inversely effect on pH. In the aerobic process, phosphate is used by bacteria as an energy reserve and produce polyphosphate which is store in the biomass. Many bacteria can carry this process, the best known are Acinetobacter. The accumulation of polyphosphate under aerobic conditions produced OH- which increased pH. The reaction can be described in the simplified manner as follows (Reaction 4.3) (Henze et al, 1996) (C6H12O6)+ NH4
++ O2+ PO43- C5H7NO2+ CO2+ (HPO3)+ 2OH-+ 3H2O (4.3)
poly-P
Nitrosomonas NH4
+ + 1.5O2 NO2- + H2O + 2H+
(4.1) Nitrobactor NO2
- + 0.5O2 NO3- (4.2)

49
Because pH change during the aeration period, so buffer must be used to maintain pH of the system keep constant at 6.5-7.5. For the pH reduced system, carbondioxide / bicarbonate buffer system was useful to maintain pH in the range 6.5-7.5. However, in the pH increased system or the high phosphorus reactors, this buffer solution was invaluable. After trying out many buffer system, acetic acid / acetate buffer system was suitable for maintaining neutral pH. The little effect of different carbon source with glucose on EPS production can be ignored. b. HRT study
Optimum HRT based on the COD profile or organic removal rates. The COD profiles of acclimatized bacteria batches were examined. The COD profile of COD varies with aeration time in the culture batch. Figure 4.12 shows the COD profile of one typical reactor which had COD:N:P of 100:5:1. Here, optimum HRT referred to aeration time at which COD removal attained more than 90 %.
0
1 0 0
2 0 0
3 0 0
4 0 0
5 0 0
6 0 0
7 0 0
8 0 0
0 1 2 3 4 5 6 7 8 9 1 0 1 1 1 2T im e ( h o u r s )
CO
D c
on
ce
ntr
ati
on
(m
g/L
)
0
1 0
2 0
3 0
4 0
5 0
6 0
7 0
8 0
9 0
1 0 0
CO
D r
em
ov
al
(%)
C O D c o n c e n t r a t i o n
C O D %
Figure 4.11 COD profile of the reactors which had COD:N:P= 100:5:1 HRT study was done by in one cycle operation. Figure showed that after 6 hours of aeration, COD reached more than 90 % and increase slightly. Therefore, the optimum HRT for glucose feed wastewater was chosen at 6 hours. 4.3.3 Sludge characteristic study
The change in color strengthen the fact that acclimation of mixed culture bacteria reactors is completed. With different nutrient types and concentrations, both color and size of sludge flocs were significantly different. With the increasing of nitrogen, sludge floc did not have the visual changing. However the increasing of phosphorus caused bigger sludge flocs. Because of the increase in the cell size, sludge settling, dewatering and clarifying properties were improved with the increasing of phosphorus content in the feed. The supernatant from the high phosphorus concentration reactors were clearer than those reactors low phosphorus concentration.

50
In addition, color also changed with the changing of nitrogen and phosphorus concentration. With the increasing of nitrogen, sludge color changed from the black to brown yellow (Figure 4.12). With the increasing of phosphorus, sludge color changed from the dark brown yellow to light brown yellow (Figure 4.13). Pictures of these changing in all reactors are presented in Appendix B.
Figure 4.12 The color changing with the
increasing of nitrogen (COD:N = 100:1; 100:2; 100:3; 100:5) at the phosphorus level of 4mg/L (COD:P = 100:0.5)
Figure 4.13 The color changing with the
changing of nitrogen and phosphorus content (COD:N:P = 100:3:5; 100:10:0.5; 100:100:1; 100:10:2)
By microscopic observation (Olympus Stereo Microscope), it is recognized that there were presence of EPS in the sludge flocs at all nutrient ratios (Figure 4.14).
Figure 4.14 Activated sludge and EPS (EPS is the white substances, black dots are biomass)
After reactors get the steady state, sludge characteristics and sludge EPS were analyzed. Only polysaccharides and protein were analyzed although other macromolecules such as DNA, phospholipids, glycolipids etc… may be found in the exocellulose organic matrix of the flocs. Carbohydrate content, which varied from 11.2 to 47.7 mg/g SS was found to be the major component of EPS. Protein content, which was in the range 0.85 to 9.4 mg/g SS,

51
was smaller than carbohydrate in all reactors. The ratio of carbohydrate/protein varied from 2.7 to 18.1 (mean value of 8). Amount of EPS production and their components ratio are difficult to compare with other study because of EPS in the aqueous extract. It is difficult to classify these polymers for their relative abundance in the EPS because their molar concentration is not known. In addition, they are measured as standard equivalents (glucose, BSA etc…) that are surely not representative of their true composition. The most important factors are the compositions depend strongly on the extraction method. This is probably the reason for the contradictions in the literature. In the study of Kim et al. (1998), carbohydrate content of EPS extracted from activated sludge by thermal extraction method was found significantly larger than protein content. In this study that uses the same extraction method, carbohydrate was also found more than protein. 4.3.4 Influence of nutrients on EPS compositions
Table 4.10 and Figure 4.16; 4.17; 4.18; 4.19 showed the concentration of total EPS and their components (protein, carbohydrate) found within the floc matrix in twenty-six reactors with many nutrient ratios. Total EPS was found between 24.4 and 89.9 mg/g SS. The protein and carbohydrate level were between 0.85 and 9.4 mg/g SS and between 11.2 and 47 mg/g SS, respectively. EPS analysis showed that protein attributed to 1-20 % of total EPS and carbohydrate attributed to 15-85 % of total EPS. Carbohydrate appeared to be the major component of EPS that extracted by thermal method. The predominant of carbohydrate in the activated sludge EPS could be due to the severity of the extraction method that can cause high level of cell lysis. The effects of nutrients on EPS and sludge properties still can be compared because it was based on the same level of cell lysis.
P = 4 mg/L
0
10
20
30
40
50
60
70
0 10 20 30 40 50 60 70 80 90 100 110 120N (mg/L)
EPS
and
carb
ohyd
rate
(mg/
gSS
)
0
2
4
6
8
10
12
14
16
18
Prot
ein
(mg/
g SS
)
C arbohydrateEPSProtein
Figure 4.15 EPS production and its components content with the increasing of nitrogen at
phosphorus concentration of 4 mg/L

52
Table 4.10 EPS production and its components
Reactor No.
COD:N:P N* (mg/L)
P* (mg/L)
EPS (mg/g SS)
Protein (mg/g SS)
Carbohydrate (mg/g SS)
1 100:0:0 0 0 38.44 1.47 9.42 2 100:1:0.5 8 4 59.70 8.56 43.80 3 100:2:0.5 16 4 38.70 5.65 44.10 4 100:3:0.5 24 4 47.40 5.41 29.50 5 100:5:0.5 40 4 54.90 5.48 32.30 6 100:7:0.5 56 4 67.40 9.40 47.70 7 100:1:1 8 8 70.20 4.56 37.90 8 100:2:1 16 8 70.00 6.03 34.50 9 100:3:1 24 8 75.90 6.29 33.20
10 100:5:1 40 8 84.40 6.4 33.10 11 100:7:1 56 8 77.10 6.98 37.10 12 100:3:0 24 0 68.56 3.81 24.87 13 100:3:2 24 16 68.80 7.23 36.30 14 100:3:3 24 24 57.90 6.36 24.60 15 100:3:5 24 40 81.40 4.24 13.50 16 100:3:7 24 56 89.90 5.91 16.10 17 100:3:10 24 80 71.20 3.65 14.00 18 100:10:0.5 80 4 24.40 1.67 15.70 19 100:12:0.5 96 4 39.20 1.77 18.20 20 100:15:0.5 120 4 52.20 1.25 20.20 21 100:10:1 80 8 34.10 2.77 23.20 22 100:12:1 96 8 33.30 1.75 21.90 23 100:15:1 120 8 36.50 1.07 19.40 24 100:10:2 80 16 33.40 0.85 11.20 25 100:12:2 96 16 33.30 1.93 22.90 26 100:15:2 120 16 25.60 1.65 24.20
* Nitrogen source: NH4CL; Phosphorus source: K2HPO4.
P = 8 mg/L
10
20
30
40
50
60
70
80
90
0 10 20 30 40 50 60 70 80 90 100 110 120N (mg/L)
EPS
and
car
bohy
drat
e (m
g/g)
0
2
4
6
8
10
12
Prt
ein
(mg/
g SS
)
Carbohydrate
EPS
Protein
Figure 4.16 EPS production and its components content with the increasing of nitrogen at
phosphorus concentration of 8 mg/L
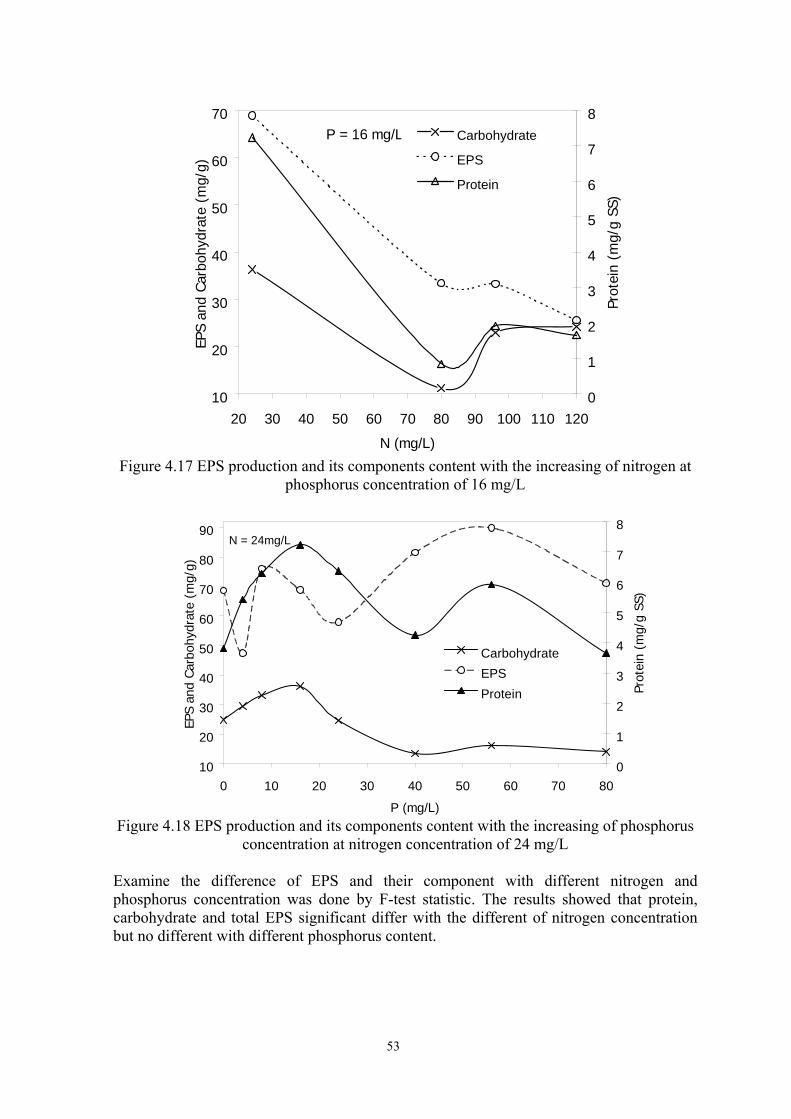
53
P = 16 mg/L
10
20
30
40
50
60
70
20 30 40 50 60 70 80 90 100 110 120N (mg/L)
EPS
and
Carb
ohyd
rate
(mg/
g)
0
1
2
3
4
5
6
7
8
Prot
ein
(mg/
g SS
)
Carbohydrate
EPS
Protein
Figure 4.17 EPS production and its components content with the increasing of nitrogen at
phosphorus concentration of 16 mg/L
N = 24mg/L
10
20
30
40
50
60
70
80
90
0 10 20 30 40 50 60 70 80P (mg/L)
EPS
and
Carb
ohyd
rate
(mg/
g)
0
1
2
3
4
5
6
7
8
Prot
ein
(mg/
g SS
)CarbohydrateEPSProtein
Figure 4.18 EPS production and its components content with the increasing of phosphorus
concentration at nitrogen concentration of 24 mg/L Examine the difference of EPS and their component with different nitrogen and phosphorus concentration was done by F-test statistic. The results showed that protein, carbohydrate and total EPS significant differ with the different of nitrogen concentration but no different with different phosphorus content.

54
Table 4.11 Descriptive statistic with different phosphorus concentration
Group Mean Minimum Maximum EPS 1 47.98 24.40 67.40 2 60.19 33.30 84.40 3 40.27 25.60 68.80 PROTEIN 1 4.89 1.25 9.40 2 4.48 1.07 6.98 3 2.91 0.85 7.23 CARBOHYDRATE 1 31.43 15.70 47.70 2 30.03 19.40 37.90 3 23.65 11.20 36.30 Note: Group: 1 COD:P = 100:0.5
2 COD:P = 100:1 3 COD:P = 100:2
Table 4.12 ANOVA result with different phosphorus concentration
df F Sig. EPS 2 1.797 0.196PROTEIN 2 0.697 0.512CARBOHYDRATE 2 0.785 0.472
Table 4.13 Descriptive statistic with different nitrogen concentration
Group Mean Std. Deviation Minimum Maximum EPS 1 64.95 7.42 59.70 70.20 2 54.35 22.13 38.70 70.00 3 68.46 13.92 47.40 89.90 4 69.65 20.85 54.90 84.40 5 72.25 6.85 67.40 77.10 6 30.63 5.40 24.40 34.10 7 35.26 3.40 33.30 39.20 8 38.10 13.37 25.60 52.20 PROTEIN 1 6.56 2.82 4.56 8.56 2 5.84 0.26 5.65 6.03 3 5.80 1.16 3.65 7.23 4 5.94 0.65 5.48 6.40 5 8.19 1.71 6.98 9.40 6 1.76 0.96 .85 2.77 7 1.81 0.10 1.75 1.93 8 1.32 0.30 1.07 1.65 CARBOHYDRATE 1 40.85 4.17 37.90 43.80 2 39.30 6.78 34.50 44.10 3 26.62 9.04 13.50 36.30 4 32.70 0.56 32.30 33.10 5 42.40 7.49 37.10 47.70 6 16.70 6.06 11.20 23.20 7 21.00 2.47 18.20 22.90 8 21.26 2.57 19.40 24.20 Note Group 1 COD:N = 100:14 4 COD:N = 100:57 7 COD:N = 100:12 2 COD:N = 100:25 5 COD:N = 100:78 8 COD:N = 100:15 3 COD:N = 100:36 6 COD:N = 100:10

55
Table 4.14 ANOVA result with different nitrogen concentration
df F Sig. EPS 7 5.747 0.001PROTEIN 7 14.142 0.000CARBOHYDRATE 7 4.912 0.003
By the results from the F-test, it can be showed that nitrogen strongly affected total EPS and all their compositions while phosphorus have very less effect on EPS. Effect of nutrient on protein
N
806040200-20-40-60
Prot
ein
6
4
2
0
-2
-4
Figure 4.19 Partial regression between nitrogen and protein
P
806040200-20
Prot
ein
6
4
2
0
-2
-4
Figure 4.20 Partial regression between phosphorus and protein
Nitrogen had strong negative correlation with protein (R2 = -0.764; P = 0.000) but phosphorus had no correlation (R2 = 0.025, P = 0.453) (Figure 4.19; 4.20). By using

56
stepwise method to examine, the linear correlation can be showed by the following Equation (R2 of the model = 0.584): Protein (mg/g SS) = -0.05 × N (mg/L) + 7.176 Equation 4.2 It can be said that nitrogen deficiency increases the protein level in EPS. Effect of nutrient on carbohydrate Both nitrogen and phosphorus had negative effects on carbohydrate content of EPS (R2 = -0.463; P = 0.011 for nitrogen and R2 = -0.491; P = 0.007 for carbohydrate) (Figure 4.21; 4.22). By using stepwise method to examine, the linear correlation can be showed by the following Equation (R2 of the model = 0.613): Carbohydrate (mg/g SS) = -0.173 × N (mg/L) – 0.371 × P (mg/L) + 42.185 Equation 4.3 Comparing the coefficient, phosphorus was found more affected carbohydrate than nitrogen.
N
806040200-20-40-60
Carb
ohyd
rate
20
10
0
-10
-20
Figure 4.21 Partial regression between nitrogen and carbohydrate
P
806040200-20
Carb
ohyd
rate
30
20
10
0
-10
-20
Figure 4.22 Partial regression between phosphorus and carbohydrate

57
Relationship between protein and carbohydrate content in EPS A positive correlation between protein and carbohydrate was obtained for all reactors with different nutrient ratios (R2 = 0.772). As the protein content increase, carbohydrate also increase in the EPS. 4.3.5 Influence of EPS compositions on sludge properties with the changing of
nutrients The results showing the effects of nutrients (COD:N:P ratio) on total EPS and EPS compositions are depicted in Table 4.10. The correlation between EPS compositions and sludge properties are presented in Table 4.15.
Table 4.15 Sludge properties at different nutrient concentration in feed.
R COD:N:P SVI (ml/g) CST (s/g SS) Turbidity (NTU) 1 100:0:0 57.3 16.02 25.0 2 100:1:0.5 39.1 1.24 8.8 3 100:2:0.5 46.1 1.38 13.0 4 100:3:0.5 75.9 5.66 27.5 5 100:5:0.5 66.2 5.76 35.0 6 100:7:0.5 50.2 10.33 27.0 7 100:1:1 115.8 1.93 8.5 8 100:2:1 56.9 1.91 15.5 9 100:3:1 53.3 2.04 25.0
10 100:5:1 69.8 4.29 32.0 11 100:7:1 38.9 1.31 40.0 12 100:3:0 90.3 4.03 15.0 13 100:3:2 54.3 1.94 23.0 14 100:3:3 65.6 1.54 7.0 15 100:3:5 36 1.81 24.0 16 100:3:7 44.6 3.22 22.0 17 100:3:10 43.5 2.46 18.0 18 100:10:0.5 32.8 1.51 15.0 19 100:12:0.5 25.3 1.38 10.0 20 100:15:0.5 27.1 1.41 10.0 21 100:10:1 39.8 1.83 17.0 22 100:12:1 30.1 1.50 15.0 23 100:15:1 27.5 1.04 16.0 24 100:10:2 29.5 1.03 21.0 25 100:12:2 22.9 0.66 17.0 26 100:15:2 24.2 0.94 19.0
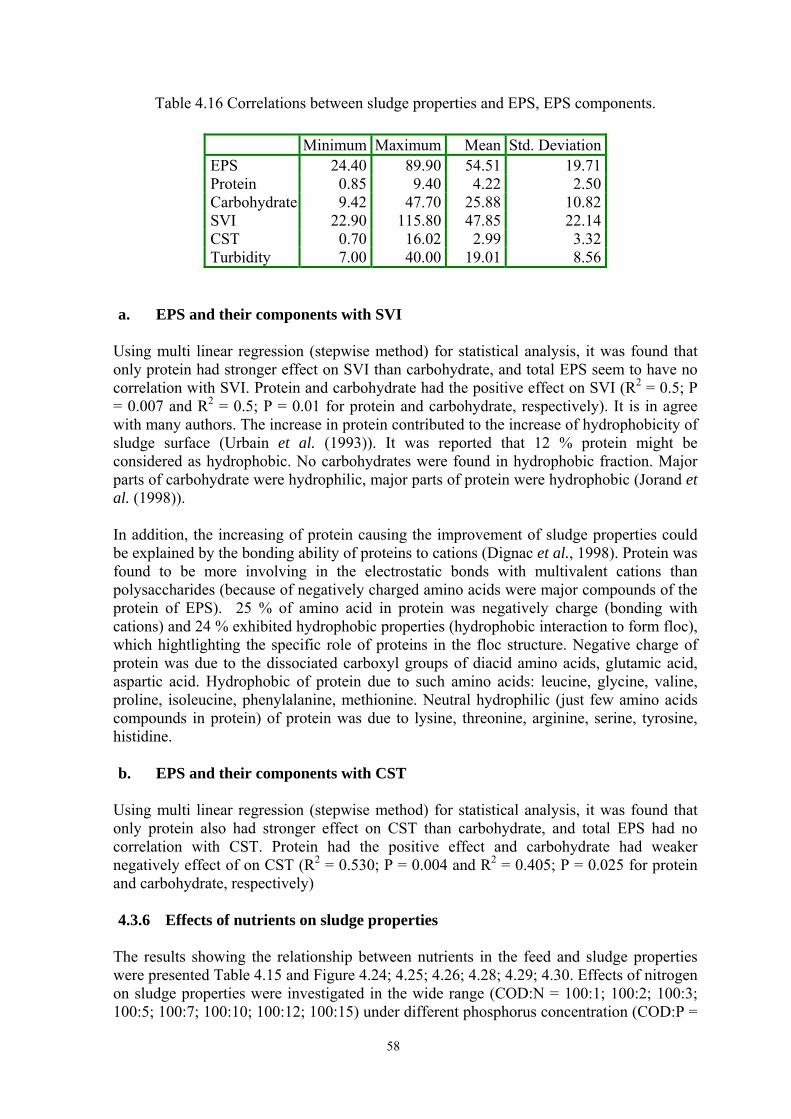
58
Table 4.16 Correlations between sludge properties and EPS, EPS components.
Minimum Maximum Mean Std. Deviation EPS 24.40 89.90 54.51 19.71 Protein 0.85 9.40 4.22 2.50 Carbohydrate 9.42 47.70 25.88 10.82 SVI 22.90 115.80 47.85 22.14 CST 0.70 16.02 2.99 3.32 Turbidity 7.00 40.00 19.01 8.56
a. EPS and their components with SVI
Using multi linear regression (stepwise method) for statistical analysis, it was found that only protein had stronger effect on SVI than carbohydrate, and total EPS seem to have no correlation with SVI. Protein and carbohydrate had the positive effect on SVI (R2 = 0.5; P = 0.007 and R2 = 0.5; P = 0.01 for protein and carbohydrate, respectively). It is in agree with many authors. The increase in protein contributed to the increase of hydrophobicity of sludge surface (Urbain et al. (1993)). It was reported that 12 % protein might be considered as hydrophobic. No carbohydrates were found in hydrophobic fraction. Major parts of carbohydrate were hydrophilic, major parts of protein were hydrophobic (Jorand et al. (1998)).
In addition, the increasing of protein causing the improvement of sludge properties could be explained by the bonding ability of proteins to cations (Dignac et al., 1998). Protein was found to be more involving in the electrostatic bonds with multivalent cations than polysaccharides (because of negatively charged amino acids were major compounds of the protein of EPS). 25 % of amino acid in protein was negatively charge (bonding with cations) and 24 % exhibited hydrophobic properties (hydrophobic interaction to form floc), which hightlighting the specific role of proteins in the floc structure. Negative charge of protein was due to the dissociated carboxyl groups of diacid amino acids, glutamic acid, aspartic acid. Hydrophobic of protein due to such amino acids: leucine, glycine, valine, proline, isoleucine, phenylalanine, methionine. Neutral hydrophilic (just few amino acids compounds in protein) of protein was due to lysine, threonine, arginine, serine, tyrosine, histidine. b. EPS and their components with CST
Using multi linear regression (stepwise method) for statistical analysis, it was found that only protein also had stronger effect on CST than carbohydrate, and total EPS had no correlation with CST. Protein had the positive effect and carbohydrate had weaker negatively effect of on CST (R2 = 0.530; P = 0.004 and R2 = 0.405; P = 0.025 for protein and carbohydrate, respectively) 4.3.6 Effects of nutrients on sludge properties
The results showing the relationship between nutrients in the feed and sludge properties were presented Table 4.15 and Figure 4.24; 4.25; 4.26; 4.28; 4.29; 4.30. Effects of nitrogen on sludge properties were investigated in the wide range (COD:N = 100:1; 100:2; 100:3; 100:5; 100:7; 100:10; 100:12; 100:15) under different phosphorus concentration (COD:P =

59
100:0.5; 100:1; 100:2). SVI value was found vary from 22.9 to 115.8 ml/g. They all were under the limit of bulking sludge. CST was in the range 0.7 to 10.3 s/g SS and turbidity from 7 to 40 NTU. Figure 4.24; 4.25; 4.26 presented the relationship between nitrogen content and sludge properties.
20
30
4050
60
70
80
90100
110
120
0 1 2 3 4 5 6 7 8 9 10 11 12 13 14 15 16N (COD:N = 100:N)
SVI (
ml/g
) COD:P = 100:0.5COD:P = 100:1COD:P = 100:2COD:P = 100:0:0
Figure 4.23 Effects of nitrogen on sludge settling or SVI value at different phosphorus
concentration
0
2
4
6
8
10
12
14
16
18
0 1 2 3 4 5 6 7 8 9 10 11 12 13 14 15 16N (COD:N)
CST
(s/g
)
COD:P =100:0.5COD:P =100:1COD:P =100:2COD:P = 100:0
Figure 4.24 Effects of nitrogen on sludge dewatering or CST value at different COD:P
ratios

60
0
5
10
15
20
25
30
35
40
45
0 1 2 3 4 5 6 7 8 9 10 11 12 13 14 15 16N (COD:N = 100:N)
Efflu
ent T
urbi
dity
(NTU
)
COD:P =100:0.5COD:P =100:1COD:P =100:2COD:P = 100:0
Figure 4.25 Effects of nitrogen on sludge clarifying or effluent turbidity at different COD:P
ratios These above Figure 4.23; 4.24; 4.25 showed that there was the same trend for nitrogen affecting SVI, CST and effluent turbidity. At nitrogen deficient and at very high nitrogen concentration, sludge properties including settling, dewatering and clarifying are improved. Nitrogen deficient reactors (COD:N<100:2) presented good settling and dewatering properties, low SVI and CST values. This fact may be an indication that a low concentration of nitrogen in the feed could enhance biopolymer production under anaerobic conditions (Sponza, 2002). Nitrogen deficiency increases the protein level in EPS (Equation 4.2) by lowering the SVI and CST values from those obtained in the balanced nutrient conditions. The increase in protein caused the increasing of hydrophobicity of sludge surface that led to the improvement of sludge properties (Urbain et al. (1993), Dignac et al (1998), Higgins and Novak (1997), Jorand et al. (1998), Zita and Hermansson (1997)). Not only in aerobic system, the deficiency of nitrogen also increases EPS content and enhances biomass aggregation in anaerobic biofilm system (Punal et al. (2000)). In addition, the excess of nitrogen also improved sludge settling and dewatering. It does not have any authors working on this range (effects of very high level of nitrogen). EPS protein content increases with the increasing of nitrogen content and it was supported to improve sludge properties. However at the high nitrogen concentration (COD:N≥100:10), it could be explained that the structure or the molecular weigh of EPS components produced change leading to the improvement of sludge properties. The increasing of molecular weight of EPS worsened the sludge settling (Forster, 1985). The high level of nitrogen content in the feed led to the other problem which was high nutrient in the effluent (Table 4.17 and Figure 4.26). Discharges containing nitrogen and phosphorus may accelerate the eutrophication of lakes and reservoirs and may stimulate the growth of algae and aquatic plants which may interfere with beneficial uses of the water resources. Significant concentrations of nitrogen in treated effluent may also have other effects including depleting dissolved oxygen in receiving waters, exhibiting toxic towards aquatic

61
life, affecting chlorine disinfection efficiency, presenting public health hazard, and affecting the suitability of wastewater for reuse.
Table 4.17 Nitrogen and phosphorus content in the feed and in effluent in all reactors
Unit: mg/L
Reactors No. COD:N:P Ninf Pinf Neff Peff. 1 100:0:0 0 0 0.28 0.61 2 100:1:0.5 8 4 0.56 6.86 3 100:2:0.5 16 4 0.14 5.96 4 100:3:0.5 24 4 0.42 2.72 5 100:5:0.5 40 4 3.50 3.16 6 100:7:0.5 56 4 0.56 7.54 7 100:1:1 8 8 0.00 16.23 8 100:2:1 16 8 0.00 12.49 9 100:3:1 24 8 0.56 7.59
10 100:5:1 40 8 0.98 9.41 11 100:7:1 56 8 0.56 4.91 12 100:3:0 24 0 20.44 0.09 13 100:3:2 24 16 0.70 16.23 14 100:3:3 24 24 0.98 16.23 15 100:3:5 24 40 2.10 15.70 16 100:3:7 24 56 1.68 19.94 17 100:3:10 24 80 1.82 19.18 18 100:10:0.5 80 4 7.98 4.37 19 100:12:0.5 96 4 17.92 5.18 20 100:15:0.5 120 4 44.38 5.14 21 100:10:1 80 8 7.00 16.88 22 100:12:1 96 8 6.44 16.49 23 100:15:1 120 8 34.44 13.79 24 100:10:2 80 16 20.44 12.96 25 100:12:2 96 16 32.48 14.27 26 100:15:2 120 16 53.48 17.50

62
0
5
10
15
20
25
0 20 40 60 80 100 120 140N or P in feed (mg/L)
N in
effl
uent
(mg/
L)
0
10
20
30
40
50
60
P in
effl
uent
(mg/
L)
PN
Figure 4.26 The variation of nitrogen and phosphorus content in effluent versus nitrogen
and phosphorus content in the feed. Effects of phosphorus on sludge properties were investigated in the wide range (COD:P = 100:0.5; 100:1; 100:2; 100:3; 100:5; 100:7; 100:10) at the same COD:N ratio of 100:3. SVI was found from 36 to 75 ml/g, CST from 1.5 to 5.7, and effluent turbidity from 7 to 27.5 NTU. The range of SVI, CST and Turbidity is narrow and in the typical range for good settling and dewatering. It could be said that phosphorus affected but not as strong as nitrogen effects. Figure 4.28; 4.29; 4.30 showed the relationship between phosphorus content and sludge properties. The increasing of COD:P from 100:0.5 to 100:5 improved settling, dewatering and clarifying or lowering SVI, CST and effluent turbidity. When COD:P increased more than 100:5, sludge properties became worsening.
3 0
3 5
4 0
4 5
5 0
5 5
6 0
6 5
7 0
7 5
8 0
8 5
9 0
9 5
0 1 2 3 4 5 6 7 8 9 1 0 1 1
P ( C O D :P = 1 0 0 :P )
SV
I (m
l/g
)
Figure 4.27 Effect of phosphorus concentration in the feed on sludge settling at COD:N
ratio of 100:3

63
11.5
22.5
33.5
44.5
55.5
6
0 1 2 3 4 5 6 7 8 9 10 11P (COD:P = 100:P)
CST
(s/g
)
Figure 4.28 Effect of phosphorus concentration in the feed on sludge dewatering at COD:N
ratio of 100:3
5
10
15
20
25
30
35
40
0 1 2 3 4 5 6 7 8 9 10 11P (COD:P=100:P )
Turb
idity
(NTU
)
Figure 4.29 Effect of phosphorus concentration in the feed on sludge clarifying at COD:N
ratio of 100:3

64
0
5
10
15
20
25
30
35
40
0 1 2 3 4 5 6 7 8 9 10P (COD:P=100:P )
Carb
ohyd
rate
(mg/
g SS
)
Figure 4.30 Relationship between phosphorus content and EPS carbohydrate
Phosphorus depletion caused increased in carbohydrate (Figure 4.31) and not affected on protein levels in EPS. The increasing of carbohydrate resulted worsening of sludge settling and dewatering or increasing of SVI and CST values (Equation 4.3 and Figure 4.28; 4.29; 4.30; 4.31), it agreed with Bura et al. (1998) who said that polysaccharide in the matrix were largely composed of α–mannosyl end groups, D-glucose and N-acetyl glucosamine sugars. Under phosphorus depleted and P-limited conditions resulted in a decrease in surface charge but increase in acidic polysaccharides. The same result was reported by Shin et al. (2001) that the worsening of sludge settlement because of the increasing of carbohydrate. The relationship between carbohydrate and floc formation was also reported by Morgan et al. (1990) that the high concentrations of anionic surface biopolymers could consequently be correlated with deteriorating sludge settling characteristics because of the influence of floc-repulsion. The increasing of carbohydrate comes with the decreasing of surface charge and worsening sludge settling.

65
Chapter 5
5 Conclusions and Recommendations This fundamental study investigated the effect of nutrients on EPS related to sludge properties on the activated processes. At first, a survey study was done to investigate effects of EPS and relating factors in operation of many wastewater treatment plants and laboratory reactors. EPS productions in aerobic and anaerobic processes, attached and suspended growth were compared in this study. Secondly, laboratory study, the effects of nutrients (nitrogen and phosphorus) were investigated more detail by laboratory batch reactors. The optimum operating parameters for the bacteria mixed culture at different nutrient concentrations were found from the parametric study using batch reactors. The main part of this research focused on the SBR process. The conclusions draws from the whole experimental results are presented below. 5.1 Conclusions
Field survey study From the survey study it can be generally concluded that there were the simultaneous effects of many factors on EPS and they were directly or indirectly affect sludge properties. The results showed that total EPS seemed to have some correlation with sludge settling but no correlation with sludge dewatering and clarifying properties. The limitation of this phase is EPS components could not be measured. It was proposed for the laboratory study. Different biological systems led to different EPS production. EPS in the anaerobic processes was less than in the aerobic processes (4.45 mg/L and 41.27 mg/L, respectively). EPS in attached growth was less than in suspended growth. In addition, filamentous was found to be the backbone for the sludge floc and not always related to bulking of sludge. The settlement of activated sludge had been evaluated in terms of the nutritional balance of the sewage fed to the aeration tank and in term of total polymer that could be obtained from the sludge in this study. The nutritional studies showed that despite the vagaries of the sampling and analysis at the full-scale plants there was some indication that settlement was influenced by the balance of the basic nutrient (nitrogen and phosphorus). The results from this study presented that EPS is one of the important factors in operation of WWTPs, but EPS alone cannot solve the operational problems in WWTPs. It is necessary to take into account many other factors besides of EPS to have the better effluent quality of the biological process. Laboratory scale experimental study Nutrient effect was done in the wide range including both nutrient deficiency and excess. Nitrogen was run in the range of COD:N of 100:1; 100:2; 100:3; 100:5; 100:7; 100:10 and 100:15 and phosphorus in the range of COD:P of 100:0.5; 100:1; 100:2; 100:3; 100:5; 100:7; 100:10. Experimental runs were conducted with the mean biomass concentration from 6000 to 7000 mg/L, SRT of 10 days, HRT of 6 hours.

66
The results of the parametric study indicated that pH changing with the presence of nitrogen and phosphorus. The presence of nitrogen led to the decreasing of pH from 7 to 4 and the presence of high phosphorus content increasing pH from 7 to 10. It was necessary to use buffer solution to maintain pH suitable for aerobic bacteria. The optimum HRT for glucose-feed reactors was 6 hours at which more than 90 % of COD was removed. Under the conditions of this study which using glucose as carbon source, NH4Cl as nitrogen, K2HP4 as phosphorus source, COD in feed of 800 mg/L. Nutrient included nitrogen and phosphorus were found to have a significant effect on sludge properties. The effect of nutrients on EPS and its components presented by the following Equations Carbohydrate(mg/g SS) = -0.173× N(mg/L) – 0.371× P + 42.18 (R2 = 0.61) Equation 4.3 Protein (mg/g SS) = -0.05× N(mg/L) + 7.18 (R2 = 0.58) Equation 4.2 EPS (mg/g SS) = -0.36× N (mg/L)+ 74.49 (R2 = 0.56) Equation 4.4 Nitrogen affected on both carbohydrate and protein of sludge EPS while phosphorus only affected on carbohydrate. It seemed that nitrogen and phosphorus both affected negatively EPS and its components. Total EPS did not affect sludge properties. EPS components were found to strongly affect sludge properties. Between carbohydrate and protein, protein was found affect stronger than carbohydrate. Protein and carbohydrate both affected positively on SVI and CST value. Nutrients were found affect on EPS components, especially nitrogen. It was interesting to control nutrients in the feed to control EPS; therefore sludge properties can be improved. The optimum phosphorus is the range of COD:P ratio of 100:3 to 100:5 while the optimum nitrogen is the range in which COD:N lower than 100:2 or higher than 100:10. Phosphorus content was found always excess in the WWTPs from the results of the first phase. Therefore the optimum range for phosphorus in the influent can be applied in operation of WWTPs. The excess of nitrogen improves sludge properties but it causes another problem with the high level of nitrogen in the effluent. 5.2 Recommendations
Based on the fundamental experiment results obtained, several recommendations for future study can be proposed Further survey study What must now be judged is whether there is any genuine benefit in pursuing this type of investigation any further. To do so would really require access to a full-scale works for an extended period and an intensive sampling/analytical program would so be necessary. Furthermore, the study would have to be duplicated at other treatment work before any firm recommendations could be reached. All of this would be expensive and there is no guarantee of being able to derive a unified hypothesis. It cannot therefore be emphasized too strongly that further work along these lines will required careful planning and significant financial support.

67
Effect of EPS and its components
1. The result from this study presented that total EPS is not as important as its components. Only protein and carbohydrate were measured in here, the other components such as lipid, DNA is not measured. By taking into account all the components of EPS, the correlation with sludge properties could be clearer.
2. In addition, molecular weight of EPS also important in understanding of the effecting mechanism of EPS on sludge properties
More investigating on the effects of nutrients This study has not evaluated in depth the sludge properties at different nutrient ratios in feed related to sludge settling and dewatering. These properties consist of specific resistant, hydrophobicity, surface charge, bound water, and cell size. In order to understand thoroughly the bioflocculation mechanism of sludge, a detailed study of sludge properties at various nutrient ratios should be undertaken. Cations Cations play an important role in bioproperties of sludge floc. Under varying cation concentration of influent wastewater, EPS production, EPS properties and sludge properties can be affected. A balance of cation content (divalent cation: monovalent cations) may lead to the significant improvement of sludge settling, sludge dewatering and reducing in the membrane-clogging rate of MBR process. A study on the effect of cation contents on EPS production and sludge properties would be useful. Effect of other operating parameters on EPS production Besides of nutrients, other operating parameters such as pH, SRT, DO, F/M ratio, and organic loading also have effects on EPS production. By application of the effect of nutrients in this study, a further study could investigate the simultaneous effect of all parameters to get the map of the effecting of all parameters on EPS. Effect of the biodegradability of carbon source With different biodegradability of carbon source, EPS productions are different. In this study only worked on the most easily biodegradable carbon source (glucose). Therefore a study on the hardly biodegradable carbon source could be investigated to compare the different of EPS production with different carbon source Effect of different microorganism population EPS is produced by microorganism. So the dominant microorganism in the system could have the significant effect on EPS production. Taking into account EPS produced in the different mixed culture could be further investigated.

68
Different type of biological process
1. In this study only investigated EPS in the activated sludge process. The different EPS production in other process such as anaerobic system would be interesting to investigate.
2. The different type of bacteria growing can lead to different EPS production that is directly effect on sludge properties. This study investigated the EPS production in the suspended growth. Investigating the effect of EPS in the other growing system like attached growth might be might contribute to the more understanding of the role of EPS in biological system

69
Reference
Adham, S., Gagliardo, P., Boulos, L., Oppenheimer, J., and Trussell, R., 2001. Feasibility of the membrane bioreactor process for water reclamation. Water Science and Technology, 43(10), 203-209.
APHA, AWWA, WEF (1995), Standard Methods for the examination of Water and Wastewater, 19th Edition, Washington D.C., USA.
Applegate, D.H., and Bryer, J. D., 1991. Effect of carbon and oxygen limitations and calcium concentration on biofilm removal processes. Biotechnology and Bioengineering, 37(1), 17-25.
Azeredo, J., Oliveira, R., and Lazarova, V. (1998) A new method for extraction of exopolymers from activated sludges. Water Science and Technology, 37(4-5), 367-370.
Beccari, M., Mappelli, P., and Tandoi, V. (1980) Relationship between bulking and physicochemical-biologycal properties of activated sludges. Biotechnology and Bioengineering, 22, 969-979.
Bisogni, J. J., and Laurence, W., (1971) Relationship between biological solids retention time and settling characteristics of activated sludge. Water Research, 5, 753-763.
Brown, M.J., and Lester, J.N. (1980) Comparison of bacterial extracellular polymer extraction methods. Applied and Environmental Microbiology, 40(2), 179-185.
Bruus, J.H., Nielsen, P.H., and Keiding, K. (1992) On the stability of activated sludge flocs with implications to dewatering. Water Research,. 26(12), 1597-1604.
Bura, R., Cheung, M., Liao, B., Finlayson, J., Lee, B.C., Droppo, I.G., Leppard, G.G., and Liss, S.N. (1998) Composition of exocellular polymeris substance in the activated sludge floc matrix. Water Science and Technology, 37(4-5), 325-333.
Casey, T., J., (1997) Unit treatment processes in water and wastewater engineering. John Wiley & Sons Ltd., Singapore, ISBN 0471966932.
Çetin, F. D., and Sürücü, G. (1990) Effects of temperature and pH on settleability of activated sludge flocs. Water Science and Technology, 22 (9), 249-254.
Chaize, S., and Huyard, A., 1991. Membrane bioreactor on domestic wastewater treatment sludge production and modeling approach. Water Science and Technology, 23, 1591-1600.
Chao, A. C., and Keinath, T. M. (1979) Influence of process loading intensity on sludge clarification and thickening characteristics. Water Research, 13, 1213-1223.
Chang, I-S., Bag, S-O., and Lee, C-H (2000) Effects of membrane fouling on solute rejection during membrane filtration of activated sludge. Process Biochemistry, 36 (2001), 855-860 .
Cicek, N., Macomber, J., Davel, J., Suidan, M. T., Audic, J., and Genestet, P., 2001. Effect of solids retention time on the performance and biological characteristics of a membrane bioreactor. Water Science and Technology, 43 (11), 43-50.
Dan, N. P., 2001. Biological treatment of high salinity wastewater using yeast and bacterial systems. AIT dissertation. Bangkok, Thailand.
Dignac, M.-F, Urbain V., Rybacki, D., Bruchet, A., Snidaro, D., and Scribe, P. (1998) Chemical description of extracellular polymers: Implication on activated sludge floc structure. Water Science and Technology, 38 (8-9), 45-53.
Dubois, M., Gilles, K.A., Hamilton, J.K., Rebers, P.A., and Smith, F. (1956) Colorimetric method for determination of sugars and related substances. Analytical Chemistry, 28(3), 350-356

70
Eikelboom, D. H. (2000) Process control of activated sludge plants by microscopic investigation. Latimer Trend & Co Ltd, Plymouth, UK.
Eriksson, L., Steen, I., and Tendaj, M., (1992) Evaluation of sludge properties at an activated sludge plant. Water Science and Technology, 25 (6), 251-265.
Flemming, H. C., and Wingender, J., 2001. Relevance of microbial extracellular polymeric substances (EPS )-part I: structural and ecological aspects. Water Science and Technology, 43(6), 1-8.
Flemming, H. C., Griebe, T., and Schaule, G., 1996. Antifouling strategies in the technical system-a short review. Water Science and Technology, 34(5-6), 517-524.
Forster, C. F., 1985. Factors involved in the settlement of activated sludge-I nutrients and surface polymers. Water Research, 19(10), 1259-1264.
Forster, C. F., and Clarke, A. R. (1983) The production of polymer from activated sludge by ethanolic extraction and its relation to treatment plant operation. Water Pollution Control, 430-433.
Forster, C. F., and Newton, J. D., 1980. Activated sludge settlement-some suppositions and suggestions. Water Pollution Control, 52, 338-351.
Forster, C.F. (1971) Activated sludge surfaces in relation to the sludge volume index. Water Research, 5, 861-870.
Frolund, B., Palmgren, R., Keiding, K., and Nielsen, P.H. (1998) Extraction of extracellular polymers from activated sludge using a cation exchange resin. Water Research, 30(8), 1749-1758.
Gehr, R., and Henry, J.G. (1983) Removal of extracellular material techniques and pitfalls. Water Research, 17(12), 1743-1748.
Goodwin, J. A. S, and Foster, C. F. (1985) A further examination into the composition of activated sludge surfaces in relation to their settlement characteristics. Water Research, 19(4), 527-533.
Gulas, V., and Bond, M., 1979. Use of exocellular polymers for thickening and dewatering activated sludge. Journal Water Pollution Control Federation, 51(4), 798-807.
Günder, B., and Krauth, K., 1998. Replacement of secondary clarification by membrane separation- results with plate and hollow fiber modules. Water Science and Technology, 38(4-5), 383-393.
Heddle, J. H. (1977) Activated sludge treatment of meat wastes with protein recovery. Meat Industry Research Institute of New Zealand Technical Report No. 616.
Henze, M., Harremoes, P., Jansen, J.C., and Arvin, E. (1997) Wastewater treatment- Biological and chemical process. Second Edition, Springer-Verlag. German.
Higgins, M., and Novak, J. (1997) The effect of cations on the settling and dewatering of activated sludges: Laboratory results. Water Environmental Research, 69 (2), 215-223.
Hodgson, P. H., Leslie, G. L., Schneider, R. P., Fane, A. G, Fell, C. J. D., and Marshall, K. C., 1993. Cake resistance and solute rejection in bacterial microfiltration: The role of the extracellular matrix. Journal of Membrane Science, 79, 35-53.
Horn, H., and Wulkow, M., 2001. Modelling the structure and function of extracellular polymeric substances in biofilms with new numerical techniques. Water Science and Technology, 43(6), 121-127.
Houghton J. I., Quarmby J., and Stephenson T. (2000) The effect of digester retention time on microbial extracellular polymer production and its associated impact on sludge dewaterability. WISA 2000, Sun City, South Africa.
Jefferson, B., Laine, A. L., Stephenson, T., and Judd, S J., 2001. Advanced biological unit processes for domestic water recycling. Water Science and Technology, 43(10), 211-218.

71
Jia, X. S., Fang, H. H. P., and Furumai, H., 1996. Surface charge and extracellular polymer of sludge in the anaerobic degradation process. Water Science and Technology, 34(5-6), 309-316.
Jorand, F., Boue-Bigne, F., Block, J. C., and Urbain, V. (1998) Hydrophobicity/ hydrophylic properties of activated sludge exopolymeric substances. Water Science and Technology, 37(4-5), 307-315.
Jorand, F., Guicherd, P., Urbain, V., Manem, J., and Block, J. C., (1994) Hydrophobicity of activated sludge flocs and laboratory-grown bacteria. Water Science and Technology, 30 (11), 211-218.
Kim, J-S., Lee, C-H, and Chun, H-D., 1998. Comparision of ultrafirtration characteristics between activated sludge and BAC sludge. Water Research, 32(11), 3443-3451.
Kommedal, R., Bakke, R., Dockery, J., and Stoodley, P., 2001. Modelling production of extracellular polymeric substances in a Pseudomonas aeruginosa chemostat culture. Water Science and Technology, 43(6), 129-134.
Körstgens, V., Flemming, C., Wingender. J., and Borchard, W., 2001. Influence of calcium ions on the mechanical properties of a model biofilm of mucoid Pseudomonas aeruginosa. Water Science and Technology, 43(6), 49-57.
Li, D. H. and Ganczarczyk, J. J., (1990) Structure of activated sludge flocs. Biotechnology and bioengineering, 35, 57-65.
Liao, B.Q., Allen, D.G., Droppo, I.G., Leppard, G.G., and Liss, S.N. (2001) Surface properties of sludge and their role in bioflocculation and settleability. Water Research, 35(2), 339-350.
Lovett, D. A., Kavanagh, B. V., and Herrert, L. S. (1983) Effect of sludge age and substrate composition on the settling and dewatering characteristics of activated sludge. Water Research, 17(11), 1511-1515.
Mallevialle, J., Odendaal, P. E., and Wiesner, M. R., 1996. Water Treatment Membrane Processes, McGraw-Hill. ISBN 0-07-001559-7.
Manem and Sanderson, 1996. Chapter 17: Membrane bioreactor in Water Treatment Membrane Processes. AWWA. Lyonnaise de Eaux. Water Research Commission of South Africa. McGraw-Hill.
Metcalt and Eddy (1991) Wastewater Engineering: Treatment, Disposal and Reuse, 3rd Edition, Mcraw Hill, Inc., Singapore, ISBN 0-07-041690-7.
Morgan, J.W, Forster, C.F., and Evison, L. (1990) A comparative study of the nature of biopolymers extracted from anaerobic and activated sludges. Water Research, 24(6), 743-750
Mukai, T., Takimoto, K., Kohno, T., and Okada, M. (2000) Ultrafiltration behaviour of exocellular and metabolic products in activated sludge system with UF separation process. Water Research, 34 (3), 902-908.
Murthy, S. N., and Novak, J. T., (1998) Effects of potassium on sludge settling, dewatering and effluent properties. Water Science and Technology, 37(4-5), 317-324.
Nagaoka, H., Ueda, S., and Miya, A. (1996) Influence of bacterial exocellular polymers on the membrane separation activated sludge process. Water Science and Technology, 34 (9), 165-172.
Nagaoka, H., Yamanishi, S., and Miya, A., 1998. Modeling of biofouling by extracellular polymers in a membrane separation activated sludge system. Water Science and Technology 38(4-5), 497-504.
Nielsen J.L, Mikkelsen L.H and Nielsen P.H (2001) In situ detection of cell surface hydrophobic of probe-defined bacteria in activated sludge. Water Science & Technology, 43 (6), 97-103.

72
Nielsen, P. H., Frolund, B., and Keiding, K., 1996. Changes in the composition of extracellular polymeric substances in activated sludge during anaerobic storage. Applied Microbiology Biotechnology, 44, 823-830.
Nielsen, P. H., Jahn, A., and Palmgren, R., 1997. Conceptual model for production and composition of exopolymers in biofilms. Water Science and Technology, 36, 1: 11-19.
Palmgren R., Jorand F., Nielsen P. H., and Block J. C. (1998) Influence of oxygen limitation on the cell surface properties of bacteria from activated sludge. Water Science and Technology, 37 (4-5), 349-352.
Pavoni, J. L., Tenney, M. W, and Echelberger, W. F. (1972) Bacterial extracellular polymers and biological flocculation. Journal WPCF, 44 (3), 414-431.
Piman, A. R. (1979) Bioflocculation as a means of improving the dewatering characteristics of activated sludges. Water pollution control, 74, 688-700.
Punal, A., Trevisan, M., Rozzi, A. and Lema, J. M. (2000) Influence of C:N ratio on the start-up of uplow anaerobic filter reactors. Water Research, 34 (9), 2614-2619.
Ridgway, H.F. and Flemming, H.C.(1996). Chapter 6: Membrane biofouling in Water Treatment Membrane Processes. AWWA. Lyonnaise de Eaux. Water Research Commission of South Africa, McGraw-Hill.
Rodney, F. B., (1993) Modern experimental biochemistry. Second edition. TheBengamin/ Cummingf publishing Co., Inc., California.
Seo, G. T., Lee, T.S., Moon, B.H., Choi, K.S., and Lee, H.D., 1997. Membrane separation activated sludge for residual organic removal in oil wastewater. Water Science and Technology, 36(12), 275-282.
Sheintuch, M., Lev, O., Einav, P., and Rubin, E. (1986) Role of extracellular polymer in the design of activated sludge. Biotechnology and Bioengineering, 28, 1564-1576.
Shimizu, Y., Okuno, Y., Uryu, K., Ohtsubo, S., and Watanabe, A., 1996. Filtration characteristics of hollow fiber microfiltration membrane used in membrane bioreactor for domestic wastewater treatment. Water Research, 30 (10), 2385-2392.
Shin, H. S., Kang, S. T., and Nam, S. Y. (2001). Effect of carbohydrate and protein in the EPS on sludge characteristics. Water Science & Technology, 43 (6), 193-196.
Sponza, D., T. (2002) Extracellular polymer substances and physicochemical properties of flocs in steady- and unsteady-state activated sludge systems. Process Biochemistry, 37 (2002), 983-998.
Strachan, L. F., Freitas dos Santos, L. M., Leak, D. J., and Livingston, A. G., 1996. Minimisation of biomass in an extractive membrane bioreactor. Water Science and Technology, 34(5-6), 273-280.
Tago Y., and Aida K., (1977) Exocellular mucopolysaccharide closely related to bacterial floc formation. Applied and Environmental Microbiology, 34 (3), 308-314
Tardieu, E., Grasmick, A., Geaugey, V., and Manem, J., 1998. Hydrodynamic control of bioparticle deposition in a MBR applied to wastewater treatment. Journal of membrane science 147, 1-12.
Trouve, E., Urbain, V., and Manem, J., 1994. Treatment of municipal wastewater by a membrane bioreactor: reusults of a semi-industrial pilot-scale study. Water Science and Technology, 30(4), 151-157.
Urbain, V., Block, J.C., and Manem, J. (1993) Biofloculation in activated sludge: An analytic approach. Water Research, 27(5), 829-838.
Wu, Y. C. Smith, E. D., Novak, R. (1982) Filterability of activated sludge in response to growth conditions. Journal WPCF, 54(5), 444-456.
73
Wuertz, S., Pfleiderer, P., Kriebitzsch, K., Spath, R., Griebe, T., Coello-Oviedo, D., Wilderer, P. A., and Flemming, H. –C. (1998) Exocellular redox activity in activated sludge. Water Science and Technology, 37(4-5), 379-384.
Wuertz S., Spaelh R., Hinderberger A., Griebe T., Fiemming H.-C. and Wilderer P.A. A new method for extraction of extracellular polymeric substances from blofilms and activated sludge suitable for direct quantification of sorbed metals. Water Science and Technology, 43(6), 25-31.
Yamamoto, K., and Win, K. M., 1991. Tannery wastewater treatment using sequencing batch membrane reactor. Water Science and Technology, 23, 1639-1648.
Zhang, X., Bishop, P. L. and Kinkle, B. K. (1999). Comparison of extraction methods for quantifying extracellular polymers in biofilms. Water Science and Technology, 39 (7), 211-218.
Zhang, X., Bishop, P. L., and Kupferle, M. J., 1999. Measurement of polysaccharides and proteins in biofilm extracellular polymer. Water Science and Technology, 37(4-5), 345-348.
Zita, A., and Hermansson, M. (1997) Effects of bacterial cell surface structure and hydrophobicity on attachment to activated sludge flocs. Applied and environmental microbiology, 1168-1170.

74
Appendix A
Data from the survey study Table A.1 Description of WWTPs and lab-scale reactors that samples were taken No. Sample Type Process 1 Pulp Industry WWTP Paper Industry Activated sludge 2 Minebea bullet WWTP Bullet Industry Activated sludge 3 Coca WWTP Soft drink Industry Activated sludge 4 Pepsi WWTP (AS) Soft drink Industry Activated sludge 5 Pepsi WWTP (UASB) Soft drink Industry Upflow anaerobic sludge blanket 6 Boon Raw (AS) Beverage Industry Activated sludge 7 Carlberg WWTP Beverage Industry Activated sludge
8 Saha Farm Slaughter House Industry Activated sludge
9 Paper Industry WWTP Paper Industry Activated sludge 10 Boon Raw WWTP (UASB) Beverage Industry Upflow anaerobic sludge blanket
11 Thammasat University Domestic WWTP Domestic WWTP Activated sludge
12 Reagent hotel WWTP Domestic WWTP Activated sludge
13 MBK WWTP Domestic WWTP Deep shaft reactor, Activated sludge
14 Ratchanukon Hospital WWTP Domestic WWTP Oxidation ditch 15 Chong nonsi WWTP Domestic WWTP Activated sludge
16 MBR1 Lab-scale reactor Membrane bioreactor treated oily wastewater.
17 MBR2 Lab-scale reactor
Membrane bioreactor couple with activated carbon treated oily wastewater.
18 MBR3 Lab-scale reactor Bacterial membrane bioreactor for treating landfill leachate
19 MBR4 Lab-scale reactor Yeast membrane bioreactor for treating landfill leachate

75
Figure A.1 Flow chart of Chong Nonsi WWTP
Inlet
Dynamic Separator
Band
Cass Feed Pumping Station
Screening and Grit Skip Skip
Sludge Buffer Tank
Polymer Dozing System
Combined Belt Mixer
Press
CASS Alum
Sludge Bunker
Sludge Cake (20 % solids)
Cass basin BOD, SS, Nutrient
Outfall Cascade
ChaoPraya River

76
Figure A.2 Flow chart of BoonRawd Brewery WWTP
Drive Unit
UASB
Effluent to River
Return Sludge
Drive Unit
Thickener Pit
Excess Sludge
Filter Press
Sludge Cake
Return Sludge Pit
Boiler
HCL NaOH
Filtrate
Raw Waste

77
W A STE W A TE RIN L E T
SC R E E N TA N K
P
P
STO R A G E TA N K
M M
M IX IN G N E U TR A L IZ A T IO N
M
F L O C C U L A TIO NP
PU M SU M P
P
B
C TR E A TE D W A TE RP
AP
M
F L O TA TIO N
MMP MP M P
A L um N aO H A n-934
PM
A
A E R A T IO N TA N K
C
B
M
PSL U D G E SE D IM E N TA TIO N TA N K
M M
P
P P
SA N DF IL TE RTA N K U TIL ITY F L O W M E TE R
PM
SL U D G E TH IC K E N E R
PM
C O N V E Y E RC A V ITYPU M
H O PPE R W W #1 F L O W M E TE R
SL U D G E C A K E W A STE
P
IN L E T
W A STE W A TE R
W A STE W A TE R
IN L E TP
SC R E E N TA N K
SS-SC R E E N IN G
P
M
F L O C C U L A TIO NN E U TR A L IZ A T IO N
M
N aO HA L um
M
MP P
A n-934
M
PU M SU M PP
M IX IN G
MP
STO R A G E TA N K
F L O TA TIO N
M
P C
B
TR E A TE D W A TE R
P
A
A E R A T IO N TA N K
A
M P
C
B
P
V -N O TC H
V -N O TC HF L O W IN STR U M E N T
A E R A T IO N TA N K
V -N O TC H
SL U D G E TH IC K E N E R
C A V ITY PU MM P
MM
H O PPE R SL U D G E C A K E W A STE
F IL TE R PR E SS
F IL TE R PR E SS
SE D IM E N TA TIO N TA N K
P
M
SA N D F IL TE R TA N K
P P
P
W W #2 F L O W M E TE R
H O L D IN G TA N K F IN A L TA N K
D ISC H A R G E T
R E A C TIO N TA N K
M IX - F IN A L TA N K
A n-934
A n-934R E A C TIO N TA N K
Figure A.3 Flow chart of Minebea WWTP

78
Aeration TankInfluent
Sum Fine Screen Grease Trap ChlorirationSettling TankEffluent
Return Sludge
Sludge Cake WasteBelt Press
Figure A.4 Flow chart of Coca WWTP, Saha Farm WWTP.
Figure A.5 Flow chart Thamasat WWTP, Pulp Industry WWTP, Paper Industry WWTP and Reagent WWTP
Screening & Grit chamber
Aeration Tank
Sedimentation Tank
Belt Press
Effluent
Return Sludge
Sludge cake Waste
Influent

79
Figure A.6 Flow chart of Ratchanukol Hospital WWTP
Screening Oxidation Ditch
Sedimentation Tank
Belt Press
Effluent
Return Sludge
Sludge cake Waste
Influent

80
Figure A.7 Flow chart of Carlberg WWTP
Screening & Grit chamber
Oxidation Ditch
Sedimentation Tank
Concentration Tank
Homogenizing Tank
Effluent
Belt Press
Dewatering
Sludge cake Waste
Influent

81
A eration Tank
M ethane U pflow R eactor (M U R )
Sludge C ake for D isposal
B el t Press
E ff luent
R aw W astewater(Inf luent)
G rease T rap
B iogas
C lari f i er
R ecycle W ater to M U R
E xcess Sludge
E qual i zing B asin
N aO HH C l
M L SS
R eturn Sludge
Settler Settler
F L A R E
Jet Pod A erator
H oldingTank
Figure A.8 Flow chart of Pepsi WWTP

82
Figure A.9 Flow chart of MBK WWTP
HOTEL
Office Tower Food Center
Tokyo 2 MBK Center
Sump 1,2,3
3 Automatic Fine Screen
Equalizing
Dissolved Air Flotation Tank
Transfer Sump
Deep Shaft Aeration Tank
Screw
To Garbage Bin
Degasser Tank
Gravity Thicker
Decanter
Sludge Cake to Truck
Clarifier Tank
Pre-Effluent Disc Filter
UV
Effluent Tank
To Public
Sand Filter
Recycle Water Tank
To Cooling Tower
To Cleaning
To Toilet
To Plants
RECYCLE WATER
Garbage
ClO2 Disinfection
SLUDGE REMOVAL SYSTEM
Primary Sludge & Grease & Settled Grit
Return Sludge
Polymer
Air Compressor
Air Compressor
OIL AND GREASE SEPERATION SYSTEMS
Raw
Waste Water
Excess Sludge
Treated Water

83
Figure A.10 Picture of lab-scale reactors MBR3 and MBR4
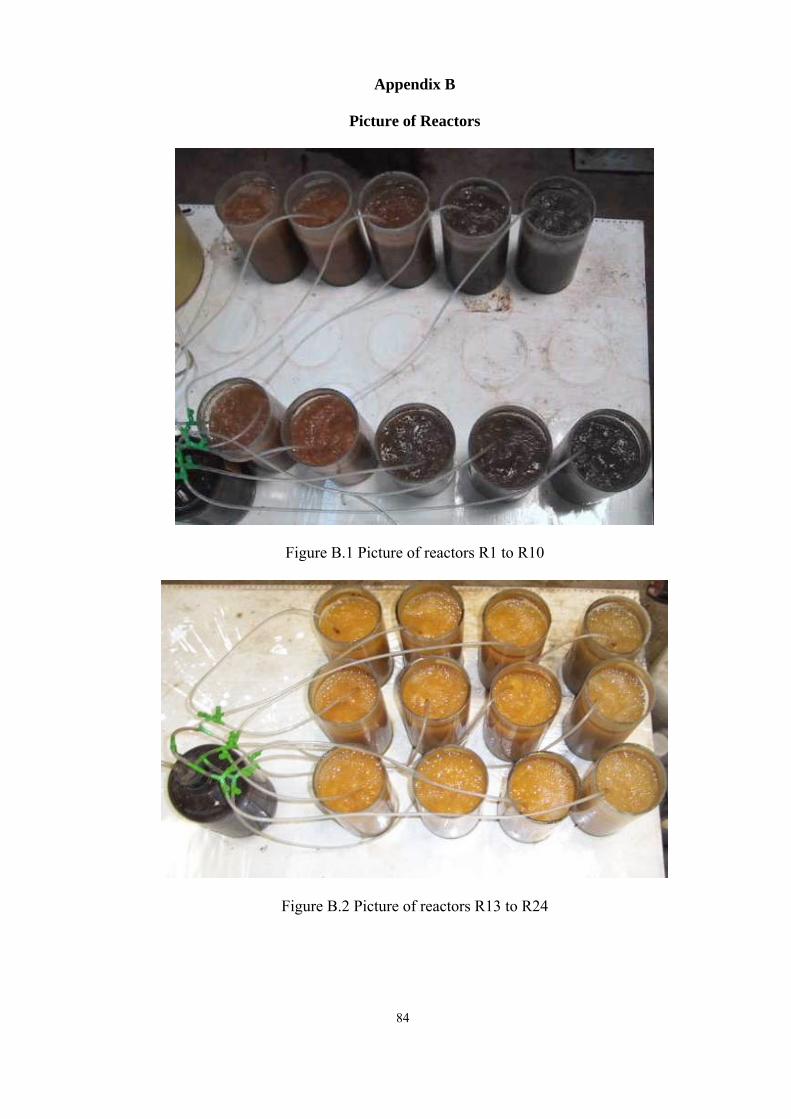
84
Appendix B
Picture of Reactors
Figure B.1 Picture of reactors R1 to R10
Figure B.2 Picture of reactors R13 to R24

85
Figure B.3 Picture of reactors R1 to 5 and R16 to R18 (COD:P = 100:0.5; COD:N = 100:1; 100:2; 100:3; 100:5; 100:7; 100:10; 100:12; 100:15)
Figure B.4 Picture of reactors R6 to R10 and R19 to R21 (COD:P = 100:1; COD:N = 100:1; 100:2; 100:3; 100:5; 100:7; 100:10; 100:12; 100:15)

86
Figure B.5 Picture of reactors R11 and R22 to R24 (COD:P = 100:2; COD:N = 100:3; 100:10; 100:12; 100:15)

87
Figure B.6 Picture of reactors R3; 8; 11; 12 and R13; 14; 15 (COD:N= 100:3; COD:P = 100:0.5; 100:1; 100:2; 100:3; 100:5; 100:7; 100:10)

88

89

90

91
Appendix C
Experimental Date of Acclimation
Table C.1 Acclimation of mixed bacteria sludge at nutrient ratio of COD:N:P of 100:0:0 and 100:3:0
Time R1 R12
COD inf COD eff COD remove MLSS COD inf COD eff COD remove MLSS25 942.7 325.4 65.5 3080 856.3 45.0 94.7 3800 27 944.7 329.5 65.1 3220 858.3 56.0 93.5 5480 29 946.8 333.6 64.8 3150 808.0 56.0 93.1 5540 31 896.0 232.0 74.1 3140 856.3 45.0 94.7 3800
Table C.2 Acclimation of mixed bacteria sludge at nutrient ratio of COD:N:P of 100:1:0.5 and
100:2:0.5
Time R2 R3 CODinf CODefl COD remove MLSS CODinf CODefl COD remove MLSS1 818 86 89 811 71 91 3 804 57 93 6800 807 64 92 72405 810 69.5 91 803 56.8 93 7 813 76 91 6440 805 60 93 68609 807 64.6 92 797 43.1 95 11 801 52 94 798 46.5 94 13 783 15.5 98 5360 808 66.9 92 656015 816 82.6 90 810 70 91 17 870 190.5 78 5560 813 76.2 91 594019 813 75 91 803 56 93 21 801 51.2 94 799 48 94 23 798 45 94 795 39.1 95 25 793 35.5 96 796 42 95 570027 801 51 94 5040 796 41 95 29 798 46 94 793 35 96 31 793 35 96 4910 794 37 95 5420
Mean 797 44 94 4975 794 38 95 5420

92
Table C.3 Acclimation of mixed bacteria sludge at nutrient ratio of COD:N:P of 100:3:0.5 and 100:5:0.5
Time R4 R5
CODinf CODefl COD remove MLSS CODinf CODefl COD remove MLSS1 831 112 87 803 56.0 93 3 818 86.0 89 7260 796 42.0 95 6820 5 822 94.7 88 803 56.8 93 7 801 52.0 94 820 90.0 89 6760 9 789 27.7 96 7120 790 30.8 96 11 791 31.0 96 787 23.2 97 13 797 43.3 95 6760 785 19.7 97 6960 15 804 57.0 93 802 54.0 93 17 825 99.0 88 6560 790 30.5 96 6220 19 813 75.0 91 786 22.0 97 21 797 44.8 94 789 28.8 96 23 798 46.0 94 790 30.0 96 25 795 39.1 95 6100 795 39.1 95 6520 27 796 41.0 95 791 32.0 96 29 794 37.0 95 790 29.0 96 31 798 45.0 94 5460 793 36.0 95 6420
Mean 796 41.0 95 5460 791 32.0 96 6420 Table C.4 Acclimation of mixed bacteria sludge at nutrient ratio of COD:N:P of 100:7:0.5 and
100:1:1
Time R6 R7 CODinf CODefl COD remove MLSS CODinf CODefl COD remove MLSS 1 801 52.0 94 811 71.0 91 3 815 79.0 90 7300 854 157.9 82 7000 5 803 56.8 93 838 126.0 85 7 801 51.0 94 6920 801 51.0 94 6880 9 793 36.9 95 807 64.6 92 11 787 23.2 97 813 75.0 91 13 785 19.7 97 6540 804 58.1 93 5980 15 787 23.0 97 818 86.6 89 17 806 61.0 92 5900 803 56.0 93 5900 19 790 29.0 96 817 83.8 90 21 791 32.0 96 879 208.0 76 23 793 35.0 96 806 62.0 92 25 796 42.7 95 6460 795 39.1 95 5700 27 788 26.0 97 796 42.0 95 29 794 37.0 95 793 35.0 96 31 793 36.0 95 6580 798 46.0 94 5700
Mean 792 33.0 96 6580 796 41.0 95 5700

93
Table C.5 Acclimation of mixed bacteria sludge at nutrient ratio of COD:N:P of 100:2:1 and 100:3:1
Time R8 R9
CODinf CODefl COD remove MLSS CODinf CODefl COD remove MLSS 1 798 45.0 94 7360 825 100.0 88 6800 3 816 81.0 90 829 107.4 87 5 800 50.0 94 6760 801 52.0 94 6280 7 801 51.0 94 813 75.0 91 5800 9 803 55.4 93 789 27.7 96 11 806 62.0 92 790 30.0 96 13 806 61.9 92 783 15.5 98 15 816 82.6 90 5740 789 27.5 97 6500 17 796 41.0 95 786 21.0 97 19 815 80.0 90 5980 786 22.9 97 6200 21 793 35.2 96 789 28.8 96 23 793 35.0 96 789 27.0 97 25 796 42.7 95 5560 800 49.8 94 6600 27 795 39.0 95 791 32.0 96 29 796 41.0 95 790 29.0 96 31 793 35.0 96 5540 793 35.0 96 6380
Mean 794 38.0 95 5540 791 32.0 96 6380 Table C.6 Acclimation of mixed bacteria sludge at nutrient ratio of COD:N:P of 100:5:1 and
100:7:1
Time R10 R11 CODinf CODefl COD remove MLSS CODinf CODefl COD remove MLSS1 793 35.0 96 7020 795 40 95 7060 3 791 31.6 96 791 31.6 96 5 790 29.0 96 6220 798 45 94 6380 7 786 21.0 97 791 32 96 9 786 21.5 97 792 33.8 96 11 790 30.0 96 798 45 94 13 790 31.0 96 777 3.9 100 15 797 43.3 95 6720 787 23.6 97 6780 17 793 36.0 95 787 23 97 19 790 30.5 96 6500 802 53.3 93 21 796 41.6 95 789 28.8 96 23 793 35.0 96 795 39 95 25 800 49.8 94 6920 795 39.1 95 5940 27 796 42.0 95 790 29 96 29 793 36.0 95 791 31 96 31 796 41.0 95 6160 793 35 96 6420
Mean 795 40.0 95 6160 791 32 96 6420

94
Table C.7 Acclimation of mixed bacteria sludge at nutrient ratio of COD:N:P of 100:3:2 and 100:3:3.
Time R13 R14
CODinf CODefl COD remove MLSS CODinf CODefl COD remove MLSS1 803 56 93 7250 796 42 95 7200 3 796 41.0 95 803 55.0 93 5 823 95 88 796 42 95 7 801 51 94 7190 813 75 91 7120 9 800 49.2 94 803 55.4 93 11 796 41 95 796 42 95 13 821 92.9 89 802 54.2 93 15 801 51.1 94 7100 795 39.3 95 7080 17 801 52 94 798 45 94 19 800 49.5 94 6460 790 30.5 96 6540 21 809 67.2 92 793 35.2 96 23 796 41 95 791 32 96 25 797 43 95 795 39 95 27 796 42.7 95 6840 793 35.6 96 6560 29 796 41 95 793 36 95 31 793 36 95 6080 791 31 96 6550
Mean 795 40 95 6460 792 34 96 6555 Table C.8 Acclimation of mixed bacteria sludge at nutrient ratio of COD:N:P of 100:3:5 and
100:3:7.
Time R15 R16 CODinf CODefl COD remove MLSS CODinf CODefl COD remove MLSS1 790 29 96 6400 798 45 94 65003 795 39 95 786 21 97 5 789 28 96 6460 803 56 93 65607 798 45 94 787 23 97 9 791 31 96 790 30 96 11 792 34 96 6520 788 26 97 671013 788 26 97 788 26 97 15 789 28 96 6760 786 22 97 686017 816 81 90 788 26 97 19 794 37 95 787 24 97 21 793 36 95 6780 790 30 96 679023 791 32 96 793 36 95 25 791 31 96 778 6 99 27 798 46 94 792 34 96 29 798 46 94 6780 792 33 96 6730
Mean 796 41 95 6780 787 24 97 6730

95
Table C.9 Acclimation of mixed bacteria sludge at nutrient ratio of COD:N:P of 100:3:10 and 100:10:0.5.
Time R17 R18
CODinf CODefl COD remove MLSS CODinf CODefl COD remove MLSS1 788 25 97 7400 812 74 91 74003 814 78 90 801 52 94 5 788 25 97 7420 820 89 89 73007 791 31 96 813 75 91 9 790 29 96 807 63 92 11 793 36 95 7250 803 56 93 725013 788 26 97 806 62 92 15 795 40 95 7140 813 75 91 702017 788 26 97 808 65 92 19 793 35 96 807 63 92 21 789 28 96 6900 806 61 92 670023 790 29 96 806 62 92 25 785 19 98 808 65 92 27 794 37 95 807 64 92 29 790 30 96 6430 806 61 92 6550
Mean 789 29 96 6430 807 63 92 6550 Table C.10 Acclimation of mixed bacteria sludge at nutrient ratio of COD:N:P of 100:12:0.5
and 100:15:0.5.
Time R19 R20 CODinf CODefl COD remove MLSS CODinf CODefl COD remove MLSS1 803 56 93 7000 808 65 92 7350 3 801 52 94 815 79 90 5 810 69 91 7200 804 58 93 7300 7 814 78 90 811 72 91 9 803 55 93 807 64 92 11 811 71 91 7520 806 61 92 7290 13 808 65 92 806 62 92 15 806 62 92 7660 810 69 91 7180 17 813 75 91 817 84 90 19 808 65 92 803 56 93 21 803 56 93 806 61 92 23 806 62 92 7800 808 65 92 7100 25 808 65 92 803 56 93 27 809 67 92 807 64 92 29 807 64 92 7900 804 58 93 7080
Mean 808 65 92 7900 805 59 93 7080

96
Table C.11 Acclimation of mixed bacteria sludge at nutrient ratio of COD:N:P of 100:10:1 and 100:12:1.
Time R21 R22
CODinf CODefl COD remove MLSS CODinf CODefl COD remove MLSS1 803 56 93 7400 820 89 89 75003 793 35 96 805 59 93 5 793 36 95 7420 821 92 89 76407 800 49 94 804 57 93 9 814 78 90 806 62 92 11 794 37 95 814 78 90 13 791 32 96 816 81 90 15 881 212 76 6820 814 78 90 692017 811 71 91 821 91 89 19 813 75 91 813 75 91 21 809 68 92 811 72 91 23 811 71 91 6900 811 71 91 690025 807 63 92 806 62 92 27 806 61 92 812 73 91 29 801 52 94 7280 810 70 91 6800
Mean 804 59 93 7280 809 68 92 6800
Table C.12 Acclimation of mixed bacteria sludge at nutrient ratio of COD:N:P of 100:15:1 and 100:10:2.
Time R23 R24
CODinf CODefl COD remove MLSS CODinf CODefl COD remove MLSS1 813 75 91 7700 798 45 94 63003 803 56 93 815 79 90 5 820 89 89 7720 818 85 90 64207 801 51 94 803 56 93 9 811 71 91 7520 804 58 93 11 815 79 90 806 61 92 13 816 81 90 808 65 92 15 798 45 94 7360 806 62 92 674017 814 78 90 814 78 90 19 801 51 94 804 57 93 21 803 55 93 804 58 93 23 804 58 93 7352 801 52 94 690025 803 56 93 806 62 92 27 806 61 92 806 61 92 29 804 58 93 7300 804 58 93 7280
Mean 804 58 93 7300 805 60 93 7280

97
Table C.13 Acclimation of mixed bacteria sludge at nutrient ratio of COD:N:P of 100:12:2 and 100:15:2.
Time R25 R26
CODinf CODefl COD remove MLSS CODinf CODefl COD remove MLSS1 805 59 93 810 69 91 75003 801 52 94 820 89 89 5 811 71 91 7000 811 72 91 75407 801 51 94 806 61 92 9 809 68 92 804 58 93 11 812 74 91 801 52 94 13 821 91 89 814 78 90 15 798 45 94 7080 798 45 94 642017 817 84 90 811 71 91 19 798 45 94 809 68 92 21 801 52 94 806 62 92 23 798 45 94 817 84 90 690025 789 28 96 802 53 93 27 795 40 95 803 55 93 29 810 70 91 8500 807 64 92 7840
Mean 798 46 94 8500 804 57 93 7840Mean value is taken from at least three batchs when reactors getting steady state