effect of lwds on stream hydraulics - usda
TRANSCRIPT

From Proceedings of the conference on Wetland Engineering and River Restoration, Reno, Nevada, August 27-31, 2001. Published on CD-ROM by the American Society of Civil Engineers, Reston, VA.
Effect of Large Woody Debris Structures on Stream Hydraulics
F. Douglas Shields, Jr., Member, ASCE, N. Morin and R. A. Kuhnle, Member, ASCE
Research Hydraulic Engineer, Research Assistant, and Research Hydraulic Engineer, respectively, USDA-ARS-National Sedimentation Laboratory, P.O. Box 1157, Oxford, MS 38655-1157
PH (662) 232 2919; FAX (662) 232 2915; email: [email protected]
Abstract
Large woody debris structures hold promise as cost-effective stream corridor rehabilitation measures. Effectiveness of these structures placed in incised, rapidly eroding, sand-bed channels is governed by the effects of the structures on the velocity field at the toe of eroding banks. Effects of recently placed large woody debris structures were examined using depth and depth-averaged velocity data collected using self-contained acoustic Doppler/pressure transducer data loggers. Six of these instruments were placed along two cross-sectional transects at the apex of a sharp meander bend in Little Topashaw Creek, Mississippi. Simultaneous records of runoff events before and after placement of large woody debris structures along the outside of the bend showed that the debris structures were effective in reducing mean storm event velocities from about 150% of channel centerline velocities to levels between 3% and 45% of centerline velocities. The region protected by the structure experienced moderate deposition (<0.4 m) during the first high flow season following construction. A series of laboratory flume tests were run to assess accuracy of the acoustic Doppler/pressure transducer instruments, which were found to produce depth records within 5% of manual measurements and velocity measurements within 5% of depth-averaged velocities determined by numerically integrating point velocities measured using a laboratory acoustic Doppler velocimeter.
Introduction
Stabilization of incising channels and their stream corridors can have major, positive ecological effects, particularly when the structures and methods used are designed to address habitat-limiting factors. Current practice for stabilizing watersheds destabilized by channel incision is based on combinations of grade control drop structures, in-channel stone structures, drop pipes, small reservoirs (floodwater retarding structures), and land treatment. Costs for treating an entire watershed range as high as $750 ha-1 and costs for channel stabilization as high as $300 m-1. In constrast, stabilization of a channel using large woody debris structures may be done for about $80 m-1. In addition to economic factors, woody debris addition addresses key ecological impairments of incised, sandbed systems (Warren et al. In press, Shields et al. 1994, 1995). Studies of degraded sand bed streams in the Southeastern U. S. have shown that habitat diversity (Shields and Smith 1992), invertebrate species richness and abundance (Cooper and Testa 1999), and fish species richness (Shields et al. 1998a) are associated in a positive fashion with large woody debris density.
Use of woody debris for stabilization and habitat rehabilitation in coarse-bedded streams of the Pacific Northwest has been described by others (Abbe et al. 1997, Hildebrand et al. 1998). In incised sand bed streams, use of debris structures is limited to reaches in advanced stages of channel evolution (Simon 1989) where erosion has progressed to the point that the channel is no

2
longer competent to transport the entire bed material load derived from upstream reaches. Large woody debris structures are placed to focus and accelerate formation of berms at the toe of eroding banks and colonization of these deposits by woody vegetation. Properly constructed structures will trap and retain sediments originating from upstream or from mass wasting of adjacent banks and retain enough of these materials to prevent basal cleanout and renewed mass wasting. In addition, regions of reduced velocity within the woody debris matrix will trap and retain particulate organic matter and provide refugia during high flow events for aquatic organisms. The debris itself will provide extremely valuable macroinvertebrate substrate (Wallace and Benke 1984).
Methods-laboratory
High flow events in many small (watershed area < 500 km2), incised sand bed channels tend to be of short duration, with flow conditions that are too deep to wade yet difficult to navigate. Therefore, a self-contained, incoherent, acoustic Doppler velocity logger was selected for field measurements (Starflow Model 6526B, Unidata America, Anonymous 1998). The device (field ADV or FADV) computes Doppler shifts resulting from targets (suspended particles) anywhere in the water column intercepted by the sound beam, which is propagated at an angle of 30o with the horizontal for about 2 s during each sampling period. The sampling period duration may be varied from 5 s upward (“scan rate”). The sampled volume is a cone with a spread angle of 10o (5o on each side of the centerline). The field of view of the instrument is limited to about 2 m in clear water, and less in flows containing significant suspended sediment loads. Since the beam is propagated at an angle of 30 o with the horizontal, the vertical range of the instrument is less than 1 m, and velocities recorded by the instruments during higher flows represent near-bed conditions. Up to 200 velocity measurements are accumulated during each 2 s period, and the median of these values is assumed to be the flow velocity. Software sold with the FADV allows computation of summary statistics based on these median values over intervals of preset duration (“log interval”) prior to storage by the data logger. The FADV also measures and logs water temperature and flow depth. Flow depth is measured using a pressure transducer. Some of the technical specifications provided by the FADV vendor are reproduced in Table 1.
Flume studies reported by Vermeyen (2000) indicated that the FADV used here produced velocity readings that were an average of 24% higher than the cross-sectional average for flows ranging in depth from 0.46 to 0.80 m and mean velocities ranging from 0.29 to 0.40 m s-1. In a related report, Vermeyen noted similar errors for the FADV relative to velocity profiles collected using a laboratory ADV. Towing tank tests by the vendor and others (Laenen 1997) resulted in much lower errors. We conducted additional flume tests to explore the possible relationship between the velocities logged by the FADV and flow depth, and to determine the accuracy of the instrument at depths less than those reported by Vermeyen (2000). All experiments were conducted at the U.S. Department of Agriculture National Sedimentation Laboratory. The flume used was 15.2 m long, 0.356 m wide, and 0.457 m deep. The slope of the channel was adjustable to maintain uniform flow. Flow discharge was measured using a calibrated Venturi meter in the 0.15 m diameter return pipe. Flume water was seeded with neutrally buoyant hollow glass spheres to insure that the concentration of acoustic scatterers would not limit instrument performance. Velocity profiles were measured using a Nortek acoustic Doppler velocimeter (lab ADV or LADV) with a two-dimensional probe located midway between the flume endpoints.

3
LADV data were collected at 50 Hz at a cylindrical measurement volume with 6 mm diameter and 6 mm in height. The range, resolution, and accuracy of the LADV were 0.001 to 2.5 m s-1, 0.0001 m s-1, and 0.0025 m s-1, respectively.
For a series of 5 flow depths ranging from 0.385 to 0.054 m, the LADV was used to obtain vertical velocity profiles by collecting data for two minutes at each of up to 6 well-spaced depths. The FADV was mounted on a metal plate on the bed of the flume 0.79 m downstream from the LADV measurement volume. The FADV logger was programmed to record depth, velocity, and temperature during the period when the LADV velocity profile measurements were collected. The FADV scan rate and log interval were set at 5 s for all experiments. Temporal averages of the LADV point measurements were used to produce a vertical velocity profile, which was numerically integrated to obtain a mean flow velocity. FADV and LADV temporal mean velocities were compared with those obtained by dividing the flow rate from the Venturi meter by the product of flume width and flow depth. Temporal means of water temperature and flow depths recorded by the FADV were compared with similar data obtained using a mercury thermometer and a metal measuring tape, respectively. Experiments were repeated three times using a different FADV (Serial numbers 1510, 2215, and 1696) each time. The first two devices were Model 6526-51, while the third device was Model 6526-21. The two models differ only in the range of the depth transducer (Table 1).
Table 1. Technical specifications for Model 6526B Starflow Ultrasonic Doppler Instrument
Property Measurement
Technique Range Resolution Accuracy
Depth
Hydrostatic pressure
transducer vented to
atmosphere
Two models available: Model 6526-21 0 to 2 m
Model 6526-51 0 to 5 m
0 to 1 m 1mm 1 to 2 m 2mm
0 to 2.5 m 2.5 mm 2.5 to 5 m 5 mm
+0.25% of calibrated
lower range
Velocity
Incoherent (continuous)
Doppler shift.
0.021 to 4.5 m s-1, bi-directional
Not given 2% of
measured velocity
Temperature Not given -17o C to 60o C 0.1 o C Not given
Methods-field
A project demonstrating use of large woody debris structures for incised stream corridor rehabilitation was designed and constructed in 2000. The study site was a 2-km reach of Little Topashaw Creek, a fourth-order stream in the Yalobusha River watershed in north central Mississippi. Contributing drainage area was about 37 km2, and bed slope was about 0.002. Floodplain stratigraphy was characterized by dispersive silt and clay soils underlain by sand and strata of consolidated cohesive material, respectively (Adams 2000). The sandy deposits were often found along the bank toe. The channel had an average sinuosity of 2.1, an average width of about 35 m, and an average depth of 6 m. Channel bed materials were comprised primarily of sand with median sizes between 0.2 and 0.3 mm. Available evidence suggests mean width had increased by a factor of 4 to 5 since 1955. In general, concave banks on the outside of meander

4
bends were failing by mass wasting subject to basal endpoint control, and sand was accreting on large point bars opposite failing banks. Design of the large woody debris structures has been described elsewhere (Shields et al. 2000 and 2001).
About 1.5 km of eroding banks were selected for protection. Woody debris structures were constructed using either debris (~10%) or living trees (~90%) harvested from designated areas including the channel. Harvest areas were primarily zones such as fencerows and ditches that landowners wanted cleared for cultivation. No clearing was permitted within 10 m of top bank. Living trees were larger than 0.2 m diameter at breast height. Living trees were harvested by grubbing in order to retain intact root balls and crowns. The finished project consisted of 72 structures built with about 1,168 trees, and these were obtained by clearing about 3.4 ha. An average of 16 trees or logs were used per structure (min = 6, max = 30).
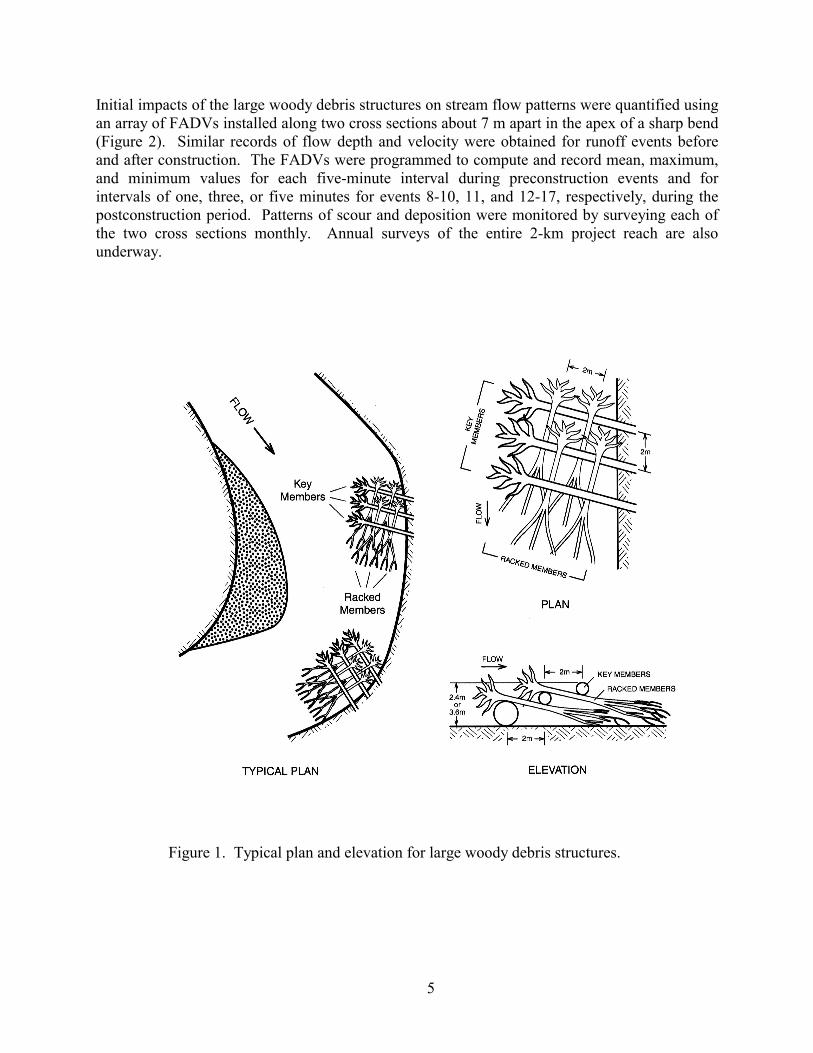
Structures were built by stacking trees as shown in Figure 1. Members running across the flow direction were ~9 m long and were keyed into the bank toes (buried in trenches excavated in banks) when bank slopes were gradual enough to permit key trench excavation. Crest elevations were specified as either 2.4 m or 3.6 m above the adjacent streambed based on eroding bank height and channel alignment, but constructed LWDS were slightly lower, ranging from 1.1 to 3.2 m high. Structures were spaced to create nonuniformity, which is valuable for physical habitat recovery (Shields et al. 1998b), but aligned to enhance log stability and sediment deposition. Statistics for structure dimensions are presented in Table 2.
Table 2. As-built dimensions for 72 large woody debris structures constructed along Little Topashaw Creek, Mississippi. Statistics for structures based on measurement of all 72
structures. Statistics for individual members are based on measurement of the members within 12 representative structures.
Quantity Mean + Standard Deviation Crest Elevation, m 2.1 + 0.5
Length of structure, m 13.9 + 3.9 Width of structure, m 5.3 + 1.9
Distance between structures, m 13.0 + 10.8 Number of key members 4.4 + 1.0
Diameter of key members, m 0.45 + 0.14 Number of racked members 14.7 + 6.5
Length of racked members, m 9.2 + 3.6 Diameter of racked members, m 0.26 + 0.10
About 52% of the logs used had intact rootwads, with about 30% of the rootwads retaining a ball of soil. About two-thirds of the key members were actually buried in the bank. Earth anchors were cabled to 58 (80%) of the completed structures. About one structure was constructed to protect each 25 m of channel, which represented an order of magnitude increase in woody debris loading. About 4,000 willow (Salix nigra) cuttings were planted on point bars and in sediment deposits adjacent to selected LWDS using a water-jetting technique (Drake and Langel 1998).
5
Initial impacts of the large woody debris structures on stream flow patterns were quantified using an array of FADVs installed along two cross sections about 7 m apart in the apex of a sharp bend (Figure 2). Similar records of flow depth and velocity were obtained for runoff events before and after construction. The FADVs were programmed to compute and record mean, maximum, and minimum values for each five-minute interval during preconstruction events and for intervals of one, three, or five minutes for events 8-10, 11, and 12-17, respectively, during the postconstruction period. Patterns of scour and deposition were monitored by surveying each of the two cross sections monthly. Annual surveys of the entire 2-km project reach are also underway.
Figure 1. Typical plan and elevation for large woody debris structures.

6
Results-laboratory
Mean depths recorded by the FADV differed from manual readings by less than 10 mm (–5 to +3%) (Table 3), which was slightly more than the manufacturer’s specified error of +- 6.25 mm (0.25% of 2.5 m, Table 1). No difference in accuracy between the two FADV models tested was observed. Temporal mean velocities recorded by the FADV were 19% to 27% higher than the cross-sectional mean velocity computed by dividing flume discharge by the product of flow depth and flume width (Table 4). Although the user’s manual states that the FADV can measure velocities > 0.021 m s-1 in depths as low as 0.025 m (Anonymous 1998), no FADV velocity data were obtained for the final run, when flow depth was 0.054 m. Temporal mean velocities logged by the FADV were always within 5% of the depth-integrated mean velocity determined by numerically integrating profiles of the temporal mean of the x-component of velocity recorded by the LADV (Table 4). FADV mean velocities were between –5% and +1% different from LADV means, and errors averaged –2% for all tests. No systematic variation of error with depth was noted. Mean water temperature for all tests was about 25o C. Temporal means of water temperatures logged by the FADV were 1% to 6% higher than values measured using a mercury thermometer. The manufacturer suggested that this was the result of a “self-heating” effect associated with the high scan rate (5 s).
Results-field
FADV data indicated that woody debris structures created conditions conducive to deposition adjacent to the bank toe and within the LWD matrix. Near-bed flow velocities were reduced due to the presence of the structures. Measurements by others indicate that highest depth-averaged velocities in bends occur on the outside of the bend immediately downstream from the bend apex (e.g., USACE 1991, plate B-35). However, following placement of woody debris structures, maximum velocities were displaced away from the bank toe (Figure 3), thus preventing transport of failure blocks of cohesive soil and other sediments from the toe zone (Simon et al. 2000), and scouring deeper pool habitat at the streamward margin of the structure (Gough 1991). Simultaneous records of velocity adjacent to the concave bank toe and at the channel centerline during 10 events prior to construction and 21 events following construction showed that velocities at the bank toe prior to construction were 1.5 times as great as those at the channel centerline, but only 0.03 to 0.45 times the centerline velocity following construction (Figure 4). Mean near-bed velocities within the region covered by the LWDS were < 0.26 m s-1 while means of simultaneous measurements of velocities at adjacent points outside the debris structure ranged from 0.35 to 1.18 m s-1. We estimate that critical near-bed velocity for the median bed material size is ~ 0.15 m s-1 (Vanoni 1975), and much higher for failure blocks (Simon et al. 2000). Average deposition for the protected regions of the instrumented cross sections (Figure 2) fluctuated during the period of observation, but totaled about 0.4 m for cross section 1, which was located under the higher, upstream portion of the woody debris structure (Figure 5). About 0.2 m of scour occurred within the protected portion of cross section 2 reflecting formation of a small pool.

7
Table 3. Flow Depths in m from Flume Tests. FADV Depths Are Temporal Means.
Run Manual measurement
FADV No. 1510
FADV No. 2215
FADV No. 1696
1 0.385 0.395 0.391 0.376 2 0.298 0.307 0.292 0.294 3 0.225 0.221 0.224 0.219 4 0.133 0.133 0.126 0.133 5 0.054 0.056 0.052 0.047
Table 4. Mean Flow Velocities in m s-1 from Flume Tests
Run Mean Flow Velocity, Q/A
Mean Flow Velocity, LADV
FADV No. 1510
FADV No. 2215
FADV No. 1696
1 0.348 0.425 0.421 0.414 0.415 2 0.371 0.457 0.460 0.451 0.458 3 0.420 0.527 0.522 0.514 0.501 4 0.436 0.564 0.552 0.550 0.552 5 0.333 0.323 No data No data No data
Discussion
Our flume tests yielded similar results to those reported by Vermeyen (2000) except for the error in depth-averaged velocity measurement (Table 5). The FADV recorded velocities that were very similar to those obtained by vertically integrating the point velocities measured using a laboratory ADV. Vermeyen (2000) found that the FADV velocities were 20% to 47% higher than average velocities measured by a laboratory ADV in a flume larger than ours. We cannot account for this difference.
Conclusions
The incoherent acoustic Doppler velocimeters we tested may be used to remotely record depths and velocities at sites similar to ours. However, effects of suspended sediment and flow depths > 0.4 m were not examined. Large woody debris structures hold considerable potential as low-cost measures for rehabilitating small (drainage area <500 km2) sand-bed streams damaged by channel incision. The structures described herein were effective in reducing current velocities at the concave bank toe, which is critical for stabilizing streambanks experiencing bank failure by mass wasting, typical of incised channels.

8
Table 5. Comparison of FADV Laboratory Tests
Quantity/source Manufacturer’s specifications
This study Vermeyen (2000) Laenen (1997)
Type of test flume flume towing tank
Error in depth +6 mm + 10 mm +9 mm Not tested
width/depth ratio Not applicable 1.1 to 6.7 1.0 to 5.6 N/A
Range of mean velocity, m s-1
0.021 to 4.5 0.348 to 0.436 0.287 to 0.399 0.061 to 0.914
Error in depth-averaged velocity
+ 2% -5% to +1% +20% to +47% Not applicable
Error compared to cross-sectional mean velocity
(Q/A)
Site specific +19% to +27% +18% to +32% -0.4% to +0.9%
Error in temperature
Not given 0.3 to 1.3 oC > mercury
thermometer readings
2 oC > a more sophisticated
acoustic device subjected to
parallel testing
Not reported
Acknowledgments
Construction of the Little Topashaw Creek Stream Corridor Rehabilitation Project is funded by the Demonstration Erosion Control Project, which is managed by Mr. Thomas Hengst of the Vicksburg District of the U.S. Army Corps of Engineers. The project engineer for the Corps is Mr. John Smith. Construction was supervised by the Mississippi District of the U.S. Department of Agriculture Natural Resources Conservation Service (NRCS). The project engineer for the NRCS is Mr. Steve Wilson. Assistance with field data collection by Terry Welch, Ashley McBride, and Jason Greer is gratefully acknowledged. John Cox provided assistance with flume experiments. Sean Bennett, Tracy Vermeyen, and Michael Merrick read an earlier version of this paper and made many helpful comments.
Disclaimer
The information contained in this paper regarding commercial products or companies may not be used for advertising or promotional purposes and is not to be construed as endorsement of any product or company by the authors or the U. S. Department of Agriculture.

9
Figure 2. Location of cross sections for monitoring depth and velocity at bend apex. Arrows show approximate location of FADVs. Shaded polygons are large woody
debris structures. Cross section 1 is upstream from cross section 2.
Figure 3. FADV velocity records at cross section 2 during flow event six months after construction.
-1000
0
1000
2000
18-Jan-01 19-Jan-01 20-Jan-01 21-Jan-01
Vel
ocit
y, m
m/s
inside debris structure outside LWDS

10
Figure 5. Average scour (-) or deposition (+) for bank protected by large woody debris along cross sections 1 and 2 shown in Figure 2. Scour and deposition were computed forsegments of cross section between top bank and approximate streamward margin of largewoody debris structure. Initial point (zero) represents conditions immediately following construction.
-0.20
0.00
0.20
0.40
0.60
0.80
1.00
1.20
1.40
0.00 0.50 1.00 1.50 2.00 2.50
Mean Flow Depth, m
Dep
th-a
vera
ged
velo
city
, m s
-1bank toe channel centerline
Figure 4. Means of simultaneous near-bed velocities recorded by FADVs within and adjacentto large woody debris structure. Locations for velocity sensors shown in Figure 2. Opensymbols are from runoff events prior to woody debris structure construction; solid symbolsare from postconstruction events; error bars are + one standard deviation.
-0.4
0.0
0.4
0.8
13-Jul-00 11-Sep-00 10-Nov-00 9-Jan-01 10-Mar-01 9-May-01
Mea
n sc
our
or d
epos
ition
on
prot
ecte
d ba
nk, m
Cross section 1 Cross section 2

11
References
Abbe, T. B., Montgomery, D. R., and Petroff, C. (1997). “Design of stable in-channel wood debris structures for bank protection and habitat restoration: An example from the Cowlitz River, WA.” In Wang, S.Y., Langendoen, E. and Shields, F. D. Jr., (eds.) Management of Landscapes Disturbed by Channel Incision, Stabilization, Rehabilitation, and Restoration, Center for Computational Hydroscience and Engineering, University of Mississippi, University, Mississippi, 809-815.
Adams, F. A. (2000). “Geologic investigation report: Yalobusha River Subwatershed, Little Topashaw Creek stream corridor rehabilitation, Chickasaw County, Mississippi.” U. S. Department of Agriculture, Natural Resources Conservation Service, Jackson, Mississippi.
Anonymous. (1998). “Unidata Starflow Ultrasonic Doppler instrument plus version 3 software user’s manual.” Manual 6241 Revision E. Lynn MacLaren Publishing, Willetton, Australia.
Cooper, C. M., and Testa, S. (1999). “Examination of revised rapid bioassessment protocols in a watershed disturbed by channel incision.” Bulletin of the North American Benthological Society, 16(1), 198.
Drake, L. and Langel, R. (1998). “Deep-Planting willow cuttings via water jetting.” In D. F. Hayes (ed.), Engineering Approaches to Ecosystem Restoration, Proceedings of the 1998 Wetlands Engineering and River Restoration Conference, American Society of Civil Engineers, New York, Published on CD-ROM.
Gough, S. (1991). “Stream fish habitat response to restoration using tree revetments.” In R. Sauer, (ed.), Proceedings of the Symposium on Restoration of Midwestern Streams, 52nd Midwest Fish and Wildlife Conference: North-Central Division of the American Fisheries Society, 45-55.
Hilderbrand, R. H., Lemly, D. A., Dolloff, A. C., and Harpster, K. L. (1998). “Design considerations for large woody debris placement in stream enhancement projects.” North American Journal of Fisheries Management, 18, 161-167.
Laenen, A. (1997). “Information of low-cost doppler for in situ measurement,” U. S. Geological Survey, Stennis Space Center, Miss., USGS WRD Instrument News 79, 2-3.
Shields, F. D. Jr., and Smith, R. H. (1992). “Effects of large woody debris removal on physical characteristics of a sand-bed river.” Aquatic Conservation: Marine and Freshwater Ecosystems, 2, 145-63.
Shields, F. D., Jr. Knight, S. S., and Cooper, C. M. (1994). “Effects of channel incision on base flow stream habitats and fishes.” Environmental Management, 18(1), 43-57.
Shields, F. D., Jr., Knight, S. S., and Cooper, C. M. (1995). “Use of the index of biotic integrity to assess physical habitat degradation in warmwater streams.” Hydrobiologia 312(3), 191-208.
Shields, F. D. Jr., Knight, S. S., and Cooper, C. M. (1998a). “Rehabilitation of aquatic habitats in warmwater streams damaged by channel incision in Mississippi.” Hydrobiologia, 382, 63-86.

12
Shields, F. D. Jr., Knight, S. S., and Cooper, C. M. (1998b). “Addition of spurs to stone toe protection for warmwater fish habitat rehabilitation.” Journal of the American Water Resources Association, 34(6), 1427-1436.
Shields, F. D., Jr., Knight, S. S., Cooper, C. M. and Testa, S. III. (2000). “Large woody debris structures for incised channel rehabilitation.” In R. H. Hotchkiss and M. Glade (eds.) Building Partnerships Proceedings of the Joint Conference on Water Resources Engineering and Water Resources Planning and Management, Environmental and Water Resources Institute of the American Society of Civil Engineers, Reston, VA. Published on CD-ROM.
Shields, F. D., Jr., Morin, N. and Cooper, C. M. (2001). “Design of large woody debris structures for channel rehabilitation.” In U. S. Subcommittee on Sedimentation. Proceedings of the Federal Interagency Sedimentation Conferences, 1947 to 2001, Seventh Conference Proceedings, CD-ROM, Washington, D. C.
Simon, A. (1989). “The discharge of sediment in channelized alluvial streams.” Water Resources Bulletin, American Water Resources Association, 25(6), 1177-1188.
Simon, A., Curini, A., Darby, S. E., and Langendoen, E. J. (2000). “Bank and near-bank processes in an incised channel.” Geomorphology, 35, 193-217.
U. S. Army Corps of Engineers. (1991). Hydraulic design of flood control channels. Engineer Manual 1110-2-1601, Washington, D.C.
Vanoni, V. A. (ed.). (1975). Sedimentation engineering, Manual no. 54, American Society of Civil Engineers, New York.
Vermeyen, T. B. (2000). “A laboratory evaluation of Unidata’s Starflow doppler flowmeter and MGD Technologies’ acoustic doppler flow meter.” In R. H. Hotchkiss and M. Glade (eds.) Building Partnerships Proceedings of the Joint Conference on Water Resources Engineering and Water Resources Planning and Management, Environmental and Water Resources Institute of the American Society of Civil Engineers, Reston, VA. Published on CD-ROM. Also see http://www.usbr.gov/wrrl/tvermeyen/starflow/.
Wallace, J. Bruce and Arthur C. Benke. (1984). Quantification of Wood Habitat in Subtropical Coastal Plain Streams. Canadian Journal of Fish and Aquatic Science, 41: 1643-1652.
Warren, M. L. Jr., Haag, W. R., and Adams, S. B. (In press). “Fish communities of lowland stream system: Forest linkages to diversity and abundance.” In M. M. Holland, J. A. Stanturf, and M. L. Warren, Jr. eds., Proceedings of sustainability of wetland and water resources, 2000 May 23-25, University of Mississippi, Oxford, USDA Forest Service, Gen. Tech. Report.