effect of inulin on the survival of lactic acid and ... of inulin on the survival of lactic acid and...
TRANSCRIPT
Effect of Inulin on the Survival of Lactic Acid and Probiotic Bacteria
in Ice Cream
By
Najah Boughida
A Research Paper Submitted in Partial Fulfillment of the
Requirements for the Master of Science Degree
In
Food & Nutritional Sciences
Approved: 2 Semester Credits
~ Naveen Chikthimniah, Ph.D.
The Graduate School
University of Wisconsin-Stout
May, 2011
2
The Graduate School
University of Wisconsin-Stout
Menomonie, WI
Author: Najah Boughida
Title: Effect of Inulin on the Survival of Lactic Acid and Probiotic Bacteria in
Ice Cream
Graduate Degree/ Major: MS Food and Nutritional Sciences
Research Adviser: Naveen Chikthimmah, Ph.D.
Month/Year: May, 2011
Number of Pages: 50
Style Manual Used: American Psychological Association, 6th
edition
Abstract
This study investigated the effect of inulin (0% control, 1.5% and 3.0% w/w) on the
survival of lactic acid (LAB) and probiotic bacteria in ice cream. A mixed culture of probiotic
bacteria was added into a standard formulation ice cream recipe at a level of 106 CFU/g prior to
freezing the mix using a Lolla Musso Pola 5030 freezer. Inulin levels were tested to determine
protective effects on bacterial survival. Ice cream samples were taken before and after freezing,
and during storage under steady-state (-20˚C) and repeated thaw-freeze conditions (-20˚C/-5˚C)
over 28-days to enumerate for bacterial survival. Yield stress test and viscosity analysis of ice
cream samples were conducted at the end of storage period.
LAB and probiotic bacteria had no significant decrease in populations during the storage
period. Addition of inulin to ice cream had no effect on bacterial survival at steady-state storage
(-20˚C) or during thaw-freeze cycles over 28-days. The freezing phase had no destructive effect
on bacterial populations. Difference in yield stress values between ice cream samples was not
3
statistically significant after 28-days storage period at (-20˚C). Addition of 3.0% inulin had a
significant effect on the viscosity of ice cream samples. Inulin, when used at 1.5% and 3.0% had
no significant effect (protective or destructive) on LAB and probiotic bacteria in ice cream.
4
Table of Contents
Abstract ........................................................................................................................................... 2
List of Tables .................................................................................................................................. 6
List of Figures ................................................................................................................................. 7
Chapter I: Introduction .................................................................................................................... 9
Statement of the Problem ............................................................................................................ 9
Purpose of the Study ................................................................................................................. 10
Importance of the Study ............................................................................................................ 10
Assumptions of the Study ......................................................................................................... 10
Objectives ................................................................................................................................. 11
Definition of Terms................................................................................................................... 11
Limitations ................................................................................................................................ 12
Chapter II: Literature Review ....................................................................................................... 14
Lactic Acid Bacteria (LAB) ...................................................................................................... 14
Survival of lactic acid bacteria in various food and dairy products. ................................... 16
Survival of lactic acid bacteria in ice cream. ....................................................................... 18
Inulin ......................................................................................................................................... 20
Chemistry. ............................................................................................................................. 21
Inulin as a fat replacer in food and frozen desserts.............................................................. 22
Effect of Freeze-Thaw Conditions on the Survival of Lactic Acid Bacteria ............................ 25
Effect of freeze-thaw on the survival of Lactobacillus sp. .................................................... 26
Use of inulin as a protective agent for the survival of lactic acid bacteria in food.............. 27
5
Chapter III: Methodology ............................................................................................................. 30
Culture Selection and Inoculation ............................................................................................. 30
Instrumentation and Ice Cream Preparation ............................................................................. 30
Live Culture Enumeration of Lactic Acid Bacteria .................................................................. 34
Yield Stress Test and Viscosity Analysis of Ice Cream ........................................................... 34
Data Analysis ............................................................................................................................ 35
Limitations ................................................................................................................................ 35
Chapter IV: Results and Discussion ............................................................................................. 38
Effect of Inulin on the Survival of Inoculated Bacteria in Ice Cream During the Initial
Freezing Phase (from Liquid Ice Cream Mix at 3.6˚C to Frozen Ice Cream at -10˚C) ............ 38
Effect of Inulin on the Survival of Inoculated Bacteria During Storage .................................. 39
Effect of inulin on the survival of inoculated bacteria during 28-days storage period at
steady-state conditions (-20˚C). ............................................................................................ 39
Effect of inulin on the survival of inoculated bacteria during 28-days storage period with
repeated thaw-freeze cycles (-20˚C/-5˚C). ............................................................................ 40
Effect of Inulin on the Textural Structure in Ice Cream ........................................................... 43
Chapter V: Conclusion .................................................................................................................. 46
Recommendations ..................................................................................................................... 47
References: .................................................................................................................................... 48
6
List of Tables
Table 1: Classification of Lactococcal bacteriophages by DNA/DNA hybridization .................. 17
Table 2: Inulin content in plants used for human consumption .................................................... 21
Table 3: Viable counts of L. acidophilus LA-5 and B. animalis Bb12 (mean ± SD, n = 3) in ice
cream during storage (log CFU/g). ................................................................................... 29
Table 4: Lolla Musso Pola 5030 ice cream maker characteristics ................................................ 31
Table 5: Ingredients formulation used in preparing ice cream mix treatments ............................ 32
Table 6: Surviving bacterial count (log CFU/g) for the varying levels of inulin concentrations
during 28-days storage period at (-20˚C) and repeated freeze-thaw conditions ............... 42
7
List of Figures
Figure 1: Effects of dilution, freezing, and storage of ice cream at -25°C on the levels of
Lactobacillus acidophilus, Bifidobacterium lactis, and the combined mixture of the two
probiotic microorganisms. ................................................................................................ 20
Figure 2: Chemical structure of inulin (n= number of fructosyl units) ........................................ 22
Figure 3: Consistency index of yog-ice cream mixes as determined using Brookfield Rheometer.
results derived from Power Law model (Pr = 0.91; means of triplicates ± SD). .............. 24
Figure 4: Meltdown characteristics of yog-ice cream expressed as percentage of yog-ice cream
melted over 60 min (values represent means of duplicates). ............................................ 25
Figure 5: Photo showing the formation of ice crystals in ice cream ............................................. 27
Figure 6: Lolla Musso Pola 5030 Ice Cream Maker ..................................................................... 33
Figure 7: Brookfield DV-III ULTRA Rheometer ......................................................................... 35
Figure 8: Serially diluted plates (left to right) of MRS agar showing lactic acid bacteria in ice
cream when stored at -20˚c for 28-days ............................................................................ 36
Figure 9: Flowchart for ice cream preparation ............................................................................. 37
Figure 10: Surviving bacterial counts (CFU/g) in ice cream mix with varying levels of inulin (0%
control, 1.5% and 3.0% w/w) during pre and post freezing phases (from liquid ice cream
mix at 3.6˚C to frozen ice cream at -10˚C) ....................................................................... 39
Figure 11: Surviving bacterial count (CFU/g) in ice cream with varying levels of inulin (0%
control, 1.5% and 3.0% w/w) during 28-days storage period at steady-state conditions (-
20˚C) ................................................................................................................................. 40
8
Figure 12: Surviving bacterial count (CFU/g) in ice cream with varying levels of inulin (0%
control, 1.5% and 3.0% w/w) during 28-days storage period with repeated thaw-freeze
cycles (-20˚C/-5˚C) ........................................................................................................... 41
Figure 13: Comparison of mean population levels of bacterial number (CFU/g) during the 28-
days storage period under repeated thaw-freeze cycles (-20˚C/-5˚C) versus steady-state
freezing conditions (-20˚C) ............................................................................................... 43
Figure 14: Stress-strain curves showing typical yield of ice cream formulated with three
variations of inulin concentrations (0% control, 1.5% and 3.0% w/w) and stored for 28-
days at steady-state conditions (-20˚C) ............................................................................. 44
Figure 15: Viscosity (cP) as function of time (s) in ice cream formulated with three variations of
inulin concentrations (0% control, 1.5% and 3.0% w/w) and stored for 28-days at steady-
state conditions (-20˚C)..................................................................................................... 45
9
Chapter I: Introduction
Inulin is a carbohydrate-based fat replacer widely used in many products in the food
industry including yogurt, ice cream and many types of salad dressings. In addition, recent
studies (Akalin & Erisir, 2008; Haynes & Playne, 2002) have indicated the ability of inulin to
increase the survival of probiotic bacteria in ice cream and yogurt. This observation is important
because clinical experiments (Dunne et al., 1999; O‟Sullivan, 2001) have documented the
positive effect of probiotic bacteria on gut health, modulating blood cholesterol, demonstrating
antitumor activities and enhancing immune response. With increased consumer awareness of the
importance of including probiotics in their daily diet, food manufacturers are responding by
introducing probiotics in commercially-sold packaged food.
Two microbial genera of bacterial origin are widely used as probiotics: Lactobacillus and
Bifidobacterium. By definition probiotics food products must contain a sufficient quantity of
live probiotics microorganisms (FAO, 2001). Health benefits acquired from consuming
probiotics food products are not only correlated to the type of therapeutic effects induced by the
probiotic bacteria, but also to their presence in sufficient numbers in the food carrier to stimulate
positive results (Klaenhammer & Kullen, 1999). According to Magariños, Selaive, Costa,
Flores, and Pizarro (2007), a minimum dose of 106 of active Bifidobacterium/g per serving of
food is essential to promote health benefits.
Statement of the Problem
Bacterial survival rate in food has been shown to decrease when the food is exposed to
repeated freeze-thaw fluctuations (Jay, Loessner & Golden, 2005). This effect has also been
shown to occur in probiotic bacteria present in dairy products. Bacterial death during frozen
storage of food products results in reduced probiotic load at the point of consumption.
10
Purpose of the Study
The goal of the study was to evaluate the effect of inulin on the survival of probiotic
bacteria in ice cream during frozen storage under freeze-thaw conditions. Another objective of
the study was to measure the change in textural properties in ice cream due to the addition of
inulin.
The experiment took place during Spring 2011 at the research facilities within the
Departments of Biology and Food and Nutritional Sciences at the University of Wisconsin-Stout.
Importance of the Study
Product or process development methodologies, including the addition of inulin to
enhance the survival of probiotic bacteria in ice cream has significant commercial and health-
based applications. In the commercial context, ice cream manufacturers can develop probiotic
products to extend their product lines with healthier choices. The study benefits consumers by
determining product development strategies that could enhance the survival of LAB in ice cream,
thereby delivering the desired levels of LAB at the point of consumption.
Assumptions of the Study
The major assumptions of the study are:
1. The survival of a mixed culture of LAB strains is indicative of survival of probiotic
bacteria in ice cream.
2. Bifidobacterium lactis will show growth when cultured on De Man, Rogosa and
Sharpe media (MRS).
3. Freeze-thaw conditions simulated in the study are a representation of a worst-case
commercial retailing scenario.
11
Objectives
The objectives of this study were to
1. Investigate the protective effect of inulin during the initial freezing phase of the ice
cream preparation.
2. Investigate the correlation between the amount of inulin used in ice cream (0 %, 1.5%
and 3.0%) and the count of probiotic bacteria during 28-days of storage at -20˚C.
3. Determine the effect of inulin content (0%, 1.5%, and 3.0% w/w) on the survival of
probiotic bacteria under extended freeze-thaw conditions.
4. To analyze the effect of adding inulin on the textural structure (yield stress, viscosity)
of ice cream.
Definition of Terms
Freeze-Thaw: A cyclical process of product storage under freezing and ambient
temperature as a means of testing product stability and its ability to maintain its physical, textural
and organoleptic characteristics during shelf life. It is important to take into consideration that
minor temperature fluctuations during storage can induce thawing of liquids within the frozen
food material. This freeze-thaw process may generate large ice crystals that can deteriorate the
quality of the product and cause injury/death to live microbial culture subsiding within the food
matrix (Labuza & Schmidl, 1985).
Inulin: A term applied to a wide range of naturally occurring polysaccharides from the
class of fructans. Inulin is stored by plants typically in the roots as a form of energy. Inulin is
not digested in the upper digestive tract of humans and hence may be considered as dietary fiber.
Inulin has a low caloric value, which makes it a good fat and sugar replacement in processed
12
food. Inulin has been shown to enhance the bioavailability of calcium and magnesium and
promote growth of intestinal bacteria (Niness, 1999).
Lactic Acid Bacteria: Bacteria that produce relatively large amounts of lactic acid by
fermenting carbohydrates. The group is formed generally by the genera Lactococcus,
Leuconostoc, Pediococcus, Lactobacillus and Streptococcus (Ray, 1996).
Micro-encapsulation: Micro-encapsulation is a process of entrapping solid particles,
droplets of liquids, and gases in thin polymer coats. The content is protected from the immediate
environment conditions such as light air and moisture (Jackson & lee, 1991).
MRS Agar: Bacterial growth medium, invented by De Man, Rogosa and Sharpe. It
contains 0.5% sodium acetate trihydrate, 0.1 % polysorbate 80, 0.02 % magnesium sulfate
heptahydrate and 0.005 % manganese sulfate tetrahydrate which are considered growth
promoting factors for Lactobacilli. The medium is also composed of : 1.0 % peptone, 0.8 %
meat extract, 0.4 % Yeast extract, 2.0 % Glucose (energy source), 0.2 % Triammonium citrate,
1.0 % Agar and 0.2 % Dipotassium hydrogen phosphate which is a buffer agent that keeps a low
pH to eliminate many competing bacteria. The medium when plated is of a light brown color
(De Man, Rogosa, & Sharpe, 1960).
Probiotics: Live microorganisms, which when administered in adequate amounts; confer
a health benefit on the host (FAO, 2001).
Limitations
Due to time constraints, the study of ice cream samples and enumeration of Lactobacillus
bacteria was conducted over a period of 28-days. This duration is typically not representative of
commercial ice cream shelf-life. Typically, the shelf life and storage period of ice cream varies
from a few months to one year depending on the formulation, process and storage conditions

13
(Whelan, Regand, Vega, Kerry, & Goff, 2008). Therefore, subsequent studies with a longer time
frame should be considered to deduce practical conclusions and recommendations that can be
valid for commercial settings.
14
Chapter II: Literature Review
In this chapter, the survival rate of microorganisms, especially probiotics, and the effect
of freeze-thaw conditions on the survival of LAB in ice cream are introduced. In this review,
the role of inulin as a fat replacer and its effect on the probiotic culture survival in low-fat-
probiotic ice cream are discussed.
Lactic Acid Bacteria (LAB)
In the food industry in general and in the dairy industry specifically, microorganisms are
of great importance. One specific group of relevance is the lactic acid bacteria (LAB). LAB are
characterized by their capacity to ferment lactose to lactic acid and they are naturally present in
raw milk (Salminem, Wright, & Ouwehand, 2004). LAB are used as starter cultures in the
production of fermented dairy products such as yogurt, cheese, frozen yogurt/ice cream, and
buttermilk. They are also used in fermented non-dairy products such as fermented meat, bakery
products such as sourdough bread, malo-lactic fermentations in wine, and fermented vegetable
products such as dill pickles and sauerkraut (Marth & Steele, 1998). Therefore special attention
is given to the selection and balancing of LAB to obtain food and dairy products with desirable
texture, flavor and nutritional value characteristics. Furthermore, organoleptic quality of the
final dairy product is directly related to the initial composition of the starter culture and milk
flora (Ahmed & Kanwal, 2004).
LAB contains microorganisms from various genera that produce lactic acids as the
primary or secondary end product of fermentation. They are classified mainly as the
Lactobacillales, which is composed of important genera such as Lactobacillus, Streptocococcus,
Leuconostoc, Lactococcus, and Pediococcus (Salminem, Wright, & Ouwehand, 2004). Common
characteristics of these genera are being gram-positive, non-spore forming, nonpigmented and
15
unable to produce iron-containing porphyrin compounds (catalase and cytochrom); they grow
anaerobicaly but are also aerotolerant; and they have obligated fermentation of sugar with lactic
acid as a major end product (Marth & Steele, 1998).
The present research study focused on the genus Lactobacillus and Bifidobacterium
because of their established probiotic effect in human health (Gilliland & Walker, 1989;
Havenaar et al., 1992; Jardine, 2009). Microorganisms in the Lactobacillus genus are gram
positive and include a large number of species characterized by their rod shapes and inability to
produce spores. They are facultative anaerobes and produce lactic acid by growing on media
that contain glucose (Ray, 1996). Few other species of this genus are heterolactic fermentors and
can produce a mixture of lactic acid, ethanol, acetic acid and carbone dioxide by fermenting a
wide range of sugars such as lactose, sucrose, fructose and galactose. Generally, the optimal
growth temperature of Lactobacillus is between 25 and 40˚C. LAB are ubiquitous and are found
in plants, vegetables, seeds and milk (Marth & Steele, 1998). Some of the most prominent
species of this genus are Lab. acidophilus, Lab. kefir, Lab. fermetatum, Lab. brevis and Lab.
casei, which are broadly considered a beneficial intestinal and digestive tract micro flora (Ray,
1996).
The genus Bifidobacterium is similar to the Lactobacillus since they are mostly of rod-
shaped with different sizes, Gram-positive and characterized by their inability to produce spores.
Unlike LAB, Bifidobacteria are mostly anaerobes with the exceptions of a few species that can
tolerate O2 in the presence of CO2 (Ahmed & Kanwal, 2004). Optimal growth temperature for
Bifidobacteria is between 37 to 41˚C, and they are highly sensitive to pH above 8.0 or below 4.5
(Salminem, Wright, & Ouwehand, 2004). Many species of Bifidobacteria are isolated from the
feces of human and animals. They can appear in the excretions of human babies after two to
16
three days and appear in high numbers in breast-fed babies. They include Bif. Bifidum, Bif.
Longum, Bif. Infantis, and Bif. Adolescentis (Ray, 1996).
Survival of lactic acid bacteria in various food and dairy products.
At the beginning of the twentieth century, the need for large-scale industrial production
of cheese, ice cream and fermented milk products marked the national and international market
to satisfy consumer‟s demands. These innovations came at time when the processing technology
of dairy products witnessed a revolution. This was achieved by the introduction of
mechanization and short processing time, leading to enormous milk quantity being processed on
a daily basis with a variety of products with different flavors, texture, colors and nutritional
values (Tamime, 2005). This in turn, led to a great demand for starter cultures and the study of
their stability, activity and resistance. These studies metamorphosed into a science able to
predict the behavior of each strain and specie in specific media or functional food (Salminen &
Wright, 1998).
The survival of LAB in milk and milk products is a function of many variables, from the
milk composition which could vary by region where the milk is produced to the feed given to
cows (Ahmed & Kanwal, 2004). Furthermore, milk and dairy products are generally not an
optimal growth medium for LAB. Different strains have different nutritional requirements,
especially with regard to vitamins and nonprotein nitrogen (NPN). For instance, Lactobacilli
thrive in media where there is calcium pantothenate, niacin and nitroflavine whereas Lactococci
needs media rich in niacin, pantothenic acid, pyridoxine and biothin (Tamime, 2005).
Additionally, milk contains inhibitory compounds that affect the growth of LAB. The two major
inhibitory compounds are antibiotics residues and bacteriophages; antibiotics were introduced in
the late 1940‟s to treat mastitis in dairy cows. To this day, mastitis remains one of the most
17
serious diseases affecting cows, often resulting in economic loss, intestinal disorder, and
bacterial resistance (Tamime, 2005). Several approaches have been introduced to dairy
production to reduce the level of antibiotic residues in milk. These are based on good agriculture
and hygiene practices that allow withdrawal periods, impose strict penalties on dairy farmers and
tighten monitoring and testing systems by the governing agencies. The second major inhibitory
compounds are bacteriophage viruses that infect bacterial cells and use their cell enzymes for
propagation (Durmaz & Klaenhammer, 1995; Marth &Steele, 1998). The bacteriophage viruses
inhibit the growth of LAB by causing the leakage of the bacterial cell‟s content out of the
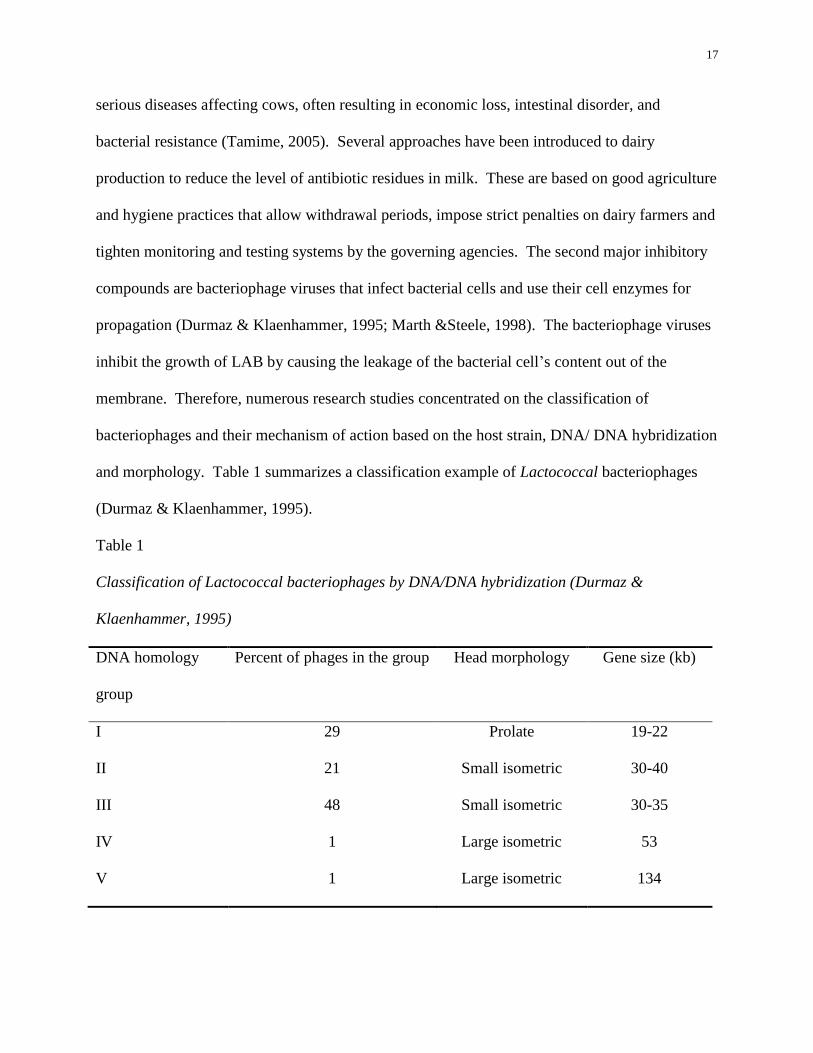
membrane. Therefore, numerous research studies concentrated on the classification of
bacteriophages and their mechanism of action based on the host strain, DNA/ DNA hybridization
and morphology. Table 1 summarizes a classification example of Lactococcal bacteriophages
(Durmaz & Klaenhammer, 1995).
Table 1
Classification of Lactococcal bacteriophages by DNA/DNA hybridization (Durmaz &
Klaenhammer, 1995)
DNA homology
group
Percent of phages in the group Head morphology Gene size (kb)
I 29 Prolate 19-22
II 21 Small isometric 30-40
III 48 Small isometric 30-35
IV 1 Large isometric 53
V 1 Large isometric 134
18
In general, LAB live culture in fermented milk starts to decrease immediately after the
end of the growth cycle (Salminen & Wright, 1998). This follows an exponential kinetic death
curve expressed by the formula: Xt = X0 exp(-kt)
Xt = Cell surviving after time t
X0= Initial bacterial load at t0
k= Specific death rate (strain and environment dependent)
t = time
Storage temperatures play an important role in the survival of the bacteria. When stored
at room temperature, Lactobacillus casei in fermented milk products can decrease by two log-
cycles in a period of two weeks (Magariňos et al., 2007). Lactobacillus acidophilus and
Bifidobacterium bifidum are more thermo-sensitive strains and can incur higher decrease in
numbers at the same temperature. However, low storage temperatures can extend the viability of
the LAB and preserve the microbial load (Salminen & Wright, 1998).
Survival of lactic acid bacteria in ice cream.
In the United States, probiotics could fit into any of the following categories:
conventional foods, dietary supplements, food for special dietary use and medicinal foods
(Tamime, 2005). However, only a small number of conventional foods in the US contain
probiotics, and they mainly constitute dairy product such as yogurt, milk and cultured milk
(Jardine, 2009). For yogurt, the standards set by the Food and Drug Administration (FDA)
require the use of Streptococcus thermophilus and Lactobacillus delbrueckii subsp. bulgaricus
with no levels of microbial load being a factor in regulatory enforcement. However, the National
Yogurt Association (NYA) has introduced a voluntary „Live Active Culture‟ seal for products
that contain live cultures. The seal calls for a minimum of live bacterial load to be delivered by

19
each serving of probiotic food. This requires refrigerated yogurt to contain 108 CFU/g and
frozen yogurt 107 CFU/g at the time of manufacture (Tamime, 2005).
Monitoring and characterizing the survival of the probiotic bacteria in ice cream after
freezing is of high importance. This will allow the acquisition of the probiotic food label and the
sales and advertisement certification for the product. Furthermore, knowing that the freezing
step in the process of making ice cream could cause a reduction in the concentration of the
bacterial load indicates that quantification of this reduction is important to maintain the bacterial
load within the food industry standards.
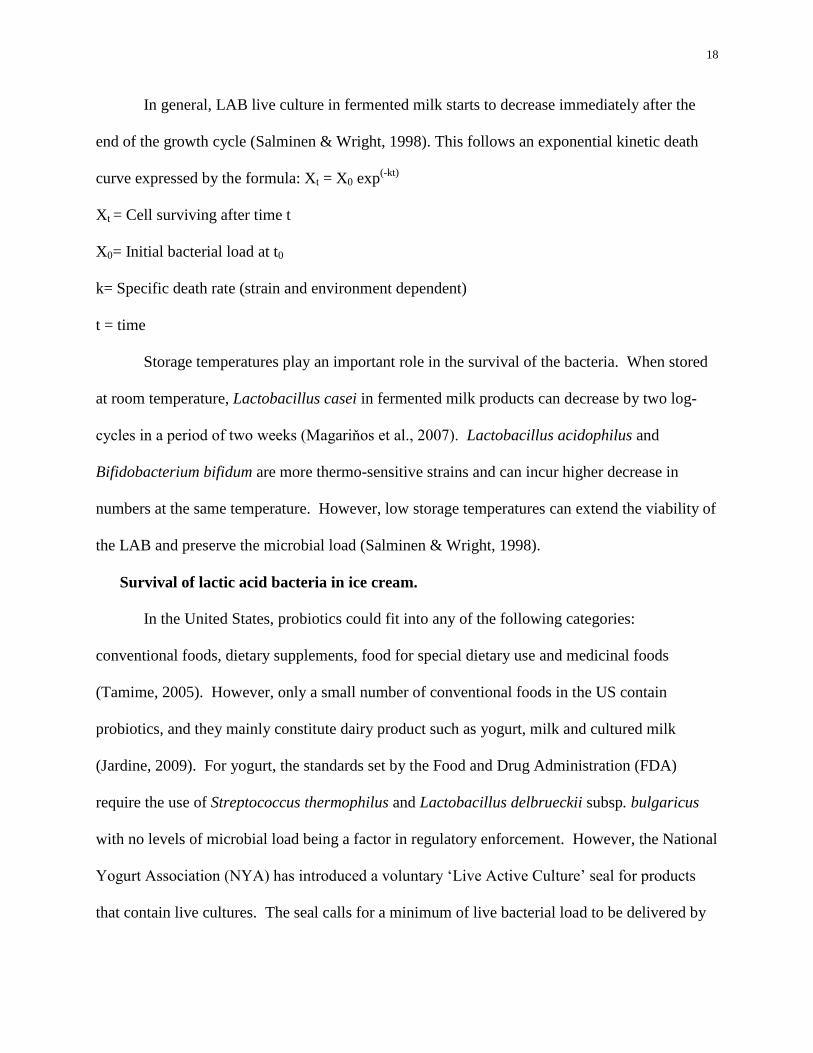
In a study conducted at Austral University of Chile (Magariňos et al., 2007) on the
viability of probiotics microorganism: Lactobacillus acidophilus and Bifidobacterium lactis in
ice cream, it was demonstrated that when these probiotics were inoculated into ice cream and
stored at -25˚C for 60 days, the rate of survival was 87% for L. acidophilus at a final
concentration of 2х106 CFU g
-1. The B. lactis survival rate was 90% with a concentration of
9х106 CFU g
-1. When both microorganisms were inoculated together, the survival rate was 86%.
Furthermore, a substantial loss occurred at the freezing step (Figure 1), quantified by more than
two logs of bacterial death (Magariňos et al., 2007). The ice cream mix formula consisted of
8.0% fat, 11.2% nonfat milk solids, 14.0% sugar and 0.4% stabilizer-emulsifier (Magariňos et
al., 2007).
20
Figure 1. Effects of dilution, freezing, and storage of ice cream at -25°C on the levels of
Lactobacillus acidophilus, Bifidobacterium lactis, and the combined mixture of the two probiotic
microorganisms (Magariňos et al., 2007).
Inulin
Inulin and oligofructose are beta (2-1) fructans found naturally in abundance within a
wide variety of plants, bacteria and some fungi. They are the second most occurring non-
structural natural polysaccharides after starch. Fundamentally, plants that contain inulin can be
categorized in two groups; the Liliales and the Compositae. Table 2 summarizes a list of some
plants that could be used in the daily diet of humans and contain inulin (Jardine, 2009).
21
Table 2
Inulin content in plants used for human consumption (Jardine, 2009)
Source Edible part Inulin content (% of fresh weight)
Onion Bulb 2-6
Jerusalem artichoke Tuber 16-20
Garlic Bulb 9-16
Artichoke Leaves-heart 3-10
Banana Fruit 0.3-0.7
Rye Cereal 0.5-1.0
Barley Cereal 0.5-1.5
Camas Bulb 12-22
Wheat Cereal 1-4
Chicory Root 15-20
Yacon Root 3-19
Dandelion Leaves 12-15
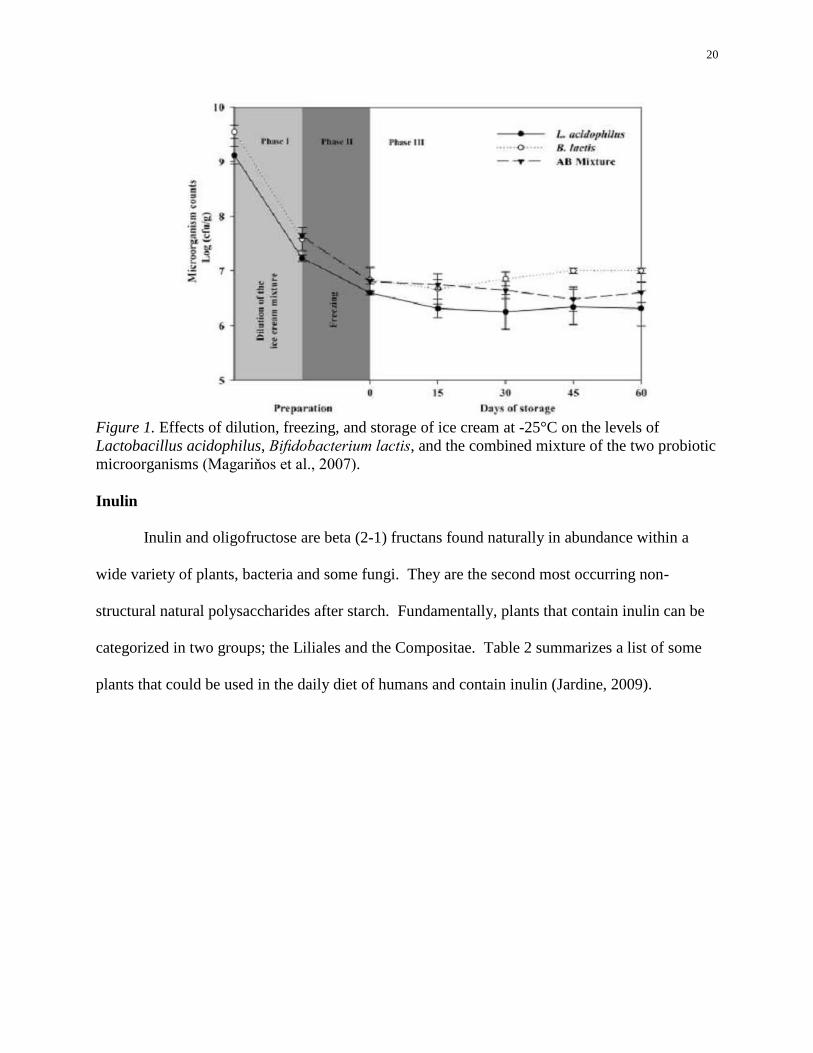
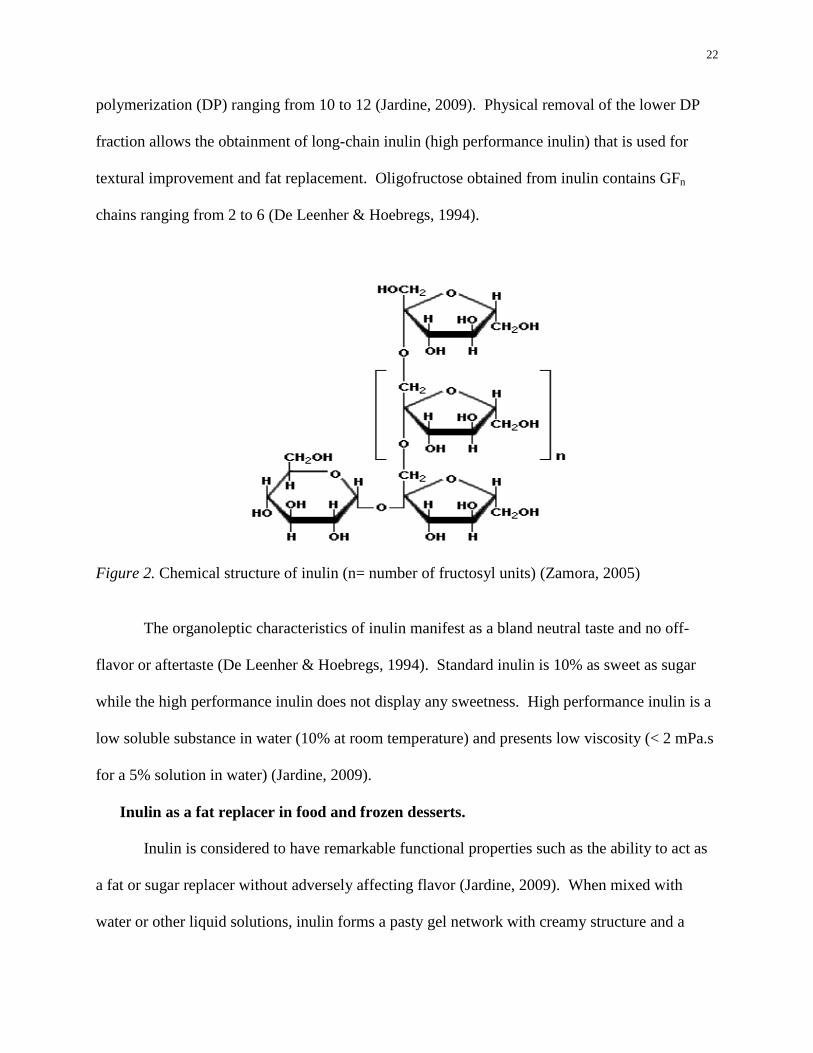
Chemistry.
Chemically, inulin is a polydisperse beta (2-1) fructan composed of a mixture of oligo-
and polysaccharides (De Leenher & Hoebregs, 1994). They are mostly formed of linear chains
of fructose (Figure 2) structured as GFn, where G= glucosyl unit, F= fructosyl unit, and n= the
number of fructosyl units linked to each other (Figure 2). For instance, in chicory inulin the
number of fructose units that are linked together is of the order of 2 to 65, with a degree of
22
polymerization (DP) ranging from 10 to 12 (Jardine, 2009). Physical removal of the lower DP
fraction allows the obtainment of long-chain inulin (high performance inulin) that is used for
textural improvement and fat replacement. Oligofructose obtained from inulin contains GFn
chains ranging from 2 to 6 (De Leenher & Hoebregs, 1994).
Figure 2. Chemical structure of inulin (n= number of fructosyl units) (Zamora, 2005)
The organoleptic characteristics of inulin manifest as a bland neutral taste and no off-
flavor or aftertaste (De Leenher & Hoebregs, 1994). Standard inulin is 10% as sweet as sugar
while the high performance inulin does not display any sweetness. High performance inulin is a
low soluble substance in water (10% at room temperature) and presents low viscosity (< 2 mPa.s
for a 5% solution in water) (Jardine, 2009).
Inulin as a fat replacer in food and frozen desserts.
Inulin is considered to have remarkable functional properties such as the ability to act as
a fat or sugar replacer without adversely affecting flavor (Jardine, 2009). When mixed with
water or other liquid solutions, inulin forms a pasty gel network with creamy structure and a
23
short, spreadable texture that allows it to be easily incorporated into food to replace up to 100%
of fat (Franck, 1993). When inulin is used as a fat replacer, it allows the manufacturer of dairy
desserts such as yogurt and ice cream to offer healthy food product choices. They can provide
low fat content, organoleptic properties, and rheological characteristics similar to as regular
yogurt or ice cream. This is due in part to the ability of inulin to stabilize the structure of the
emulsion phase, which creates an improved „creaminess‟ and mouth-feel (Franck, 1993).
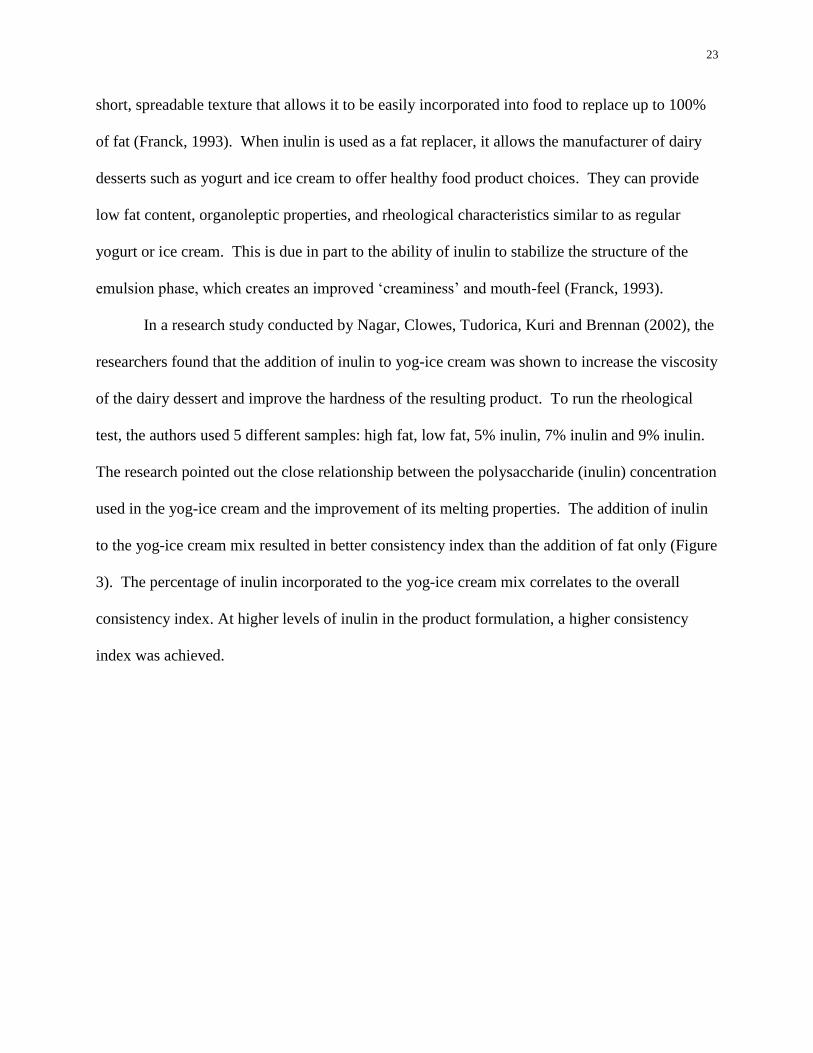
In a research study conducted by Nagar, Clowes, Tudorica, Kuri and Brennan (2002), the
researchers found that the addition of inulin to yog-ice cream was shown to increase the viscosity
of the dairy dessert and improve the hardness of the resulting product. To run the rheological
test, the authors used 5 different samples: high fat, low fat, 5% inulin, 7% inulin and 9% inulin.
The research pointed out the close relationship between the polysaccharide (inulin) concentration
used in the yog-ice cream and the improvement of its melting properties. The addition of inulin
to the yog-ice cream mix resulted in better consistency index than the addition of fat only (Figure
3). The percentage of inulin incorporated to the yog-ice cream mix correlates to the overall
consistency index. At higher levels of inulin in the product formulation, a higher consistency
index was achieved.
24
Figure 3. Consistency index of yog-ice cream mixes as determined using Brookfield Rheometer.
Results derived from Power Law model (Pr = 0.91; means of triplicates ± SD) (Nagar et al.,
2002).
The above results are significant when considering the production of fat free yog-ice
cream (Figure 3). The substitution of fat by inulin can play the same role in forming the protein-
fat matrix that gives the product its cohesiveness and yields a uniform inulin-liquid emulsion.
This may be due to the hygroscopic properties of inulin and its ability to bind to water and form
a gel-like network with high consistency index (Franck, 1993).
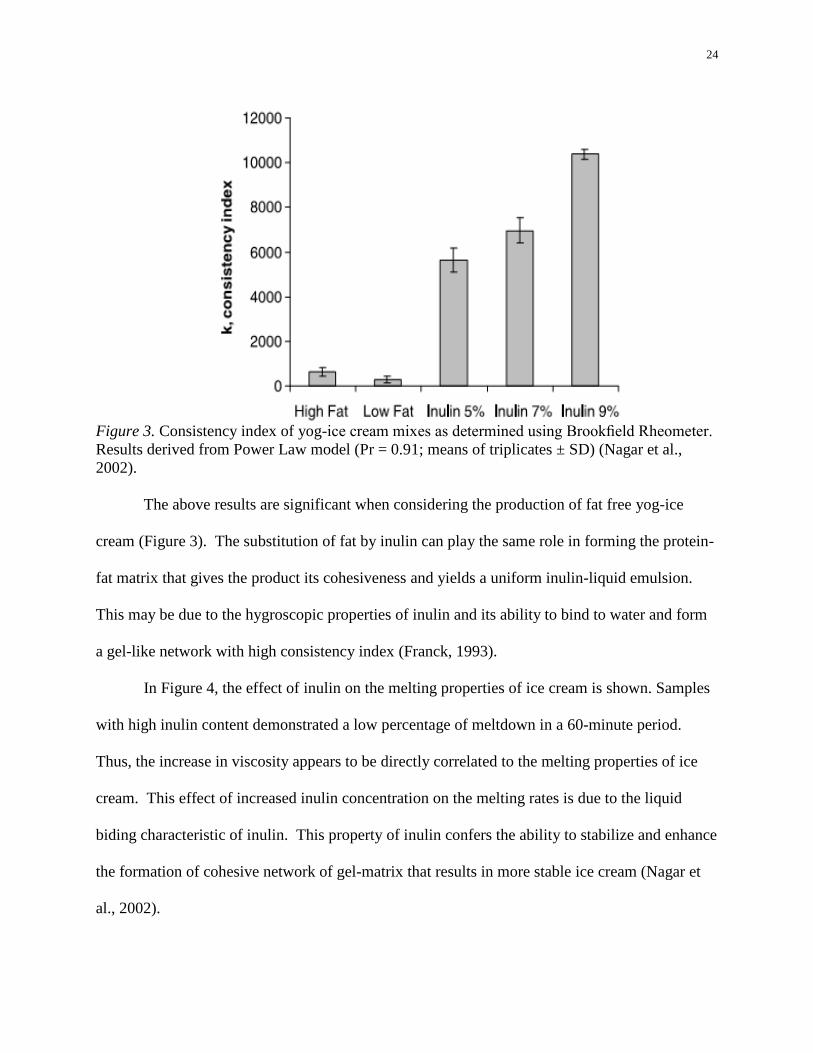
In Figure 4, the effect of inulin on the melting properties of ice cream is shown. Samples
with high inulin content demonstrated a low percentage of meltdown in a 60-minute period.
Thus, the increase in viscosity appears to be directly correlated to the melting properties of ice
cream. This effect of increased inulin concentration on the melting rates is due to the liquid
biding characteristic of inulin. This property of inulin confers the ability to stabilize and enhance
the formation of cohesive network of gel-matrix that results in more stable ice cream (Nagar et
al., 2002).
25
Figure 4. Meltdown characteristics of yog-ice cream expressed as percentage of yog-ice cream
melted over 60 min (values represent means of duplicates) (Nagar et al., 2002).
Effect of Freeze-Thaw Conditions on the Survival of Lactic Acid Bacteria
The composition and characteristics of the ice cream can provide some challenges to the
survival of LAB (Whelan et al., 2008). The environment in ice cream is similar to that of a
frozen foam with a continuous phase constituted by viscous syrup and a suspended phase made
from air bubbles, colloidal substances (casein and stabilizing gums) and ice crystal (Tamime,
2005). Lactic acid bacteria are suspended in the continuous phase and are affected by the pH,
osmotic pressure, high salt concentrations and physical forces exercised by the ice crystals
(Marth &Steele, 1998).
To study the effect of freezing on the survival of LAB, it is important to know that
microorganisms are unable to grow at freezing temperatures and that freezing itself is considered
a preservation method for certain foods (Marth &Steele, 1998). Furthermore, there is a sudden
mortality immediately after freezing with a species and strain dependent severity (Magariňos et
al., 2007). The surviving cells will enter a gradual death curve during storage that is also strain
and species dependent. One important factor to consider is that temperatures just below the
26
freezing point (-5˚C) are far more lethal than lower temperatures (In the order of -20˚C). This is
explained by the physical proprieties of the media at the phase below the glass transition curve
(Salminen & Wright, 1998; Whelan et al., 2008). In this phase and due to low temperatures,
there is no liquid movement, and large ice crystal formation is inhibited. Moreover, gram-
positive bacteria rank above average on the survival scale when compared to vegetative cells of
molds, yeast and gram-negative bacteria (Marth &Steele, 1998).
Effect of freeze-thaw on the survival of Lactobacillus sp.
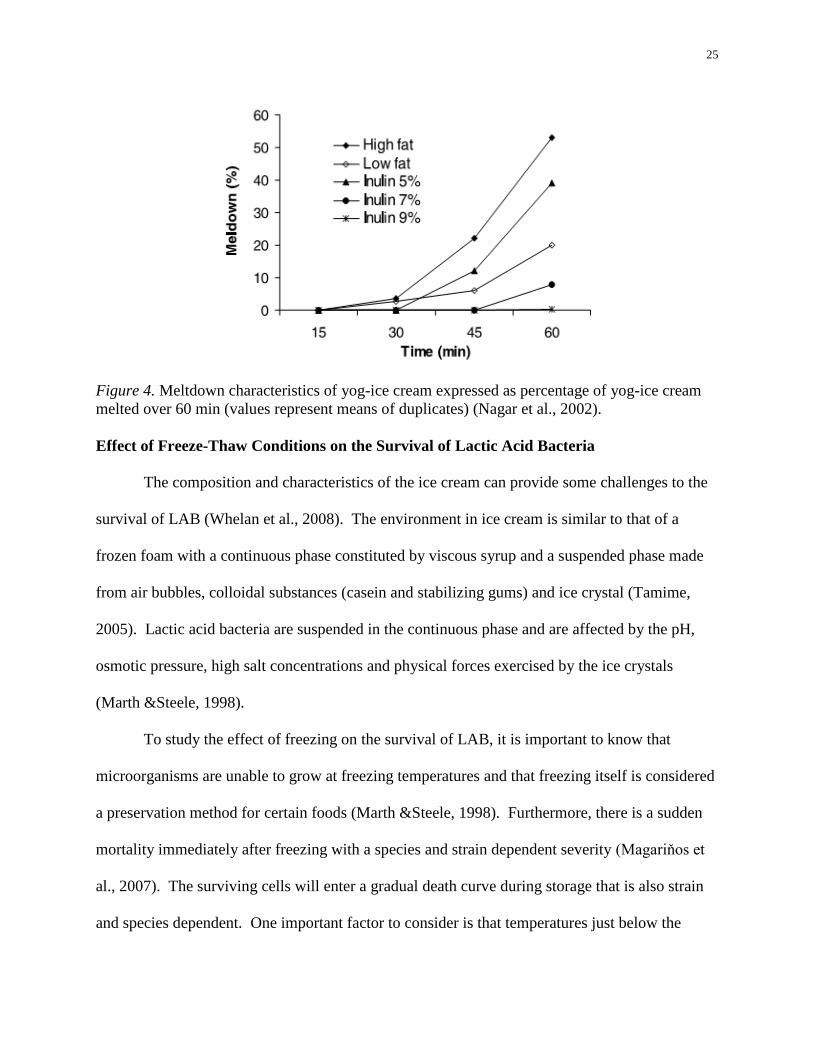
Considering what occurs when cells freeze is important to understand the effect of freeze-
thaw patterns on the lactic acid bacteria survival. When a temperature reaches critically low
levels, free water freezes by forming ice crystals. The growth of ice crystals occurs by accretion
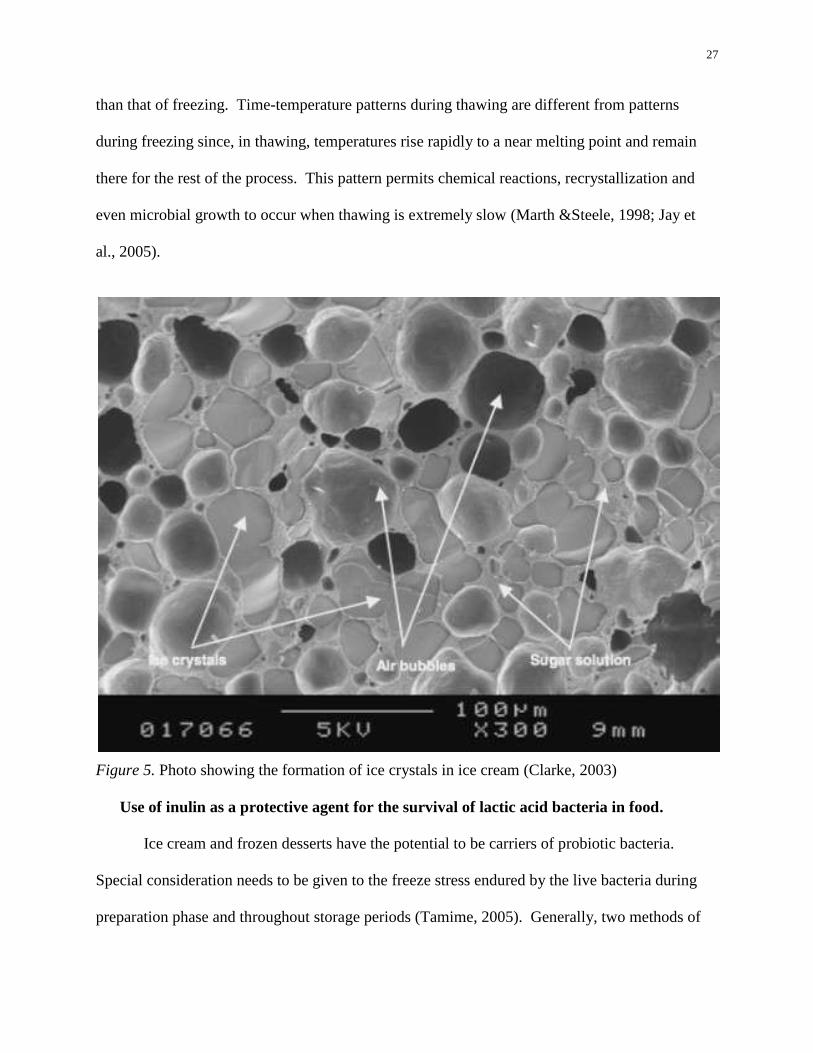
(Jay et al., 2005). In slow freezing, ice crystals are large and extracellular while in fast freezing
(Figure 5), ice crystals are small and intracellular (Whelan et al., 2008). The formation of ice
crystals depletes the viable liquid from the cells and dehydrates them. This results in an
increased viscosity, the loss of cytoplasmic gases such as O2 and CO2, pH change, change in
electrolytes concentration and denaturation of cell protein (Marth &Steele, 1998). Cell freezing
is a complex mechanism and the major factors contributing to cell death by freezing are the
solute concentration and the ice crystal formation (Tamime, 2005; Whelan et al., 2008).
The thawing process is equally important, if not more detrimental, to the survival of
lactobacillus bacteria. Repeated freezing and thawing will destroys the microorganism‟s
membrane (Marth &Steele, 1998). The faster the thaw, the smaller is the damage incurred; this
is due to the complicated process toward restoration of cell viability by reversing the steps above.
The thawing is a slower process than freezing when conducted under comparable temperatures
(Jay et al., 2005). The maximum temperature differential permissible under thawing is smaller
27
than that of freezing. Time-temperature patterns during thawing are different from patterns
during freezing since, in thawing, temperatures rise rapidly to a near melting point and remain
there for the rest of the process. This pattern permits chemical reactions, recrystallization and
even microbial growth to occur when thawing is extremely slow (Marth &Steele, 1998; Jay et
al., 2005).
Figure 5. Photo showing the formation of ice crystals in ice cream (Clarke, 2003)
Use of inulin as a protective agent for the survival of lactic acid bacteria in food.
Ice cream and frozen desserts have the potential to be carriers of probiotic bacteria.
Special consideration needs to be given to the freeze stress endured by the live bacteria during
preparation phase and throughout storage periods (Tamime, 2005). Generally, two methods of
28
delivery are used: direct blending by mixing the probiotics cells and ice cream mix prior to the
freezing phase and fermentation (Akalin & Erisir, 2008). Frozen yogurt is produced when the
starter culture is allowed to ferment the ice cream mix before blending and freezing.
Probiotics used in ice cream are usually a combination of Lactobacilli and Bifidobateria
due to their partial resistance to the freezing steps and storage period (Salminen & Wright,
1998). Kebary, Hamed, Salem and Yousef (2004) demonstrated the maintenance of 107 CFU/g
of Lactobacillus johnsonii La1 for 10 weeks in ice cream. In another study, Haynes and Playne
(2002) where able to keep a combination of B. longum and B. infantis for 52 weeks in stored ice
cream at the same count levels (107 CFU/g). The ability of probiotics to survive in different
freezing products is also strain dependent (Salminen & Wright, 1998).
Besides the known role of inulin as a fat replacer in different food product, few studies
demonstrated the ability of inulin to increase the survival of probiotic culture in ice cream and
yogurt (Akalin & Erisir, 2008; Franck, 1993; Magariňos et al., 2007). This is an important
finding to extend the health benefits of the probiotics to ice cream, especially when these
microorganisms need to be consumed in sufficient quantities to create the desired health benefits
(Havenaar et al., 1992).
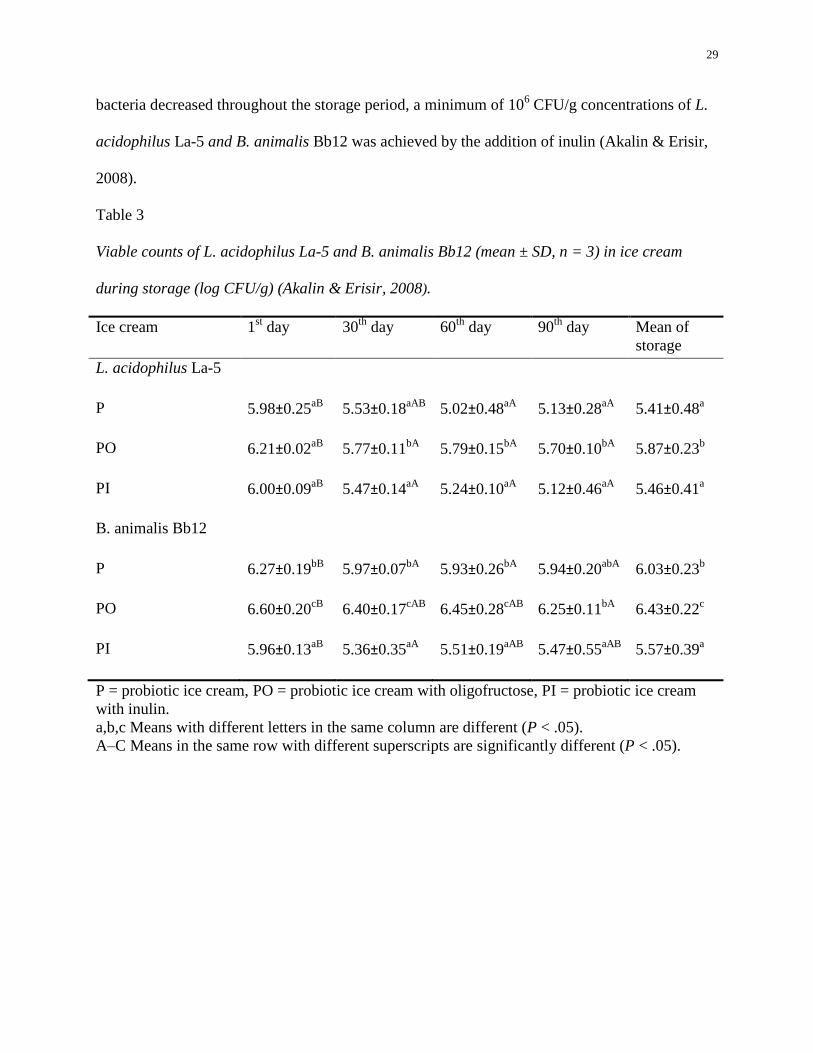
In a research study that was conducted by Akalin and Erisir (2008), supplementation of
inulin or oligofructose showed a significant effect on the rheological characteristics and the
survival of Lactobacillus acidophilus La-5 and Bifidobacterium animalis Bb-12 in low-fat ice
cream when stored at -18˚C for 90 days. The addition of inulin significantly increased the
viscosity, overrun, and improved the melting properties and texture of ice cream. The major
result of the study was that the addition of inulin to ice cream also improved the viability of L.
acidophilus and B. animalis significantly (Table 3). Even if the total viable count of both
29
bacteria decreased throughout the storage period, a minimum of 106 CFU/g concentrations of L.
acidophilus La-5 and B. animalis Bb12 was achieved by the addition of inulin (Akalin & Erisir,
2008).
Table 3
Viable counts of L. acidophilus La-5 and B. animalis Bb12 (mean ± SD, n = 3) in ice cream
during storage (log CFU/g) (Akalin & Erisir, 2008).
Ice cream 1st day 30
th day 60
th day 90
th day Mean of
storage
L. acidophilus La-5
P 5.98±0.25aB
5.53±0.18aAB
5.02±0.48aA
5.13±0.28aA
5.41±0.48a
PO 6.21±0.02aB
5.77±0.11bA
5.79±0.15bA
5.70±0.10bA
5.87±0.23b
PI 6.00±0.09aB
5.47±0.14aA
5.24±0.10aA
5.12±0.46aA
5.46±0.41a
B. animalis Bb12
P 6.27±0.19bB
5.97±0.07bA
5.93±0.26bA
5.94±0.20abA
6.03±0.23b
PO 6.60±0.20cB
6.40±0.17cAB
6.45±0.28cAB
6.25±0.11bA
6.43±0.22c
PI 5.96±0.13aB
5.36±0.35aA
5.51±0.19aAB
5.47±0.55aAB
5.57±0.39a
P = probiotic ice cream, PO = probiotic ice cream with oligofructose, PI = probiotic ice cream
with inulin.
a,b,c Means with different letters in the same column are different (P < .05).
A–C Means in the same row with different superscripts are significantly different (P < .05).
30
Chapter III: Methodology
Culture Selection and Inoculation
The probiotic culture was obtained from “Dairy Connection Inc” (Madison, Wisconsin,
USA). The freeze-dried culture was stored in airtight containers and kept at -20˚C throughout
the experimentation period. The cultures contained a mixture of: Streptococcus thermophilus,
Lactobacillus delbrueckii subsp. bulgaricus, Lactobacillus acidophilus and Bifidobacterium
lactis. The culture was used in the study because of its prominent application in the commercial
production of yogurt and frozen yogurt.
Lactobacillus acidophilus and Bifidobacterium lactis were the probiotic bacteria present
in the mixed culture used in the study (Jardine, 2009; Tamime, 2005). A viable count of 109
CFU/g of total bacteria was present in the culture mix and was verified by enumeration on MRS
agar (Difco, Franklin Lakes, USA). Two grams (2g) of the viable culture was added to 40ml of
raw milk and set at room temperature (25˚C) for sixty minutes. Two milliliters of this inoculum
was added to 1litre of the ice cream mix.
Instrumentation and Ice Cream Preparation
For ice cream preparation, a Lolla Musso Pola scraped-surface freezer (described in
Table 4), with a capacity of two quarts and a draw temperature of -10°C, was used. The ice
cream mix was prepared with a Stephan mixer (UMC5 EL, 1989, Germany) linked to a hot water
circulator bath (F12-ED, Julabo, USA) with a temperature set at 85˚C and a rotation speed of
7000rpm to blend the ingredients and to pasteurize the mixture.

31
Table 4
Lolla Musso Pola 5030 ice cream maker characteristics
Instrument characteristic Specification
Model No 5030
Type of machine Electric
Capacity 2-qt
Dimensions 20 x 14 x 12.25-in
Weight 72.5 lbs
Volts/Watts 300 watts/110 Volts
Origin Italy
Material Stainless Steel
Whole milk and cream were obtained from the local grocery store and stored in the
refrigerator at 3.6˚C. Simple granulated table sugar was used as sucrose. Inulin and stabilizer
were obtained from Cargill, Inc (Minneapolis, MN). The stabilizer was a hydrocolloid composed
of alginates, carrageenans, guar gum, locust bean gum, pectins, xanthan gum, and scleroglucan.
Table 5 shows the ingredients used to prepare the batches of ice cream mix for this experiment.
After weighing the ingredients, duplicate batches were prepared by mixing in a Stephan mixer at
85˚C and 7000rpm rotation for 15 minutes. The ice cream mixes were left to cool at (25˚C) in
1litre glass containers for 45 minutes before they were placed in the refrigerator at 3.6˚C.
32
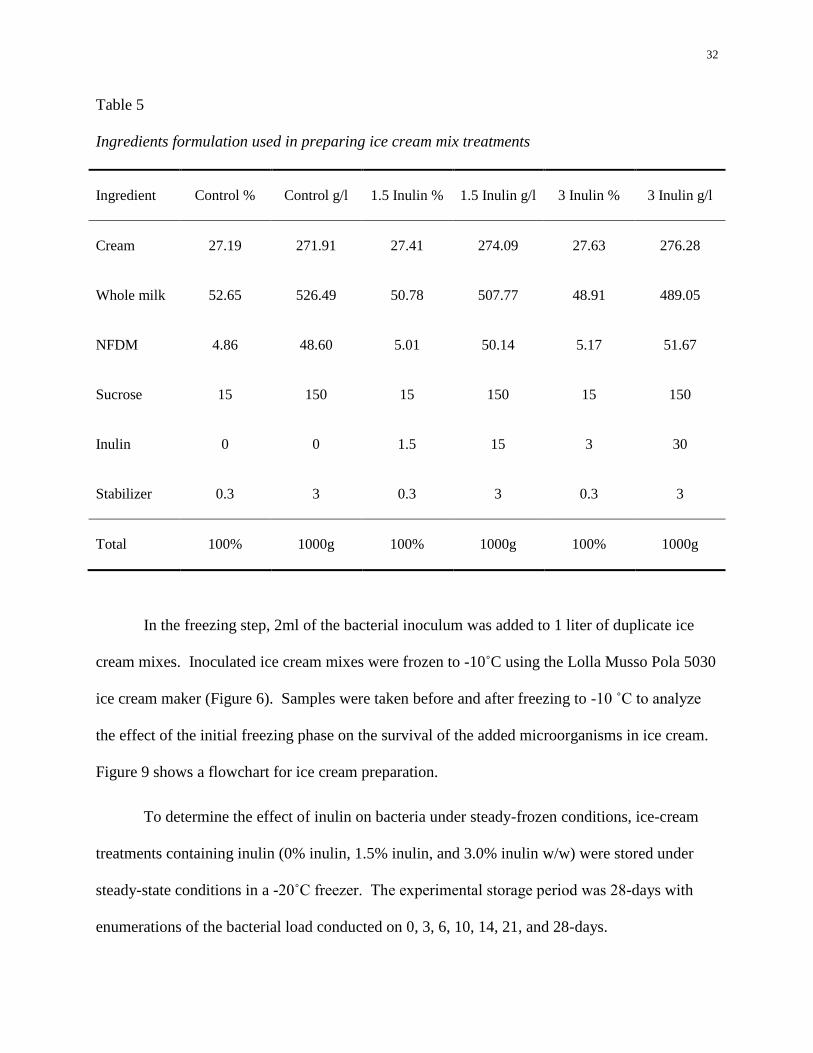
Table 5
Ingredients formulation used in preparing ice cream mix treatments
Ingredient Control % Control g/l 1.5 Inulin % 1.5 Inulin g/l 3 Inulin % 3 Inulin g/l
Cream 27.19 271.91 27.41 274.09 27.63 276.28
Whole milk 52.65 526.49 50.78 507.77 48.91 489.05
NFDM 4.86 48.60 5.01 50.14 5.17 51.67
Sucrose 15 150 15 150 15 150
Inulin 0 0 1.5 15 3 30
Stabilizer 0.3 3 0.3 3 0.3 3
Total 100% 1000g 100% 1000g 100% 1000g
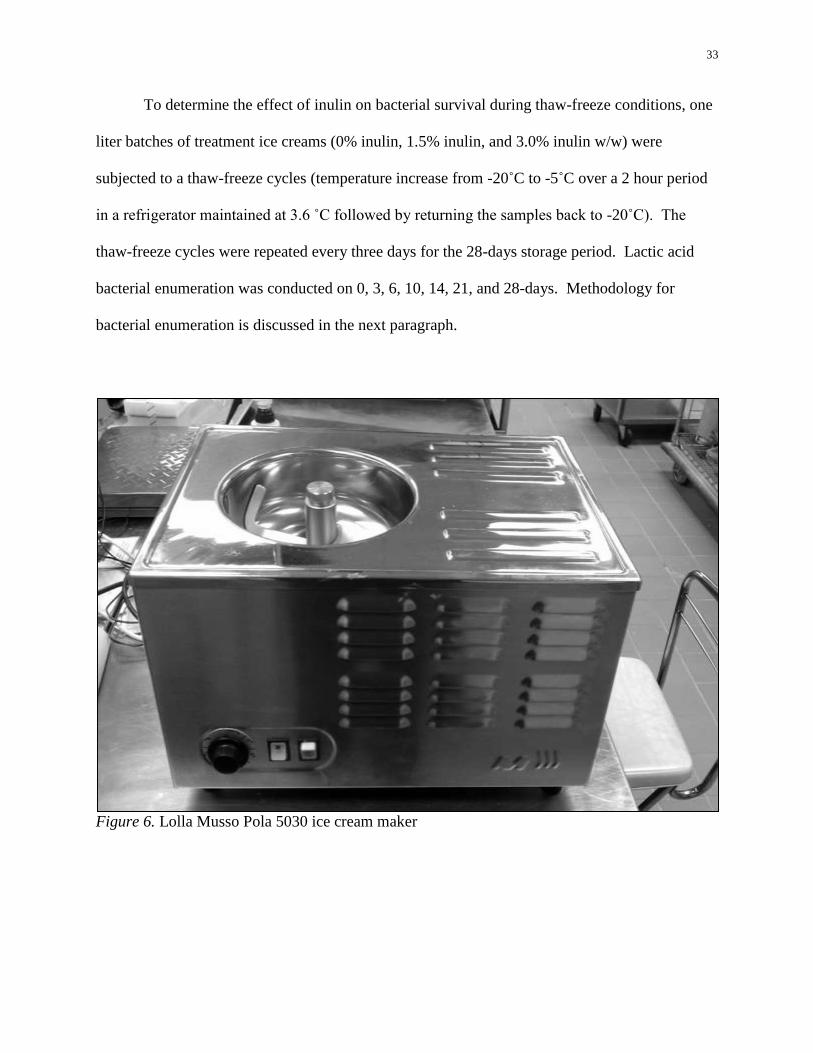
In the freezing step, 2ml of the bacterial inoculum was added to 1 liter of duplicate ice
cream mixes. Inoculated ice cream mixes were frozen to -10˚C using the Lolla Musso Pola 5030
ice cream maker (Figure 6). Samples were taken before and after freezing to -10 ˚C to analyze
the effect of the initial freezing phase on the survival of the added microorganisms in ice cream.
Figure 9 shows a flowchart for ice cream preparation.
To determine the effect of inulin on bacteria under steady-frozen conditions, ice-cream
treatments containing inulin (0% inulin, 1.5% inulin, and 3.0% inulin w/w) were stored under
steady-state conditions in a -20˚C freezer. The experimental storage period was 28-days with
enumerations of the bacterial load conducted on 0, 3, 6, 10, 14, 21, and 28-days.
33
To determine the effect of inulin on bacterial survival during thaw-freeze conditions, one
liter batches of treatment ice creams (0% inulin, 1.5% inulin, and 3.0% inulin w/w) were
subjected to a thaw-freeze cycles (temperature increase from -20˚C to -5˚C over a 2 hour period
in a refrigerator maintained at 3.6 ˚C followed by returning the samples back to -20˚C). The
thaw-freeze cycles were repeated every three days for the 28-days storage period. Lactic acid
bacterial enumeration was conducted on 0, 3, 6, 10, 14, 21, and 28-days. Methodology for
bacterial enumeration is discussed in the next paragraph.
Figure 6. Lolla Musso Pola 5030 ice cream maker
34
Live Culture Enumeration of Lactic Acid Bacteria
Enumeration of bacteria in the ice cream treatments were done by aseptically sampling
ice cream on 0, 3, 6, 10, 14, 21 and 28-days of frozen storage. One milliliter (1mL) of ice cream
sample was mixed in 9 ml solution of buffered peptone water (BPW, Difco). The samples were
serially diluted in BPW, plated on MRS (de Man, Rogosa and Sharpe, Difco) agar and the plates
were incubated in an environmental chamber (Steridium, i170, USA) for 48 hours at 37˚C.
Colonies on plates were counted using a Dark Field Quebec colony counter to determine the
bacterial load in ice cream samples during storage (Figure 8).
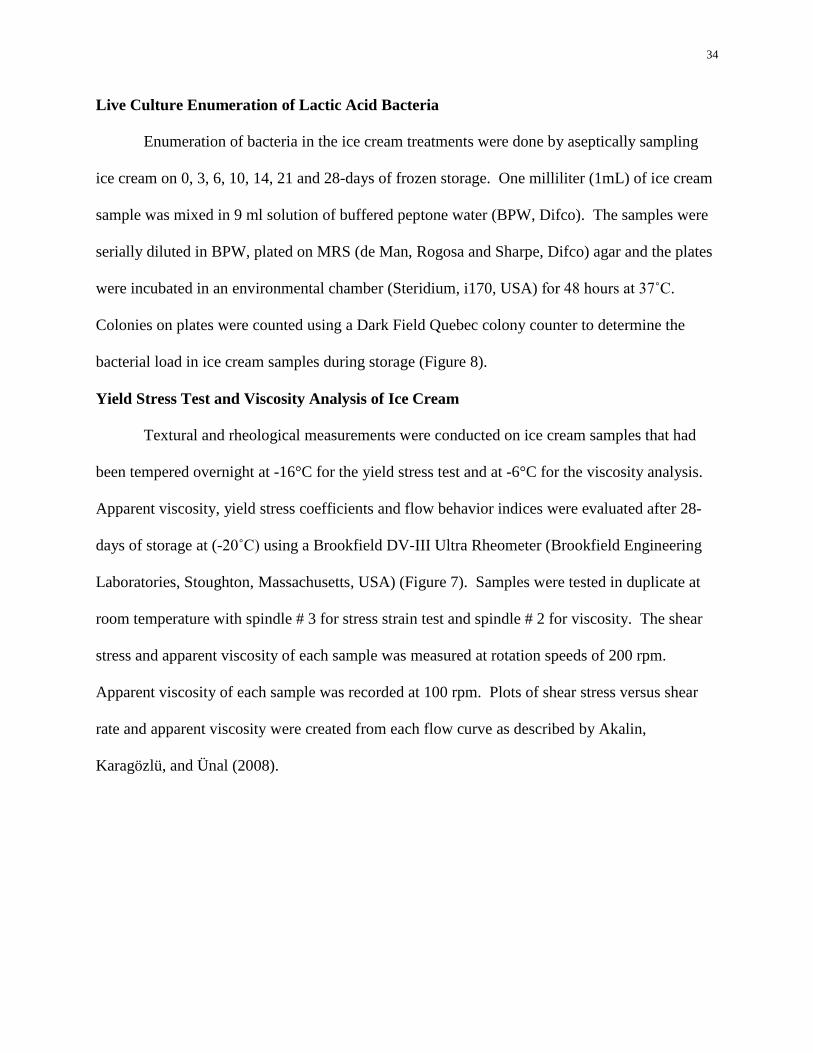
Yield Stress Test and Viscosity Analysis of Ice Cream
Textural and rheological measurements were conducted on ice cream samples that had
been tempered overnight at -16°C for the yield stress test and at -6°C for the viscosity analysis.
Apparent viscosity, yield stress coefficients and flow behavior indices were evaluated after 28-
days of storage at (-20˚C) using a Brookfield DV-III Ultra Rheometer (Brookfield Engineering
Laboratories, Stoughton, Massachusetts, USA) (Figure 7). Samples were tested in duplicate at
room temperature with spindle # 3 for stress strain test and spindle # 2 for viscosity. The shear
stress and apparent viscosity of each sample was measured at rotation speeds of 200 rpm.
Apparent viscosity of each sample was recorded at 100 rpm. Plots of shear stress versus shear
rate and apparent viscosity were created from each flow curve as described by Akalin,
Karagözlü, and Ünal (2008).
35
Figure 7. Brookfield DV-III Ultra Rheometer
Data Analysis
Statistical analysis to determine the effect of inulin addition on the dependent variables
was done by two-way Analysis of Variance (ANOVA) conducted on log survival data of
bacterial numbers, stress-strain data and viscosity values using the SPSS 17 statistical software
(IBM, New York, USA).
Limitations
During the storage period, temperatures fluctuations may have occurred due to the usage
of commercial refrigerators and freezer.
36
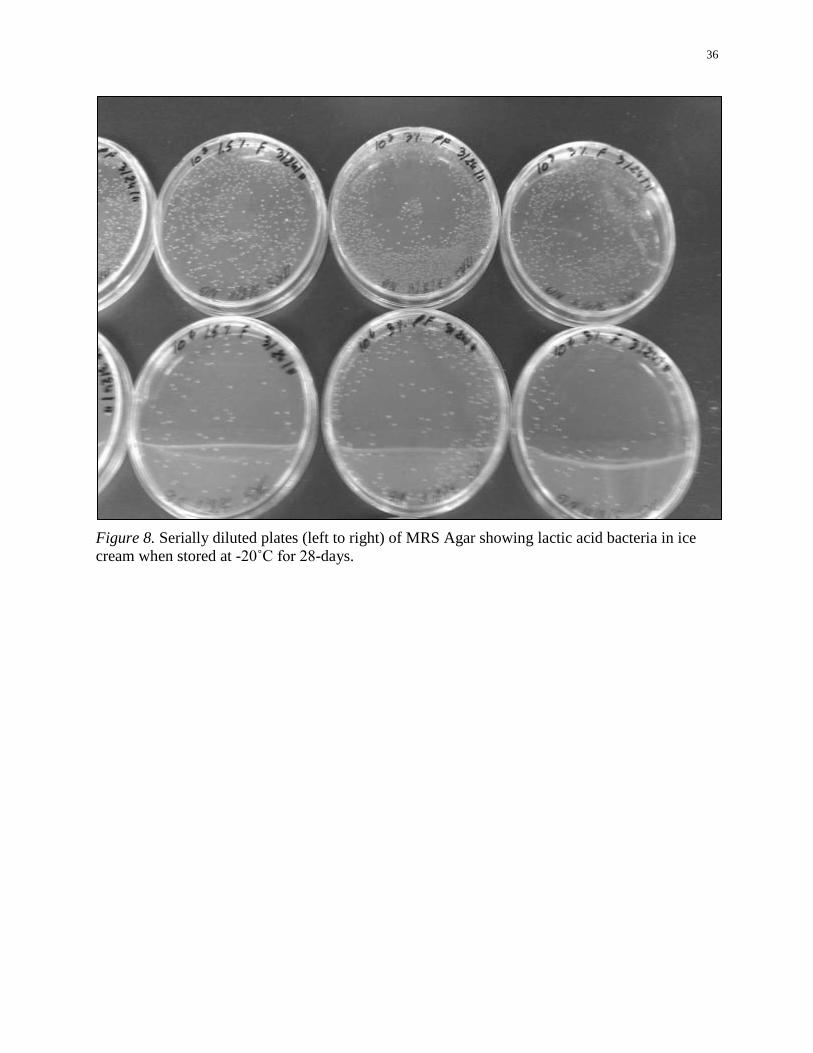
Figure 8. Serially diluted plates (left to right) of MRS Agar showing lactic acid bacteria in ice
cream when stored at -20˚C for 28-days.
37
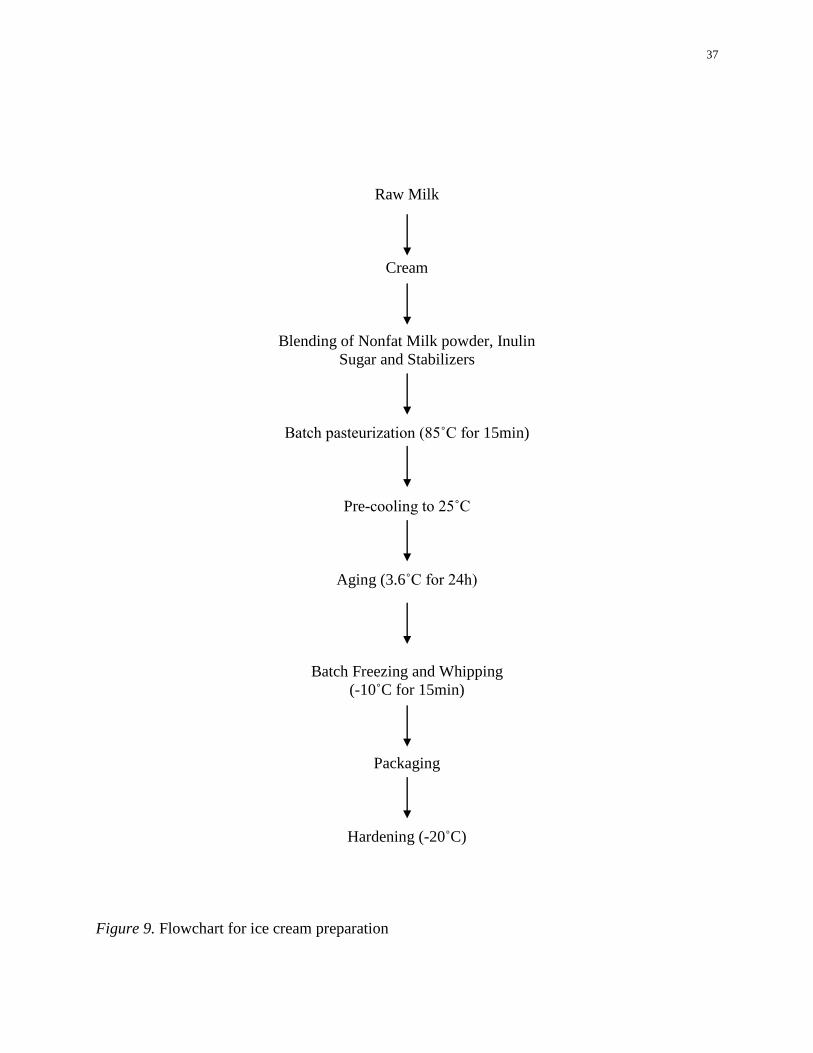
Raw Milk
Cream
Blending of Nonfat Milk powder, Inulin
Sugar and Stabilizers
Batch pasteurization (85˚C for 15min)
Pre-cooling to 25˚C
Aging (3.6˚C for 24h)
Batch Freezing and Whipping
(-10˚C for 15min)
Packaging
Hardening (-20˚C)
Figure 9. Flowchart for ice cream preparation
38
Chapter IV: Results and Discussion
Effect of Inulin on the Survival of Inoculated Bacteria in Ice Cream During the Initial
Freezing Phase (from Liquid Ice Cream Mix at 3.6˚C to Frozen Ice Cream at -10˚C)
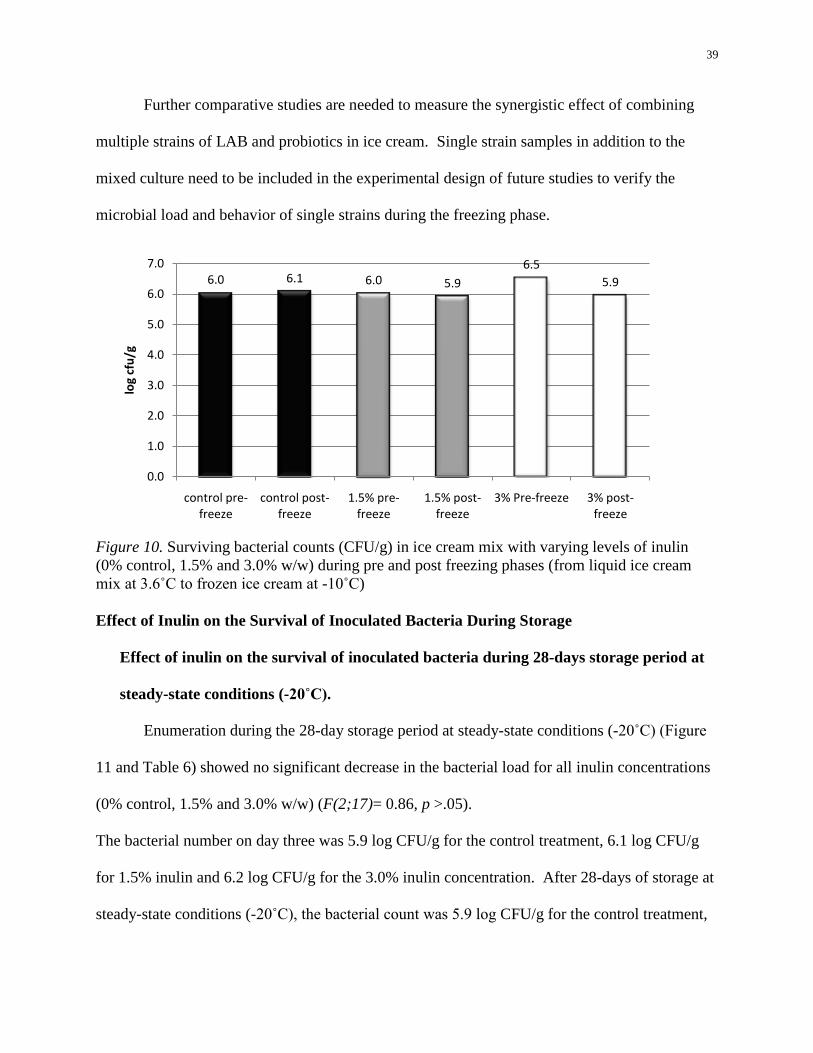
The effect of inulin concentration (0% control, 1.5% and 3.0% w/w) on bacterial load
before and after the freezing phase is shown in Figure10. Results indicate that the mean
population level of LAB and the probiotic bacteria in the ice cream samples after the freezing
phase were in the ranges of 5.9 to 6.5 log CFU/g. This observation is consistent with the study
conducted by Akalin and Erisir (2008) where the authors observed a mean population level of
probiotic bacteria in ice cream samples after the freezing phase ranging from 5.9 to 6.6 log
CFU/g. For the control treatment, (0% inulin), the bacterial numbers during pre-freeze and post-
freeze was 6 log CFU/g and 6.1 log CFU/g, respectively. Similarly, for 1.5% of inulin in the ice
cream mix, the bacterial count was 6.1 log CFU/g at pre-freeze and 6.0 at post-freeze. For the
3.0% inulin concentration, a drop from 6.5 log CFU/g at pre-freeze to 5.9 log CFU/g at post-
freeze was recorded. The freezing phase had no significant effect (F(1;5) = 1.24, p > .05) on
bacterial numbers in ice cream mix with varying inulin levels. This finding contradicts the
findings of Magariños et al. (2007), where a two log reduction in bacterial numbers were
observed in the initial freezing phase under experimental conditions similar to the current study.
This finding may be explained due to the differences in the bacterial genera and species
among the two studies. In the current study, the bacterial culture contained a combination of
microbial genera and species including Streptococcus thermophilus, Lactobacillus delbrueckii
subsp. bulgaricus, Lactobacillus acidophilus and Bifidobacterium lactis, whereas the study by
Magariños et al. (2007) used a bacterial culture mix composed of only Lactobacillus acidophilus
and Bifidobacterium lactis.
39
Further comparative studies are needed to measure the synergistic effect of combining
multiple strains of LAB and probiotics in ice cream. Single strain samples in addition to the
mixed culture need to be included in the experimental design of future studies to verify the
microbial load and behavior of single strains during the freezing phase.
Figure 10. Surviving bacterial counts (CFU/g) in ice cream mix with varying levels of inulin
(0% control, 1.5% and 3.0% w/w) during pre and post freezing phases (from liquid ice cream
mix at 3.6˚C to frozen ice cream at -10˚C)
Effect of Inulin on the Survival of Inoculated Bacteria During Storage
Effect of inulin on the survival of inoculated bacteria during 28-days storage period at
steady-state conditions (-20˚C).
Enumeration during the 28-day storage period at steady-state conditions (-20˚C) (Figure
11 and Table 6) showed no significant decrease in the bacterial load for all inulin concentrations
(0% control, 1.5% and 3.0% w/w) (F(2;17)= 0.86, p >.05).
The bacterial number on day three was 5.9 log CFU/g for the control treatment, 6.1 log CFU/g
for 1.5% inulin and 6.2 log CFU/g for the 3.0% inulin concentration. After 28-days of storage at
steady-state conditions (-20˚C), the bacterial count was 5.9 log CFU/g for the control treatment,
6.0 6.1 6.0 5.9
6.5
5.9
0.0
1.0
2.0
3.0
4.0
5.0
6.0
7.0
control pre-freeze
control post-freeze
1.5% pre-freeze
1.5% post-freeze
3% Pre-freeze 3% post-freeze
log
cfu
/g
40
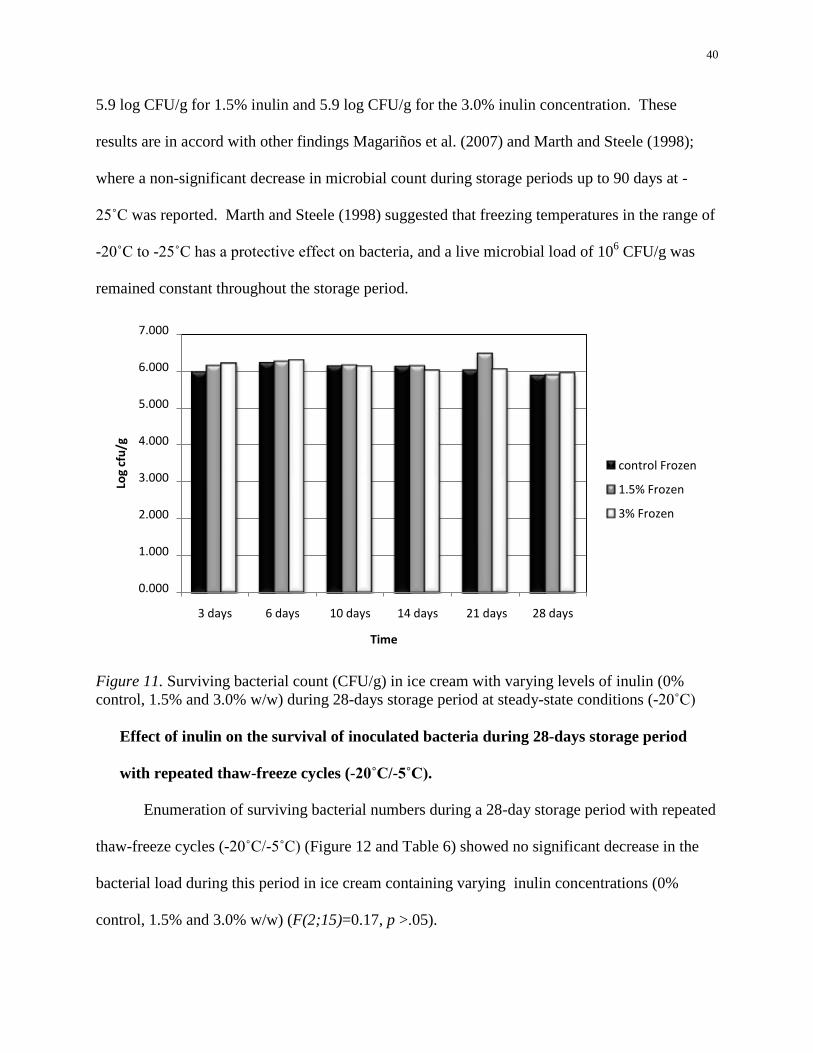
5.9 log CFU/g for 1.5% inulin and 5.9 log CFU/g for the 3.0% inulin concentration. These
results are in accord with other findings Magariños et al. (2007) and Marth and Steele (1998);
where a non-significant decrease in microbial count during storage periods up to 90 days at -
25˚C was reported. Marth and Steele (1998) suggested that freezing temperatures in the range of
-20˚C to -25˚C has a protective effect on bacteria, and a live microbial load of 106 CFU/g was
remained constant throughout the storage period.
Figure 11. Surviving bacterial count (CFU/g) in ice cream with varying levels of inulin (0%
control, 1.5% and 3.0% w/w) during 28-days storage period at steady-state conditions (-20˚C)
Effect of inulin on the survival of inoculated bacteria during 28-days storage period
with repeated thaw-freeze cycles (-20˚C/-5˚C).
Enumeration of surviving bacterial numbers during a 28-day storage period with repeated
thaw-freeze cycles (-20˚C/-5˚C) (Figure 12 and Table 6) showed no significant decrease in the
bacterial load during this period in ice cream containing varying inulin concentrations (0%
control, 1.5% and 3.0% w/w) (F(2;15)=0.17, p >.05).
0.000
1.000
2.000
3.000
4.000
5.000
6.000
7.000
3 days 6 days 10 days 14 days 21 days 28 days
Log
cfu
/g
Time
control Frozen
1.5% Frozen
3% Frozen
41
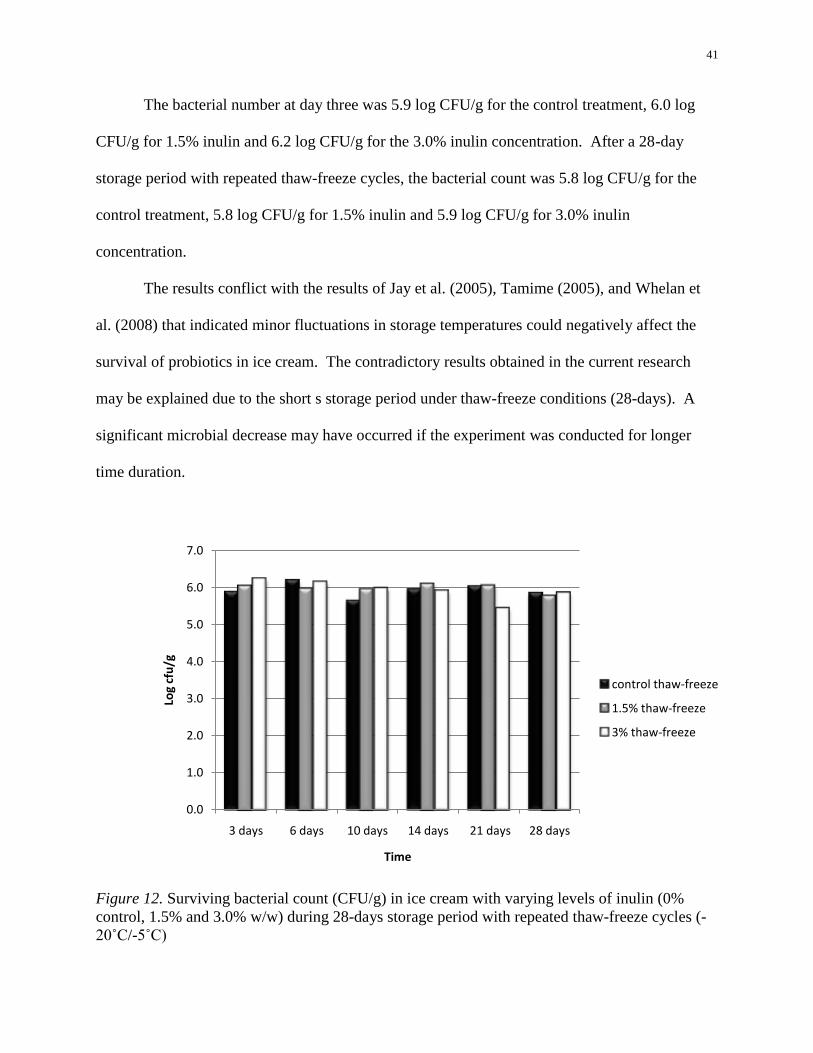
The bacterial number at day three was 5.9 log CFU/g for the control treatment, 6.0 log
CFU/g for 1.5% inulin and 6.2 log CFU/g for the 3.0% inulin concentration. After a 28-day
storage period with repeated thaw-freeze cycles, the bacterial count was 5.8 log CFU/g for the
control treatment, 5.8 log CFU/g for 1.5% inulin and 5.9 log CFU/g for 3.0% inulin
concentration.
The results conflict with the results of Jay et al. (2005), Tamime (2005), and Whelan et
al. (2008) that indicated minor fluctuations in storage temperatures could negatively affect the
survival of probiotics in ice cream. The contradictory results obtained in the current research
may be explained due to the short s storage period under thaw-freeze conditions (28-days). A
significant microbial decrease may have occurred if the experiment was conducted for longer
time duration.
Figure 12. Surviving bacterial count (CFU/g) in ice cream with varying levels of inulin (0%
control, 1.5% and 3.0% w/w) during 28-days storage period with repeated thaw-freeze cycles (-
20˚C/-5˚C)
0.0
1.0
2.0
3.0
4.0
5.0
6.0
7.0
3 days 6 days 10 days 14 days 21 days 28 days
Log
cfu
/g
Time
control thaw-freeze
1.5% thaw-freeze
3% thaw-freeze
42
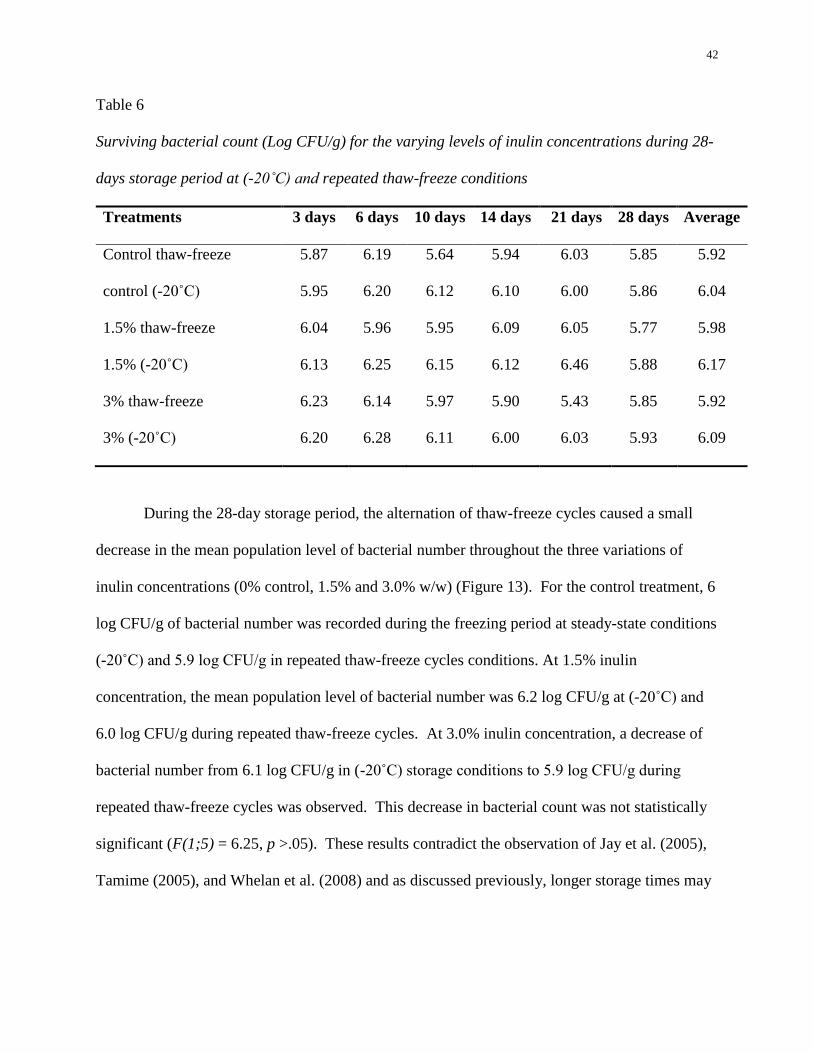
Table 6
Surviving bacterial count (Log CFU/g) for the varying levels of inulin concentrations during 28-
days storage period at (-20˚C) and repeated thaw-freeze conditions
Treatments 3 days 6 days 10 days 14 days 21 days 28 days Average
Control thaw-freeze 5.87 6.19 5.64 5.94 6.03 5.85 5.92
control (-20˚C) 5.95 6.20 6.12 6.10 6.00 5.86 6.04
1.5% thaw-freeze 6.04 5.96 5.95 6.09 6.05 5.77 5.98
1.5% (-20˚C) 6.13 6.25 6.15 6.12 6.46 5.88 6.17
3% thaw-freeze 6.23 6.14 5.97 5.90 5.43 5.85 5.92
3% (-20˚C) 6.20 6.28 6.11 6.00 6.03 5.93 6.09
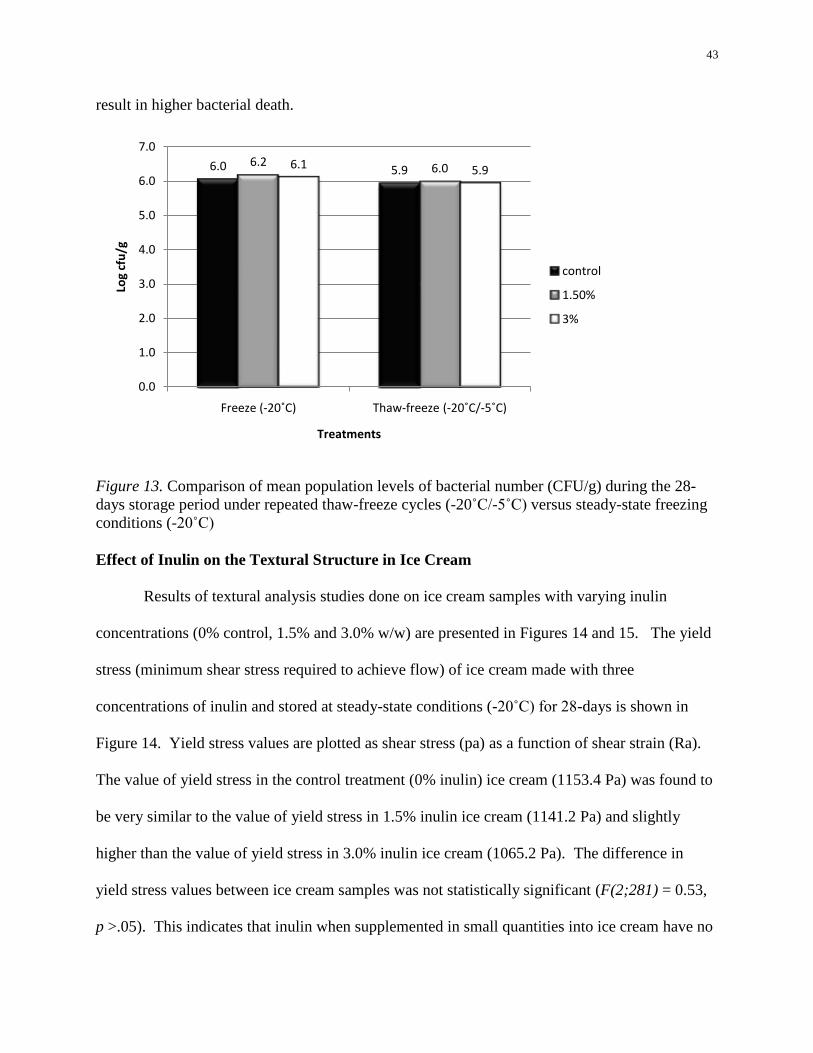
During the 28-day storage period, the alternation of thaw-freeze cycles caused a small
decrease in the mean population level of bacterial number throughout the three variations of
inulin concentrations (0% control, 1.5% and 3.0% w/w) (Figure 13). For the control treatment, 6
log CFU/g of bacterial number was recorded during the freezing period at steady-state conditions
(-20˚C) and 5.9 log CFU/g in repeated thaw-freeze cycles conditions. At 1.5% inulin
concentration, the mean population level of bacterial number was 6.2 log CFU/g at (-20˚C) and
6.0 log CFU/g during repeated thaw-freeze cycles. At 3.0% inulin concentration, a decrease of
bacterial number from 6.1 log CFU/g in (-20˚C) storage conditions to 5.9 log CFU/g during
repeated thaw-freeze cycles was observed. This decrease in bacterial count was not statistically
significant (F(1;5) = 6.25, p >.05). These results contradict the observation of Jay et al. (2005),
Tamime (2005), and Whelan et al. (2008) and as discussed previously, longer storage times may
43
result in higher bacterial death.
Figure 13. Comparison of mean population levels of bacterial number (CFU/g) during the 28-
days storage period under repeated thaw-freeze cycles (-20˚C/-5˚C) versus steady-state freezing
conditions (-20˚C)
Effect of Inulin on the Textural Structure in Ice Cream
Results of textural analysis studies done on ice cream samples with varying inulin
concentrations (0% control, 1.5% and 3.0% w/w) are presented in Figures 14 and 15. The yield
stress (minimum shear stress required to achieve flow) of ice cream made with three
concentrations of inulin and stored at steady-state conditions (-20˚C) for 28-days is shown in
Figure 14. Yield stress values are plotted as shear stress (pa) as a function of shear strain (Ra).
The value of yield stress in the control treatment (0% inulin) ice cream (1153.4 Pa) was found to
be very similar to the value of yield stress in 1.5% inulin ice cream (1141.2 Pa) and slightly
higher than the value of yield stress in 3.0% inulin ice cream (1065.2 Pa). The difference in
yield stress values between ice cream samples was not statistically significant (F(2;281) = 0.53,
p >.05). This indicates that inulin when supplemented in small quantities into ice cream have no
6.0 5.96.2 6.06.1 5.9
0.0
1.0
2.0
3.0
4.0
5.0
6.0
7.0
Freeze (-20˚C) Thaw-freeze (-20˚C/-5˚C)
Log
cfu
/g
Treatments
control
1.50%
3%
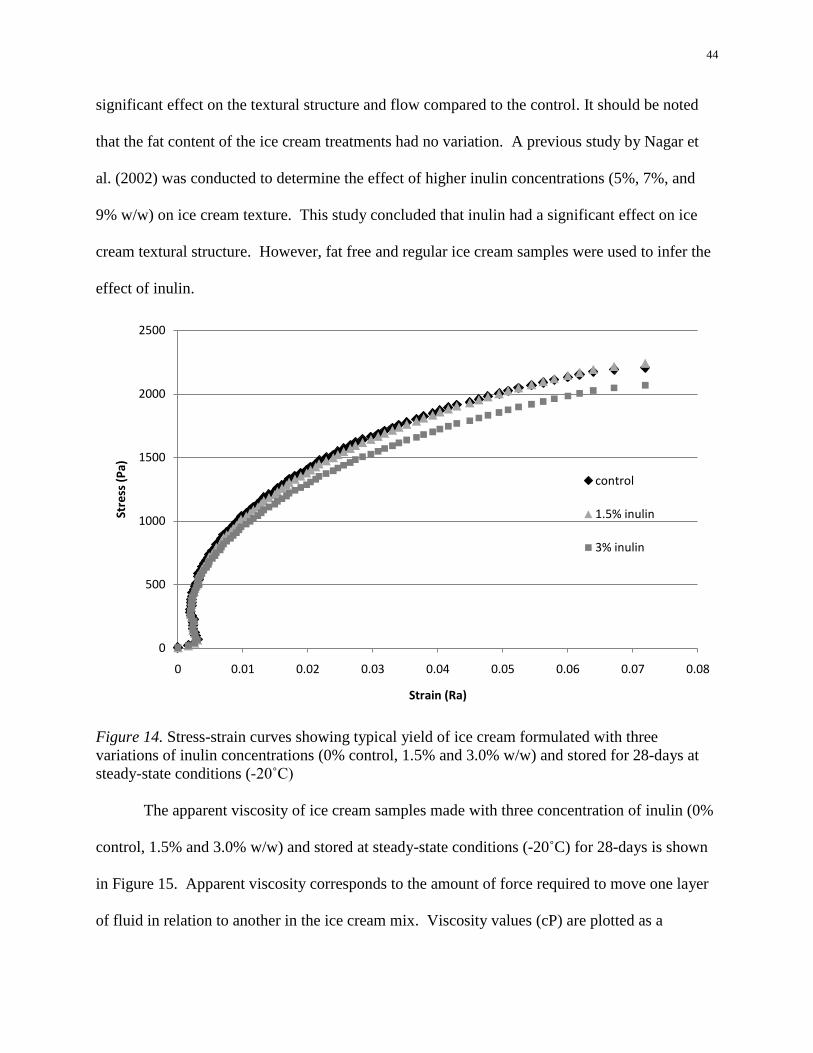
44
significant effect on the textural structure and flow compared to the control. It should be noted
that the fat content of the ice cream treatments had no variation. A previous study by Nagar et
al. (2002) was conducted to determine the effect of higher inulin concentrations (5%, 7%, and
9% w/w) on ice cream texture. This study concluded that inulin had a significant effect on ice
cream textural structure. However, fat free and regular ice cream samples were used to infer the
effect of inulin.
Figure 14. Stress-strain curves showing typical yield of ice cream formulated with three
variations of inulin concentrations (0% control, 1.5% and 3.0% w/w) and stored for 28-days at
steady-state conditions (-20˚C)
The apparent viscosity of ice cream samples made with three concentration of inulin (0%
control, 1.5% and 3.0% w/w) and stored at steady-state conditions (-20˚C) for 28-days is shown
in Figure 15. Apparent viscosity corresponds to the amount of force required to move one layer
of fluid in relation to another in the ice cream mix. Viscosity values (cP) are plotted as a
0
500
1000
1500
2000
2500
0 0.01 0.02 0.03 0.04 0.05 0.06 0.07 0.08
Stre
ss (
Pa)
Strain (Ra)
control
1.5% inulin
3% inulin
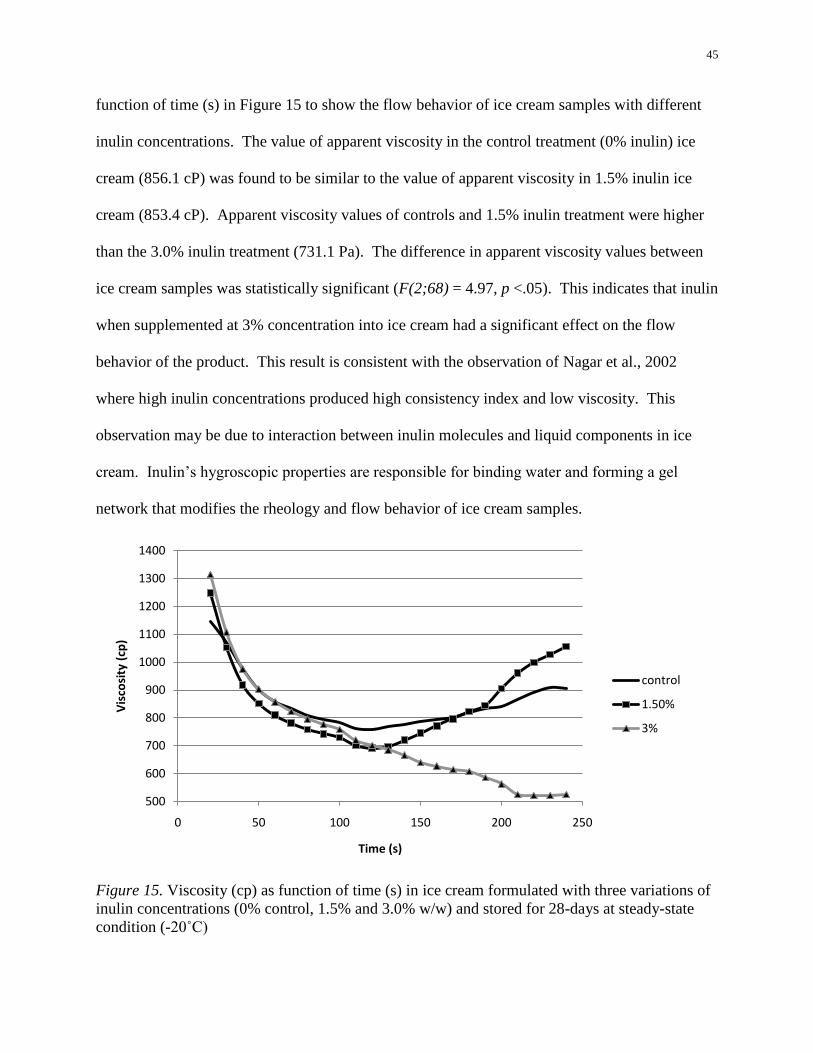
45
function of time (s) in Figure 15 to show the flow behavior of ice cream samples with different
inulin concentrations. The value of apparent viscosity in the control treatment (0% inulin) ice
cream (856.1 cP) was found to be similar to the value of apparent viscosity in 1.5% inulin ice
cream (853.4 cP). Apparent viscosity values of controls and 1.5% inulin treatment were higher
than the 3.0% inulin treatment (731.1 Pa). The difference in apparent viscosity values between
ice cream samples was statistically significant (F(2;68) = 4.97, p <.05). This indicates that inulin
when supplemented at 3% concentration into ice cream had a significant effect on the flow
behavior of the product. This result is consistent with the observation of Nagar et al., 2002
where high inulin concentrations produced high consistency index and low viscosity. This
observation may be due to interaction between inulin molecules and liquid components in ice
cream. Inulin‟s hygroscopic properties are responsible for binding water and forming a gel
network that modifies the rheology and flow behavior of ice cream samples.
Figure 15. Viscosity (cp) as function of time (s) in ice cream formulated with three variations of
inulin concentrations (0% control, 1.5% and 3.0% w/w) and stored for 28-days at steady-state
condition (-20˚C)
500
600
700
800
900
1000
1100
1200
1300
1400
0 50 100 150 200 250
Vis
cosi
ty (
cp)
Time (s)
control
1.50%
3%
46
Chapter V: Conclusion
The objective of the study was to explore the protective effect of three levels of inulin
(0% control, 1.5% and 3.0% w/w) on the survival of LAB and probiotic bacteria in ice cream
during the freezing phase. The effect was also studied throughout a 28-days storage period at
constant temperature (-20˚C) and under repeated thaw-freeze cycles (-20˚C/-5˚C). Yield stress
and viscosity analysis was conducted on the treatment samples to determine the effect of inulin
addition on the texture of ice cream.
The effect of the freezing phase on the reduction of bacterial populations in the three
variations of inulin concentration was not statistically significant (F(1;5) = 1.24, p > .05).
Bacterial enumeration during the 28-days storage period at steady-state conditions (-
20˚C) showed no significant decrease in the bacterial load during this period for all three
concentration of inulin (0% control, 1.5% and 3.0% w/w) (F(2;17)= 0.86, p >.05).
Bacterial counts during 28-days storage period under repeated thaw-freeze cycles showed
no significant decrease in the bacterial load for all three concentration of inulin (0% control,
1.5% and 3.0% w/w) (F(2;15)=0.17, p >.05)
The yield stress test of ice cream made with three concentration of inulin and stored at
steady state conditions (-20˚C) for 28-days showed no significant difference in texture between
the samples (F(2;281) = 0.53, p >.05).
The difference in apparent viscosity (cP) of ice cream samples made with three
concentration of inulin (0% control, 1.5% and 3.0% w/w) and stored at steady-state conditions (-
20˚C) for 28-days was statistically significant (F(2;68) = 4.97, p <.05). The addition of 3.0%
inulin concentration to ice cream has a significant effect on the flow behavior of the product
compared to the control (0% inulin) and 1.5% inulin.
47
Recommendations
The following suggestions are recommended for further research:
1. Evaluate the effect of inulin on the survival of LAB and probiotic bacteria using higher
concentrations not determined in this present study (> 3.0% w/w).
2. Study the survival of LAB and probiotic bacteria in ice cream for longer storage periods
not determined in this present study (> 28-days up to 1 year depending on commercial
considerations).
3. Conduct studies to determine the survival of single and mixed bacterial cultures (to
analyze synergistic interactions) in ice cream made with varying levels of inulin.
4. The current study has determined that ice cream made with varying inulin levels has no
significant textural differences. However, this finding will have a commercial
implication only after conducting sensory evaluation studies that may account for
organoleptic characteristics (appearance, flavor, body, and texture).

48
References:
Ahmed, T. & Kanwal, R. (2004). Biochemical characteristics of lactic acid producing bacteria
and preparation of camel milk cheese by using starter culture. Pakistan Veterinary
Journal, 24, 87-91
Akalin, A.S., & Erisir, D. (2008). Effects of Inulin and Oligofructose on the rheological
characteristics and probiotic culture survival in low-fat probiotic ice cream. Journal of
Food Science, 76, 184-188. doi: 10.1111/j.1750-3841.2008.00728.x
Akalin, A.S., Karagözlü, C., & Ünal, G. (2008). Rheological properties of reduced-fat and low-
fat ice creamcontaining whey protein isolate and inulin. Journal of European Food
Research and Technology, 227, 889–895. doi: 10.1007/s00217-007-0800-z
Clarke, C. (2003). The physics of ice cream. Journal of Physics education, 38, 248-253
De Leenher, L., & Hoebregs, H. (1994). Progress in the elucidation of the composition of
chicory inulin. Starch, 46, 6-193.
De Man, J.D., Rogosa, M., & Sharpe, M.E. (1960). A medium for the cultivation of Lactobacill.
Journal of Applied Bacteriology, 23, 130-135.
Dunne, C., Murphy, L., Flynn, S., O'Mahony, L., O'Halloran, S., Feeney, M. et al.( 1999).
Probiotics: from myth to reality. Demonstration of functionality in animal models of
disease and in human clinical trials. Antonie Van Leeuwenhoek, 76, 279-92 DOI:
0.1023/A:1002065931997
Durmaz, D., & Klaenhammer, T.R. (1995). A starter culture rotation strategy incorporating
paired restriction/modification and abortive infection bacteriophage defenses in a single
Lactococcus lactis strain. Journal of Applied and Environmental Microbiology, 61, 1266-
1273.
49
Food and Agriculture Organization of the United Nations (FAO; 2001). Health and nutritional
properties of probiotics in food including powder milk with live lactic acid bacteria.
Retrieved September 15, from http://www.who.int/foodsafety/publications/fs-
management /en/probiotics.pdf
Franck, A. (1993). Rafticreming: The new process allowing to turn fat into dietary fiber. Paper
presented at FIE Conference proceeding, Expoconsult Publishers, Maarssen.
Gilliland, S.E. & Walker, D.K. (1989). Acidophilus milk products: a review of potential benefits
to consumers. Journal of Dairy Science, 72, 2483–2494.
Havenaar, R., Brink, B.T., & Huis, I.V. (1992). Probiotics: The Scientific Basis, (pp. 209–224).
London: Chapman & Hall.
Jackson, L.S., & Lee, K. (1991). Microencapsulation and the food industry. Lebensmittel-
Wissenschaft+ Technologie, 24, 289-297.
Jardine, S. (2009). Ingredients Handbook Prebiotics and Probiotics, 2nd
Edition (pp. 3-24). West
Sussex: Willey-Blackwell.
Jay, J.M., Loessner, M.J., & Golden, D.A. (2005). Modern Food Microbiology, seventh Edition,
(pp. 395-409). New York: Springer Science+Business Media, Inc.
Labuza, T.P., & Schmidl, M.K. (1985). Accelerated shelf-life testing of foods. Journal of food
Technology, 39, 57-62.
Magariños, H., Selaive, S., Costa, M., Flores, M., & Pizarro, O. (2007). Viability of probiotic
microorganisms (Lactobacillus acidophilus La-5 and Bifidobacterium animalis subsp.
lactis Bb-12) in ice cream. International Journal of Dairy Technology, 60, 128-134.
Marth, E.H., & Steele, J.L. (1998). Applied Dairy Microbiology, (pp.81-109). New York: Marcel
Dekker, Inc.

50
Nagar, G.E., Clowes, G. Tudorica, C.M., Kuri, V., & Brennan, C.S. (2002). Rheological quality
and stability of yog-ice cream with added inulin. International Journal of Dairy
Technology, 55,89-93.
Niness, K.R. (1999). Inulin and Oligofructose: What Are They?. Journal of Nutrition,129, 1402-
1406.
O'Sullivan, G.C. (2001). Probiotics. British Journal of Surgery, 88, 161-162. doi:
10.1046/j.1365-2168.2001.01656.x
Ray, B. (1996). Fundamental food Microbiology (pp. 102-108). Boca Raton: CRC press LLC.
Salminem, S., & Wright, A.V. (1998). Lactic acid bacteria microbiology and functional aspects,
2nd
Edition (pp. 73-88). New York: Marcel Dekker.
Salminem, S., Wright, A.V., & Ouwehand, A. (2004). Lactic Acid Bacteria: Microbiological and
Functional Aspects, Third Edition (pp. 1-67). New York: CRC Press.
Tamime, A. (2005). Probiotic Dairy products. Ames Iowa: Blackwell Publishing ltd.
Whelan, A.P., Regand, A., Vega, C., Kerry, J.P., & Goff, H.D. (2008). Effect of trehalose on the
glass transition and ice crystal growth in ice cream. International Journal of Food
Science and Technology, 43, 510–516. doi:10.1111/j.1365-2621.2006.01484.x
Zamora, A. (2005). Carbohydrates - Chemical Structure. Retrieved from scientific psychic,
http://www.scientificpsychic.com/fitness/carbohydrates1.html.