effect of intensive diabetes therapy on the …...and new proliferative diabetic retinopathy (pdr)...
TRANSCRIPT

The Diabetes Control and Complications Trial (DCCT)/Epidemiology of Diabetes Interventions andComplications (EDIC) Research Group*
Effect of Intensive DiabetesTherapy on the Progression ofDiabetic Retinopathy in PatientsWith Type 1 Diabetes: 18 Yearsof Follow-up in the DCCT/EDICDiabetes 2015;64:631–642 | DOI: 10.2337/db14-0930
The Diabetes Control and Complications Trial (DCCT)demonstrated that a mean of 6.5 years of intensive therapyaimed at near-normal glucose levels reduced the risk ofdevelopment and progression of retinopathy by as muchas 76% compared with conventional therapy. The Epide-miology of Diabetes Interventions and Complicationsstudy (EDIC) observational follow-up showed that the riskof further progression of retinopathy 4 years after theDCCT ended was also greatly reduced in the formerintensive group, despite nearly equivalent levels of HbA1c,a phenomenon termedmetabolicmemory.Metabolicmem-ory was shown to persist through 10 years of follow-up.We now describe the risk of further progression of reti-nopathy, progression to proliferative diabetic retinopathy,clinically significant macular edema, and the need for in-tervention (photocoagulation or anti-VEGF) over 18 yearsof follow-up in EDIC. The cumulative incidence of eachretinal outcome continues to be lower in the former in-tensive group. However, the year-to-year incidence ofthese outcomes is now similar, owing in large part to a re-duction in risk in the former conventional treatment group.
In the Diabetes Control and Complications Trial (DCCT,1983–1993), intensive diabetes therapy that lowered gly-cemic levels, compared with conventional therapy, reducedthe development and progression of diabetes microvascu-lar complications in both adults (1) and adolescents (2).
Thereafter, subjects were followed observationally in theEpidemiology of Diabetes Interventions and Complica-tions study (EDIC, 1994 to present) (3). Over the first 4years of EDIC, the former DCCT intensive therapy group(INT) experienced a lower incidence of further progressionof retinopathy than did the former conventional group(CONV), despite similar HbA1c levels in both groups (4).This benefit was observed in both the adult (4) and adoles-cent (5) subsets of the DCCT. The slower progressionof retinopathy, nephropathy, and neuropathy (4,6,7) withINT versus CONV, despite similar EDIC HbA1c levels,has been called “metabolic memory.” At 10 years of EDICfollow-up, metabolic memory persisted in adults (7) but wasless apparent in the participants enrolled as adolescentsduring DCCT (8). The long-term benefit with INT is closelyassociated with lower HbA1c during the DCCT (8,9). Recentreports review the prolonged benefits of DCCT INT duringthe DCCT/EDIC (10,11), including retinopathy (12).
We now describe the progression of retinopathy overa total of 18 years of EDIC follow-up. A companion paper(13) describes the progression of nephropathy.
RESEARCH DESIGN AND METHODS
Design and SubjectsThe DCCT (1) was a randomized trial comparing theeffects of intensive versus conventional diabetes therapyon diabetes complications, including retinopathy (the
Corresponding author: John M. Lachin, [email protected].
Received 13 June 2014 and accepted 2 September 2014.
Clinical trial reg. nos. NCT00360893 and NCT00360815, clinicaltrials.gov.
This article contains Supplementary Data online at http://diabetes.diabetesjournals.org/lookup/suppl/doi:10.2337/db14-0930/-/DC1.
*A complete list of participants and industry contributors for the DCCT/EDICresearch group can be found at http://www.nejm.org/doi/full/10.1056/NEJMoa1111732.
© 2015 by the American Diabetes Association. Readers may use this article aslong as the work is properly cited, the use is educational and not for profit, andthe work is not altered.
See accompanying article, p. 341.
Diabetes Volume 64, February 2015 631
COMPLIC
ATIO
NS
DCCT primary outcome), nephropathy, and neuropathy.During 1983–1989, 1,441 subjects 13–39 years old wereenrolled (195 adolescents were at least Tanner stage II),726 subjects into the primary prevention cohort (diabetesduration 1–5 years, no retinopathy, and urinary albuminexcretion ,40 mg/day) and 715 into the secondary in-tervention cohort (1–15 years duration, early [micro-aneurysms] to mild nonproliferative retinopathy, andmicroalbumin excretion ,200 mg/day). Intensive therapy(n = 711) aimed to achieve nondiabetic levels of glycemiaas safely as possible, whereas conventional therapy (n =730) aimed to maintain clinical well-being with no specificglucose targets. DCCT follow-up included annual standardophthalmoscopic exam with measures of best-correctedvisual acuity and seven-field color stereo fundus photog-raphy every 6 months (14).
At DCCT end (1993), CONV subjects were taught andinitiated intensive diabetes therapy, and all subjects weretransferred to their own health care providers for diabetescare. In 1994, 1,375 of the 1,428 surviving subjects (96%)joined the EDIC observational study (3).
The annual EDIC evaluation included a history, phys-ical, and HbA1c, with a fasting lipid profile and urinarymicroalbumin every other year (one-half the cohort eachyear). An ophthalmologic evaluation (as during DCCT,including best-corrected visual acuity) was conductedin all participants at EDIC years 4 and 10 (1997 and2003), and on every fourth anniversary of entry intothe DCCT, e.g., 1996, 2000, etc., for a patient random-ized in 1984 (14). Photographs were graded centrallymasked to treatment assignment. The severity of retinop-athy and macular edema were assessed separately in each eyeusing the final Early Treatment Diabetic Retinopathy Study(ETDRS) scale (15).
Of the 1,375 EDIC subjects, 50 died before thescheduled ophthalmologic evaluation during EDIC years15–18, and 111 did not have the evaluation at years15–18. Outcome data were available for 1,214 EDICparticipants, 1,209 who had evaluable fundus photo-graphs completed during EDIC years 15–18 and 5 with-out photographs but known to have had prior lasertherapy. This represents 84% of the original DCCT co-hort, 92% of those surviving to years 15–18, and 88%of those enrolled in EDIC. The DCCT and the EDICprotocols were approved by the institutional reviewboards at all participating clinical sites and the Coordi-nating Center.
Statistical MethodsQuantitative or ordinal characteristics were comparedusing the Wilcoxon rank sum test and categorical variablesusing the contingency x2 test. Retinopathy outcomes werefurther three or more–step retinopathy progression (orjust “progression”) from the level at DCCT closeout, newsevere nonproliferative diabetic retinopathy (SNPDR),and new proliferative diabetic retinopathy (PDR) amongthose without SNPDR or PDR, respectively, during the
DCCT. Pan-retinal photocoagulation therapy was countedas worsening for each outcome if not previously observed.Additional outcomes included clinically significant macularedema (CSME) and either focal photocoagulation or anti-VEGF therapy.
Incidence analyses used Weibull proportional hazardsregression models for interval-censored data (16) adjustedfor baseline factors. The Weibull model was verifiedagainst the Turnbull empirical estimate (17) (see Supple-mentary Data). Natural cubic splines with 4 df generateda smoothed Turnbull estimate of the associated hazardfunction (18). P values were obtained from likelihood ra-tio tests.
Prevalence analyses were stratified by retinopathy se-verity at DCCT closeout, with a Mantel-Haenszel stratified-adjusted odds ratio estimate and test-based confidencelimits (19).
A Weibull model also assessed the effects of time-dependent covariates (20) on incidence. Mediation of thetreatment group effect was assessed by the change in thegroup effect after adjustment for a given time-dependentcovariate (21). All analyses were performed using SAS 9.3or the R-package.
RESULTS
Subject Characteristics and HbA1c
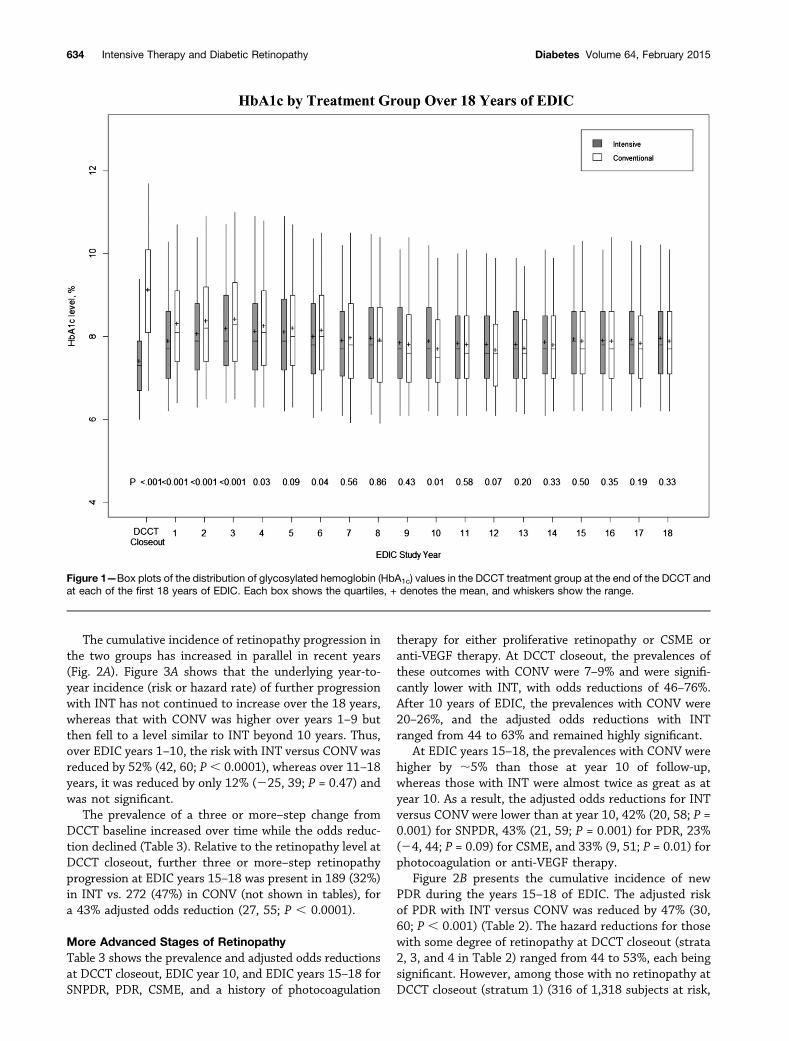
Table 1 presents the characteristics of the initially en-rolled 1,441 DCCT subjects, of the 1,423 survivors evalu-ated at the close of the DCCT, and of the 1,214 witha retinal examination during years 15–18 of EDIC. Themean age at DCCT enrollment was 27 years. At EDICyears 15–18, mean age was minimally, albeit signifi-cantly, higher in the former INT than CONV (51 vs.50 years, P = 0.015). The mean duration of diabeteswas 5.7 years at DCCT baseline and 29 years at EDICyears 15–18. The mean HbA1c at DCCT baseline was9.1% (76 mmol/mol) and at DCCT closeout was 7.2%(55 mmol/mol) in INT and 9.1% (76 mmol/mol) inCONV. Over the first few years of EDIC, the HbA1c levelin INT rose while that in CONV fell, resulting in meanlevels of ;8% (64 mmol/mol) over the years 15–18 ofEDIC. Figure 1 shows the yearly quartiles of the distri-butions of HbA1c levels over DCCT and EDIC.
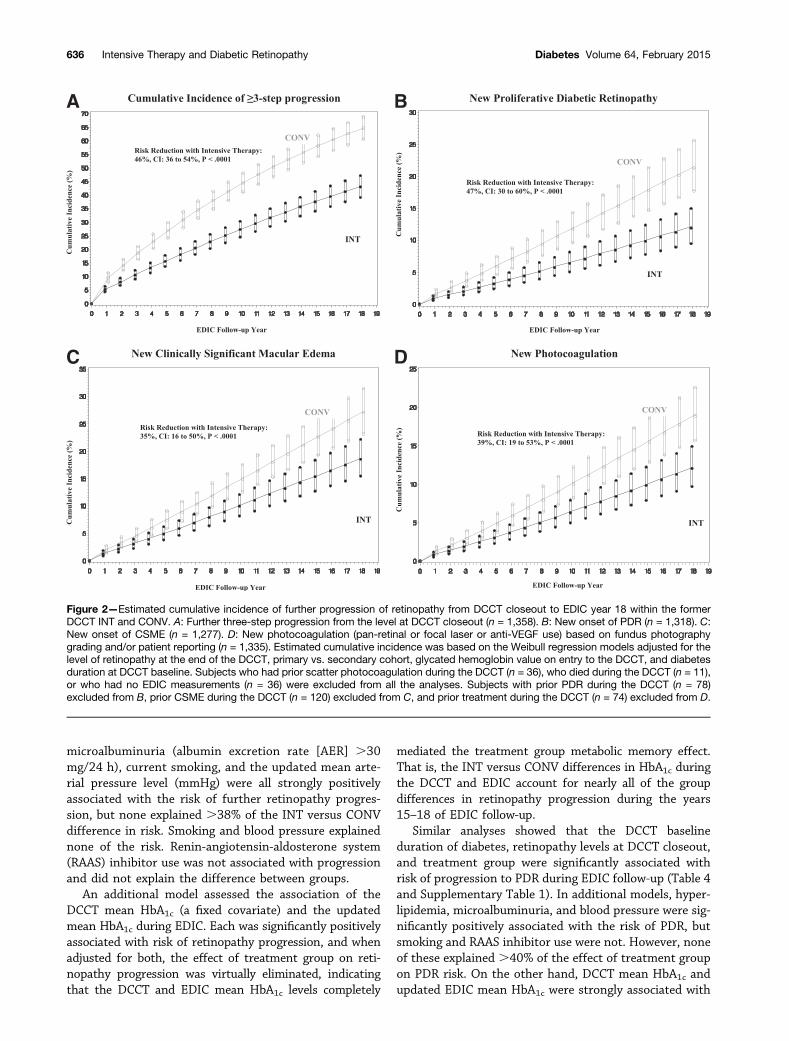
Three-Step Progression of RetinopathyDuring years 15–18 of EDIC follow-up, 39% of the 684INT subjects at risk had further progression from DCCTcloseout (incidence) vs. 56% of the 674 CONV subjects,with a 46% adjusted risk reduction (CI 36, 54; P ,0.0001) (Table 2 and Supplementary Table 1). In prioranalyses over 4 and 10 years of EDIC follow-up, the riskreductions were 71% (56, 81; P , 0.0001) and 51% (36,63; P , 0.0001) with INT, respectively. Thus, the benefi-cial effects of DCCT INT on the risk of further retinopa-thy progression have persisted for up to 18 years afterthe close of the DCCT, although with smaller effectsover time.
632 Intensive Therapy and Diabetic Retinopathy Diabetes Volume 64, February 2015
The risk reduction with INT was somewhat greater amongthose with microaneurysms alone or mild nonproliferativeretinopathy at DCCT closeout (;55%) than among
those with no retinopathy (30%), virtually all from the originalprimary prevention cohort (Table 2). However, the riskreductions within all strata were nominally significant.
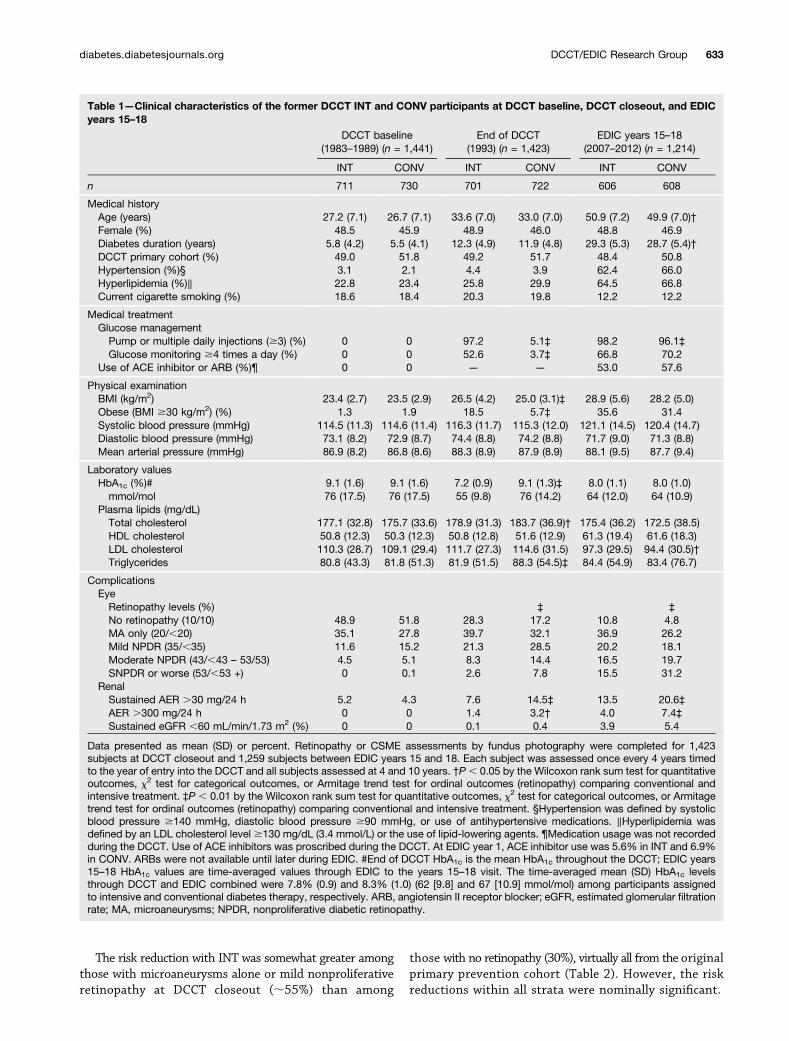
Table 1—Clinical characteristics of the former DCCT INT and CONV participants at DCCT baseline, DCCT closeout, and EDICyears 15–18
DCCT baseline(1983–1989) (n = 1,441)
End of DCCT(1993) (n = 1,423)
EDIC years 15–18(2007–2012) (n = 1,214)
INT CONV INT CONV INT CONV
n 711 730 701 722 606 608
Medical historyAge (years) 27.2 (7.1) 26.7 (7.1) 33.6 (7.0) 33.0 (7.0) 50.9 (7.2) 49.9 (7.0)†Female (%) 48.5 45.9 48.9 46.0 48.8 46.9Diabetes duration (years) 5.8 (4.2) 5.5 (4.1) 12.3 (4.9) 11.9 (4.8) 29.3 (5.3) 28.7 (5.4)†DCCT primary cohort (%) 49.0 51.8 49.2 51.7 48.4 50.8Hypertension (%)§ 3.1 2.1 4.4 3.9 62.4 66.0Hyperlipidemia (%)‖ 22.8 23.4 25.8 29.9 64.5 66.8Current cigarette smoking (%) 18.6 18.4 20.3 19.8 12.2 12.2
Medical treatmentGlucose managementPump or multiple daily injections ($3) (%) 0 0 97.2 5.1‡ 98.2 96.1‡Glucose monitoring $4 times a day (%) 0 0 52.6 3.7‡ 66.8 70.2
Use of ACE inhibitor or ARB (%)¶ 0 0 — — 53.0 57.6
Physical examinationBMI (kg/m2) 23.4 (2.7) 23.5 (2.9) 26.5 (4.2) 25.0 (3.1)‡ 28.9 (5.6) 28.2 (5.0)Obese (BMI $30 kg/m2) (%) 1.3 1.9 18.5 5.7‡ 35.6 31.4Systolic blood pressure (mmHg) 114.5 (11.3) 114.6 (11.4) 116.3 (11.7) 115.3 (12.0) 121.1 (14.5) 120.4 (14.7)Diastolic blood pressure (mmHg) 73.1 (8.2) 72.9 (8.7) 74.4 (8.8) 74.2 (8.8) 71.7 (9.0) 71.3 (8.8)Mean arterial pressure (mmHg) 86.9 (8.2) 86.8 (8.6) 88.3 (8.9) 87.9 (8.9) 88.1 (9.5) 87.7 (9.4)
Laboratory valuesHbA1c (%)# 9.1 (1.6) 9.1 (1.6) 7.2 (0.9) 9.1 (1.3)‡ 8.0 (1.1) 8.0 (1.0)mmol/mol 76 (17.5) 76 (17.5) 55 (9.8) 76 (14.2) 64 (12.0) 64 (10.9)
Plasma lipids (mg/dL)Total cholesterol 177.1 (32.8) 175.7 (33.6) 178.9 (31.3) 183.7 (36.9)† 175.4 (36.2) 172.5 (38.5)HDL cholesterol 50.8 (12.3) 50.3 (12.3) 50.8 (12.8) 51.6 (12.9) 61.3 (19.4) 61.6 (18.3)LDL cholesterol 110.3 (28.7) 109.1 (29.4) 111.7 (27.3) 114.6 (31.5) 97.3 (29.5) 94.4 (30.5)†Triglycerides 80.8 (43.3) 81.8 (51.3) 81.9 (51.5) 88.3 (54.5)‡ 84.4 (54.9) 83.4 (76.7)
ComplicationsEyeRetinopathy levels (%) ‡ ‡
No retinopathy (10/10) 48.9 51.8 28.3 17.2 10.8 4.8MA only (20/,20) 35.1 27.8 39.7 32.1 36.9 26.2Mild NPDR (35/,35) 11.6 15.2 21.3 28.5 20.2 18.1Moderate NPDR (43/,43 – 53/53) 4.5 5.1 8.3 14.4 16.5 19.7SNPDR or worse (53/,53 +) 0 0.1 2.6 7.8 15.5 31.2
RenalSustained AER .30 mg/24 h 5.2 4.3 7.6 14.5‡ 13.5 20.6‡AER .300 mg/24 h 0 0 1.4 3.2† 4.0 7.4‡Sustained eGFR ,60 mL/min/1.73 m2 (%) 0 0 0.1 0.4 3.9 5.4
Data presented as mean (SD) or percent. Retinopathy or CSME assessments by fundus photography were completed for 1,423subjects at DCCT closeout and 1,259 subjects between EDIC years 15 and 18. Each subject was assessed once every 4 years timedto the year of entry into the DCCT and all subjects assessed at 4 and 10 years. †P, 0.05 by the Wilcoxon rank sum test for quantitativeoutcomes, x2 test for categorical outcomes, or Armitage trend test for ordinal outcomes (retinopathy) comparing conventional andintensive treatment. ‡P , 0.01 by the Wilcoxon rank sum test for quantitative outcomes, x2 test for categorical outcomes, or Armitagetrend test for ordinal outcomes (retinopathy) comparing conventional and intensive treatment. §Hypertension was defined by systolicblood pressure $140 mmHg, diastolic blood pressure $90 mmHg, or use of antihypertensive medications. ‖Hyperlipidemia wasdefined by an LDL cholesterol level $130 mg/dL (3.4 mmol/L) or the use of lipid-lowering agents. ¶Medication usage was not recordedduring the DCCT. Use of ACE inhibitors was proscribed during the DCCT. At EDIC year 1, ACE inhibitor use was 5.6% in INT and 6.9%in CONV. ARBs were not available until later during EDIC. #End of DCCT HbA1c is the mean HbA1c throughout the DCCT; EDIC years15–18 HbA1c values are time-averaged values through EDIC to the years 15–18 visit. The time-averaged mean (SD) HbA1c levelsthrough DCCT and EDIC combined were 7.8% (0.9) and 8.3% (1.0) (62 [9.8] and 67 [10.9] mmol/mol) among participants assignedto intensive and conventional diabetes therapy, respectively. ARB, angiotensin II receptor blocker; eGFR, estimated glomerular filtrationrate; MA, microaneurysms; NPDR, nonproliferative diabetic retinopathy.
diabetes.diabetesjournals.org DCCT/EDIC Research Group 633
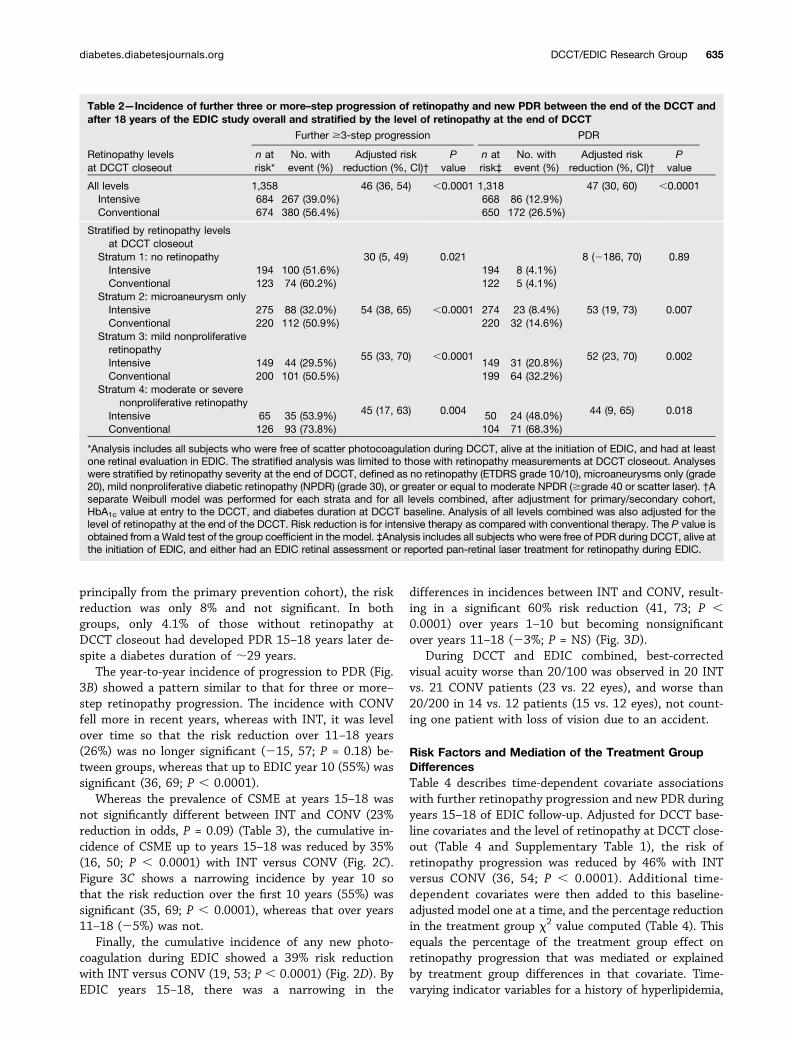
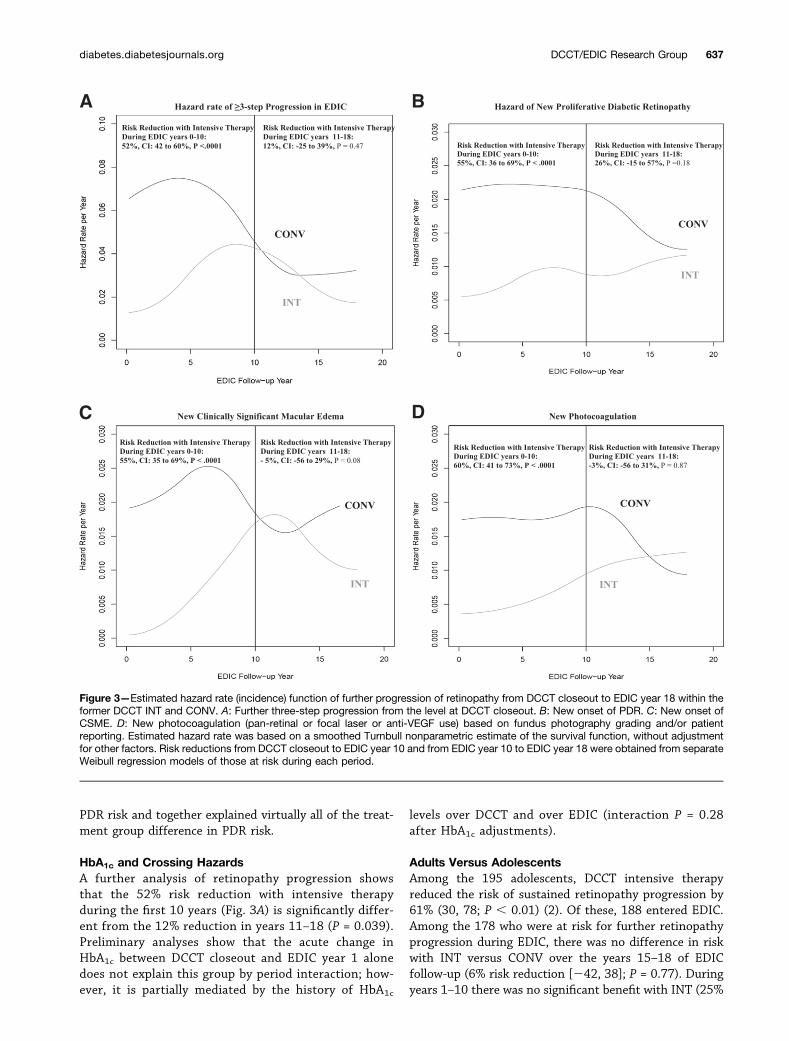
The cumulative incidence of retinopathy progression inthe two groups has increased in parallel in recent years(Fig. 2A). Figure 3A shows that the underlying year-to-year incidence (risk or hazard rate) of further progressionwith INT has not continued to increase over the 18 years,whereas that with CONV was higher over years 1–9 butthen fell to a level similar to INT beyond 10 years. Thus,over EDIC years 1–10, the risk with INT versus CONV wasreduced by 52% (42, 60; P, 0.0001), whereas over 11–18years, it was reduced by only 12% (225, 39; P = 0.47) andwas not significant.
The prevalence of a three or more–step change fromDCCT baseline increased over time while the odds reduc-tion declined (Table 3). Relative to the retinopathy level atDCCT closeout, further three or more–step retinopathyprogression at EDIC years 15–18 was present in 189 (32%)in INT vs. 272 (47%) in CONV (not shown in tables), fora 43% adjusted odds reduction (27, 55; P , 0.0001).
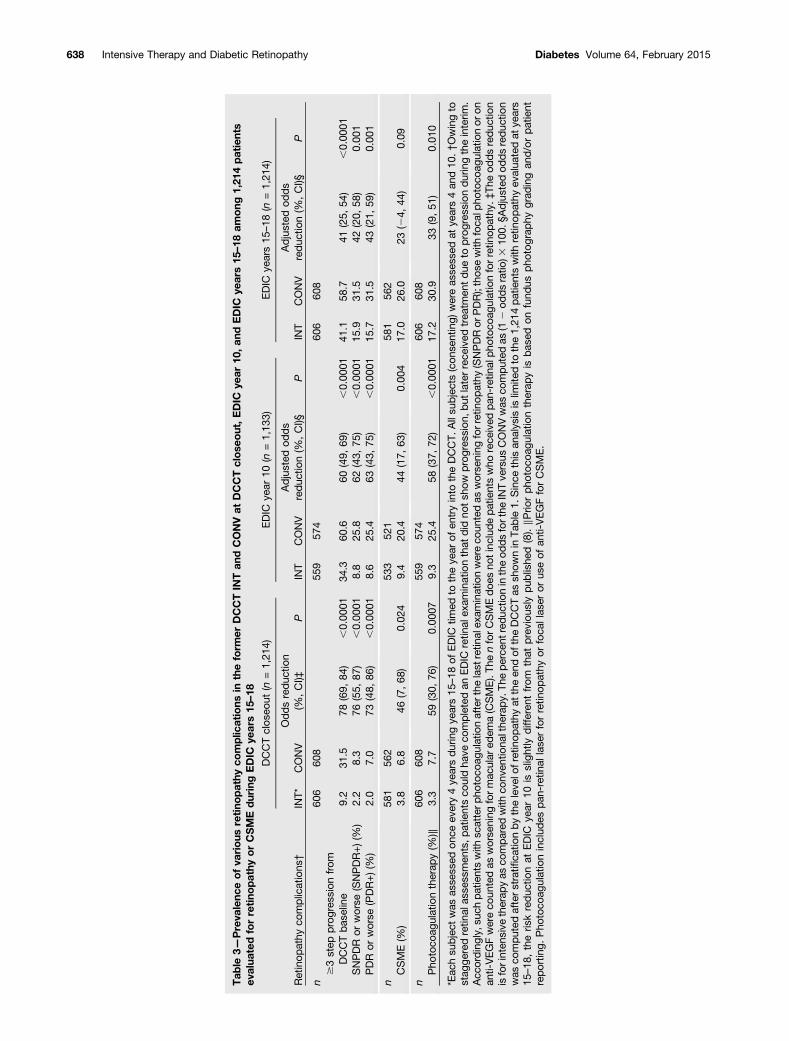
More Advanced Stages of RetinopathyTable 3 shows the prevalence and adjusted odds reductionsat DCCT closeout, EDIC year 10, and EDIC years 15–18 forSNPDR, PDR, CSME, and a history of photocoagulation
therapy for either proliferative retinopathy or CSME oranti-VEGF therapy. At DCCT closeout, the prevalences ofthese outcomes with CONV were 7–9% and were signifi-cantly lower with INT, with odds reductions of 46–76%.After 10 years of EDIC, the prevalences with CONV were20–26%, and the adjusted odds reductions with INTranged from 44 to 63% and remained highly significant.
At EDIC years 15–18, the prevalences with CONV werehigher by ;5% than those at year 10 of follow-up,whereas those with INT were almost twice as great as atyear 10. As a result, the adjusted odds reductions for INTversus CONV were lower than at year 10, 42% (20, 58; P =0.001) for SNPDR, 43% (21, 59; P = 0.001) for PDR, 23%(24, 44; P = 0.09) for CSME, and 33% (9, 51; P = 0.01) forphotocoagulation or anti-VEGF therapy.
Figure 2B presents the cumulative incidence of newPDR during the years 15–18 of EDIC. The adjusted riskof PDR with INT versus CONV was reduced by 47% (30,60; P , 0.001) (Table 2). The hazard reductions for thosewith some degree of retinopathy at DCCT closeout (strata2, 3, and 4 in Table 2) ranged from 44 to 53%, each beingsignificant. However, among those with no retinopathy atDCCT closeout (stratum 1) (316 of 1,318 subjects at risk,
Figure 1—Box plots of the distribution of glycosylated hemoglobin (HbA1c) values in the DCCT treatment group at the end of the DCCT andat each of the first 18 years of EDIC. Each box shows the quartiles, + denotes the mean, and whiskers show the range.
634 Intensive Therapy and Diabetic Retinopathy Diabetes Volume 64, February 2015
principally from the primary prevention cohort), the riskreduction was only 8% and not significant. In bothgroups, only 4.1% of those without retinopathy atDCCT closeout had developed PDR 15–18 years later de-spite a diabetes duration of ;29 years.
The year-to-year incidence of progression to PDR (Fig.3B) showed a pattern similar to that for three or more–step retinopathy progression. The incidence with CONVfell more in recent years, whereas with INT, it was levelover time so that the risk reduction over 11–18 years(26%) was no longer significant (215, 57; P = 0.18) be-tween groups, whereas that up to EDIC year 10 (55%) wassignificant (36, 69; P , 0.0001).
Whereas the prevalence of CSME at years 15–18 wasnot significantly different between INT and CONV (23%reduction in odds, P = 0.09) (Table 3), the cumulative in-cidence of CSME up to years 15–18 was reduced by 35%(16, 50; P , 0.0001) with INT versus CONV (Fig. 2C).Figure 3C shows a narrowing incidence by year 10 sothat the risk reduction over the first 10 years (55%) wassignificant (35, 69; P , 0.0001), whereas that over years11–18 (25%) was not.
Finally, the cumulative incidence of any new photo-coagulation during EDIC showed a 39% risk reductionwith INT versus CONV (19, 53; P , 0.0001) (Fig. 2D). ByEDIC years 15–18, there was a narrowing in the
differences in incidences between INT and CONV, result-ing in a significant 60% risk reduction (41, 73; P ,0.0001) over years 1–10 but becoming nonsignificantover years 11–18 (23%; P = NS) (Fig. 3D).
During DCCT and EDIC combined, best-correctedvisual acuity worse than 20/100 was observed in 20 INTvs. 21 CONV patients (23 vs. 22 eyes), and worse than20/200 in 14 vs. 12 patients (15 vs. 12 eyes), not count-ing one patient with loss of vision due to an accident.
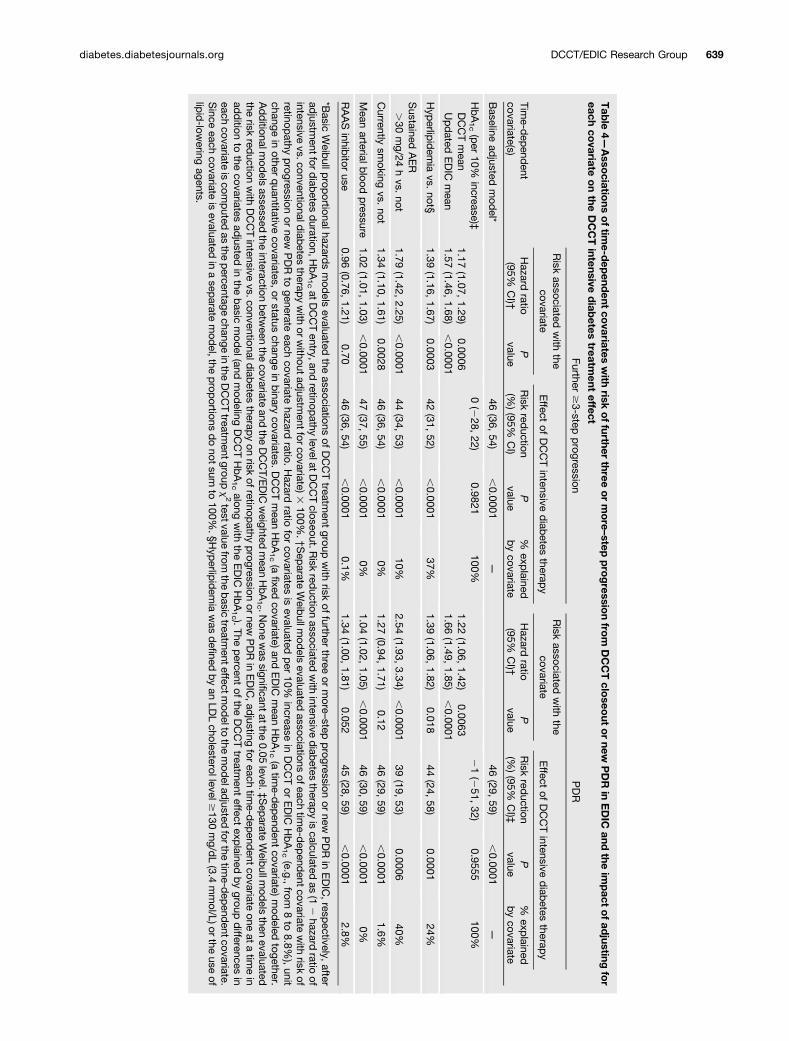
Risk Factors and Mediation of the Treatment GroupDifferencesTable 4 describes time-dependent covariate associationswith further retinopathy progression and new PDR duringyears 15–18 of EDIC follow-up. Adjusted for DCCT base-line covariates and the level of retinopathy at DCCT close-out (Table 4 and Supplementary Table 1), the risk ofretinopathy progression was reduced by 46% with INTversus CONV (36, 54; P , 0.0001). Additional time-dependent covariates were then added to this baseline-adjusted model one at a time, and the percentage reductionin the treatment group x2 value computed (Table 4). Thisequals the percentage of the treatment group effect onretinopathy progression that was mediated or explainedby treatment group differences in that covariate. Time-varying indicator variables for a history of hyperlipidemia,
Table 2—Incidence of further three or more–step progression of retinopathy and new PDR between the end of the DCCT andafter 18 years of the EDIC study overall and stratified by the level of retinopathy at the end of DCCT
Retinopathy levelsat DCCT closeout
Further $3-step progression PDR
n atrisk*
No. withevent (%)
Adjusted riskreduction (%, CI)†
Pvalue
n atrisk‡
No. withevent (%)
Adjusted riskreduction (%, CI)†
Pvalue
All levels 1,358 46 (36, 54) ,0.0001 1,318 47 (30, 60) ,0.0001Intensive 684 267 (39.0%) 668 86 (12.9%)Conventional 674 380 (56.4%) 650 172 (26.5%)
Stratified by retinopathy levelsat DCCT closeout
Stratum 1: no retinopathy 30 (5, 49) 0.021 8 (2186, 70) 0.89Intensive 194 100 (51.6%) 194 8 (4.1%)Conventional 123 74 (60.2%) 122 5 (4.1%)
Stratum 2: microaneurysm only54 (38, 65) ,0.0001 53 (19, 73) 0.007Intensive 275 88 (32.0%) 274 23 (8.4%)
Conventional 220 112 (50.9%) 220 32 (14.6%)Stratum 3: mild nonproliferative
retinopathy55 (33, 70) ,0.0001 52 (23, 70) 0.002
Intensive 149 44 (29.5%) 149 31 (20.8%)Conventional 200 101 (50.5%) 199 64 (32.2%)
Stratum 4: moderate or severenonproliferative retinopathy
45 (17, 63) 0.004 44 (9, 65) 0.018Intensive 65 35 (53.9%) 50 24 (48.0%)Conventional 126 93 (73.8%) 104 71 (68.3%)
*Analysis includes all subjects who were free of scatter photocoagulation during DCCT, alive at the initiation of EDIC, and had at leastone retinal evaluation in EDIC. The stratified analysis was limited to those with retinopathy measurements at DCCT closeout. Analyseswere stratified by retinopathy severity at the end of DCCT, defined as no retinopathy (ETDRS grade 10/10), microaneurysms only (grade20), mild nonproliferative diabetic retinopathy (NPDR) (grade 30), or greater or equal to moderate NPDR ($grade 40 or scatter laser). †Aseparate Weibull model was performed for each strata and for all levels combined, after adjustment for primary/secondary cohort,HbA1c value at entry to the DCCT, and diabetes duration at DCCT baseline. Analysis of all levels combined was also adjusted for thelevel of retinopathy at the end of the DCCT. Risk reduction is for intensive therapy as compared with conventional therapy. The P value isobtained from aWald test of the group coefficient in the model. ‡Analysis includes all subjects who were free of PDR during DCCT, alive atthe initiation of EDIC, and either had an EDIC retinal assessment or reported pan-retinal laser treatment for retinopathy during EDIC.
diabetes.diabetesjournals.org DCCT/EDIC Research Group 635
microalbuminuria (albumin excretion rate [AER] .30mg/24 h), current smoking, and the updated mean arte-rial pressure level (mmHg) were all strongly positivelyassociated with the risk of further retinopathy progres-sion, but none explained .38% of the INT versus CONVdifference in risk. Smoking and blood pressure explainednone of the risk. Renin-angiotensin-aldosterone system(RAAS) inhibitor use was not associated with progressionand did not explain the difference between groups.
An additional model assessed the association of theDCCT mean HbA1c (a fixed covariate) and the updatedmean HbA1c during EDIC. Each was significantly positivelyassociated with risk of retinopathy progression, and whenadjusted for both, the effect of treatment group on reti-nopathy progression was virtually eliminated, indicatingthat the DCCT and EDIC mean HbA1c levels completely
mediated the treatment group metabolic memory effect.That is, the INT versus CONV differences in HbA1c duringthe DCCT and EDIC account for nearly all of the groupdifferences in retinopathy progression during the years15–18 of EDIC follow-up.
Similar analyses showed that the DCCT baselineduration of diabetes, retinopathy levels at DCCT closeout,and treatment group were significantly associated withrisk of progression to PDR during EDIC follow-up (Table 4and Supplementary Table 1). In additional models, hyper-lipidemia, microalbuminuria, and blood pressure were sig-nificantly positively associated with the risk of PDR, butsmoking and RAAS inhibitor use were not. However, noneof these explained .40% of the effect of treatment groupon PDR risk. On the other hand, DCCT mean HbA1c andupdated EDIC mean HbA1c were strongly associated with
Figure 2—Estimated cumulative incidence of further progression of retinopathy from DCCT closeout to EDIC year 18 within the formerDCCT INT and CONV. A: Further three-step progression from the level at DCCT closeout (n = 1,358). B: New onset of PDR (n = 1,318). C:New onset of CSME (n = 1,277). D: New photocoagulation (pan-retinal or focal laser or anti-VEGF use) based on fundus photographygrading and/or patient reporting (n = 1,335). Estimated cumulative incidence was based on the Weibull regression models adjusted for thelevel of retinopathy at the end of the DCCT, primary vs. secondary cohort, glycated hemoglobin value on entry to the DCCT, and diabetesduration at DCCT baseline. Subjects who had prior scatter photocoagulation during the DCCT (n = 36), who died during the DCCT (n = 11),or who had no EDIC measurements (n = 36) were excluded from all the analyses. Subjects with prior PDR during the DCCT (n = 78)excluded from B, prior CSME during the DCCT (n = 120) excluded from C, and prior treatment during the DCCT (n = 74) excluded from D.
636 Intensive Therapy and Diabetic Retinopathy Diabetes Volume 64, February 2015
PDR risk and together explained virtually all of the treat-ment group difference in PDR risk.
HbA1c and Crossing HazardsA further analysis of retinopathy progression showsthat the 52% risk reduction with intensive therapyduring the first 10 years (Fig. 3A) is significantly differ-ent from the 12% reduction in years 11–18 (P = 0.039).Preliminary analyses show that the acute change inHbA1c between DCCT closeout and EDIC year 1 alonedoes not explain this group by period interaction; how-ever, it is partially mediated by the history of HbA1c
levels over DCCT and over EDIC (interaction P = 0.28after HbA1c adjustments).
Adults Versus AdolescentsAmong the 195 adolescents, DCCT intensive therapyreduced the risk of sustained retinopathy progression by61% (30, 78; P , 0.01) (2). Of these, 188 entered EDIC.Among the 178 who were at risk for further retinopathyprogression during EDIC, there was no difference in riskwith INT versus CONV over the years 15–18 of EDICfollow-up (6% risk reduction [242, 38]; P = 0.77). Duringyears 1–10 there was no significant benefit with INT (25%
Figure 3—Estimated hazard rate (incidence) function of further progression of retinopathy from DCCT closeout to EDIC year 18 within theformer DCCT INT and CONV. A: Further three-step progression from the level at DCCT closeout. B: New onset of PDR. C: New onset ofCSME. D: New photocoagulation (pan-retinal or focal laser or anti-VEGF use) based on fundus photography grading and/or patientreporting. Estimated hazard rate was based on a smoothed Turnbull nonparametric estimate of the survival function, without adjustmentfor other factors. Risk reductions from DCCT closeout to EDIC year 10 and from EDIC year 10 to EDIC year 18 were obtained from separateWeibull regression models of those at risk during each period.
diabetes.diabetesjournals.org DCCT/EDIC Research Group 637
Tab
le3—
Preva
lenc
eofva
rious
retino
pathy
complic
ations
intheform
erDCCTIN
Tan
dCONVat
DCCTclose
out,EDIC
year
10,an
dEDIC
years15
–18
among
1,21
4patients
evalua
tedforretino
pathy
orCSMEduringEDIC
years15
–18
DCCTclos
eout
(n=1,21
4)EDIC
year
10(n
=1,13
3)EDIC
years15
–18
(n=1,21
4)
Retinop
athy
complications
†INT*
CONV
Oddsreduc
tion
(%,CI)‡
PINT
CONV
Adjusted
odds
redu
ction(%
,CI)§
PINT
CONV
Adjusted
odds
reduc
tion(%
,CI)§
P
n60
660
855
957
460
660
8$3step
progres
sion
from
DCCTbas
eline
9.2
31.5
78(69,
84)
,0.00
0134
.360
.660
(49,
69)
,0.00
0141
.158
.741
(25,
54)
,0.00
01SNPDR
orworse
(SNPDR+)(%
)2.2
8.3
76(55,
87)
,0.00
018.8
25.8
62(43,
75)
,0.00
0115
.931
.542
(20,
58)
0.00
1PDR
orworse
(PDR+)(%
)2.0
7.0
73(48,
86)
,0.00
018.6
25.4
63(43,
75)
,0.00
0115
.731
.543
(21,
59)
0.00
1
n58
156
253
352
158
156
2CSME(%
)3.8
6.8
46(7,68
)0.02
49.4
20.4
44(17,
63)
0.00
417
.026
.023
(24,
44)
0.09
n60
660
855
957
460
660
8Pho
toco
agulationtherap
y(%
)‖3.3
7.7
59(30,
76)
0.00
079.3
25.4
58(37,
72)
,0.00
0117
.230
.933
(9,51
)0.01
0
*Eac
hsu
bject
was
asse
ssed
once
every4ye
arsduringye
ars15
–18
ofEDIC
timed
totheye
arof
entryinto
theDCCT.
Allsu
bjects(con
senting)
wereas
sessed
atye
ars4an
d10
.†Owingto
stag
geredretin
alas
sessmen
ts,p
atientsco
uldha
veco
mpletedan
EDIC
retin
alex
aminationthat
did
notsh
owprog
ression,
but
laterrece
ived
trea
tmen
tdu
eto
progres
sion
duringtheinterim
.Acc
ordingly,
such
patientswith
scatterp
hotoco
agulationafterthe
last
retin
alex
aminationwereco
untedas
worse
ning
forretinop
athy
(SNPDRor
PDR);thos
ewith
foca
lpho
toco
agulationor
onan
ti-VEGFwereco
untedas
worse
ning
formac
ular
edem
a(CSME).Th
enforCSMEdoe
sno
tinc
ludepatientswho
rece
ived
pan
-retinal
pho
toco
agulationforretin
opathy
.‡Th
eod
dsreduc
tion
isforinten
sive
therap
yas
compared
with
conv
entio
nalthe
rapy.
Theperce
ntredu
ctionin
theod
dsforthe
INTve
rsus
CONVwas
computed
as(1
2od
dsratio
)310
0.§A
djusted
oddsreduc
tion
was
computed
afterstratifi
catio
nby
theleve
lofretinop
athy
attheen
dof
theDCCTas
show
nin
Table
1.Since
thisan
alysisislim
itedto
the1,21
4patientswith
retin
opathy
evalua
tedat
years
15–18
,theris
kreduc
tionat
EDIC
year
10is
slightly
differen
tfrom
that
prev
ious
lypub
lishe
d(8).‖P
riorph
otoc
oagu
latio
ntherap
yis
bas
edon
fund
uspho
tograp
hygrad
ingan
d/or
patient
repo
rting.
Pho
toco
agulationinclud
espan
-retinal
lase
rforretin
opathy
orfoca
llas
eror
useof
anti-VEGFforCSME.
638 Intensive Therapy and Diabetic Retinopathy Diabetes Volume 64, February 2015
Tab
le4—
Asso
ciations
oftim
e-dep
endent
covariates
with
riskoffurther
threeormore–step
progressio
nfro
mDCCTclo
seout
ornew
PDR
inEDIC
andthe
impact
ofad
justingfor
eachco
variateonthe
DCCTintensive
diab
etestreatm
enteffect
Time-d
epend
entcovariate(s)
Further$3-step
progression
PDR
Risk
associatedwith
thecovariate
Effect
ofDCCTintensive
diab
etestherap
yRisk
associatedwith
thecovariate
Effect
ofDCCTintensive
diab
etestherap
y
Hazard
ratio(95%
CI)†
Pvalue
Risk
reduction
(%)(95%
CI)
Pvalue
%exp
lainedbycovariate
Hazard
ratio(95%
CI)†
Pvalue
Risk
reduction
(%)(95%
CI)‡
Pvalue
%exp
lainedbycovariate
Baseline
adjusted
mod
el*46
(36,54)
,0.0001
—46
(29,59)
,0.0001
—
HbA1c(per
10%increase)‡
0(2
28,22)
0.9821100%
21(2
51,32)
0.9555100%
DCCTmean
1.17(1.07,
1.29)0.0006
1.22(1.06,
1.42)0.0063
Updated
EDIC
mean
1.57(1.46,
1.68),0.0001
1.66(1.49,
1.85),0.0001
Hyp
erlipidem
iavs.
not§1.39
(1.16,1.67)
0.000342
(31,52)
,0.0001
37%1.39
(1.06,1.82)
0.01844
(24,58)
0.000124%
Sustained
AER
.30
mg/24
hvs.
not1.79
(1.42,2.25)
,0.0001
44(34,
53),0.0001
10%2.54
(1.93,3.34)
,0.0001
39(19,
53)0.0006
40%
Currently
smoking
vs.not
1.34(1.10,
1.61)0.0028
46(36,
54),0.0001
0%1.27
(0.94,1.71)
0.1246
(29,59)
,0.0001
1.6%
Mean
arterialblood
pressure
1.02(1.01,
1.03),0.0001
47(37,
55),0.0001
0%1.04
(1.02,1.05)
,0.0001
46(30,
59),0.0001
0%
RAASinhib
itoruse
0.96(0.76,
1.21)0.70
46(36,
54),0.0001
0.1%1.34
(1.00,1.81)
0.05245
(28,59)
,0.0001
2.8%
*Basic
Weib
ullprop
ortionalhazardsmod
elsevaluated
theassociations
ofDCCTtreatm
entgroup
with
riskof
furtherthree
ormore
–stepprogression
ornew
PDRin
EDIC,resp
ectively,afterad
justmentfor
diab
etesduration,H
bA1catD
CCTentry,and
retinopathy
levelatDCCTcloseout.R
iskred
uctionassociated
with
intensivediab
etestherap
yiscalculated
as(1
2hazard
ratioof
intensivevs.conventionald
iabetes
therapywith
orwithoutad
justmentforcovariate)3
100%.†S
eparate
Weib
ullmod
elsevaluated
associationsofeach
time-d
epend
entcovariatewith
riskof
retinopathy
progression
ornew
PDRto
generateeach
covariatehazard
ratio.Hazard
ratiofor
covariatesis
evaluatedper
10%increase
inDCCTor
EDIC
HbA1c(e.g.,
from8to
8.8%),unit
changein
otherquantitative
covariates,orstatus
changein
binary
covariates.DCCTmean
HbA1c(a
fixedcovariate)and
EDIC
mean
HbA1c(a
time-d
epend
entcovariate)m
odeled
together.Additionalm
odels
assessedthe
interactionbetw
eenthe
covariateand
theDCCT/E
DIC
weighted
mean
HbA1c .N
onewas
significantatthe0.05
level.‡S
eparate
Weib
ullmod
elsthen
evaluatedthe
riskred
uctionwith
DCCTintensive
vs.conventionaldiab
etestherap
yon
riskofretinop
athyprogression
ornew
PDRin
EDIC,ad
justingfor
eachtim
e-dep
endent
covariateone
atatim
ein
addition
tothe
covariatesad
justedin
thebasic
mod
el(andmod
elingDCCTHbA1calong
with
theEDIC
HbA1c ).
Thepercent
ofthe
DCCTtreatm
enteffect
explained
bygroup
differences
ineach
covariateiscom
puted
asthe
percentage
changeinthe
DCCTtreatm
entgroupx2testvalue
fromthe
basic
treatmenteffectm
odelto
themod
eladjusted
forthetim
e-dep
endentcovariate.
Since
eachcovariate
isevaluated
inasep
aratemod
el,theprop
ortionsdonot
sumto
100%.§H
yperlip
idemia
was
defined
byan
LDLcholesterollevel
$130
mg/d
L(3.4
mmol/L)or
theuse
oflip
id-low
eringagents.
diabetes.diabetesjournals.org DCCT/EDIC Research Group 639
risk reduction [222, 64]; P = 0.25), and likewise overyears 11–18 there was no benefit (79% risk increase[224, 316]; P = 0.19). Among the 1,195 adults who en-tered EDIC, over the 18 years there was a significant 52%risk reduction with INT versus CONV (42, 60; P, 0.001),with a significant benefit during years 1–10 (56% [46, 64];P , 0.001) but a lesser nonsignificant benefit duringyears 11–18 (27% [29, 51]; P = 0.13).
Model ValidationThe Supplementary Data demonstrates good agreementof the model-based versus model-free Turnbull (17)estimates.
DISCUSSION
Long-term follow-up for 15–18 years beyond the DCCTdemonstrates a persistent beneficial effect of the initialmean of 6.5 years of DCCT intensive versus conventionaltherapy on retinopathy progression by three or moresteps on the ETDRS scale, PDR, CSME, and photocoagu-lation or anti-VEGF therapy for retinopathy or CSME. Foreach outcome, the cumulative incidence function throughyears 15–18 was significantly lower in the former INTthan CONV (Fig. 2). Thus, fewer former INT participantscontinue to be affected by these retinal complications 18years after the close of the DCCT.
However, the risk reductions (hazard ratios) for theseoutcomes over 15–18 years of follow-up in the formerINT versus CONV are less than previously reported. Dur-ing the DCCT, the risk of retinopathy progression wasreduced by 73% (95% CI 63, 80; P , 0.0001) with in-tensive versus conventional therapy (1). Among the 1,214subjects with years 15–18 outcomes, the odds (preva-lence) of further retinopathy progression from the levelat DCCT closeout, adjusted for the closeout level, wasreduced by 74% (65, 81; P , 0.0001) at EDIC year 4,and 59% (47, 68; P , 0.0001) at EDIC year 10, withintensive versus conventional therapy. At EDIC years15–18, the adjusted odds of progression was reduced by43% (27, 55; P , 0.0001). Previously reported resultsdiffer slightly, owing to larger sample sizes therein (4,8).
In addition, the year-to-year incidence (hazard rate) ofnew cases per year has narrowed for each outcome and isnow similar within the original treatment groups beyondEDIC year 10. In fact, the risk reduction with formerintensive therapy beyond year 10 is no longer statisticallysignificant for any outcome (Fig. 3). As a result, the groupdifferences in the prevalence of having a worse outcome atyears 15–18 are less than previously observed. The preva-lence of CSME was not significantly different (Table 3).
These findings are largely a function of a decliningincidence in the former CONV beyond year 10, combinedin some outcomes with an increasing incidence in the INT.Interestingly, for no retinal outcome was the narrowing ofthe difference in risk attributable solely to increasingincidence in the INT, although such an increase wassuggested for CSME (Fig. 3C).
Since the HbA1c in the former INT rose from ;7%(53 mmol/mol) at DCCT closeout to ;8% (64 mmol/mol)during EDIC, some rise in the incidence of further pro-gression would be expected in this group during EDIC.However, for the most part, the incidence in the INTremained low and relatively level for most retinal out-comes. This is perhaps the major manifestation of themetabolic memory phenomenon.
Similarly, since the HbA1c in the former CONV fell from;9 to 8% (75 to 64 mmol/mol), some fall in the incidenceof further progression would be expected. However, thisexpected fall, or the metabolic memory effect, was delayeduntil about 10 years after the close of the DCCT. Thisdelay is analogous to the original effects of lowering gly-cemia with intensive therapy during the DCCT. Despitethe rapid reduction of HbA1c from ;9% (75 mmol/mol)to 7% (53 mmol/mol) during the first 6 months of theDCCT, there was virtually no difference in risk of retinop-athy progression for the first 5 years of treatment. So thereduced incidence in the CONV later in EDIC follow-upcould simply be another manifestation of the metabolicmemory associated having a lower HbA1c by ;1% (10.9mmol/mol) during EDIC than during the DCCT.
Although baseline factors and other factors measuredover time including hyperlipidemia, microalbuminuria,smoking, and blood pressure (but not RAAS inhibitoruse) were significantly associated with retinopathy pro-gression and progression to PDR, treatment group differ-ences in these factors failed to account for or mediatethe treatment group difference in risk of progression.Rather, as consistently observed in the past, the level ofHbA1c during DCCT and EDIC explains virtually all of thetreatment group effects on risk of progression.
During the DCCT, the mean HbA1c among the 195subjects who entered as adolescents was significantlygreater than that among the 1,246 adults within theINT (8.1 vs. 7.1%, 65 vs. 54 mmol/mol) and the CONV(9.8 vs. 9.0%, 84 vs. 75 mmol/mol) (each P , 0.001),resulting in a similar ;2% (21 mmol/mol) difference inHbA1c in adults and adolescents. As a result, the reductionin the risk of retinopathy progression with intensive ther-apy was similar among adolescents (61% risk reduction)as in adults (63% risk reduction) (2). Among the 141original adolescents assessed at year 4 of EDIC, the 77%odds reduction of retinopathy progression at year 4 (prev-alence) with intensive therapy was similar to that ob-served in the full cohort (75%) (5). However, at year 10,among the 96 original adolescents evaluated and still atrisk, there was only a 10% odds reduction (prevalence)with intensive versus conventional therapy (2104, 60;P = 0.84), whereas a significant benefit was observedamong adults. Although the difference in metabolic mem-ory effect among adults versus adolescents at 10 yearsappears to be explained by the higher HbA1c duringDCCT among adolescents, interpreting the results in theformer adolescent subset must be tempered by the rela-tively small numbers of subjects.
640 Intensive Therapy and Diabetic Retinopathy Diabetes Volume 64, February 2015
Although the risk of new CSME was also reducedsignificantly by 35% over the total 18 years of EDIC, therewas a smaller, nonsignificant difference in the prevalenceof CSME at the years 15–18 evaluations. Further follow-up is needed to determine whether the former intensivetreatment group will continue to enjoy a reduced risk ofthis outcome.
Another recent paper (13) describes similar analyses ofalbuminuria and renal function (estimated glomerular fil-tration rate) over 18 years of EDIC and showed nearlyidentical results. For each outcome, the groups continueto differ but the cumulative incidences are now increasingnearly in parallel. The underlying risks (hazard rates) inthe former INT remain low and level over the 18 years,whereas those in the CONV are higher for the first 10years but then drop after year 10 to match the level in theINT. Clinical neuropathy was not assessed with a fre-quency that permitted similar analyses of the patternsof incidence over time.
A fraction of subjects with diabetes may be protectedfrom microvascular complications of diabetes. Thus, an-other possible explanation of the declining incidence ofretinopathy progression in the CONV could be that thosesusceptible to such progression have now reached thatoutcome and those who have not may not be susceptible.
A major strength of EDIC is the high precision ofthe outcome assessments for retinopathy and otheroutcomes, and the remarkably high compliance of thesubjects with the EDIC follow-up schedule. However, thecompliance with the fundus photography examinationshas not been quite as high as with other procedures. Ofthe 1,325 surviving subjects from the original cohorteligible to complete an examination during years 15–18,1,214 (92%) did so. Although this level of long-termfollow-up is exemplary, the less than complete adherencemay still be considered a weakness. Similarly, the reli-ability of the long-term follow-up in the small adolescentsubset is less, owing to the greater losses to follow-up.
Another weakness is the infrequently and unevenlytimed retinal assessments. Given the young age of theoriginal DCCT cohort and the low incidence of generallymild retinopathy during the DCCT, retinal examinationswere only obtained in one-fourth of the subjects each yearduring EDIC, timed relative to the date of randomization,i.e., once every 4th year, except for years 4 and 10 when theentire cohort was assessed. This schedule of outcomeassessments handicaps the ability of statistical methods todescribe patterns of risk and covariate effects on risk. It ispossible that the magnitude of covariate effects (though nottheir direction) would have differed if the retinal examina-tions had been conducted more frequently, e.g., annually.However, given the strong statistical effects reported, thisweakness has clearly been mitigated by the large number ofsubjects now followed for up to 18 years during EDIC.
In conclusion, the initial period of 6.5 years ofintensive therapy during the DCCT has resulted ina sustained beneficial reduction over up to 18 years of
extended follow-up during EDIC in the cumulative in-cidence (total numbers) of subjects showing furtherretinopathy progression, and progression to more severelevels of retinopathy that require intervention. Thebenefit (risk reduction), however, is not as great as thatobserved in prior analyses up to 4 and up to 10 years ofEDIC follow-up during which the phenomenon of meta-bolic memory applied. The diminished risk reductionduring years 10–18 of EDIC follow-up is not explainedby a rise in the risk of the former INT but rather bya decline in the risk after 10 years of follow-up in theCONV. The mechanisms for this fall are as yet undefined.Virtually all of the long-term benefits of former intensiveversus conventional therapy are explained by the differ-ences between the groups in the levels of HbA1c duringDCCT and EDIC.
APPENDIX
Writing Group: John M. Lachin (The George WashingtonUniversity, Rockville, MD), Neil H. White (WashingtonUniversity, St. Louis, MO), Dean P. Hainsworth (Univer-sity of Missouri, Columbia, MO), Wanjie Sun (The GeorgeWashington University, Rockville, MD), Patricia A. Cleary(The George Washington University, Rockville, MD), andDavid M. Nathan (Massachusetts General Hospital,Boston, MA).
Funding. The DCCT/EDIC has been supported by U01 Cooperative Agreementgrants (1982–1993 and 2011–2016) and contracts (1982–2011) with the Di-vision of Diabetes, Endocrinology, & Metabolic Diseases of the National Instituteof Diabetes and Digestive and Kidney Diseases (NIDDK), and through support bythe National Eye Institute, the National Institute of Neurologic Disorders andStroke, the Genetic Clinical Research Centers Program (1993–2007), and ClinicalTranslational Science Center Program (2006 to present) (Bethesda, MD). Industrycontributors have had no role in the DCCT/EDIC study but have provided free ordiscounted supplies or equipment to support participant adherence to the study:Abbott Diabetes Care (Alameda, CA), Animas (Westchester, PA), Bayer DiabetesCare (North America Headquarters, Tarrytown, NY), Becton Dickinson (FranklinLakes, NJ), CanAm (Atlanta, GA), Eli Lilly and Company (Indianapolis, IN),LifeScan (Milpitas, CA), Medtronic Diabetes (Minneapolis, MN), Omron (SheltonCT), OmniPod Insulin Management System (Bedford, MA), Roche Diabetes Care(Indianapolis, IN), and Sanofi (Bridgewater, NJ).Duality of Interest. No potential conflicts of interest relevant to this articlewere reported.Author Contributions. J.M.L. obtained funding for the study, wrote themanuscript, and directed the statistical analyses. N.H.W. wrote sections of themanuscript and reviewed and edited the manuscript. D.P.H. contributed tothe analysis plan specifications for the manuscript. W.S. conducted the statisticalanalyses, wrote sections of the manuscript, and reviewed and edited the man-uscript. P.A.C. contributed to the analysis plan specifications for the manuscriptand researched data. D.M.N. reviewed and made critical revisions to the man-uscript. J.M.L. is the guarantor of this work and, as such, had full access to allthe data in the study and takes responsibility for the integrity of the data and theaccuracy of the data analysis.
References1. The Diabetes Control and Complications Trial Research Group. The effect ofintensive treatment of diabetes on the development and progression of long-term
diabetes.diabetesjournals.org DCCT/EDIC Research Group 641
complications in insulin-dependent diabetes mellitus. N Engl J Med 1993;329:977–9862. Diabetes Control and Complications Trial Research Group. Effect of intensivediabetes treatment on the development and progression of long-term compli-cations in adolescents with insulin-dependent diabetes mellitus: Diabetes Controland Complications Trial. J Pediatr 1994;125:177–1883. Epidemiology of Diabetes Interventions and Complications (EDIC). Design,implementation, and preliminary results of a long-term follow-up of the DiabetesControl and Complications Trial cohort. Diabetes Care 1999;22:99–1114. The Diabetes Control and Complications Trial/Epidemiology of DiabetesInterventions and Complications Research Group. Retinopathy and nephropathy inpatients with type 1 diabetes four years after a trial of intensive therapy. N Engl JMed 2000;342:381–3895. White NH, Cleary PA, Dahms W, Goldstein D, Malone J, Tamborlane WV;Diabetes Control and Complications Trial (DCCT)/Epidemiology of Diabetes Inter-ventions and Complications (EDIC) Research Group. Beneficial effects of intensivetherapy of diabetes during adolescence: outcomes after the conclusion of theDiabetes Control and Complications Trial (DCCT). J Pediatr 2001;139:804–8126. Writing Team for the Diabetes Control and Complications Trial/Epidemiologyof Diabetes Interventions and Complications Research Group. Effect of intensivetherapy on the microvascular complications of type 1 diabetes mellitus. JAMA2002;287:2563–25697. Martin CL, Albers J, Herman WH, et al.; DCCT/EDIC Research Group.Neuropathy among the diabetes control and complications trial cohort 8 yearsafter trial completion. Diabetes Care 2006;29:340–3448. White NH, Sun W, Cleary PA, et al. Prolonged effect of intensive therapy onthe risk of retinopathy complications in patients with type 1 diabetes mellitus: 10years after the Diabetes Control and Complications Trial. Arch Ophthalmol 2008;126:1707–17159. White NH, Sun W, Cleary PA, et al.; DCCT-EDIC Research Group. Effect ofprior intensive therapy in type 1 diabetes on 10-year progression of retinopathy inthe DCCT/EDIC: comparison of adults and adolescents. Diabetes 2010;59:1244–1253
10. Nathan DM, Bayless M, Cleary P, et al.; DCCT/EDIC Research Group. DiabetesControl and Complications Trial/Epidemiology of Diabetes Interventions and Compli-cations study at 30 years: advances and contributions. Diabetes 2013;62:3976–398611. Nathan DM; DCCT/EDIC Research Group. The Diabetes Control and Com-plications Trial/Epidemiology of Diabetes Interventions and Complications study at30 years: overview. Diabetes Care 2014;37:9–1612. Aiello LP; DCCT/EDIC Research Group. Diabetic retinopathy and other ocularfindings in the Diabetes Control and Complications Trial/Epidemiology of DiabetesInterventions and Complications study. Diabetes Care 2014;37:17–2313. de Boer IH, Sun W, Gao P, et al.; for the DCCT/EDIC research group. Effect ofintensive diabetes treatment on albuminuria in type 1 diabetes: long-term follow-up of the Diabetes Control and Complications Trial and Epidemiology of DiabetesInterventions and Complications study. Lancet Diabetes Endocrinol. 17 July 2014[Epub ahead of print]14. Diabetes Control and Complications Trial Research Group. Progression ofretinopathy with intensive versus conventional treatment in the Diabetes Controland Complications Trial. Ophthalmology 1995;102:647–66115. Early Treatment Diabetic Retinopathy Study Research Group. Fundus pho-tographic risk factors for progression of diabetic retinopathy. ETDRS reportnumber 12. Ophthalmology 1991;98(Suppl.):823–83316. Odell PM, Anderson KM, D’Agostino RB. Maximum likelihood estimation forinterval-censored data using a Weibull-based accelerated failure time model.Biometrics 1992;48:951–95917. Turnbull BW. The empirical distribution function with arbitrarily censoredand truncated data. J R Stat Soc [Ser B] 1976;38:290–29518. Hastie TJ. Generalized additive models. In Statistical Models in S. ChambersJM, Hastie TJ, Eds. Pacific Grove, CA, Wadsworth & Brooks/Cole, 199219. Agesti A. Categorical Data Analysis. New York, John Wiley & Sons, 1990, p.80–91, 235–23620. Sparling YH, Younes N, Lachin JM, Bautista OM. Parametric survival models forinterval-censored data with time-dependent covariates. Biostatistics 2006;7:599–61421. MacKinnon DP. Introduction to Statistical Mediation Analysis. New York,Erlbaum, 2008
642 Intensive Therapy and Diabetic Retinopathy Diabetes Volume 64, February 2015