effect of inclination on flow and thermal characteristics ... · pdf filethe flow and thermal...
TRANSCRIPT

Effect of inclination on flow and thermal characteristics of air-water two-phase flow: an experimental investigation
M. J. Vaze & J. Banerjee S V National Institute of Technology, Surat, India
Abstract
An experimental analysis towards establishing the effect of inclination on flow and thermal characteristics of air-water two-phase flow is presented. The experimental setup consists of a mixing section, a visualization section, a test section and an outlet section. The test section consists of two sets of pressure transducers, heater element and RTD sensors for surface temperature and inlet and outlet bulk fluid temperature measurements. The test setup can be inclined maximum up to 30º of inclination. Various flow patterns like stratified, slug, plug, wavy, annular and other mixed type are observed and captured at 0º, 2º, 5º and 7º for the range of the liquid (ReSL) and gas (ReSG) superficial Reynolds numbers of 500-10000 and 500-30000 respectively. Flow regime map is established based on this flow visualization. For inclined configuration the stratified regime is observed to be replaced by slug and slug/wavy type of flow regime and the transition between slug-plug and slug-slug/wavy takes place at higher Reynolds numbers. Surface and bulk fluid temperatures are recorded for constant wall heat flux condition, by varying the superficial Reynolds numbers of gas and liquid phases to establish the local and average two-phase heat transfer coefficient. It is observed that ReSL has a pronounced effect on heat transfer coefficient in comparison to ReSG. With the change in inclination this effect becomes more evident. A heat transfer correlation is deduced from the present experimental observation which includes the basic parameters like Reynolds number and Prandtl number, pressure drop and inclination effect. Keywords: two-phase flow, flow pattern, heat transfer, superficial Reynolds number, inclination.
Computational Methods in Multiphase Flow VI 213
www.witpress.com, ISSN 1743-35 (on-line) WIT Transactions on Engineering Sciences, Vol 70, © 2011 WIT Press
33doi:10.2495/MPF110181

1 Introduction
Alternating flow of gas and liquid (slug flow) is a concern for petroleum industry while crude oil is transport from the well through the pipelines. Although such flows are majorly for horizontal orientation of the pipe, it is evident that the topography of the land produces situations where the orientation of the pipe can be inclined. To properly design such flow lines thus it is necessary to establish the flow and thermal characteristics of two-phase flow through pipes with smaller inclinations. Introduction of small inclination creates the component of gravitational force which is exactly perpendicular to the flow in horizontal case. The normal component provides segregation of the phases as in the case of horizontal flow while the other component acts parallel and opposite to the flow. Therefore, flow through pipe inclination causes lower velocity than in the corresponding horizontal configuration. These create differences in flow patterns and in situ properties which causes changes in flow and thermal characteristics. Flow pattern map for horizontal flow was developed by many investigators in the past. Flow pattern map proposed by Taitel and Dukler [1] and the transition boundaries predicted analytically by them are valid for horizontal and near horizontal flow. Beggs and Brill [2] studied inclined gas-liquid flow through pipes and their work has been widely applied in the petroleum industry. This work provides empirical correlations for the prediction of holdup and pressure drop. Hasan and Kabir [3] conducted experiments in 12.5 cm pipe and annular flow channels with inner tube diameters of 4.8, 5.7 and 8.7 cm for deviations up to 32° from vertical. These experiments for very low water flow rates were conducted by feeding air into a stagnant water column. The model developed by Hasan and Kabir [3] performs comparable to the Beggs and Brill model [2]. Experimental conclusions made by Barnea et al. [4] revealed the agreement between the experiment and theory proposed by them for inclined flow. Kokal and Stanislave [5] showed that flow pattern transition line is more sensitive to inclination angle and uphill flow regimes were predominantly intermittent while downhill were stratified. A study on inclined two-phase flow was conducted by Tshuva et al. [6] for various upward inclinations in 2.4 cm diameter, 3 m long pipes. It was found that the flow distribution can be either symmetric or asymmetric depending on the flow conditions and pipe inclination. The CFD analysis of the effect of inclination was also carried out by Vaze and Banerjee [7] for 0°-7° inclination. They observed that stratified flow for inclined orientations was replaced by slug flow. In non-boiling systems, the enhancement of convective heat transfer by injecting a gas phase in confined liquids has been observed by Dorresteijn [8] and also by Elamvaluthi and Srinivasa [9]. Mosyak and Hetsroni [10] had shown that the temperature difference between the top and the bottom side of the pipe was quite large for horizontal pipes. It drastically decreased due to an inclination of the pipe. Hetsoroni et al. [11] developed relation between the flow parameters and heat transfer using IR thermography for diabatic air–water flow. Large difference of circumferential wall temperature was found in their experiments.
214 Computational Methods in Multiphase Flow VI
www.witpress.com, ISSN 1743-35 (on-line) WIT Transactions on Engineering Sciences, Vol 70, © 2011 WIT Press
33

This irregularity was found to be due to the distribution of air and water phase in the pipe. The quantitative information regarding the increase in heat transfer with the increase in inclination angle was not addressed by them. The objective of the present work is to systematically investigate the flow and thermal characteristics of air-water two-phase flow for various inclinations. Experiments are carried out for 20, 50 and 70 orientation of the pipe. The mass flow rate of gas and liquid phases are varied to visualize the different flow patterns. These visualized images are utilized to generate flow pattern map for each of these inclinations. Due to the distribution of phases in the fluid in various flow regimes, the heat transfer characteristics of each regime differ. Bulk and surface temperatures are measured under constant heat flux condition to establish the local variation of heat transfer for each regime for different inclination of the pipe. A generalized correlation for average heat transfer is then established in terms of fluid and flow properties and inclination.
T1 RTD station 1 T2 RTD station 2 T3 RTD station 3 T4 RTD station 4
1 Storage tank 7 Screw compressor 13 Outlet section 2 Centrifugal pump 8 Pressure regulator 14 Air vent duct 3 By-pass line 9 Orifice meter/Rotameter
(air) 15 Return line 1
4 Ball valve 10 Mixing zone/ Calming zone 16 Return line 2 5 Gate valve 11 Visualization zone 17 Line to the
storage tank 6 Rotameter (water) 12 Heat transfer test section
Figure 1: Schematic diagram of experimental setup.
Computational Methods in Multiphase Flow VI 215
www.witpress.com, ISSN 1743-35 (on-line) WIT Transactions on Engineering Sciences, Vol 70, © 2011 WIT Press
33

2 Experimental procedures
The established experimental setup (Figure 1) is discussed in an earlier paper by the authors (Vaze and Banerjee [12]). The test setup has the facility to incline the pipe maximum up to 30° by using an in-house electric jack. A 230 V ac supply is provided to the gear motor through reverse-forward switch to facilitate the lifting of the setup. Flow rates, flow patterns, pressure and temperatures at different locations of the setup are recorded after setting the pipe at required angle of inclination.
3 Flow visualization
One of the most important aspects of two-phase flow is the geometric distribution of the phases under flowing conditions. In addition to the flowing conditions, it also depends on the angle of inclination. State of the art literature does not provide sufficient information regarding their functional relationship with the angle of inclination. Unlike the horizontal flow, gravity effects dominate for two-phase distribution in inclined pipes. Due to the higher density difference as in the case of air-water two-phase flow, gravity forces are more important than the other types of forces. The relative contribution of gravity forces compared to inertia forces increases with the increase in inclination. This could result in shifting of the transition line among the various flow regimes. Thus, small change in inclination can cause significant changes in flow and other characteristics of the two-phase flow through the system. Depending on the characteristic form of the flow patterns, seven flow patterns are identified. These are slug, plug, wavy, annular, wavy/annular, slug/wavy and slug/bubbly/annular. In the present investigation images are captured using Nikon D60 camera and
Slug (ReSG = 832, ReSL = 5268) Annular (ReSG = 29342, ReSL = 2950)
Plug (ReSG = 832, ReSL = 10000) SW (ReSG = 8602, ReSL = 3715)
Wavy (ReSG = 15630, ReSL = 705) WA (ReSG = 20538, ReSL = 4487)
SBA (ReSG = 16626, ReSL = 8474)
Figure 2: Visualized flow patterns for 2º inclination.
216 Computational Methods in Multiphase Flow VI
www.witpress.com, ISSN 1743-35 (on-line) WIT Transactions on Engineering Sciences, Vol 70, © 2011 WIT Press
33
Slug (ReSG = 832, ReSL = 5268) Annular (ReSG = 29342, ReSL = 2950)
Plug (ReSG = 832, ReSL = 10000) SW (ReSG = 8602, ReSL = 3715)
Wavy (ReSG = 15630, ReSL = 705) WA (ReSG = 20538, ReSL = 4487)
SBA (ReSG = 16626, ReSL = 8474)
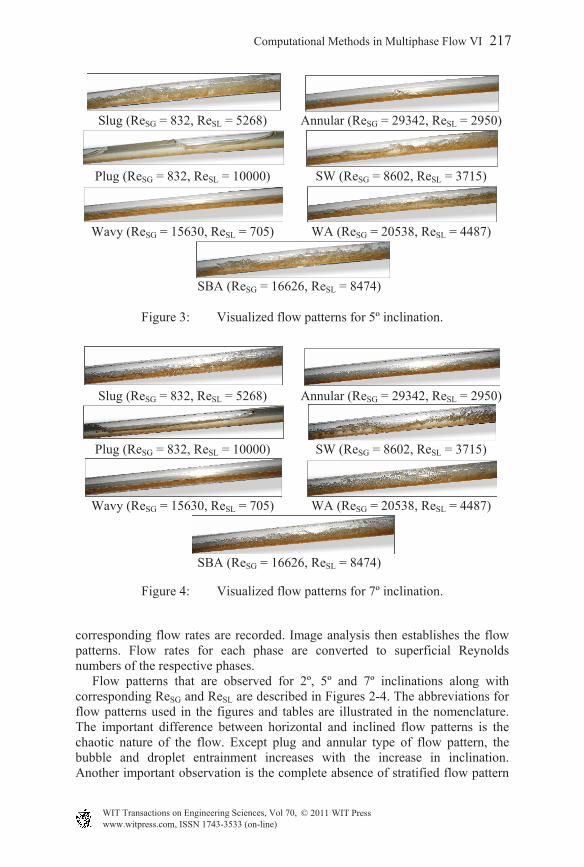
Figure 3: Visualized flow patterns for 5º inclination.
Slug (ReSG = 832, ReSL = 5268) Annular (ReSG = 29342, ReSL = 2950)
Plug (ReSG = 832, ReSL = 10000) SW (ReSG = 8602, ReSL = 3715)
Wavy (ReSG = 15630, ReSL = 705) WA (ReSG = 20538, ReSL = 4487)
SBA (ReSG = 16626, ReSL = 8474)
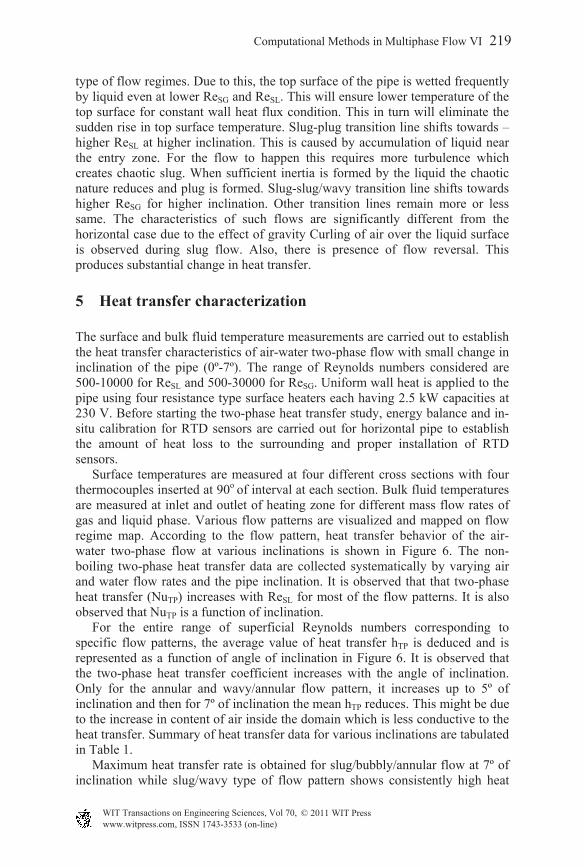
Figure 4: Visualized flow patterns for 7º inclination.
corresponding flow rates are recorded. Image analysis then establishes the flow patterns. Flow rates for each phase are converted to superficial Reynolds numbers of the respective phases. Flow patterns that are observed for 2º, 5º and 7º inclinations along with corresponding ReSG and ReSL are described in Figures 2-4. The abbreviations for flow patterns used in the figures and tables are illustrated in the nomenclature. The important difference between horizontal and inclined flow patterns is the chaotic nature of the flow. Except plug and annular type of flow pattern, the bubble and droplet entrainment increases with the increase in inclination. Another important observation is the complete absence of stratified flow pattern
Computational Methods in Multiphase Flow VI 217
www.witpress.com, ISSN 1743-35 (on-line) WIT Transactions on Engineering Sciences, Vol 70, © 2011 WIT Press
33

for inclined flow. This is due to the effect of gravity on liquid which does not remain constant everywhere inside the fluid domain. This creates slug even at lower superficial Reynolds numbers.
4 Flow regime map
Various flow patterns are visualized by varying the mass flow rates of the phases and representative images are shown in Figures 2-4. These flow patterns are captured and the flow rates are measured. These mass flow rates are converted to non-dimensional Reynolds numbers corresponding to superficial conditions. Around 300 combinations of superficial Reynolds numbers are considered for which various flow patterns are captured. Various symbols are used to distinguish between various flow patterns. A thick transition line is marked on the flow map on visualized flow patterns to distinguish the regimes of flow patterns. An uncertainty analysis carried out following UKAS [13] shows an overall uncertainty of 2% with 95% of confidence for the estimation of superficial Reynolds number for both air and water phase in the experiments. The effect of upward inclination of the pipe on flow pattern transition is carefully examined. The transition lines for 20, 50 and 70 inclinations are overlapped on common flow regime map to understand the effect of inclination on flow regimes. The shift in the transition lines due to inclination of the pipe is shown in Figure 5. Close inspection of Figure 5 reveals following observations. Upward inclination causes the intermittent flow to take place over a much wider range of flow conditions. Stratified flow is much sensitive to the inclination. Stratified regime is not present for all the inclinations considered in the present case. Portions of stratified regime are replaced by slug and slug/wavy
Figure 5: Variation of transition lines with inclination on flow regime map.
Figure 6: Variation of mean hTP with pipe inclination for various flow patterns.
500
1500
2500
3500
0 2 5 7
hT
P(m
ean
), W
/m2
k
Inclination of pipe in deg.
APSSBASWWWA
218 Computational Methods in Multiphase Flow VI
www.witpress.com, ISSN 1743-35 (on-line) WIT Transactions on Engineering Sciences, Vol 70, © 2011 WIT Press
33
type of flow regimes. Due to this, the top surface of the pipe is wetted frequently by liquid even at lower ReSG and ReSL. This will ensure lower temperature of the top surface for constant wall heat flux condition. This in turn will eliminate the sudden rise in top surface temperature. Slug-plug transition line shifts towards –higher ReSL at higher inclination. This is caused by accumulation of liquid near the entry zone. For the flow to happen this requires more turbulence which creates chaotic slug. When sufficient inertia is formed by the liquid the chaotic nature reduces and plug is formed. Slug-slug/wavy transition line shifts towards higher ReSG for higher inclination. Other transition lines remain more or less same. The characteristics of such flows are significantly different from the horizontal case due to the effect of gravity Curling of air over the liquid surface is observed during slug flow. Also, there is presence of flow reversal. This produces substantial change in heat transfer.
5 Heat transfer characterization
The surface and bulk fluid temperature measurements are carried out to establish the heat transfer characteristics of air-water two-phase flow with small change in inclination of the pipe (0º-7º). The range of Reynolds numbers considered are 500-10000 for ReSL and 500-30000 for ReSG. Uniform wall heat is applied to the pipe using four resistance type surface heaters each having 2.5 kW capacities at 230 V. Before starting the two-phase heat transfer study, energy balance and in-situ calibration for RTD sensors are carried out for horizontal pipe to establish the amount of heat loss to the surrounding and proper installation of RTD sensors. Surface temperatures are measured at four different cross sections with four thermocouples inserted at 90o of interval at each section. Bulk fluid temperatures are measured at inlet and outlet of heating zone for different mass flow rates of gas and liquid phase. Various flow patterns are visualized and mapped on flow regime map. According to the flow pattern, heat transfer behavior of the air-water two-phase flow at various inclinations is shown in Figure 6. The non-boiling two-phase heat transfer data are collected systematically by varying air and water flow rates and the pipe inclination. It is observed that that two-phase heat transfer (NuTP) increases with ReSL for most of the flow patterns. It is also observed that NuTP is a function of inclination. For the entire range of superficial Reynolds numbers corresponding to specific flow patterns, the average value of heat transfer hTP is deduced and is represented as a function of angle of inclination in Figure 6. It is observed that the two-phase heat transfer coefficient increases with the angle of inclination. Only for the annular and wavy/annular flow pattern, it increases up to 5º of inclination and then for 7º of inclination the mean hTP reduces. This might be due to the increase in content of air inside the domain which is less conductive to the heat transfer. Summary of heat transfer data for various inclinations are tabulated in Table 1. Maximum heat transfer rate is obtained for slug/bubbly/annular flow at 7º of inclination while slug/wavy type of flow pattern shows consistently high heat
Computational Methods in Multiphase Flow VI 219
www.witpress.com, ISSN 1743-35 (on-line) WIT Transactions on Engineering Sciences, Vol 70, © 2011 WIT Press
33

Table 1: Summary of heat transfer study for all inclination.
Angle of Inclination 0° 2° 5° 7°
St
ReSL 705-1884 - - -
ReSG 832-9956 - - -
hTP, 450.23-2613.27 - - -
Mean hTP, 731.91 - - -
S
ReSL 2044-7660 705-7660 705-7660 705-7660
ReSG 832-5932 832-3892 832-3892 832-3892
hTP, 701.17-2615.47 691.3-3786.68 886.07-4585.68 495.38-8553.96
Mean hTP, 1279.57 1202.62 1839.36 2424.42
P
ReSL 6057-7660 6057-7660 6057-7660 6375-7660
ReSG 832-1635 832-2413 832-2413 832-2413
hTP, 1466.79-1846.68 1252.92-2309.27 1066.93-2953.721294.28-3723.74
Mean hTP, 1545.86 1640.2 1889.92 2018.01
W
ReSL 705-1894 705-2044 705-2044 705-2044
ReSG 9956-23473 12297-23473 12297-23473 12297-23473
hTP, 605.71-1190.69 771.05-4865.74 1125.37-4306.01 652-8035.1
Mean hTP, 886.5 1448.45 2037.49 2082.29
A
ReSL 1595-7660 1744-7660 1149-7660 1000-7660
ReSG 26406-29340 26407-29341 26407-29341 26407-29341
hTP, 811.93-1851.25 1008.25-2844.93 1210.94-4071.17 987.45-1868.52
Mean hTP, 1237.24 1406.76 1645.37 1363.98
SW
ReSL 2044-4693 705-5425 705-5425 705-5111
ReSG 4595-10940 7182-9956 7182-9956 7182-9956
hTP, 794.54-5913.31 814.22-5317.63 756.43-4568.84 523.05-9661.14
Mean hTP, 1239.01 1515.18 2087.74 2722.75
WA
ReSL 705-4487 705-5425 705-5111 705-5111
ReSG 12297-29340 12297-29341 12297-29341 14670-29341
hTP, 708.18-2528.83 795.64-3019.44 891.21-3542.52 939.25-8938.14
Mean hTP, 1168.11 1324.73 2402.52 2054.61
SBA
ReSL 4693-7660 5470-7660 5425-7660 5425-7660
ReSG 7182-23473 7182-23473 7182-23473 7182-23473
hTP, 817.94-3385.44 979.26-3645.94 1414.99-5927.12 1526.94-9991.9
Mean hTP, 1453.43 1630.91 1913.23 3094.3
220 Computational Methods in Multiphase Flow VI
www.witpress.com, ISSN 1743-35 (on-line) WIT Transactions on Engineering Sciences, Vol 70, © 2011 WIT Press
33

transfer coefficient. The maximum heat transfer coefficient is in the mixed flow regimes like slug-bubbly-annular regimes. Turbulence plays major role for the higher heat transfer rate in this regime. The obtained heat transfer results are utilized to develop a correlation for non-dimensional heat transfer (NuTP) in terms of superficial gas and liquid Reynolds numbers, fluid properties, Lockhart-Martinelli parameter and inclination parameter. All these parameters are introduced in terms of ratio of gas to liquid parameters. The effect of gravity, surface tension and inclination angle is combined together in the inclination parameter. An assumed correlation for two-phase Nusselt number is expressed as
SG
TP
SL TP
PrReNu
Re Pr1 Eo Sin
pm n
qg b
l w
rC X
(1)
Table 2: Values of constant and exponents in the proposed correlation.
Flow ReSL ReSG C m n p q r
0º 2º 5º 7º St 705-
1894 832-9956 0.196 0.4915 -2.524 0.0297 0.088 0 - - -
W 705-1894
9956-23473
16.88 -0.25 1.0298 0.0342 -0.369 0 0.695 0.685 0.585
S 2044-7660
832-7182 405.4 0.1417 1.3658 0.0627 -0.404 0 -0.671 -0.226 -0.698
P 6057-7660
832-1635 93.9 0.4646 1.293 0.0127 0.746 0 0.4 0.726 0.579
A 1595-7660
26406-29340
18.8 -0.745 -1.26 0.016 -0.119 0 -0.295 -1.449 -0.245
WA 705-4487
12297-29340
0.177 -0.609 -3.403 0.019 -0.143 0 -0.115 0.0244 -0.015
SW 2044-4693
4595-10940
0.261 -0.473 -2.876 0.0194 0.0369 0 0.459 0.574 0.645
SBA 4693-7660
7182-23473
3.89 0.124 -1.376 0.0136 0.1335 0 0.787 0.856 0.996
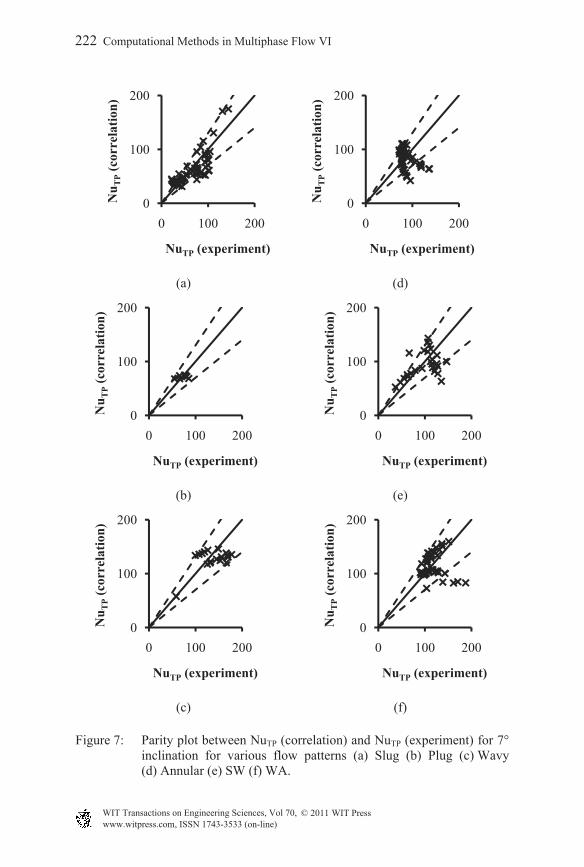
The constant C and power coefficients m, n, p, q and r are established by curve fitting of our experimental results. The values of constants and exponents obtained by curve fitting are tabulated in Table 2. The comparison between predicted NuTP and the experimental NuTP signifies the validity of the predicted correlation. Sample parity plot for 7° inclination is shown in Figure 7. Similar parity plots are also developed for other inclinations. It is observed that 90 percent of the data points fall within ± 30% zone thereby establishing the validity of the developed correlation.
6 Conclusions
The following conclusions are drawn from the present work: 1. With the increase in inclination angle the stratified flow disappears and is
replaced by intermittent flow. The transition boundaries shift to higher
Computational Methods in Multiphase Flow VI 221
www.witpress.com, ISSN 1743-35 (on-line) WIT Transactions on Engineering Sciences, Vol 70, © 2011 WIT Press
33
(a) (d)
(b) (e)
(c) (f)
Figure 7: Parity plot between NuTP (correlation) and NuTP (experiment) for 7° inclination for various flow patterns (a) Slug (b) Plug (c) Wavy (d) Annular (e) SW (f) WA.
0
100
200
0 100 200
Nu
TP
(cor
rela
tion
)
NuTP (experiment)
0
100
200
0 100 200
Nu
TP
(cor
rela
tion
)
NuTP (experiment)
0
100
200
0 100 200
Nu
TP
(cor
rela
tion
)
NuTP (experiment)
0
100
200
0 100 200
Nu
TP
(cor
rela
tion
)
NuTP (experiment)
0
100
200
0 100 200
Nu
TP
(cor
rela
tion
)
NuTP (experiment)
0
100
200
0 100 200
Nu
TP
(cor
rela
tion
)
NuTP (experiment)
222 Computational Methods in Multiphase Flow VI
www.witpress.com, ISSN 1743-35 (on-line) WIT Transactions on Engineering Sciences, Vol 70, © 2011 WIT Press
33

Reynolds numbers. This is due to the fact that increase in angle of inclination causes gravity component to act opposite to flow which in turn generates decelerating effect. It is found that the heat transfer for the inclined pipe is enhanced compared to that in a horizontal pipe.
2. Angle of inclination significantly affects the heat transfer rate except for the annular and wavy/annular flow. Exception is due to the increase in liquid thinning with the inclination and reversing of the flow.
3. A correlation for non-boiling two-phase heat transfer mechanism is proposed based on the experimental observations. This mechanism relates the two-phase Nusselt number in terms of the gas and liquid superficial Reynolds numbers, gas and liquid Prandtl numbers, wall and bulk two-phase viscosities, pressure drop and inclination factors.
Nomenclature
C constant Greek letters
Eo Eotvos number α angle of inclination in degree
h heat transfer coefficient, W/m2 μ viscosity, Pa-s
m, n, p, q, r
exponents Abbreviations
Nu Nusselt number A annular
Pr Prandtl number P plug
Re Reynolds number RTD resistance temperature detector
X Lockhart-Martinelli parameter S slug
Subscripts SBA slug/bubbly/annular
b bulk St stratified
l, g liquid, gas SW slug/wavy
SL, SG superficial liquid, superficial gas W wavy
TP two-phase WA wavy/annular
w wall
References
[1] Taitel, Y. and Dukler, A. E., A model for predicting flow regime transition in horizontal and near horizontal gas liquid flow. AIChE J., 22, pp. 47-55, 1976.
[2] Beggs, H.D. and Brill, J.P., A study of two-phase flow in inclined pipes. J. Pet. Technol., pp. 607–617, 1973.
[3] Hasan, A.R. and Kabir, C.S., Predicting multiphase flow behavior in a deviated well. SPE Prod. Engg., 3, pp. 474–482, 1988.
Computational Methods in Multiphase Flow VI 223
www.witpress.com, ISSN 1743-35 (on-line) WIT Transactions on Engineering Sciences, Vol 70, © 2011 WIT Press
33
[4] Barnea, D., Shoham, O. and Taitel, Y., Flow pattern transition for gas-liquid flow in horizontal and inclined pipes. Int. J. Multiphase Flow, 6, pp. 217-225, 1980.
[5] Kokal, S. L. and Stanislave J. F., An experimental study of two-phase flow in slightly inclined pipes – I Flow patterns. Chem. Engg. Sci., 44, pp. 665-679, 1989.
[6] Tshuva, M., Barnea, D. and Taitel, Y., Two-phase flow in inclined parallel pipes. Int. J. Multiphase flow, 25, pp. 1491–1503, 1999.
[7] Vaze, M. J. and Banerjee, J., CFD analysis of two-phase flow through inclined pipes, 34th National conference on Fluid Mechanics and Fluid Power, BIT Ranchi, India, December 10-12, Paper No. 147, 2007.
[8] Dorresteijn, W. R., Experimental study of heat transfer in upward and downward two-phase flow of air and oil through 70 mm tubes. Proc. 4th Int. Heat Transfer Conf. Vol. V, B5.9, Elsevier, Amsterdam, 1970.
[9] Elamvaluthi, G. and Srinivasa, N. S., Two-phase heat transfer in two-component vertical flows. Int. J. Multiphase Flow, 10, pp. 237-242, 1984.
[10] Mosyak, A. and Hetsroni, G., Analysis of dryout in horizontal and inclined tubes. Int. J. Multiphase Flow, 25, pp. 1521–1543, 1999.
[11] Hetsroni, G., Mewes, D., Enke, C., Gurevich, M., Mosyak, A. and Rozenblit, R., Heat transfer to two-phase flow in inclined tubes. Int. J. Multiphase Flow, 29, pp. 173-194, 2003.
[12] Vaze, M. J. and Banerjee, J., Experimental visualization of two-phase flow patterns and transition from stratified to slug flow. Proceedings of the Institution of Mechanical Engineers, Part C, Journal of Mechanical Engineering Science, 225, pp. 382-389, 2011.
[13] UKAS (United Kingdom Accreditation Service), The expression of uncertainty and confidence in measurement, M3003, 2nd ed., January 2007
224 Computational Methods in Multiphase Flow VI
www.witpress.com, ISSN 1743-35 (on-line) WIT Transactions on Engineering Sciences, Vol 70, © 2011 WIT Press
33
.