effect of high temperature on the aqueous h2s corrosion of
TRANSCRIPT

Effect of High Temperature on the AqueousH2S Corrosion of Mild Steel
Shujun Gao,‡,* Peng Jin,* Bruce Brown,* David Young,* Srdjan Nešic,* and Marc Singer*
ABSTRACT
The understanding of sour corrosion mechanisms is an im-portant but still largely elusive target, especially as it pertainsto the interaction between corrosion and corrosion productlayer formation. The objective of this work was to investigate theeffect of high temperature on the corrosion kinetics of carbonsteel and the formation of corrosion product layers in sourenvironments. H2S corrosion experiments were performed at80°C, 120°C, 160°C, and 200°C with 4 d exposure. Linearpolarization resistance was used to determine the corrosionrates. The corrosion products were identified by x-ray diffractionand examined by scanning electron microscopy together withenergy dispersive spectroscopy. The results indicate thatwith the increase of temperature, the initial corrosion ratesincreased, then reached a steady state over time. Two distinctlayers were found in the corrosion products. An inner ironoxide (postulated to be Fe3O4) layer was unexpectedly observedat every studied temperature, while the outer layer wasidentified as mackinawite, troilite, pyrrhotite, and pyrite at80°C, 120°C, 160°C, and 200°C, respectively.
KEY WORDS: high-temperature corrosion, hydrogen sulfide,iron oxide, iron sulfide
INTRODUCTION
As the drilling and exploitation environments in oiland gas industry are becoming harsher and moreaggressive, high-temperature hydrogen sulfide (H2S)corrosion is more frequently encountered.1-3 Hightemperatures and high pressures in association withH2S corrosion may lead to many engineering challengessuch as pipeline integrity, materials selection, andcorrosion mitigation.
H2S corrosion at low temperatures (<80°C)has been more widely studied,4-6 and significantprogress has been achieved to reveal the relatedgeneral corrosion mechanisms. At elevated temp-eratures, however, H2S corrosion has not beenthoroughly studied and the understanding of theassociated corrosion mechanisms is very limited.Overall, high temperature is fully expected to havea significant effect on the corrosion rate andformation/transformation of iron sulfide polymorphs.7
Different corrosion product layers may also havedifferent effects that lead to surface heterogeneity, theinitiation of galvanic corrosion, and localizedattack.
Therefore, in order to better understand,predict, and mitigate H2S corrosion in oil and gasproduction at elevated temperatures, further ex-perimental investigations are of great necessity.In this work, H2S corrosion tests were conductedat 80°C, 120°C, 160°C, and 200°C to identify theeffect of high temperature on the kinetics ofcorrosion and layer formation on mild steel insour environments.
Submitted for publication: May 22, 2017. Revised and accepted:June 5, 2017. Preprint available online: June 5, 2017, http://dx.doi.org/10.5006/2523. Recipient of first place in the MarcelPourbaix Corrosion Science category in the Student Poster Sessionat CORROSION 2017, March 2017, New Orleans, Louisiana.
‡
Corresponding author. E-mail: [email protected].* Institute for Corrosion and Multiphase Technology, Department ofChemical & Biomolecular Engineering, Ohio University, Athens,OH 45701.
1188ISSN 0010-9312 (print), 1938-159X (online)
17/000193/$5.00+$0.50/0 © 2017, NACE International CORROSION—OCTOBER 2017
2017 POSTER AWARD RESEARCH LETTERS

EXPERIMENTAL PROCEDURES
Experiments were performed in a 7 L Hastelloy†
autoclave. A conventional three-electrode setup wasused to conduct linear polarization resistance (LPR)measurements using a potentiostat. The workingelectrode was a cylindrical sample made from UNSK03014(1) (API 5L X65) carbon steel. A Pt-coatedNb counter electrode and a commercial Zr/ZrO2 high-temperature, high-pressure pH probe were used. ThepH probe reference also served as a reference elec-trode (exact potential still unknown) as long as itspotential was stable at the desired test conditions.8
Flat samples were also attached to a stabilized shaftusing a polytetrafluoroethylene (PTFE)-coated Type304 stainless steel (UNS S30400) wire. Before eachexperiment, the specimens were polished up to600 grit sandpaper and rinsed with deionized waterand isopropanol. A centrally located impeller witha rotation speed of 1,000 rpm was used to keep thesolution fully mixed during each test.
The speciation at different temperatures wascalculated according to an in-house water chemistrymodel,9 as summarized in Table 1. The dissolvedH2S concentration [H2S]aq was kept constant at0.00385mol/L, which corresponds to 0.10 bar H2S at80°C. After each test, the corroded samples were re-trieved and characterized by x-ray diffraction (XRD),scanning electron microscopy/energy dispersive x-rayspectroscopy (SEM/EDS), and surface profilometry.Other experimental procedures and details can befound elsewhere.9
RESULTS AND DISCUSSION
Figure 1 shows the corrosion rates over time at80°C, 120°C, 160°C, and 200°C as measured by LPR.It can be seen that the initial corrosion rates in-creased with increasing temperature, and then quicklydecreased to stable corrosion rates of 4.1, 3.8, 1.8,and 2.5 mm/y, respectively, from lowest to highesttemperature. Overall, the final steady-state corrosionrate decreased with temperature except at 200°C.
The corrosion products on the steel surface werecharacterized by XRD as shown in Figure 2. Whilemackinawite (FeS) was the main corrosion productdetected at 80°C, troilite (FeS), pyrrhotite (Fe1−xS,x = 0 to 0.17), and pyrrhotite/pyrite (FeS2) became thedominant species as temperature was increased.With increasing temperature, the corrosion productbecame richer in sulfur; this is an indication of en-hanced reaction kinetics for phase transformations.
The morphologies of the formed corrosionproducts were also characterized by SEM, as shown
in Figure 3. The SEM for the 80°C specimen shows amackinawite layer of 15-μm thickness. From the EDSline scan, the outer layer was identified to likely be aniron sulfide but an inner layer, which consisted mostlyof iron and oxygen was assumed to be an iron oxide.At 120°C, the SEM shows troilite-like crystals on thesurface and a much thicker layer (61 μm to 73 μm). At160°C, pyrrhotite crystals were clearly observed on the
TABLE 1Test Matrix
Parameter Value
Temperature (°C) 80 120 160 200pH2S (bar) 0.10 0.14 0.17 0.18Initial pH 4.00[H2S]aq (mol/L) 0.00385Duration (d) 4
00
2
4
6
8
10
16 32 48Time (h)
LP
R C
orr
osi
on
Rat
e (m
m/y
)
64 80
160°C
120°C80°C
200°C
96
FIGURE 1. Corrosion rate at different temperatures from LPRmeasurement, [H2S]aq = 0.00385 mol/L, initial pH = 4.0, 4 d, B =23 mV/decade.
10 20 30 40 50 60 70 80
160°C
120°C
80°C
200°C
2θθ (degree)
Inte
nsi
ty (
arb
itra
ry u
nit
)
Py
Py Py Py Py
Py Py
PyPyPy
Py
Py
Py: Pyrrhotite (Fe1–xS)
PyPyPy
PyPy
M M M
MM
M: Mackinawite (FeS)
MMM
MMM
M
MM
Ma
Ma: Magnetite (Fe3O4)
FeFe
Fe: Iron (Fe)
T
T T
T TT
T
T
TT T T T
T
T
T: Troilite (FeS)
P
PP
P PP
PP
P: Pyrite (FeS2)
PPP P P
FIGURE 2. XRD patterns of corrosion products on the steel surface atdifferent temperatures, [H2S]aq = 0.00385 mol/L, initial pH = 4.0, 4 d.
† Trade name.(1) UNS numbers are listed in Metals and Alloys in the Unified Num-
bering System, published by the Society of Automotive Engineers(SAE International) and cosponsored by ASTM International.
CORROSION—Vol. 73, No. 10 1189
2017 POSTER AWARD RESEARCH LETTERS
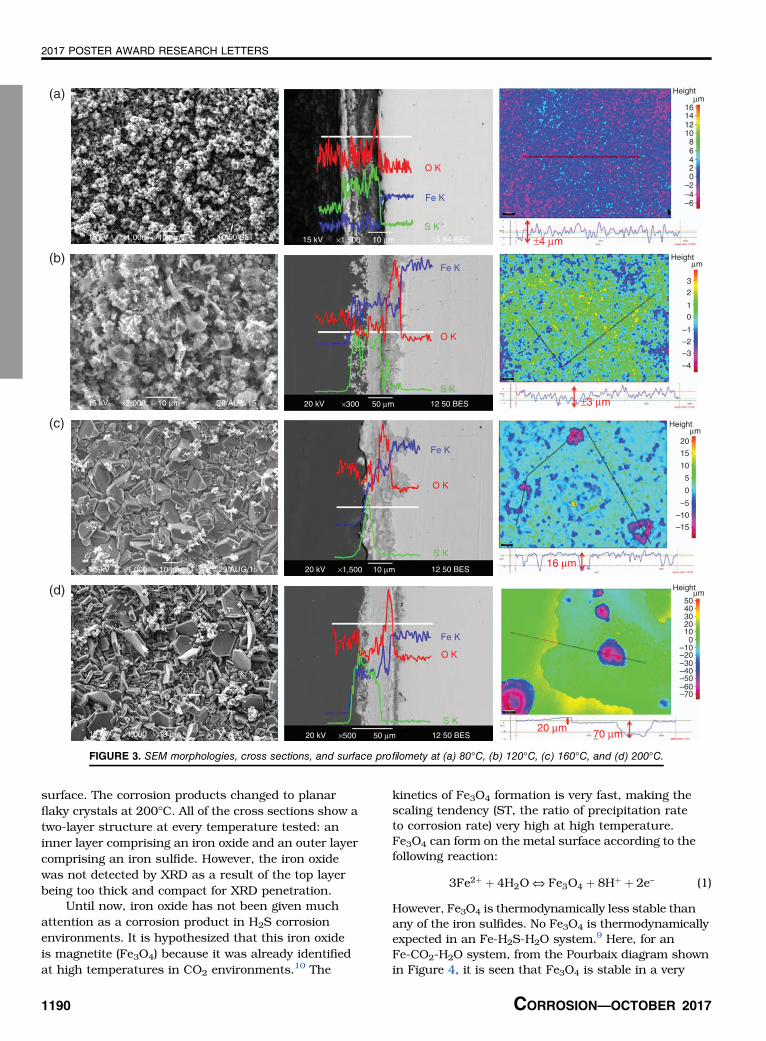
surface. The corrosion products changed to planarflaky crystals at 200°C. All of the cross sections show atwo-layer structure at every temperature tested: aninner layer comprising an iron oxide and an outer layercomprising an iron sulfide. However, the iron oxidewas not detected by XRD as a result of the top layerbeing too thick and compact for XRD penetration.
Until now, iron oxide has not been given muchattention as a corrosion product in H2S corrosionenvironments. It is hypothesized that this iron oxideis magnetite (Fe3O4) because it was already identifiedat high temperatures in CO2 environments.10 The
kinetics of Fe3O4 formation is very fast, making thescaling tendency (ST, the ratio of precipitation rateto corrosion rate) very high at high temperature.Fe3O4 can form on the metal surface according to thefollowing reaction:
3Fe2þ þ 4H2O ⇔ Fe3O4 þ 8Hþ þ 2e− (1)
However, Fe3O4 is thermodynamically less stable thanany of the iron sulfides. No Fe3O4 is thermodynamicallyexpected in an Fe-H2S-H2O system.9 Here, for anFe-CO2-H2O system, from the Pourbaix diagram shownin Figure 4, it is seen that Fe3O4 is stable in a very
15 kV ×1,000 10 μm 10 50 SEI 15 kV ×1,500 10 μm 15 64 BEC
20 kV ×300 50 μm 12 50 BES
20 kV ×1,500 10 μm 12 50 BES
20 kV ×500 50 μm 12 50 BES
15 kV ×2,000 10 μm 29/AUG/15
15 kV ×1,000 10 μm 29/AUG/15
15 kV ×1,000 10 μm
O K
O K
±4 μm
±3 μm
16 μm
20 μm70 μm
O K
O K
Fe K
Fe K
Fe K
Fe K
S K
S K
S K
S K
Height(a)
(b)
(c)
(d)
–6–4
–4
–15
–70–60–50–40–30–20–10
01020304050
–10
–5
–3
–2
–1
–20
0
0
5
10
15
20
1
23
2468
10121416
μm
Heightμm
Heightμm
Heightμm
FIGURE 3. SEM morphologies, cross sections, and surface profilomety at (a) 80°C, (b) 120°C, (c) 160°C, and (d) 200°C.
1190 CORROSION—OCTOBER 2017
2017 POSTER AWARD RESEARCH LETTERS

limited narrow area at potentials more positive thanthose for FeCO3 at 80°C. When the temperatureincreases to 200°C, the stability region for Fe3O4 isgreatly increased. New model for high-temperaturecorrosion of mild steel in aqueous H2S environmentat high temperature should also include Fe3O4
formation.After removal of the corrosion products, themetal
surface was characterized by profilometry, as shown inFigure 3. No obvious localized corrosion was observedat 80°C and 120°C. The surface was relatively smoothand the corrosion could be considered as uniform.However, at 160°C some small pits could be observedwith approximately a 1.2 pitting ratio (ratio of maxi-mum pit penetration rate to general corrosion rate)and 1.5 mm/y pit penetration rate. This does notconstitute localized corrosion but may indicateinitiation. At 200°C, many large pits appeared witha 3.2 pitting ratio and 8.2 mm/y pit penetration rate.The pitting ratio may not be a very accurate measureas pitting corrosion actually overwhelmed generalcorrosion. Because of severe localized corrosion atthis temperature, the stable LPR corrosion rateappears to be a little higher than at 160°C (Figure 1).These results fit with Ning, et al.’s previous work11
where it was found that pyrite formation triggers theoccurrence of localized attack.
SUMMARY
v Sour corrosion experiments were conducted suc-cessfully at 80°C, 120°C, 160°C, and 200°C. Initialcorrosion rates increased with increasing tempera-ture. Final corrosion rates, after 4 d of exposure,remained high at between 2 mm/y and 4 mm/y. Thecorrosion product comprised two distinct layers: an innerlayer, close to the steel substrate, and an outer layer,on the solution’s side. The inner layer was identified asan iron oxide (postulated to be Fe3O4) even though it is
not thermodynamically stable in the conditions tested.The outer layer was mainly composed of iron sulfide:mackinawite, troilite, pyrrhotite, and pyrite at 80°C,120°C, 160°C, and 200°C, respectively.
ACKNOWLEDGMENTS
The authors would like to express sincere appre-ciation to the following industrial sponsors for theirfinancial support and direction: Anadarko, BakerHughes, BP, Chevron, China National Offshore OilCorporation, ConocoPhillips, DNV GL, ExxonMobil,M-I SWACO, Occidental Oil Company, PetroleumInstitute, PTT, Saudi Aramco, Shell Global Solutions,SINOPEC, TOTAL, TransCanada, and WGK.
REFERENCES
1. G. DeBruijin, Oilfield Rev. 20 (2008): p. 46.2. H.J. Chen, “High Temperature Corrosion Inhibition Performance of
Imidazoline and Amide,” CORROSION 2010, paper no. 0035(Houston, TX: NACE International, 2010).
3. S.S. Prabha, Eur. Chem. Bull. 3 (2014): p. 300.4. H. Ma, X. Cheng, G. Li, S. Chen, Z. Quan, S. Zhao, L. Niu, Corros.
Sci. 42 (2000): p. 1669.5. W. Sun, S. Nešic, S. Papavinasam, “Kinetics of Iron Sulfide and
Mixed Iron Sulfide/Carbonate Scale Precipitation in CO2/H2SCorrosion,”CORROSION 2006, paper no. 644 (Houston, TX: NACE,2006).
6. J. Tang, Y. Shao, J. Guo, T. Zhang, G. Meng, F. Wang, Corros. Sci.52 (2010): p. 2050.
7. Y. Qi, H. Luo, S. Zheng, C. Chen, Z. Lv, M. Xiong, Int. J. Electrochem.Sci. 9 (2014): p. 2101.
8. R. Thodla, F. Gui, K. Evans, C. Joia, I.P. Baptista, “CorrosionFatigue Performance of Super 13 CR, Duplex 2205 and 2507 forRiser Applications,” CORROSION 2010, paper no. 312 (Houston,TX: NACE, 2010).
9. S. Gao, P. Jin, B. Brown, D. Young, S. Nešic, M. Singer, Corrosion73 (2017): p. 915.
10. T. Tanupabrungsun, D. Young, B. Brown, S. Nešic, “Constructionand Verification of Pourbaix Diagrams for CO2 Corrosion of MildSteel Valid up to 250°C,” CORROSION 2012, paper no. 1418(Houston, TX: NACE, 2012).
11. J. Ning, Y. Zheng, B. Brown, D. Young, S. Nešic, Corrosion73 (2017): p. 155.
0–1.5
Fe FeFeCO3
Fe2+ Fe2+
Fe2O3Fe2O3
FeCO3
Fe3O4
Fe3O4
Fe3+
–1.0
–0.5
0.0
0.5
1.0
1.5(a) (b)
2 4 6 8pH
E (
VS
HE)
–1.5
–1.0
–0.5
0.0
0.5
1.0
1.5
E (
VS
HE)
10 12 14 0 2 4 6 8pH
10 12 14
FIGURE 4. Pourbaix diagram for Fe-CO2-H2O system at (a) 80°C and (b) 200°C, 1 bar CO2 at 25°C.
CORROSION—Vol. 73, No. 10 1191
2017 POSTER AWARD RESEARCH LETTERS