effect of heat on the properties of automotive airbag
TRANSCRIPT

Effect of Heat on the Properties of
Automotive Airbag Materials
Submitted in fulfilment for the degree of
MPhil Materials
School of Materials
Faculty of Engineering and Physical Sciences
The University of Manchester
Mohammad Bin Rokan
2013

DECLARATION
With the exception of any statement to the contrary, all the material
presented in this report is the result of my own efforts. In addition, no
parts of this report are copied from other sources. I understand that any
evidence of plagiarism and/or the use of unacknowledged third party
materials will be dealt with as a serious matter.
ACKNOWLEDGEMENTS
First and foremost I thank almighty God for everything He has given me
so far. I also thank my parents for their continuous support. I would like
to thank Dr. Prasad Potluri for allowing me to work with him in this
project. I must thank Autoliv for providing this research opportunity. I
would also like to thank Dr. Haseeb Arshad, Dr. Richard Kennon, Dr.
Arthur Wilkinson, Professor John Hearle, Professor Peter Lovell and
Professor Robert Young for their valuable contributions to this project.
Lastly, but not least, I want to thank all my friends who have always been
there for me.

Contents
Abstract .......................................................................................... 1
Chapter 1: Introduction to Automotive Airbags ..................................... 2
1.1 Introduction to Airbags: ............................................................ 2
1.2 Working Principle of Automotive Airbag Systems ........................... 3
1.3 Types of Automotive Airbags ...................................................... 5
1.3.1 Frontal Airbags .................................................................... 5
1.3.2 Side-Impact Airbags ............................................................ 7
1.4 Nylon in Airbags ....................................................................... 9
1.5 Understanding the Effects of Heat on Airbags ............................. 11
1.51 Aims and Objectives ........................................................... 11
Chapter 2: Literature Review ........................................................... 12
2.1 Introduction to Polymers ......................................................... 12
2.11 Structure of Polymers: ........................................................ 13
2.12 Glass-transition of Polymers: ............................................... 14
2.13 Degree of Crystallinity:........................................................ 15
2.14 Industrial Production of Polymer Fibres: ................................ 17
2.2 Nylon: ................................................................................... 19
2.21 Effect of Moisture on the Properties of Nylon: ......................... 19
2.22 Use of Nylon 6,6 in Airbags: ................................................. 20
2.3 Effects of Heat on Polymeric Fibres: .......................................... 21
2.31 Types of Thermal Change .................................................... 23
2.32 Heat Effects on Fibre Structure: ........................................... 24
2.33 Weight Loss due to Heat: ..................................................... 25
2.4 Thermo-mechanical Properties of Polymers: ............................... 26
2.5 Effect of Crystal Size and Size Distribution: ................................ 27
2.6 Melting of Polymers ................................................................. 29
2.7 Tensile Properties of Polymers .................................................. 31
2.8 X-ray Analysis of Semi-Crystalline Polymers: .............................. 35
2.9 Shrinkage and Change in Diameter: .......................................... 38
Chapter 3: Experimental Work ......................................................... 41
3.1 Thermal Study .......................................................................... 41
3.11 Differential Scanning Calorimetry (DSC) .................................. 41
3.111 Types of DSC .................................................................... 42

3.112 Test Methodology .............................................................. 43
3.12 Dynamic Mechanical Analysis: ................................................ 49
3.121 Working Principle of DMA ................................................... 49
3.122 Measurements Taken Using DMA ......................................... 49
3.123 Test Methodology:............................................................. 50
3.2 Tensile Tests ........................................................................... 52
3.3 Wide-angle X-ray scattering (WAXS) ......................................... 53
3.4 Shrinkage .............................................................................. 55
3.5 Change in Diameter ................................................................ 58
Chapter 4: Results and Discussion .................................................... 60
4.1 DSC ...................................................................................... 60
4.2 DMA ...................................................................................... 71
4.3 X-Ray .................................................................................... 72
4.4 Tensile Tests ........................................................................... 74
4.5 Shrinkage .............................................................................. 77
4.6 Change in Diameter ................................................................ 81
4.7 Correlation between Shrinkage and Tensile Properties ................. 84
Chapter 5: Conclusions and Further Research .................................... 88
5.1 Conclusions ............................................................................ 88
5.2 Scope for Further Research ...................................................... 90
References ..................................................................................... 92

1
Abstract
Automotive airbags are subjected to extreme temperatures (up to 900°C)
during deployment which is achieved by using pyrotechnic inflators.
Although the airbag fully inflates within a few milliseconds, the heat often
causes physical damage to the airbags fabric and seams in this short
period of time. In this study, the effects of heat on airbag yarns (highly
drawn Nylon 6,6) and airbag fabrics were investigated with the goal of
understanding whether or not high heat causes the internal structure of
the material to change. The degree of crystallinity of the material was
found to increase as the delta H values of the material increased with
heat and heating rate in a Differential Scanning Calorimeter (DSC) for
both unheated and heated fibres (extracted from airbag yarns) as well as
unfired and fired airbag fabrics. The storage modulus of the material was
also found to drop gradually as the material was heated from sub-zero
temperature to melting point in a Dynamic Mechanical Analyzer (DMA)
with sharp drops in the glass-transition and melting regions. The initial
stiffness and the breaking strength of the material were found to decrease
in a tensile tester as the temperature and heating rate at which the
material was heated increased. This unusual behaviour, i.e. a reduction in
stiffness and strength with a rise in the degree of crystallinity was found
to be due to a reduction in the molecular orientation of the fibres as high
levels of shrinkage were observed for both yarns and fabrics when the
material was heated. The shrinkage increased with increasing
temperature and heating rate which caused the diameter of the fibre to
increase. Upon correlation with shrinkage, the initial stiffness and
breaking strength of the material were found to be inversely proportional
to shrinkage while the breaking strain was proportional to shrinkage.

2
Chapter 1: Introduction to Automotive
Airbags
This chapter gives a brief introduction to automotive airbags – how they
are constructed, how they work and the different types of airbags. This
chapter also explains why Nylon is the material of choice for airbags and
why understanding the heat effects on Nylon is important.
1.1 Introduction to Airbags:
Airbags are among the most important automotive safety products, as the
concept of inflating a textile cushion can be used in both frontal impacts
and side impact collisions to protect different body parts. Airbags are
classified as Passive Safety Devices (devices for injury mitigation) as
opposed to Active Safety Devices (devices for crash prevention).
Fig 1: Airbag deployment during crash testing. (Source: Autoliv)

3
Airbags are now very widely adopted and are considered to be very
important in reducing fatalities in crashes. Autoliv, a major manufacturer
of airbag products estimates that, in frontal impacts, driver airbags
reduce fatalities by 25% for belted drivers and serious head injuries by
over 60%.
Nylon is widely used in airbag manufacture. Nylon yarns are woven
together to produce the airbag fabric. The woven fabrics are then cut and
sewn to the required size and shape, depending on the vehicle. The size
of the airbags, weave patterns and sewing geometry varies depending on
the application, such as driver side airbags, passenger side airbags, side
curtains, etc.
Traditionally most airbag fabrics were coated with an elastomeric
material, such as neoprene or silicone. The use of coated materials in this
application has been largely due to their ability to act as a heat shield and
the relative ease in predicting their performance in a deployment.
However, there are some inherent problems with coated airbags, which
include their excessive thickness, inability to be folded into small spaces,
and tendency to degrade over time. (Mukhopadhay and Partridge, 1999)
The various types of airbags and their uses will be discussed in more
detail in the section titled “Types of Automotive Airbags”.
1.2 Working Principle of Automotive Airbag Systems
Automotive airbag systems are made up of three general components.
1. A sensor system.
2. A deployment mechanism.
3. The airbag or the cushion.

4
In the event of a crash, the sensor system sends a signal to the
deployment mechanism only if a set of conditions are met including
acceleration pulse and pulse duration. These sensors can also detect the
direction of impact, so the front airbags will not deploy during a side
impact for example.
Fig 2: Crash sensing and deployment (Source: The Clemson
University Vehicular Electronics Laboratory)
When the sensor system sends a voltage pulse to the deployment
mechanism, the heat of the voltage pulse ignites the pyrotechnic material
or the inflator. The inflator generates an inert gas that fill up the airbag
very rapidly as shown in Figure 2.
Pyrotechnic inflation technology has changed over the past few years
from reliance on sodium azide to the use of organic propellants in order to
minimise environmental impact of the propellant and to increase
efficiency. For frontal airbag systems the need for better protection of out-
of-position occupants has led to the development of multi-stage devices

5
that have the potential to provide large or small volumes of gas as
deemed necessary by the sensor system.
The main function of the cushion or the airbag is to contain the hot high
pressure gas, allowing a safe and efficient deceleration of the occupant
during the rapid deceleration of the vehicle in a crash. This is achieved
through elastic fibre deformation and controlled hot gas flow through the
fabric. The gas flow is controlled by the structural elements of the airbag,
such as the seam and vents.
1.3 Types of Automotive Airbags
There are 2 main types of airbag systems:
1. Frontal Airbags
2. Side-impact Airbags
1.3.1 Frontal Airbags
Frontal airbags are an integral part of the full protection system for
occupants in the front seating positions. Located in the steering wheel (for
driver seat) or instrument panel (for passenger seat), these airbags
inflate during frontal collisions in order to provide protection for the driver
and passenger.
During a collision, crash sensors send signals to a micro-processor in an
Electronic Control Unit (ECU), which determines the crash severity. If the
crash severity exceeds a predetermined limit, an electrical impulse is sent
to the inflator in the airbag module. An igniter in the inflator starts a
chemical reaction that produces gas which fully inflates the airbag within
50 thousands of a second, twice the speed of a blink of an eye. The airbag

6
automatically deflates within a few milliseconds as the gas escapes
through vents.
Frontal airbags can be further subdivided into 3 categories:
1. Driver Airbags
2. Passenger Airbags
3. Lower-body Protection
Driver airbag modules consist of the textile airbag, inflator and an
initiator. This module is housed inside the steering wheel.
Pyrotechnic inflators are the most common. They contain a gas generant
and during a crash, this generant is ignited and produces a harmless
nitrogen gas.
The textile airbag or the cushion is made from nylon fabric which is folded
inside the module in such a way as to ensure fast and safe deployment
during a crash. It has vent holes on the back of the fabric which lets out
gas to assure a soft landing of the occupant on the bag.
The passenger airbag module is very similar to the driver airbag
module, with the exception of a larger cushion and a larger inflator to
inflate the larger bag to the desired level.
Both the driver and passenger air bag materials are often manufactured
with a heat shield coating to protect the fabric from scorching, especially
near the inflator assembly, during deployment.
For car occupants who are protected by airbags and their seatbelts, leg
injuries are the most frequent problem in frontal crashes. Autoliv
estimates that leg injuries account for 40% of the moderate to severe
injuries to these occupants, of which 60% are below the knee.

7
Lower-body protection airbags are still not well established compared
to driver and passenger airbags. However, there is an increasing demand
for lower-body protection airbags (knee airbags and anti-sliding airbags)
to prevent fatal leg injuries and ensure that people not only survive a
crash but also are able to walk and lead a normal life after a crash.
1.3.2 Side-Impact Airbags
Side-impact collisions account for a quarter of all injuries to car
occupants, but they account for more than one third of the serious and
fatal injuries according to Autoliv. One major reason is that the side of the
vehicle is a thin crumple zone and the space between the occupant and
the side of the vehicle is small.
Side-impact airbags can be subdivided into 5 categories:
1. Inflatable Curtain
2. Thorax Bag
3. Head Thorax Bag
4. Pelvis-Thorax Bag
5. Door Mounted Inflatable Curtain
Inflatable curtains are stored in the headliner above the doors and are
used to absorb the energy of a direct side impact, often known as the
“first impact” and to provide energy absorption in roll-overs, often known
as “second impact”. The US federal law has made it mandatory for all new
vehicles of 2013 model sold in the US to contain this kind of airbag.
Thorax bags are stored in back rests of the front seats or in the front
doors. These airbags are meant to protect the occupant from serious
chest injuries from side-impact collision by pushing the occupant away
from the impact zone, thus dampening the blow. These bags usually have

8
a small volume to keep the force on the occupant as gentle as possible
while providing sufficient protection.
Head Thorax bags are used in vehicles where inflatable curtains cannot
be used, for example in convertible cars. The module is usually located in
the seat frame and works to protect the occupant very much similar to
that of inflatable curtains.
Pelvis-Thorax bags are used to increase side impact restraint
performance by increasing the coverage area with the help of an added
cell which is inflated to a higher pressure in order to distribute load over
the thorax (abdomen area) and pelvis (area between the abdomen and
the lower limbs) parts of the occupant's body more efficiently. This
concept takes advantage of the pelvis' ability to take higher loads, while it
limits pressure on the sensitive thorax area.
Door Mounted Inflatable Curtains (DMICs) provide a large side
coverage area in vehicles which have no roof, such as convertibles. It has
a chamber design which offers even protection and real inflatable curtain
(IC) performances, including improved ejection (situation where the seat
belts of the driver or passengers are released) protection in roll-over
accidents.

9
Fig 3: Different types of airbags in the Lexus ES 350. (1. Driver
airbag/Front Passenger airbag, 2. Knee airbags. 3. Side-impact
airbags, 4. Inflatable Curtains) [Source: Lexus]
1.4 Nylon in Airbags
Nylon is the material of choice for airbags because Nylon offers various
advantages in airbag application compared to other fibres. In general, the
Nylon fibre exhibits high specific strength, abrasion resistance, and
toughness or energy-absorption properties. The aging characteristics of
Nylon are also very good (Keshavaraj et al., 1996), which is important
because airbags typically need to have a replacement period of at least 15
years (Sun and Barnes, 2010)
10
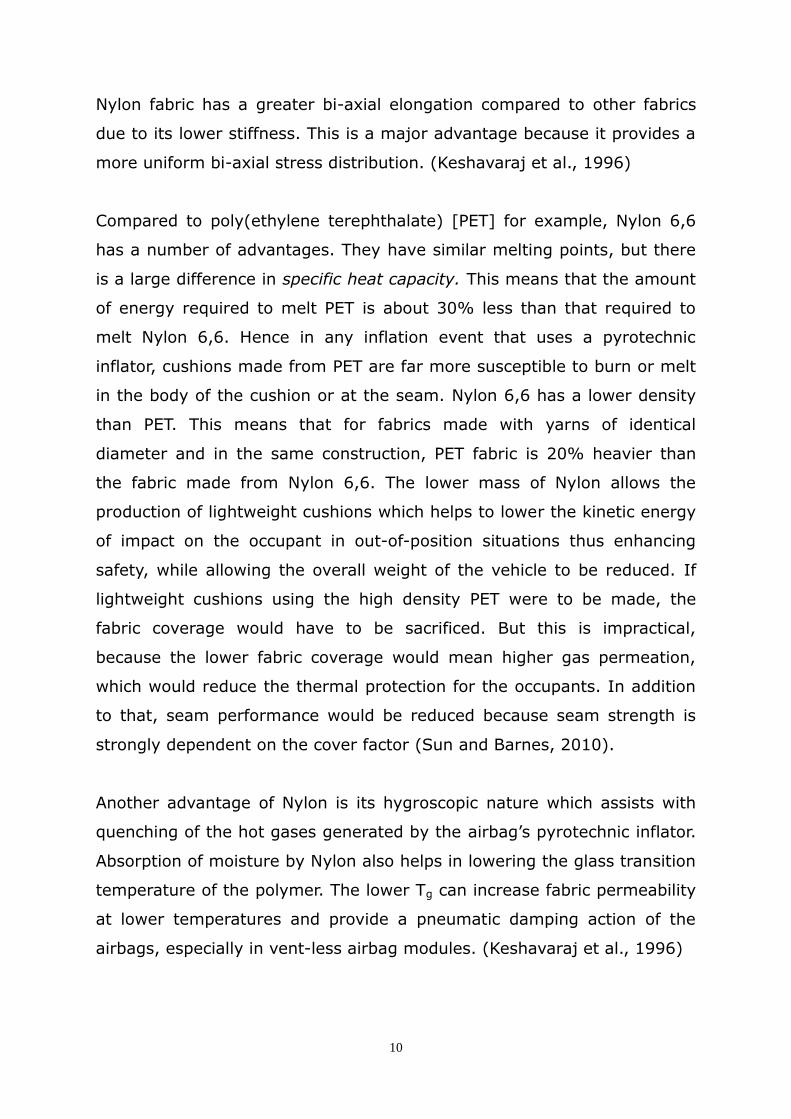
Nylon fabric has a greater bi-axial elongation compared to other fabrics
due to its lower stiffness. This is a major advantage because it provides a
more uniform bi-axial stress distribution. (Keshavaraj et al., 1996)
Compared to poly(ethylene terephthalate) [PET] for example, Nylon 6,6
has a number of advantages. They have similar melting points, but there
is a large difference in specific heat capacity. This means that the amount
of energy required to melt PET is about 30% less than that required to
melt Nylon 6,6. Hence in any inflation event that uses a pyrotechnic
inflator, cushions made from PET are far more susceptible to burn or melt
in the body of the cushion or at the seam. Nylon 6,6 has a lower density
than PET. This means that for fabrics made with yarns of identical
diameter and in the same construction, PET fabric is 20% heavier than
the fabric made from Nylon 6,6. The lower mass of Nylon allows the
production of lightweight cushions which helps to lower the kinetic energy
of impact on the occupant in out-of-position situations thus enhancing
safety, while allowing the overall weight of the vehicle to be reduced. If
lightweight cushions using the high density PET were to be made, the
fabric coverage would have to be sacrificed. But this is impractical,
because the lower fabric coverage would mean higher gas permeation,
which would reduce the thermal protection for the occupants. In addition
to that, seam performance would be reduced because seam strength is
strongly dependent on the cover factor (Sun and Barnes, 2010).
Another advantage of Nylon is its hygroscopic nature which assists with
quenching of the hot gases generated by the airbag’s pyrotechnic inflator.
Absorption of moisture by Nylon also helps in lowering the glass transition
temperature of the polymer. The lower Tg can increase fabric permeability
at lower temperatures and provide a pneumatic damping action of the
airbags, especially in vent-less airbag modules. (Keshavaraj et al., 1996)

11
1.5 Understanding the Effects of Heat on Airbags
Pyrotechnic inflation techniques have changed over the years and these
changes have increased the demands on the airbag cushion as they have
led to higher inflation temperatures and in some cases greater risk of hot
particulate ejection with the potential to lead to melting of the cushion
fabric. Therefore it is important to understand and predict the changes in
fibre and fabric level that occurs due to the effect of the gas at a very
high temperature and pressure.
1.51 Aims and Objectives
There were 4 main aims to this research:
1. Understanding effects of heat (post deployment) on the crystallinity
of airbag material – at fibre and fabric level.
2. Understanding effects of heat (post deployment) on mechanical
properties of airbag fibres.
3. Understanding how the modulus of the material changes with
temperature - the objective was to establish a path which the
modulus takes when exposed to temperature and generate data for
future modelling work.
4. Understanding the shrinkage behaviour of the material with heat -
because molecular orientation often plays a key part in determining
the mechanical properties of fibres.

12
Chapter 2: Literature Review
Polymers are very interesting materials and they are in use today in many
diverse places all around us. In fact, humans are made up of polymers
because the human DNA is a type of polymer. Few decades ago, the term
“plastics” was more common, but now the term “polymer” has become
mainstream and the term “plastics” is rightly used to describe a certain
category of polymers with a particular mechanical behaviour.
This chapter reviews existing literature and aims to highlight some of the
key developments made in the last few decades to better understand the
heat effects on polymeric fibres. The chapter begins by looking into
polymers in general. It then moves on to look at Nylon 6,6, which is
extensively used to manufacture airbags. Nylon is a certain type of
polymer which can be classed as a “thermoplastic” and more specifically
as a “polyamide”. Finally, this chapter will highlight the thermal properties
(the effect of heat and rate) on Nylon 6,6.
2.1 Introduction to Polymers
A polymer is essentially a material which is composed of large molecules.
They are also often known as “macromolecules”. These molecules are
made of one or more types of atoms which are covalently bonded to each
other. Two elements in particular form the backbone of polymers and
these are carbon and silicon. Polymers are formed by linking a large
number of repeated chemical units in sequence.
The International Union of Pure and Applied Chemistry (IUPAC) defines a
polymer as “a substance composed of molecules characterised by the
multiple repetition of one or more species of atoms or groups of atoms
linked to each other in amounts sufficient to provide a set of properties

13
that do not vary markedly with the addition or removal of one or a few of
the constitutional units”. The chain structure of polyethylene is shown in
Figure 4.
Fig 4: Polymer chain structure of polyethylene, one of the most
common types of polymer. (Source: European Commission)
2.11 Structure of Polymers:
Some polymers contain two different regions and their structures are
often known as “two-phase structures”. Different views have been offered
over the years as to how two different phases can co-exist within the
same polymer.
One way to depict polymers is the “fringed micelle concept”, as shown in
Figure 5. This concept arose from the suggestion that perhaps the
polymer chains are precisely aligned over distances corresponding to the
dimensions of the crystallites, and that there are disordered segments of
these same chains which do not crystallise, and contribute to the
amorphous phase.

14
Because each polymer molecule is very long, it was therefore assumed
that it would contribute to several crystalline and amorphous regions. This
view led to the structure known as the fringed micelle model.
Fig 5: Fringed Micelle Model [left] and Chain-folded Crystal Model
[right] (Source: Bower, 2002)
In a chain-folded lamellar crystal model (Figure 5), semi-crystalline
polymers are thought to be made up of folded-chain lamellae which are
held together by tie-molecules. These tie-molecules go from one
crystalline layer to another (Pai et al., 1989). In Nylon 6,6 the thickness
of these lamellae is 50-100 Angstroms, corresponding up to six repeat
units (Narten et al., 1991).
2.12 Glass-transition of Polymers:
When the melt of a polymer is cooled, it becomes more viscous and flows
less readily. If the polymer is not able to crystallise and the temperature
is reduced low enough, it becomes rubbery and then as the temperature
is reduced further, it becomes a relatively hard and elastic polymer glass.
The temperature at which the polymer undergoes the transformation from
a rubber to a glass is known as the “glass transition temperature, Tg”.
(Young and Lovell, 2011)

15
The glass-transition of polymers is commonly explained in terms of rapid
molecular motion of polymer chains above Tg and the substantially
reduced chain mobility below Tg. Above the Tg, a polymeric material can
flow and be stretched or shaped into useful forms (Jenekhe and Roberts,
1993).
The value of Tg is thought to be determined by such factors such as chain
stiffness, molecular symmetry, the presence of a side group (and its size
and flexibility), molecular weight, chain branching, cross-linking, and
intermolecular forces such as hydrogen bonding, dispersion forces, dipole-
dipole forces and induction forces (Jenekhe and Roberts, 1993).
Jenekhe and Roberts, 1993 have shown that it is possible to influence the
Tg of a polymer by weakening the intermolecular forces. The authors
achieved this by a process called Lewis acid-base complexation on Nylon
6,6. The Nylon was reacted with a metal halide (Lewis acid) which caused
the intermolecular hydrogen bonds to break and the Tg reduced to -4°C
as compared to 55°C for pure Nylon 6,6.
2.13 Degree of Crystallinity:
The crystallisation of polymers is of enormous technological importance.
Many thermoplastic polymers will crystallise to some extent when the
molten polymer is cooled below the melting point of the crystalline phase.
This is a procedure that is done repeatedly during polymer processing and
the presence of the crystals has an important effect upon polymer
properties. There are many factors that can affect the rate and extent to
which crystallisation occurs for a particular polymer. They can be
processing variables such as the rate of cooling, the presence of
orientation in the melt and the melt temperature. Other factors include
the tacticity and molar mass of the polymer, the amount of chain

16
branching and the presence of any additives such as nucleating agents
(Young and Lovell, 2011).
The fraction of crystalline material in the polymer is called the “degree of
crystallinity”. The degree of crystallinity is the single most important
characteristic of a polymer because it reflects the morphology of the
polymer and determines mechanical properties, such as yield stress,
elastic modulus and impact resistance. These mechanical properties
increase progressively with crystallinity (Kong and Hay, 2002).
For example, amorphous poly(ethyleneterephthalate) [PET] is of little
commercial value since it has poor mechanical properties, low
dimensional stability and high gas permeation rate; on the other hand,
crystalline PET has higher strength, good dimensional stability and
chemical resistance. It is widely used in the production of fibres and in
carbonated beverage containers because of its strength and low gas
permeability, especially to carbon-dioxide and oxygen.
Degree of crystallinity is not expected to directly affect the glass-
transition temperature of a polymer. However it can affect the glass-
transition indirectly because the amorphous chain segments are
constrained by the crystalline regions by means of linkages between the
crystalline and amorphous regions. (Murthy, 1997)
A two-phase (amorphous-plus-crystalline) model described previously has
been used widely to interpret crystallinity results. However, imperfections,
and disorders within the crystals may also contribute to the amorphous
component. Hence, the level of crystallinity measured is best interpreted
as a level of order (White and Cakmak, 1986).

17
2.14 Industrial Production of Polymer Fibres:
Polymer fibres such as Nylon are widely produced industrially using a
technique known as “melt spinning” (Figure 6). The melt spinning of
fibres is an industrial processing operation of great commercial
importance and the most important aspect of this operation is that of
development of structure, in particular crystallinity and orientation (White
and Cakmak, 1986).
Fig 6: Melt Spinning of Polymer Fibres (White and Cakmak, 1986)
An important part of the melt-spinning process is “drawing”. This is the
process which develops the structure and orientation of the fibre. The
glass-transition temperature of Nylon 6 fibre has been reported to
increase with increasing draw ratio (Murthy, 1997). The author explained
that this increase could be due to increased amorphous orientation.
In fact, the author suggested that for drawn fibres, the amorphous
orientation has a greater influence on the glass-transition temperature
than the degree of crystallinity does. Although drawing may produce a

18
more oriented fibre, the morphology might not change. Bell and Hughes,
1978 have found that the morphology of drawn Nylon 6,6 fibres is very
similar to its morphology before drawing. This has also been reported by
Crystal and Hansen, 1968.
Drawing can be done in the solid state or in the molten state at elevated
spinning speeds. The elevated speeds give rise to an enhanced orientation
within the melt. This orientation is expected to be transferred at least
partially to the solid state, hence influencing fibre properties (Frank and
Wendorff, 1988). The authors investigated the dependence of the
mechanical properties of Nylon 6,6 with this processing parameter. The
authors found that fibres drawn in the solid state show a lower
deformation at break and a steeper increase of stress with increasing
strain compared to the fibre which were drawn in the molten state. The
authors interpreted this in terms of tie-molecules. The drawing of the
sample after the melt spinning process gives rise to a high concentration
of nearly extended tie-molecules which break during elongation.
Some polymers contain both crystalline (ordered) and amorphous
(disordered) regions. The crystalline regions contribute to strength and
rigidity while the amorphous regions contribute to elasticity. The fraction
of crystalline material in the polymer is called the “degree of crystallinity”.
The crystalline component of a given semi-crystalline polymer can also be
divided into 2 parts – the part which re-crystallises when melted at a
given heating rate and the part which does not re-crystallise upon melting
at a given heating rate (Bell, 1972). The ratio of re-crystallisable to non-
crystallisable material can be varied at will. Completely crystallisable and
completely non-crystallisable material can be produced during melt
spinning. Bell, 1972 found that as the rate of drawing is decreased, or the
temperature at which drawing in done is increased, the amount of re-
crystallisable material decreases.

19
2.2 Nylon:
Nylon is a synthetic polymer (man-made polymer) made up of repeating
units which are linked by amide bonds. To make the repeating unit or the
monomer, molecules with an acid (-COOH) group on each end are reacted
with molecules containing amine (-NH2) groups on each end. The
monomers are then reacted together to form long polymer chains.
The resulting Nylon is named on the basis of the number of carbon atoms
donated by the monomers, the diamine first and the diacid second. So for
example, Nylon 6,6 refers to the diamine and the diacid donating 6
carbon atoms each to the polymer chain. So for Nylon 6,6, R will be 4-C
and R’ will be 6-C in the equation above.
The earliest study of the crystal structure of Nylon 6,6 was that of Fuller,
1940 and Fuller et al., 1940. These authors established that the
crystalline form consisted of extended polyamide chains. A more
extensive study was conducted by Bunn and Garner, 1947 who
determined the structure of a primary form of crystallites and suggested
the existence of secondary forms.
2.21 Effect of Moisture on the Properties of Nylon:
Nylons are well known to readily absorb moisture. Water is first absorbed
on the surface. When the surface layer is saturated with moisture,
absorbed water starts diffusing inside the body. The moisture diffuses
mostly in the amorphous regions. Once the diffused water reaches an
accessible –CONH- group, it is chemically absorbed. Excess water which is
20
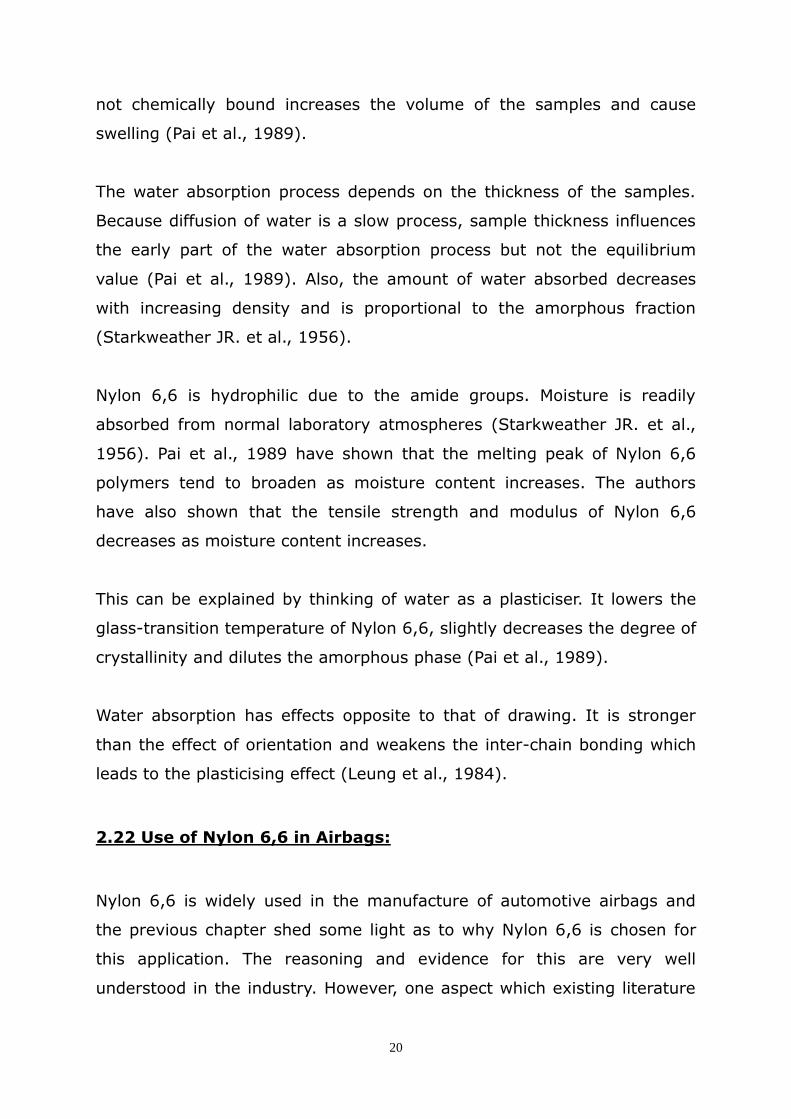
not chemically bound increases the volume of the samples and cause
swelling (Pai et al., 1989).
The water absorption process depends on the thickness of the samples.
Because diffusion of water is a slow process, sample thickness influences
the early part of the water absorption process but not the equilibrium
value (Pai et al., 1989). Also, the amount of water absorbed decreases
with increasing density and is proportional to the amorphous fraction
(Starkweather JR. et al., 1956).
Nylon 6,6 is hydrophilic due to the amide groups. Moisture is readily
absorbed from normal laboratory atmospheres (Starkweather JR. et al.,
1956). Pai et al., 1989 have shown that the melting peak of Nylon 6,6
polymers tend to broaden as moisture content increases. The authors
have also shown that the tensile strength and modulus of Nylon 6,6
decreases as moisture content increases.
This can be explained by thinking of water as a plasticiser. It lowers the
glass-transition temperature of Nylon 6,6, slightly decreases the degree of
crystallinity and dilutes the amorphous phase (Pai et al., 1989).
Water absorption has effects opposite to that of drawing. It is stronger
than the effect of orientation and weakens the inter-chain bonding which
leads to the plasticising effect (Leung et al., 1984).
2.22 Use of Nylon 6,6 in Airbags:
Nylon 6,6 is widely used in the manufacture of automotive airbags and
the previous chapter shed some light as to why Nylon 6,6 is chosen for
this application. The reasoning and evidence for this are very well
understood in the industry. However, one aspect which existing literature

21
has very limited information on is the effect on Nylon 6,6 when the airbag
is deployed. During deployment the Nylon fabric experiences a very high
temperature at a high pressure for a very short time. The time-scale of
an airbag deployment is shown in Figure 7.
Fig 7: Complete airbag deployment cycle. (Source: Airbag 101)
There is not much information on what happens at the fabric and fibre
level when the airbag is subjected to extreme temperatures and heating
rates. Some of the information found from the literature regarding the
effects of heat on polymeric fibres (not necessarily Nylon 6,6) and fabric
(not necessarily airbags) are provided in the next few sections.
2.3 Effects of Heat on Polymeric Fibres:
Metals are accustomed to a level of certainty where temperature-
dependent behaviour is concerned. Polymers do not provide such
certainty (Sepe, 2011). Aluminium, for example, has essentially the same
mechanical properties between room temperature and 250-300°C, and
even when approaching the melting point, retention can be as high as
80% of room-temperature performance. This level of consistency is even
better for materials like copper, brass, and steel, where the melting points
are higher. This certainty is due to the fact that the building blocks for
metallic substances are small and readily organise into a well-defined and
predictable crystal structure.

22
Fig 8: Modulus vs. Temperature behaviour for an Amorphous and
Semi-crystalline Polymer (Sepe, 2011)
That is not the case for polymers. The individual molecules that make up
polymeric materials are very large and have an extended chain-like shape
that results in an entangled structure. This entanglement is beneficial in
some respects. The relatively high levels of elongation that most polymers
exhibit without breaking are due in large part to chain entanglement.
However, this entanglement also restricts the freedom required at a
molecular level to organise into crystals. Hence, no polymer under normal
processing conditions is fully crystalline, and some polymers do not
crystallise to any significant degree. Figure 8 shows the difference in
mechanical behaviour due to a difference in crystallinity. This lack of a
predictable and repeatable structure gives rise to a situation where
changes in temperature always influence the mechanical properties of
these materials (Sepe, 2011).
The effect of heat is usually measured in terms of the change in
“enthalpy”. Enthalpy is a fundamental thermodynamic of materials; it is
temperature dependent and any change in enthalpy accompanying a
phase change is also temperature dependent. (Kong and Hay, 2002)
(Amorphous)
(Semi-crystalline)

23
2.31 Types of Thermal Change
It is important to understand the types of thermal change that can occur
when a polymer is heated. Three different distinctions can be made in this
regard (Morton and Hearle, 1993):
Firstly, there is the difference between chemical and structural
changes. Structural change is due to the relaxation of molecular
chains and the chemical changes involve the breaking of chains or
possibly the formation of cross-links.
Secondly, there is the thermodynamic distinction between first-
order and second-order transitions. A first-order transition involves
a change of structure and is shown experimentally by changes in
volume, V, in heat capacity, H (by latent heat), and by other major
changes of form or properties. The most common first order
transition is melting, which is the change from the regular order of a
crystal to the disorder of a liquid. A second-order transition involves
no change of molecular arrangement, i.e. snapshots of molecular
arrangement above and below the transition would be virtually the
same. But there is change in response of the structure, shown by
changes in the second-order quantities. An important second-order
transition in polymers is the change from the glassy-amorphous to
the rubbery-amorphous state.
Thirdly, there is a distinction between sharp and broad transitions.
In polymer materials, this often is a reflection of local variations in
structure, for example, in crystal size or perfection or in local
packing, so that the observed effect is really a collection of sharp
transitions spread over a range of temperatures.

24
2.32 Heat Effects on Fibre Structure:
Jain and Vijayan, 2002 took scanning electron micrographs of Nylon 6,6
fibres which depicted the characteristics of the fibres. Prior to heat
treatment, faint lines parallel to the fibre length were observed on the
surface. Tiny specks of extraneous material were found.
Aging the fibres at 175°C for 1750 hours caused a large number of holes
and groove-like openings on the surface of the fibres. The deposit of
extraneous material also increased compared to the unheated fibres.
These features seemed to intensify at 225 and 245°C. Formation of holes
and material deposits on the surface of heat treated fibres suggests that
during thermal ageing some solid material has evolved from within the
fibre via the holes and surface openings and have deposited on the
surface. The material could be associated with chemical degradation of
the polymer induced during thermal ageing. In addition to the solid
deposits seen in the micrographs, gaseous components formed during
heat treatment were also likely to have got evolved. The gaseous
components could account for the weight loss. Thermally induced holes,
pits, and longitudinal discontinuities were expected to be the cause of
deterioration in the initial tensile properties of the fibre (Jain and Vijayan,
2002).
Murthy, 1997 analysed the changes in fibrillar structure of drawn Nylon 6
fibres with heat. Lamellar spacing and the length of the lamellar stack
were found to increase with heat. The author suggested that annealing
does not change the number of lamellae within a lamellar stack; either,
new stacks are formed or the existing stacks grow laterally during
annealing.

25
2.33 Weight Loss due to Heat:
An increase in temperature causes enhanced weight loss (Jain and
Vijayan, 2002). This is shown in Figure 9. In addition, for a constant value
of T [temperature], increase in the tcum(T ) [duration] value also causes a
progressive reduction in weight i.e. during any high temperature
application, if the fibres are used at a fixed temperature for long
durations, it will undergo a progressive weight loss.
The weight loss suggested that thermal exposures have led to a material
loss which could be a consequence of thermally induced chemical
degradation. Weight loss of this type was expected to lead to changes in
the initial tensile characteristics of the fibre (Jain and Vijayan, 2002).
Holland and Hay, 2000 found that the weight loss of Nylon 6,6 with time
only followed first order kinetics over a short initial period. After this
period, a pronounced curvature was observed. The authors attributed this
to the formation of involatile char.
Fig 9: Weight loss (%) of Nylon 6,6 for various T and tcum(T )
values (in air). (Jain and Vijayan, 2002)

26
It is worth noting that these data on weight loss (Figure 9) apply to
thermal exposures carried out in air. Exposures in controlled atmospheres
like nitrogen gas may be expected to alleviate the deterioration (Jain and
Vijayan, 2002).
2.4 Thermo-mechanical Properties of Polymers:
The effects of heat also depend on the mechanical loading applied and the
way a polymer reacts to the combination of heat and mechanical loading
is known as the thermo-mechanical behaviour of the polymer. The general
thermo-mechanical behaviour can be described broadly in terms of the
two-phase structure which was mentioned before.
At very low temperatures the amorphous phase is in the glassy state, and
therefore rigid. In addition, there may be significant inter-chain
attractions (such as H-bonding or benzene ring interactions). The
amorphous chain conformations are fixed because there is insufficient
energy to permit rotation about the backbone covalent bonds. In this
temperature range the stress-strain curve would be in effect a straight
line, and the fibre brittle. As the temperature is increased, there is limited
molecular mobility and some freedom of rotation about the single
covalent bonds in the chains. However, H-bonding and/or other inter-
chain forces remain active. These secondary bonds provide a mechanism
for stress build-up as the structure is stretched. The fibre is therefore
likely to exhibit moderate extensibility combined with a relatively high
initial modulus. It will probably also yield, since the secondary bonds
cannot extend far without rupturing. As they break, they tend to re-form
in new positions, which stabilises the extension (and so impairs recovery)
but also helps to maintain the stress as further strain is applied. Thus, the
tenacity is expected to be quite high in this region of temperature. As the
temperature is further increased, the H-bonds or other secondary forces

27
tend to dissociate. At high stresses crystal yielding may also take place
(Morton and Hearle, 1993)
Dry isotropic Nylon 6,6 exhibits three relaxations at low frequency in the
range of -180 to 160°C. The α relaxation is the most prominent and is
associated with large-scale segmental motions in the amorphous phase
which involve rupture of hydrogen bonds. The β relaxation is ascribed to
the motions of non-hydrogen-bonded amide groups, while the γ process
involves the local-mode motions of both -CH2- and amide groups (Leung
et al., 1984).
2.5 Effect of Crystal Size and Size Distribution:
Crystalline solids consist of regular three-dimensional arrays of atoms. In
polymers, the atoms are joined together by covalent bonds along the
macromolecular chains. These chains pack together side-by-side and lie
along one particular direction in the crystals. It is possible to specify the
structure of any crystalline solid by defining a regular pattern of atoms
that is repeated in the structure. This repeating unit is known as the “unit
cell” and the crystals are made up of stacks of the cells. The spatial
arrangement of the atoms is controlled by covalent bonding within a
particular molecular segment, with the polymer segments held together in
the crystals by secondary Van der Waals forces or hydrogen bonding.
Since the polymer chains lie along one particular direction in the cell and
there is only relatively weak secondary bonding between the molecules,
the crystals have very anisotropic physical properties (Young and Lovell,
2011)
As Figure 10 shows, the observed melting point of a crystal is not an
absolute temperature, but actually depends on its size and state of
perfection. Both the overall crystallinity and the sizes (and distribution of

28
sizes) of crystallites depend on many factors such as chain flexibility and
thermal history. Yongqiang et al., 2001 derived a relationship between the
melting point and the size of crystals using the Kelvin equation. The size
effect comes about because of the surface energy contribution to melting.
This is equivalent to the 'surface tension' at the interface between, say, a
liquid and a vapour, or between one liquid and another. In the case of a
polymer (fibre), the interface would typically be that between a crystallite
and the amorphous phase. Although it is perhaps only a small component,
it can nonetheless be significant if the crystal itself is very small, so that it
has a large 'specific surface'. From the thermodynamics of melting, it can
be shown that the observed melting point of a crystal ought to vary with
its size (Yongqiang et al., 2001).
Fig 10: Relation of melting temperature (Tm) to the crystallite size
in the direction of fibre axis for drawn Nylon 6 annealed at various
temperatures between 150 and 215°C; ℓc calculated by using
crystallinity values from (◦) the density and (●) the heat of fusion.
(Arakawa et al., 1969)

29
In the case of metals, the observed melting point is always close to the
theoretical value and a sharp melting peak would generally be obtained
in, say, a differential scanning calorimetery analysis. This is certainly not
the situation for polymers and fibres. There is likely to be a range of
crystallite sizes present. The crystallite size distribution is in fact quite
broad in most cases. Figure 11 shows the distribution for linear
polyethylene.
Fig 11: Plot of normalized number of ordered sequence lengths
against length L in Angstroms. For fraction (Mw = 70,000, MN =
65,000) crystallized at 126°C for 165 min. NL is number of
sequences of length L; K is normalization constant (Stack et al.,
1982)
2.6 Melting of Polymers
The melting temperature range observed for a polymer depends on the
thermal stability of the lamellae present in the sample, and to their

30
thickness distribution. Thickening of the lamellae with time isothermally or
on heating makes the observed melting endotherms heating rate
dependent and melting occurs over a wide range of temperature. It is
common to observe multiple melting endotherms, crystallisation
exotherms and shifts of the endotherm to higher temperatures with
heating rate (Kong and Hay, 2002).
Highly viscous melts mean that polymer crystallisation is limited by
kinetic rather than thermodynamic parameters. Due to dynamic chain
entanglements not all of the molecular segments crystallise, defects are
present in the crystals and the dimensions of the critical nuclei limit the
lamellar crystal thickness. Accordingly these lamellae undergo
reorganisation and progressive thickening on heating. The rate of heating
and annealing alter the observed enthalpy of fusion and the temperature
range over which melting is observed (Kong and Hay, 2002).
Elad and Schultz, 1984 reported that with isothermal heat treatment, the
melting point of drawn Nylon 6,6 fibres increase, but only up to a certain
level, at which point it starts to decrease. The authors explained this in
terms of changes in crystal perfection and thickness, and changes in the
melt state. As crystallites thicken and become more perfect, their net free
energy decreases relative to the melt and hence the melting point
increases. As the temperature is increased further, the tie-chains relax
and the crystallites rotate. This causes the melt to become more random
as the initial high melt orientation is no longer present. This increased
melt entropy leads to a decrease in melting point as the melting point is
inversely proportional to the entropy difference between crystal and melt
(Elad and Schultz, 1984).
Unlike low molecular weight materials, polymer crystals melt over a wide
range of temperature and the temperature dependence of the enthalpy of
fusion cannot be neglected. The observed melting endotherms reflect the

31
thermal stability of the lamellae present as melting is approached and not
in the initial sample prior to heating. The melting enthalpies are not
comparable directly unless they are measured over the same temperature
range (Kong and Hay, 2002).
While tests in the DSC are useful, they do not provide any information on
the actual strength of the material. For this reference needs to be made
to stress-strain curves and examine the relationship between stress and
strain as a function of changes in temperature.
2.7 Tensile Properties of Polymers
Figure 12 shows the stress-strain curves of glass fibre reinforced Nylon
6,6 at different temperatures. Despite the fact that almost half of the
compound is made up of the non-polymeric glass fibre, the shape of the
stress-strain curve changes significantly. In general, strength and stiffness
decrease with increasing temperature while elongation at break, a good
relative indicator of ductility, increases (Sepe, 2011).
Fig 12: Stress-strain curves of 43% Glass Fibre reinforced Nylon
6,6 at different temperatures. (Sepe, 2011)

32
The tensile behaviour is however affected by many factors, including the
degree of crystallinity and the amount of re-crystallisable material present
in the sample. Bell, 1972 found that polymers with a greater ratio of non-
re-crystallisable material to crystallisable material have greater ultimate
tensile strength and lower elongation.
Tensile tests on heat treated Nylon 6,6 fibres have been carried out by
Jain and Vijayan, 2002 and have demonstrated the effects of heat
treatment on the tensile characteristics of the fibre. One thing to note
here is that the heat treatment was done in air and in an isothermal
environment.
Fig 13: Typical load-extension curves recorded from individual
Nylon 6,6 fibres prior to and after heat treatment. (a) As a
function of T and (b) As a function of tcum (T) at 225°C. (Jain and
Vijayan, 2002)

33
Figure 13 (a) and (b) present the typical load-extension curves for Nylon
6,6 fibres. The former shows the effect of T [temperature] and in the
latter, the role of tcum(T ) [duration] for a constant T has been depicted.
The progressive changes in the slope and the breaking load indicate that
increase in temperature as well as tcum(T) lead to deterioration in the
tensile modulus and strength respectively (Jain and Vijayan, 2002). This
is due to the fact that the degree of orientation decreases with treatment
time and the rate at which disorientation occurs increases with increasing
temperature (Elad and Schultz, 1984).
Figure 14 (a), (b) and (c) shows the reductions in the tensile modulus,
tensile strength and percentage elongation at break due to thermal-
oxidation. Here, MtT, St
T, and ЄtT represent the values of tensile modulus,
strength and percentage elongation at break respectively for fibres
exposed to temperature T for a duration of tcum(T ). It may be noticed
that after 800 h at 175°C, the tensile modulus and strength decrease by
40% and 70% respectively. At any stage of ageing at 175°C, the
reduction in the tensile strength is noticeably more than the
corresponding reduction in modulus. The preferential degradation of
tensile strength suggests that the structural features connected with the
tensile strength of the fibre deteriorate faster than those associated with
the initial tensile modulus (Jain and Vijayan, 2002).
In contrast with the behaviour at 175°C, fibres aged at 225 and 245°C do
not show such a preferential enhanced degradation in tensile strength. At
these higher temperatures, both tensile modulus and strength appear to
degrade by nearly equal amounts. The associated structural changes thus
appear to occur simultaneously and perhaps in equal measures. As in the
case of tensile strength and modulus, the percentage elongation at break
(Figure 14c) also decreases with cumulative thermal exposure at any
chosen temperature (Jain and Vijayan, 2002).

34
Fig 14 (a) Variation of MtT/Mo with tcum (T) and T (b) Variation of
StT/So with tcum (T) and T (c) Variation of Єt
T/Єo with tcum (T) and
T. (Jain and Vijayan, 2002)

35
2.8 X-ray Analysis of Semi-Crystalline Polymers:
Nylon-6,6 shows a crystal-to-crystal transition on heating, which is known
as the Brill transition. The room-temperature triclinic structure transforms
into a pseudo-hexagonal structure at elevated temperatures, and the
transition is reversible. The nature of the Brill transition (TB) is considered
to be the effect of conformational motion due to temperature and is
associated with a packing change within the crystal (Ramesh et al.,
1994). The diffraction pattern of Nylon 6,6 obtained by the authors is
shown in Figure 15.
Fig 15: 3D view of the X-ray diffraction patterns of Nylon 6,6 on
heating from room temperature to melting. (Ramesh et al., 1994)
From their work, Ramesh et al., 1994 concluded that crystallization from
the melt takes place directly into the Brill structure, which then
transforms at TB into the triclinic structure on cooling to room
temperature.
Jain and Vijayan, 2002 also carried out X-ray diffraction tests as shown in
Figure 16. It was found that at each of the chosen temperatures, at some

36
stage of the prolonged thermal exposures, the intensities of reflections
reach values where they are no longer observable above the background
i.e., at this stage of thermal exposure, the sample has no crystalline
fraction left to diffract.
Fig 16 (a) X-ray diffraction profiles recorded prior to and at
various stages of exposure to 175°C. (b) X-ray diffraction profiles
recorded prior to and at various stages of exposure to 225°C. (c)
X-ray diffraction profiles recorded prior to and at various stages of
exposure to 245°C. (Jain and Vijayan, 2002)

37
This stage is referred to as the zero crystallinity state. The time needed
for the 100% loss in crystallinity is referred to as t100. It must be
emphasized that the zero crystallinity state is reached as a result of
cumulative exposure to a constant temperature. Jain and Vijayan, 2000
found that at 175, 225 and 275°C, 1750, 22 and 16h respectively of
exposures are needed to reach the zero crystallinity state.
The authors’ observations on the time dependent variations in relative
intensities suggest that the first few thermal exposures of Nylon 6,6 cause
changes in the atomic/molecular arrangement which in turn lead to
changes in the relative intensities of the equatorial reflections.
Subsequent exposures, however, cause progressive degradation and an
eventual total loss in the crystallinity of the fibre.
Jain and Vijayan, 2002 presented the logarithmic variation of t100 with T.
This is shown in Figure 17. Values of k depicting the progressive reduction
and an eventual total loss in crystallinity have been marked in each set of
the diffraction patterns in Figure 16. From these values, the time needed
for 50% reduction in the initial crystallinity, t50, has been derived and
included in Figure 17.
Figure 17: t100 and t50 vs. T. Here, t100 and t50 refer to the
respective cumulative exposure time needed for 100 and 50%
reduction in crystallinity. (Jain and Vijayan, 2002)

38
The parameters, t50 and t100 are useful because it allows to predict the
duration of exposure which will cause any deterioration in the initial
crystallinity, for a chosen T value (Jain and Vijayan, 2002).
2.9 Shrinkage and Change in Diameter:
In general, fibre shrinkage due to heat can be attributed to 2 processes:
disorientation of the crystallites, and the transformation of the oriented
amorphous chains into folded chain crystals (Murthy, 1997).
Emri et al., 2006 described a procedure of obtaining real time shrinkage
results, using a special chamber, thermocouples and a thermal camera.
The procedure allowed to accurately monitor the temperature and the
heating rate.
The authors used their equipment to analyse the shrinkage of two
different fibres, PA6 and PA66, undergoing the same thermal treatment.
There were two clear observations. First, the total shrinkage of the two
fibres is significantly different; however this effect may also be observed
using a standard method of testing. Second, the rate of shrinking is
dissimilar, which indicates that the effect of temperature on inherent
structural changes in fibres must be different.
Since shrinkage is related to the inherent structure of the fibre, study of
the shrinkage dynamics may provide insights into fibre structure and may
be used in the process of material development and spinning process
optimization.
Hou et al., 2008 carried out shrinkage tests on polyacrylonitrile (PAN)
fibres. The PAN fibres undergo characteristic shrinkage during heating due
to cyclization and cross-linking reactions. The shrinkage consists of two

39
categories: physical shrinkage (due to the relaxation of molecular chains)
and chemical shrinkage (due to breaking of chains or possibly the
formation of cross-links), or initial shrinkage and secondary shrinkage.
The authors observed that the physical shrinkage is not largely affected
by the heating rate. In comparison, the amount of chemical shrinkage and
the total amount of shrinkage fall off sharply and then increase rapidly,
showing the least shrinkage at 5°C/min. The results are shown in Figure
18.
Fig 18: Shrinkage (%) of PAN fibres at different heating rates
(Hou et al., 2008)
At heating rates lower than 5°C/min, the intra-molecular cyclization was
the main reaction and the extent would decrease with the increase in
heating rates. Above 5°C/min, an intermolecular cross-linking reaction
also became obvious and the extent would increase with the increase in
heating rate (Hou et al., 2008).
Zhang et al., 2012 carried out heat treatment experiments on PSU
(polysulfone) electrospun nanofibrous membrane. The authors have

40
shown that under relaxation heating (no tension), the fibre diameter
increases with an increase in heat treatment temperature. However,
under tension heating, the fibre diameter decreases with an increase in
heat treatment temperature. This is shown in Figure 19.
Fig 19: Diameter distributions of PSU electrospun fibres (Zhang et
al., 2012)
When in the relaxation state, the molecular chains tended to stay in a
stable state with minimum energy; thus the PSU fibre shrank, but due to
the restrain of the cross-link entanglement between fibres, the shrunk
fibre bends to form a curve at the same time. When the membrane was
held by the clamps, the molecular chains would stretch and
rearrangement along the direction of the external force would take place
under the effect both of heat and tension, and gave rise to both the
enhancement in the structural density of the internal fibres and the
decrease in the fibre diameter (Zhang et al., 2012).
During relaxation heating, the movement of the molecules caused the
internal stress of the fibre to relax, therefore the fibre tended to shrink
and curve lengthways, and swell in the radial direction, which appeared as
shrinkage in membrane size and an increase in membrane thickness at
the macroscopic level. For the tension heating, the molecules would
rearrange along the direction of the external force and reach a new stable
state for the fibre structure, and this will also restrain the curvature
(Zhang et al., 2012).

41
Chapter 3: Experimental Work
This section explains the experimental studies conducted in order to
understand the effects of heat on airbag fibres and fabrics. Experimental
studies include thermal tests, X-ray diffraction, shrinkage and diameter
tests, and tensile tests.
3.1 Thermal Study
Thermal tests were conducted at both fibre and fabric level using two
techniques:
1. Differential Scanning Calorimetry (DSC)
2. Dynamic Mechanical Analysis (DMA)
These two techniques will now be explained in more detail along with the
experimental procedures used.
3.11 Differential Scanning Calorimetry (DSC)
Differential Scanning Calorimetry, or DSC, is a thermal analysis technique
that looks at how a material’s heat capacity (Cp) is changed by
temperature. A sample of known mass is heated or cooled and the
changes in its heat capacity are tracked as changes in the heat flow. This
allows the detection of transitions like melting, glass transitions, phase
changes, and curing.
As heat capacity increases with temperature, the DSC reading of a sample
should show a slight upward slope toward higher temperature as well as a
step change in the baseline across the melt as the heat capacity of a

42
molten material is higher than that of a solid. This allows easy
determination of the melting temperature of a fibre.
Change in heat capacity is also important in determining the glass
transition of the polymeric fibre. In amorphous and semi-crystalline
polymer of any type – synthetic polymers like polypropylene and
polystyrene, natural polymers like rubber, or biological polymers like
proteins – the glass transition is the best indicator of material properties.
As the glass transition changes due to either different degrees of
polymerization or modification by additives, the physical properties of the
material change. Similarly, material properties also change dramatically
above the Tg. For example, materials lose their stiffness and flow as is the
case in molten glass and their permeability to gases increases
dramatically.
3.111 Types of DSC
There are 2 classes of DSC which differ in terms of their design and
operation as shown in Figure 19.
1. Power-compensation DSC
2. Heat-flux DSC
Fig 19: (a) Power-Compensation DSC (b) Heat-Flux DSC (Source:
Young and Lovell, 2011)

43
In power-compensation DSC, the sample and inert reference material are
independently heated (or cooled) at a controlled rate in adjacent,
separate cells whilst simultaneously recording their temperature. The
difference in heat input to keep the sample and the reference at exactly
the same temperature is monitored. In heat-flux DSC, the sample and
inert reference material are heated (or cooled) at a controlled rate side by
side in a single cell. The temperature difference between them is recorded
simultaneously. The test methodology for both types is very similar.
Typical data obtained from both types of DSC is shown in Figure 20.
Fig 20: (a) Typical curve obtained from Power-Compensation DSC
(b) Typical curve obtained from Heat-Flux DSC (Source: Young
and Lovell, 2011)
3.112 Test Methodology
DSC tests were conducted at fibre level using PA66 yarns used to
manufacture airbags. The unheated yarn was separated into fibres and a
bundle of fibre was used to carry out the test.
An empty DSC pan was then weighed. The fibre bundle was placed inside
the pan and weighed again. The difference between the two gave the
mass of the fibres being used. Once the fibre mass was measured, a lid
was placed on the pan and the pan was sealed.
44
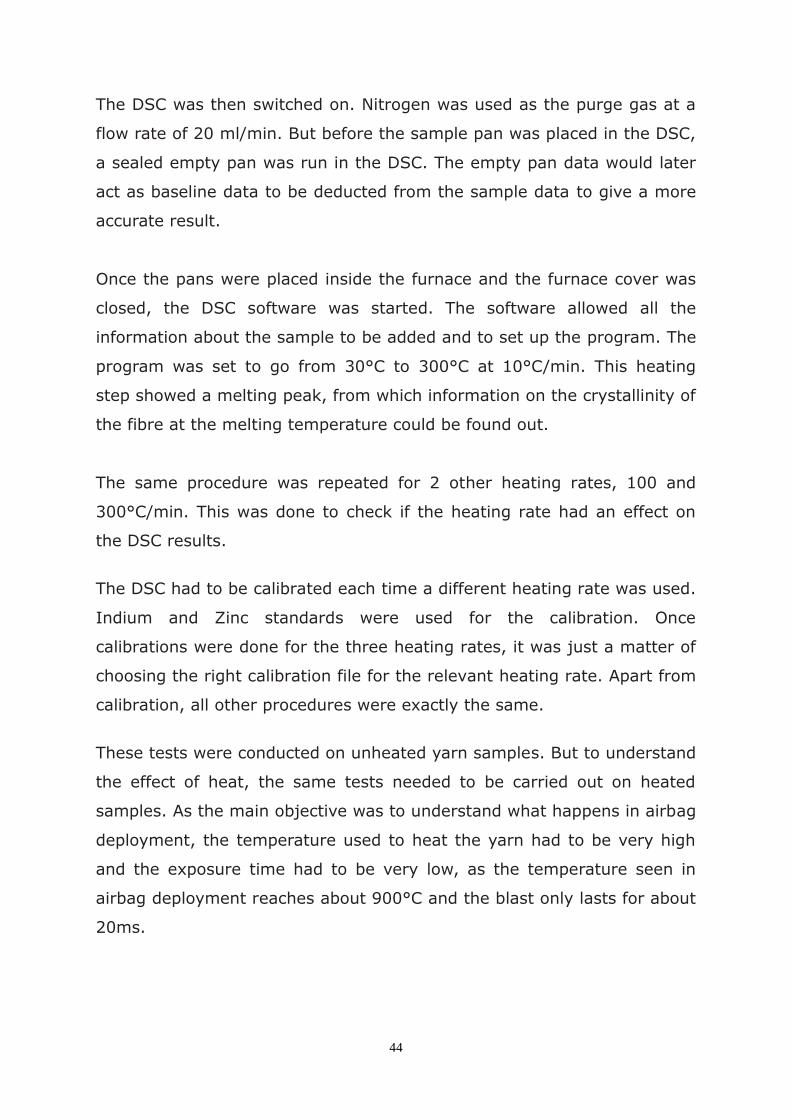
The DSC was then switched on. Nitrogen was used as the purge gas at a
flow rate of 20 ml/min. But before the sample pan was placed in the DSC,
a sealed empty pan was run in the DSC. The empty pan data would later
act as baseline data to be deducted from the sample data to give a more
accurate result.
Once the pans were placed inside the furnace and the furnace cover was
closed, the DSC software was started. The software allowed all the
information about the sample to be added and to set up the program. The
program was set to go from 30°C to 300°C at 10°C/min. This heating
step showed a melting peak, from which information on the crystallinity of
the fibre at the melting temperature could be found out.
The same procedure was repeated for 2 other heating rates, 100 and
300°C/min. This was done to check if the heating rate had an effect on
the DSC results.
The DSC had to be calibrated each time a different heating rate was used.
Indium and Zinc standards were used for the calibration. Once
calibrations were done for the three heating rates, it was just a matter of
choosing the right calibration file for the relevant heating rate. Apart from
calibration, all other procedures were exactly the same.
These tests were conducted on unheated yarn samples. But to understand
the effect of heat, the same tests needed to be carried out on heated
samples. As the main objective was to understand what happens in airbag
deployment, the temperature used to heat the yarn had to be very high
and the exposure time had to be very low, as the temperature seen in
airbag deployment reaches about 900°C and the blast only lasts for about
20ms.

45
It was clear that these extreme parameters were not possible to duplicate
manually on a single yarn. A heat gun which could reach a maximum
temperature of 600°C, was used to heat the yarn. As the temperature and
pressure of the hot air gun was lower than that in actual airbag
deployment, a higher exposure time was used. An exposure time of 45s
was used. This high exposure time also ensured even heating of the yarn.
Different experimental set ups were tried, but in the end manual heating
of a bundle of yarns tied to a tile showed the most consistent results. As
shown in Figure 21, the bundle of yarns was heated with the hot air gun
by hand. To record the temperature on the surface of the yarn, a fine
thermocouple was placed in the middle of the bundle of yarn. The
thermocouple was connected to a computer and the software recorded
the temperature in real time. To ensure that the yarns experienced the
maximum possible temperature from the start of the heating procedure,
the heat gun was run for 30 seconds at maximum temperature pointing
away from the yarns. Once the maximum temperature was reached, the
heat gun was positioned 5cm above the bundle of yarns. Although the
heat gun had a maximum temperature of 600°C, the maximum
temperature on the surface of the yarns recorded by the thermocouple
was 500°C.
Fig 21: The experimental set up for heating yarn samples.

46
After the yarn bundle was heated, fibres from the yarn were extracted
and tested in the DSC using the same procedure as the unheated yarn
samples.
The DSC results from the heated and unheated yarn samples were
compiled and the differences in Delta H calculated.
A notable difference was seen in the delta H values for different heating
rates. This difference led to the thinking that if different heating rates
have an effect on the Delta H value, the way the sample cools should also
have an effect on the Delta H value. Hence, tests were carried out at
different cooling rates, but keeping the heating rate constant.
This was done by initially heating the sample from 30°C to 300°C at
10°C/min, and then cooling the sample very slowly (5°C/min) back to
30°C. This was followed by another heating step to 300°C, keeping the
heating rate constant at 10°c/min, followed by a faster cooling step (10°C
/min). This was repeated for a few more steps to get the data for different
cooling rates (5, 10, 20, 50, 100, 200, 300, 400, 500 and 600°C/min). It
is worth mentioning that different cooling rates do not need different
calibrations. A single calibration (associated with the heating rate) was
used.
For DSC tests at fabric level, two airbags were provided by Autoliv. Of
these two airbags, one was unfired and the other was fired (deployed) as
shown in Figure 22.

47
Fig 22: Unfired and fired airbags.
The main aim of tests at fabric level was to understand the effects of heat
on particular areas of the bag. Hence, the bags were cut into sections.
Figure 23 shows the right panel of both the unfired and fired airbags.
Tests conducted on fabric from this panel would help understand the
effect on heat specifically on the right panel of the airbag.
Fig 23: Right side panel of fired and unfired airbags

48
However, this study went into more detail and divided the panel into
sections to understand the effects on a particular area inside a particular
panel. For the right panel for example, 2 sections were made as shown in
Figure 24.
Fig 24: 2 zones, inflator side (top) and vent (bottom) marked on
the fired panel.
Fabric samples were prepared in a similar way to fibre samples and tested
in the DSC using the same temperature range of 30°C to 300°C at
300°C/min. The differences in Delta H for unfired and fired airbag fabric
from a particular region inside the right panel were calculated.
Inflator side
Vent

49
3.12 Dynamic Mechanical Analysis:
Dynamic Mechanical Analysis, otherwise known as DMA, is a technique
where a small deformation is applied to a sample in a cyclic manner. This
allows the materials response to stress, temperature, frequency and other
values to be studied. The term is also used to refer to the analyser that
performs the test. DMA is also called DMTA for Dynamic Mechanical
Thermal Analysis.
3.121 Working Principle of DMA
DMA works by applying a sinusoidal deformation to a sample of known
geometry. The sample can be subjected by a controlled stress or a
controlled strain. For a known stress, the sample will then deform a
certain amount. In DMA this is done sinusoidally. How much it deforms is
related to its stiffness. A force motor is used to generate the sinusoidal
wave and this is transmitted to the sample via a drive shaft.
3.122 Measurements Taken Using DMA
DMA measures stiffness and damping, these are reported as modulus and
tan delta. The modulus can be expressed as an in-phase component, the
storage modulus, and an out of phase component, the loss modulus. The
storage modulus, either E’ or G’, is the measure of the sample’s elastic
behaviour. The ratio of the loss to the storage is the tan delta and is often
called damping. It is a measure of the energy dissipation of a material.
Modulus values change with temperature and transitions in materials can
be seen as changes in the E’ or tan delta curves. This includes not only
the glass transition and the crystalline melting, but also other secondary
transitions that occur in the glassy or rubbery plateau.

50
3.123 Test Methodology:
The same Nylon yarn sample which was provided by Autoliv and used for
the DSC tests was used again for the DMA tests. One end of the unheated
yarn was clamped inside the upper jaw of the DMA. The other end of the
yarn was pulled through the lower jaw and a slight tension was applied
manually to ensure the yarn is not slack. The lower jaw was then closed.
This set up is shown in Figure 25.
Fig 25: Nylon yarn sample clamped between the upper and lower
jaws inside the DMA.
In the beginning it was not clear as to whether the test should be carried
out using a single fibre or a whole yarn. Hence, both were tried out to see
which gives the most consistent results. The yarn sample was mounted as
shown in Figure 25. A single fibre is so thin that it is not possible to
mount it on the DMA directly. Therefore, to mount a single fibre, a whole
yarn was first mounted as in Figure 25. However, the top and the bottom

51
jaws were clamped a bit loose. A sharp pin was then used to separate
fibres from the yarn until there was just a single fibre on one side of the
pin and the rest of the fibres on the other side. Scissors were used to cut
the portion with the rest of the fibres. Because the yarn was not clamped
tightly, the fibres that were cut could be pulled out from above the top
jaw and from beneath the bottom jaw, leaving just the single fibre. The
fibre was then clamped tightly. From the results obtained it was clear that
using a single fibre was not right as the fibre tends to slip between the
jaws.
Once the sample was clamped, the furnace cover was closed and the
software which controls the DMA was started. The software allowed the
user to input a number of variables including frequency, starting
temperature, end temperature and heating rate. The frequency was set at
1Hz. The starting temperature was set at 30°C and the end temperature
was set at 300°C. The heating rate was set at 10°C/min.
From the results it was not quite clear if the drop in modulus in the glass
transition region started below or above 30°C. Hence, a few tests were
carried out using a starting temperature of -50°C. This sub-zero
temperature ensured that the starting point of the drop in modulus was
clearly identified. To get the temperature down to -50°C, liquid nitrogen
was used.
In an actual airbag deployment, the heating rate is very high. In order to
understand what happens in an actual deployment scenario, a few DMA
tests were run at very high heating rates (up to 300°C/min). However,
from the results it was very clear that it was not possible to get reliable
results using this high rate because the number of readings that the
software takes cannot cope with the high heating rate used. Hence, it
does not give a smooth curve, which makes it impossible to determine the
loss in modulus due to glass transition and melting.

52
It was evident that DMA tests were best carried out at low heating rates
as they give the most accurate and reliable results. Therefore, DMA tests
were carried out from -50°C to 300°C at 2°C/min.
3.2 Tensile Tests
Tensile tests were carried out on Nylon 6,6 fibres to find out the change in
tensile properties due to heat exposure. First, unheated fibre samples
were tested. A paper frame as shown in Figure 26 was used to secure a
single fibre. This was then mounted on the tensile tester, and the two
sides of the frame were cut as shown in Figure 26. A gauge length of
25mm was used.
Once this was done, heated fibre samples were tested. For this, a bundle
of Nylon fibres was placed inside an airbag and the airbag was fired so
that the heat exposure on the fibres would resemble the heat exposure on
a deployed airbag. The fibres were mounted on the frame and tested on
the tensile tester in the same way as with the unheated fibres.
Although heating in this way resembles actual deployment conditions, the
heating itself is uncontrolled and there is no way of knowing the rate of
heating or even the temperature which the fibre goes up to. For this,
another batch of fibres was heated, this time using the DSC. Using the
DSC to heat up the fibres ensures controlled conditions.
Two different heating rates were used 10°C/min and 300°C/min. The
reason for using two different heating rates was to see if the heating rate
influenced the tensile characteristics or was it only the final temperature
which influenced it. Two different end temperatures (210°C and 230°C)
were used. The end temperature was kept below the melting point to
avoid complete decomposition of the fibre.

53
Once the fibres were heated, the DSC pan was cut and the fibres taken
out. The fibres were then mounted on paper frames and tested on the
tensile tester in the same way as before.
Fig 26: (a) Single fibre glued to a paper frame. (b) Paper frame
with single fibre mounted on a tensile tester and sides cut off.
These tests were followed by cycling tests on the tensile tester. Virgin
fibres were taken to a strain of 15% and heated fibres were taken to a
strain of 20% (because the fibres had increased elongation properties
after being exposed to heat) and allowed to recover. The strain at zero
force was then measured.
3.3 Wide-angle X-ray scattering (WAXS)
Wide-angle X-ray diffraction is another way of determining the degree of
crystallinity. Figure 27 shows a typical WAXS curve for a semi-crystalline
polymer. The Y-axis is “intensity”, i.e. the number of photons detected
and the X-axis is the angle at which the X-ray hits the sample.
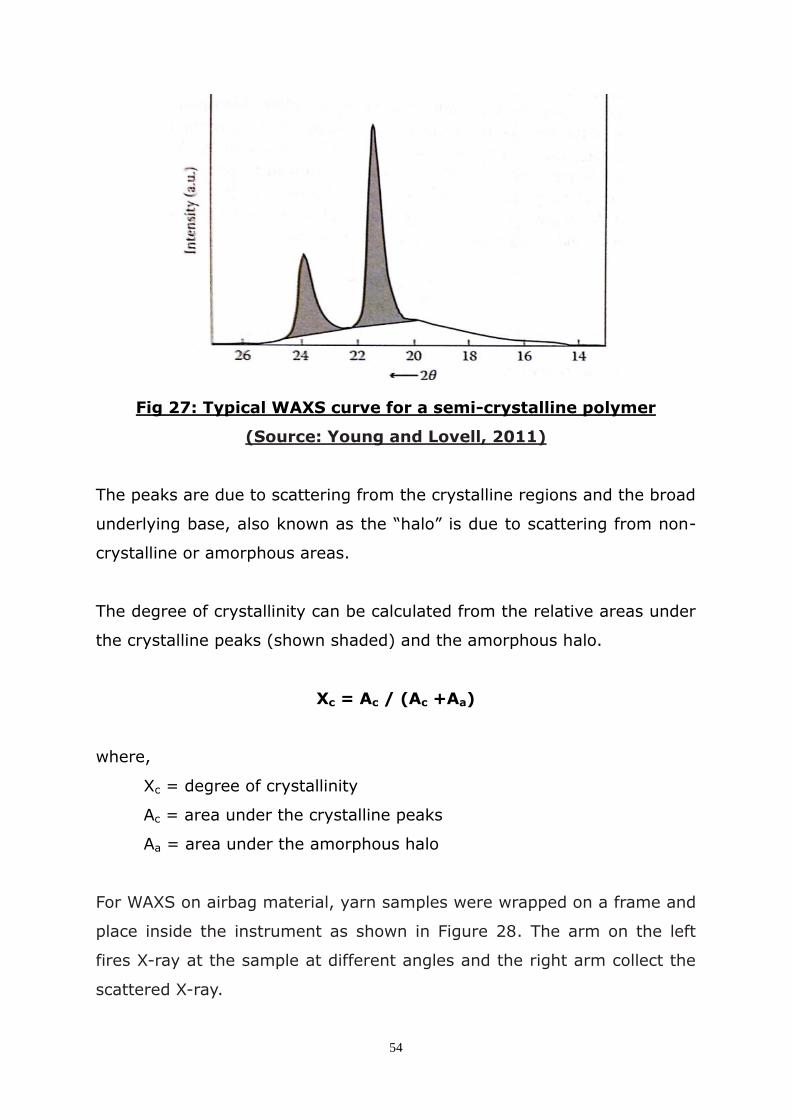
54
Fig 27: Typical WAXS curve for a semi-crystalline polymer
(Source: Young and Lovell, 2011)
The peaks are due to scattering from the crystalline regions and the broad
underlying base, also known as the “halo” is due to scattering from non-
crystalline or amorphous areas.
The degree of crystallinity can be calculated from the relative areas under
the crystalline peaks (shown shaded) and the amorphous halo.
Xc = Ac / (Ac +Aa)
where,
Xc = degree of crystallinity
Ac = area under the crystalline peaks
Aa = area under the amorphous halo
For WAXS on airbag material, yarn samples were wrapped on a frame and
place inside the instrument as shown in Figure 28. The arm on the left
fires X-ray at the sample at different angles and the right arm collect the
scattered X-ray.

55
Fig 28 (a): Sample prepared for X-ray diffraction.
Fig 28 (b): Sample being fired with X-ray.
The same test was repeated with fabric taken from the vent and inflator
side of fired and unfired airbags.
3.4 Shrinkage
The fibre structure consists, in principle, of three distinct components:
viscoelastic plastically deformed long chains, the crystalline phase and the
remaining amorphous phase. The shrinking of fibres is a consequence of
the frozen-in elastic deformation of long chains, which is released upon
heating the fibre.

56
Fibre shrinkage is normally used as one of the criteria to characterise fibre
performance. The amount of fibre shrinkage depends on both the
material, from which it was made, and the processing technology.
In most cases, measurement of shrinkage consists of measuring the initial
length of the fibre, exposing the fibre to boiling water or hot air for certain
period of time, without taking into account the rate of temperature
change, and afterwards measuring the final length. From the change in
length the magnitude of shrinkage is then obtained.
Experimental Procedure (Heating in an oven):
1. For fibres, loose yarns 7cm in length were heated in an oven at
220°C for 15 minutes. After heating, the length was measured
again using a ruler and the difference calculated.
2. For fabrics, square pieces of fabrics (7cm x 7cm) [Figure 29] were
heated in an oven at 220°C for 15 minutes. After heating, the
lengths in the warp and weft directions were measured again using
a ruler and the difference calculated.
Fig 29 (a): Unheated and 3 heated samples with an arrow
indicating warp direction

57
Fig 29 (b): Unheated and heated samples placed on top of each
other with the arrow indicating warp direction.
While tests such as these are sufficient for monitoring shrinkage, they do
not take into account the rate of heating. To understand how shrinkage
varies at different temperatures and different heating rates, another set of
tests were done using the DSC to heat the samples. The DSC allowed a
controlled heating environment with the scope of using different heating
rates.
Experimental Procedure (Heating in DSC):
1. A small length of a fibre bundle was placed inside the DSC pan. The
length of this fibre bundle was measured using an optical
microscope at 10x magnification.
2. The pan was sealed and heated in the DSC from 30°C to 210°C at
10°C/min.
3. The pan was taken out and the edges cut to expose the heated fibre
sample.
4. The length of the heated sample was then measured using the
optical microscope at 10x magnification (Figure 30).
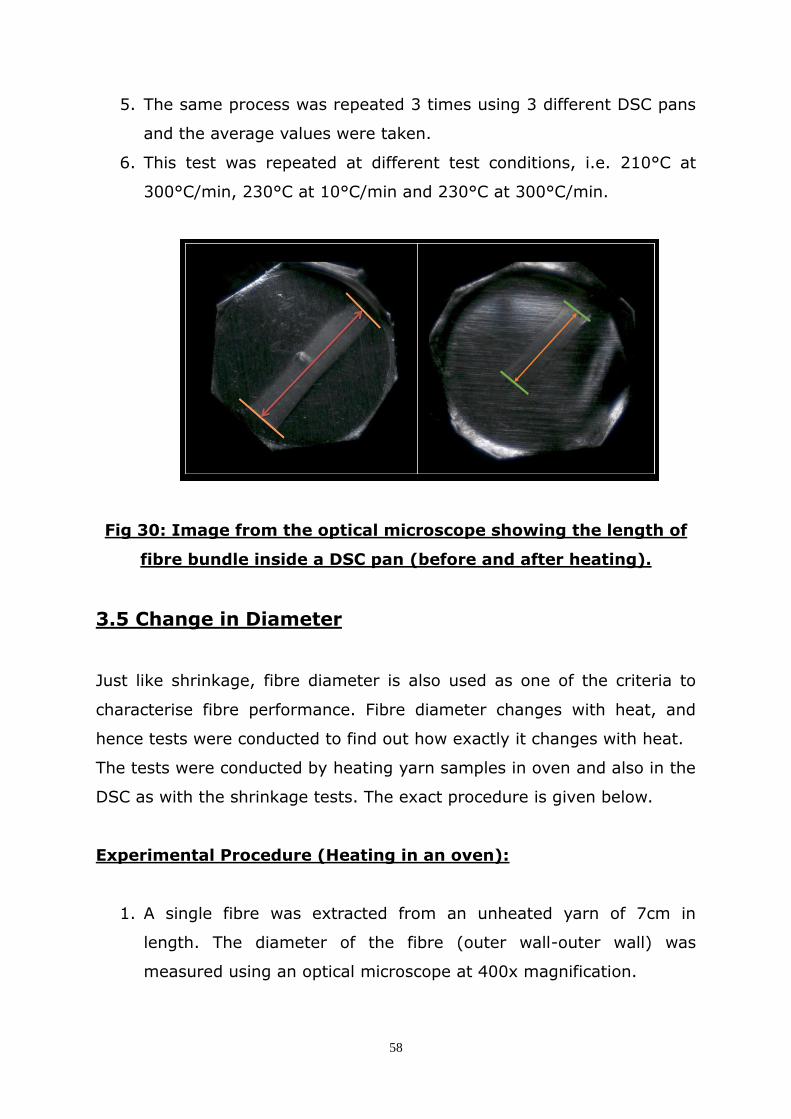
58
5. The same process was repeated 3 times using 3 different DSC pans
and the average values were taken.
6. This test was repeated at different test conditions, i.e. 210°C at
300°C/min, 230°C at 10°C/min and 230°C at 300°C/min.
Fig 30: Image from the optical microscope showing the length of
fibre bundle inside a DSC pan (before and after heating).
3.5 Change in Diameter
Just like shrinkage, fibre diameter is also used as one of the criteria to
characterise fibre performance. Fibre diameter changes with heat, and
hence tests were conducted to find out how exactly it changes with heat.
The tests were conducted by heating yarn samples in oven and also in the
DSC as with the shrinkage tests. The exact procedure is given below.
Experimental Procedure (Heating in an oven):
1. A single fibre was extracted from an unheated yarn of 7cm in
length. The diameter of the fibre (outer wall-outer wall) was
measured using an optical microscope at 400x magnification.

59
2. The first test was conducted by heating loose yarns of 7cm in
length, in an oven at 220°C for 15 minutes. The procedure followed
was the same as for the shrinkage test.
3. After heating, a single fibre was extracted from the yarn and placed
under the optical microscope at 400x magnification and the
diameter of the fibre (outer wall-outer wall) was measured.
4. This same test was done by extracting more fibres from the same
heated yarn and the average was taken.
Experimental Procedure (Heating in DSC):
1. A single fibre was extracted from an unheated yarn of 7cm in
length. The diameter of the fibre (outer wall-outer wall) was
measured using an optical microscope at 400x magnification.
2. A small length of a fibre bundle was placed inside the DSC pan. The
pan was sealed and heated in the DSC from 30°C to 210°C at
10°C/min.
3. The pan was taken out and a single fibre was extracted from the
fibre bundle and placed under an optical microscope.
4. The diameter of the heated sample (outer wall-outer wall) was then
measured using the optical microscope at 400x magnification
(Figure 31).
5. The same process was repeated 9 times (taking random fibres from
3 heated DSC pans) and the average values were taken.
6. This test was repeated at different test conditions, i.e. 210°C at
300°C/min, 230°C at 10°C/min and 230°C at 300°C/min.
Fig 31: Single PA66 fibre under the optical microscope at
400x magnification.

60
Chapter 4: Results and Discussion
This chapter includes all the results from the experimental work described
in the previous chapter. The chapter also includes detailed discussions and
explanations of the results obtained.
4.1 DSC
The DSC heating curve shows the effect of heat on the fibre in the as-
received state. The peak value of the curve in Figure 32 shows the
temperature at which the polymer melts completely and the area under
the curve gives the enthalpy of melting, or Delta H.
Fig 32: The scaled up version of the first heating curve.

61
Fig 33: 5 virgin yarn samples tested in DSC.
5 virgin yarn samples were tested in the DSC and the average Delta H
was calculated. Figure 33 shows the 5 curves. The average Delta H was
calculated to be 59.6 ± 2.6 J/g.
As was explained in the previous chapter, these tests were followed by
tests on heated (with a hot air gun) samples. Figure 34 shows the curves
for the 4 heated samples which were tested in the DSC. The average
Delta H for the heated fibre samples was found to be 68.8 ± 2.1 J/g.
The Delta H seems to increase when the fibre is heated, which indicates
an increase in crystallinity. This happens because the heat causes the
amorphous region of the fibre to gain sufficient energy to move and
rearrange into ordered regions and hence undergoes recrystallization in
the DSC (Bell, 1972).

62
Fig 34: Heated fibre samples tested in the DSC
The effect of heating rate on Delta H was also investigated. Figure 35
shows the effect of 3 different heating rates (10, 100 and 300°C/min) on
the Delta H of PA66 fibres.
Fig 35: DSC Heating Curves for PA66 Fibres at different Heating
Rates (10, 100 and 300°C/min)
10 C/min
100 C/min
300 C/min

63
As the heating rate increases, the curve and its peak is also seen to shift
to the right (Figure 35), which means that the temperature at which the
polymer melts increases. This is because the fibre is given less time at
any particular temperature as the heating rate increases (Young and
Lovell, 2011). Figure 36 shows how delta H varies with heating rate.
Heating Rate
(C/min)
Average Delta H
(J/g)
10 59.5 ± 1.6
100 64.5 ± 2.1
300 70.4 ± 2.7
Table 1: Average Delta H of PA66 Fibres at different Heating Rates
Fig 36: Relationship of Delta H with Heating Rate for PA66 Fibres
The increase in Delta H with heat is due to a process called “annealing”.
Annealing causes an increase in lamellar thickness of the polymer
crystals. Annealing can only take place at high temperatures when there
55.0
57.0
59.0
61.0
63.0
65.0
67.0
69.0
71.0
73.0
75.0
0 50 100 150 200 250 300 350
Ave
rage
De
lta
H (
J/g)
Heating Rate (C/min)
Relationship of Delta H with Heating Rate for Virgin Nylon Fibres

64
is sufficient energy for molecular motion to take place. High temperature
annealing also causes an increase in local ordering (Statton, 1972). The
effect of annealing is to increase the overall crystallinity level and to
reduce point-to-point variations in crystallinity. (Starkweather JR. et al.,
1956)
This behaviour led to another investigation. If the heating rate has an
effect, the cooling rate will most certainly have an effect on Delta H as
well. Figure 37 shows the heating curves following the different cooling
rates (5, 10, 20, 50, 100, 200, 300, 400, 500 and 600°C/min). The
heating rate was constant at 10°C/min.
Fig 37: Effect of different cooling rates on Delta H of Nylon 6,6.
DSC melting curves of many semi-crystalline polymers including Nylon
6,6 sometimes show 2 peaks as shown in Figure 37. The intensity ratio of
the 2 peaks depends on the thermal history and on the heating rate
(Illers, 1975).

65
The double peak is due to the existence of 2 morphological species with
different melting points according to Buchanan and Dumbleton, 1969. The
upper melting point was attributed to folded chain crystals and the lower
melting point to imperfect or small crystals with partially extended chains.
Others have explained the double peak differently. Illers, 1975 explained
that the double peak is caused by re-crystallisation which occurs during
heating small and/or imperfect crystals in the course of DSC
measurements.
The explanation provided by Illers, 1975 is consistent with this research.
Figure 37 shows that with very high cooling rates, the double peak is not
observed. This means that at high cooling rates, the samples do not have
enough time in the DSC to undergo re-crystallization.
Fig 38: Relationship of Delta H (During Second Heat) with Cooling
Rate for PA66 Fibres
42.0
44.0
46.0
48.0
50.0
52.0
54.0
56.0
58.0
0 100 200 300 400 500 600 700
De
lta
H (
J/g)
Cooling Rate (C/min)
Relationship of Delta H (During Second Heat) with Cooling Rate

66
Figure 38 shows that the Delta H on second heating decreases with an
increase in cooling rate. This finding was very important, because it
meant that for future heating tests on fibres, it had to be made sure that
the samples cool at the same rate. If not, the results would have no
meaning, as Delta H of heated fibres which have been cooled at different
rates cannot be compared.
For tests on fabric level, DSC tests were done first on fabric from the vent
region of both unfired and fired airbags as explained in the previous
chapter. The curves followed a similar shape to the tests on fibre level.
Several tests were conducted at different heating rates (10, 100 and
300°C/min).
The averages of these tests were taken and are given in Tables 2 and 3:
Sample Delta H ( J/g)
Avg. Unfired Vent 10°C/min 84.0 ± 2.3
Avg. Unfired Vent 100°C/min 90.1 ± 1.2
Avg. Unfired Vent 300°C/min 96.3 ± 1.6
Table 2: Average Delta H of unfired vent samples for 3 different
heating rates
Sample Delta H ( J/g)
Avg. Fired Vent 10°C/min 86.4 ± 2.2
Avg. Fired Vent 100°C/min 91.1 ± 0.9
Avg. Fired Vent 300°C/min 97.2 ± 0.9
Table 3: Average Delta H of fired vent samples for 3 different
heating rates
Figure 39 shows a graphical representation of the results.

67
Fig 39: Comparison of Delta H for Fired and Unfired Airbag Fabrics
from the Vent Region
Two things are noticeable from the chart above:
1. There is a general increase in Delta H for fired airbag vents
compared to that of unfired airbag vents.
2. The Delta H for both fired and unfired airbags increases with
increasing heating rates.
70
75
80
85
90
95
100
10 100 300
Avg
. De
lta
H (
J/g)
Heating Rate (C/min)
Delta H Comparison of Fired vs Unfired Airbags
Delta H (Unfired)
Delta H (Fired)

68
Fig 40: Comparison of Delta H of Unfired PA66 Fabric compared to
Virgin PA66 Fibre
The trend and hence the shape of the curve for PA66 fabrics is similar to
that of PA66 fibres. However, there is an important difference. The Delta
H values for the fabric samples are much higher than that found for fibre
samples. This is illustrated in Figure 40.
Although they follow the same trend, the fact that the Delta H values are
much higher for the fabric sample than the fibre sample is thought to be
caused by the construction of the fabric which is of course very different
to that of individual fibres.
As mentioned in the previous chapter, DSC tests were conducted at
300°C/min by taking fabric from different regions (inflator side and vent)
for both fired and unfired airbags. Table 4 shows the results.
Unfired Bag
Fired Bag
(Inflator Side)
Fired Bag
(Vent)
Average Delta
H (J/g) 96.4 ± 1.9 97.0 ± 1.7 98.3 ± 2.2
Table 4: Average Delta H of Fired Airbag in different regions
55.0
60.0
65.0
70.0
75.0
80.0
85.0
90.0
95.0
100.0
105.0
0 50 100 150 200 250 300 350
De
lta
H (
J/g)
Heating Rate (C/min)
Relationship of Delta H with Heating Rate
Virgin Fibre

69
Figure 41 illustrates how the Delta H varies depending on the region of a
fired airbag.
Fig 41: Delta H for Unfired and Fired Airbag at Different Regions
From Figure 41 it can be noticed that the Delta H increases for the fired
airbag as expected. However, it does not increase uniformly across the
entire bag. The Delta H is higher in the vent region compared to the
inflator side of the bag.
Heat from the inflator radiates outward, and hence the inflator side of the
bag is exposed to less heat as compared to the side which is opposite the
inflator and hence directly facing the inflator. The vent region is exposed
to a significant amount of heat as the hot gas escapes through the vent at
a very high pressure.
The previous chapter mentioned that there is another type of DSC which
is commonly used and that is “heat-flux DSC”. Heat-flux DSC was carried
out on unfired and fired airbags following the same procedure as power-
compensation DSC. Heat-flux DSC allows for more extreme temperature
90.0
92.0
94.0
96.0
98.0
100.0
102.0
Unfired Bag Fired Bag (Inflator Side) Fired Bag (Vent)
Ave
rage
De
lta
H (
J/g)
Average Delta H for Unfired and Fired Airbag at Different Regions

70
limits, and this was used to get a broader perspective. However, one
limitation of the heat-flux DSC is that it cannot run at very high heating
rates and thus tests were only done at 10°C/min. Figure 42 shows a
typical curve, this particular one being that of a fired airbag heated at
10°C/min from -50°C to 350°C.
Fig 42: Heat-flux DSC curve for a Fired Airbag
From the figure above it can be seen that the peak observed in heat-flux
DSC is upside-down if compared to a curve from power compensation
DSC. In a power-compensation DSC, the endothermic peaks – those
events which require energy point up – because the instrument must
supply more power to the sample to keep the sample and reference
furnaces at the same temperature. In a heat flux DSC, these same events
cause the sample to absorb heat and be cooler than the furnace, so they
point down. The reverse logic applies to exothermic events where energy
is released (Young and Lovell, 2011)

71
It can be seen from the curve that melting peak is located at the same
temperature as observed with power-compensation DSC. As before, the
peak can be integrated to find out the enthalpy of melting. Table 5 shows
the average results for Heat-Flux DSC.
Heat-Flux DSC
Avg. Delta H (Unfired Airbag) Avg. Delta H (Fired Airbag)
80.9 ± 2.9 83.8 ± 2.7
Table 5: Average Delta H for Unfired and Fired Airbag using Heat-
Flux DSC
As these results show, there is very little difference between the results
obtained. This indicates that the Delta H values are independent of the
type of DSC used. The table above compares the Delta H values of unfired
and fired airbags heated in power-compensation and heat-flux DSC at
10°C/min.
4.2 DMA
The previous chapter explained how DMA was used to characterise the
fibre modulus. Figure 43 shows how the storage modulus of the fibre
changes as it is heated from sub-zero temperature to beyond the melting
point of the fibre.
It can be seen from Figure 43 that the storage modulus drops sharply in
two regions, the glass transition and the crystalline melting. Outside of
these 2 regions, the storage modulus continues to fall although at a
slower rate.
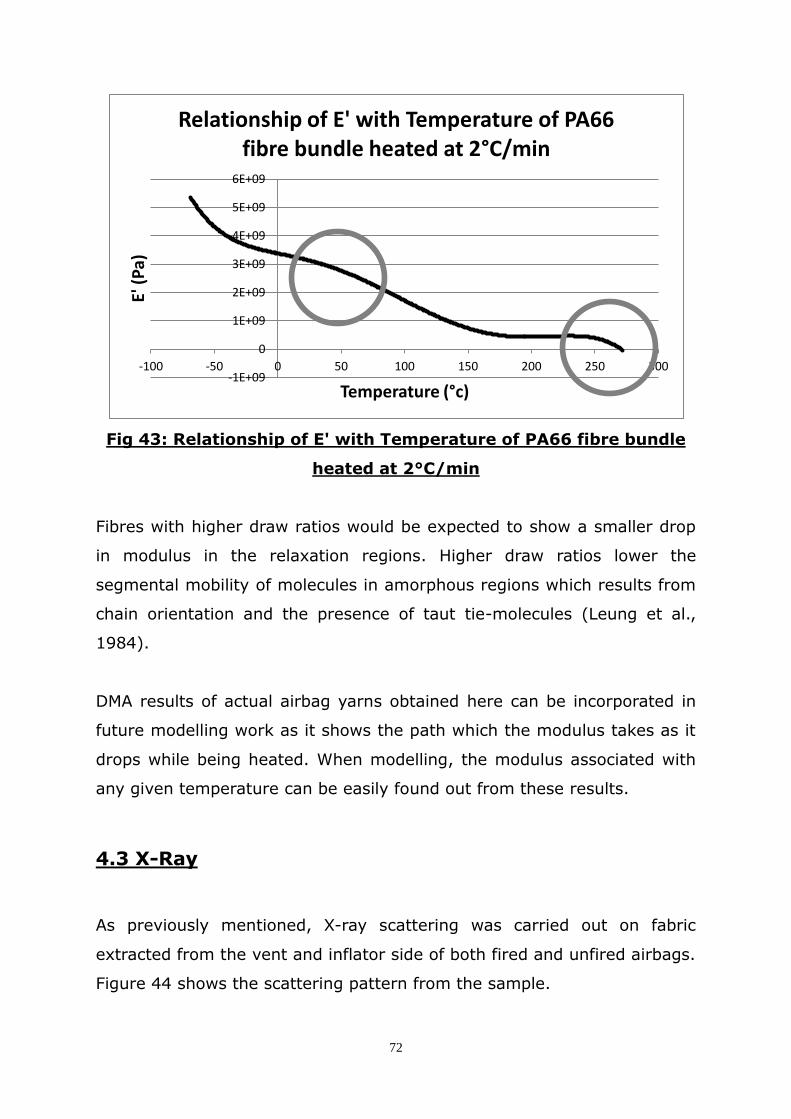
72
Fig 43: Relationship of E' with Temperature of PA66 fibre bundle
heated at 2°C/min
Fibres with higher draw ratios would be expected to show a smaller drop
in modulus in the relaxation regions. Higher draw ratios lower the
segmental mobility of molecules in amorphous regions which results from
chain orientation and the presence of taut tie-molecules (Leung et al.,
1984).
DMA results of actual airbag yarns obtained here can be incorporated in
future modelling work as it shows the path which the modulus takes as it
drops while being heated. When modelling, the modulus associated with
any given temperature can be easily found out from these results.
4.3 X-Ray
As previously mentioned, X-ray scattering was carried out on fabric
extracted from the vent and inflator side of both fired and unfired airbags.
Figure 44 shows the scattering pattern from the sample.
-1E+09
0
1E+09
2E+09
3E+09
4E+09
5E+09
6E+09
-100 -50 0 50 100 150 200 250 300
E' (
Pa)
Temperature (°c)
Relationship of E' with Temperature of PA66 fibre bundle heated at 2°C/min

73
The scattering intensity can be seen to drop, which suggests a decrease in
crystallinity. By calculating the areas under the crystalline peaks and the
amorphous halo, it is found that the crystallinity has dropped by 35%.
This is different to the DSC findings which showed an increase in
crystallinity. In X-ray measurements, there is no heat involved and hence
no scope for annealing.
Fig 44: X-ray scattering of Fired and Unfired Airbag Fibres
The two strong peaks which can be seen in Figure 44 is likely due to
lateral order and a high degree of hydrogen bonding in the crystallites
(Narten et al., 1991). There is also a fall in the area under the peak for
the fired airbag fabric sample as compared to the unfired airbag fabric
sample. It can also be noted that the peaks are slightly offset, which
suggests that the internal structure of the fibre is likely to have changed.
5 10 15 20 25 30 35 40 45 50 552Theta (°)
0
400
1600
3600
6400
10000
Inte
nsity (
counts
)
Fabric from non-fired airbag
Fabric from fired airbag (Vent and inflator side)

74
4.4 Tensile Tests
As mentioned in the previous chapter, tensile tests were also carried out
on heated and unheated fibres. Figure 45 shows the results obtained from
tensile tests on fibres which were placed inside an airbag and then fired
(uncontrolled heating).
Fig 45: Single fibre tensile tests on virgin PA66 and heated (inside
airbag) PA66.
The results in Figure 45 show that there is a definite decrease in the
modulus for the yarns exposed to an actual airbag deployment compared
to that of the virgin yarn sample. There is also a definite decrease in the
force required to break the fibre samples. The effect on strain to failure is
not very clear as the some of the samples broke at low strains while
others broke at high strains.
These tests were followed by the tests on fibres which were heated using
the DSC. Figure 46 shows the results from these tensile tests. These
results show that the there is a definite decrease in modulus for fibres
which were exposed to heat than that of virgin fibres. It can also be seen

75
that the modulus decreases with an increase in temperature and also an
increase in heating rate. Elad and Schultz, 1984 reported that the rate of
decrease of modulus of Nylon 6,6 fibre increases with increasing
temperature.
The force at which the fibre breaks also decreases for the fibres which
were subjected to heat. This is in agreement with Jain and Vijayan, 2002
who applied isothermal heat treatment on Nylon 6,6 and reported a drop
in breaking force with temperature.
Fig 46: Single fibre tensile tests (at room temperature) on virgin
PA66 and heat treated (in DSC) PA66.
The change in tensile properties is likely due to the change in chain
extension and orientation. If the molecular chains are extended and
highly oriented, it gives rise to an increase in stiffness and strength, as
the mechanical properties of the fibre become predominantly determined
by the strong covalent bonds along the chain backbone rather than by the
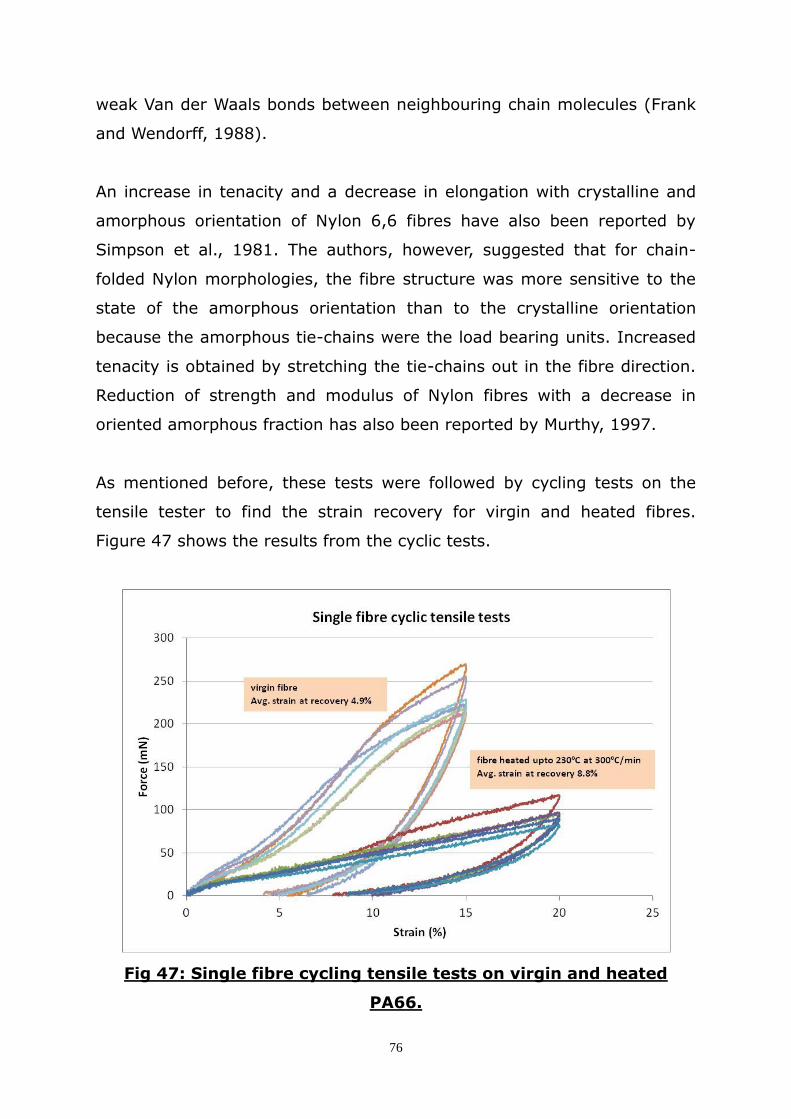
76
weak Van der Waals bonds between neighbouring chain molecules (Frank
and Wendorff, 1988).
An increase in tenacity and a decrease in elongation with crystalline and
amorphous orientation of Nylon 6,6 fibres have also been reported by
Simpson et al., 1981. The authors, however, suggested that for chain-
folded Nylon morphologies, the fibre structure was more sensitive to the
state of the amorphous orientation than to the crystalline orientation
because the amorphous tie-chains were the load bearing units. Increased
tenacity is obtained by stretching the tie-chains out in the fibre direction.
Reduction of strength and modulus of Nylon fibres with a decrease in
oriented amorphous fraction has also been reported by Murthy, 1997.
As mentioned before, these tests were followed by cycling tests on the
tensile tester to find the strain recovery for virgin and heated fibres.
Figure 47 shows the results from the cyclic tests.
Fig 47: Single fibre cycling tensile tests on virgin and heated
PA66.

77
It can be seen from Figure 47 that virgin fibres have better strain
recovery performance than the heated fibres. The average strain at
recovery for virgin fibres was 4.9% while the average strain at recovery
for the heated (230°C at 300°C/min) fibre was 8.8%. This means that the
unheated fibre has recovered 67% of the applied strain while the heated
fibre has only recovered 56% of the applied strain.
The heated fibre was taken to a higher strain because the fibre was able
to withstand the higher strain. The heat caused to fibre to allow more
elongation. The fact that the heated fibres recovers less than the
unheated fibre suggests there has been a reduction in orientation and/or
breakage of bonds between molecules which might have led to a less
elastic fibre.
4.5 Shrinkage
The previous chapter mentioned that shrinkage tests were carried out to
see if there was a change in orientation. The results for shrinkage of both
yarns and fabrics are given in Table 6.
Fabric
(Weft)
Fabric
(Warp) Yarn
Shrinkage % 5.71 ± 0.23 7.86 ± 0.34 8.29 ± 0.38
Table 6: Shrinkage (%) of PA66 Yarns and Fabrics (warp and weft
direction)
Figure 48 illustrates the amount of shrinkage.

78
Fig 48: Chart showing Shrinkage (%) of PA66 Fibres and Fabrics
(warp and weft direction)
From the results above if can be seen that the yarn shrinks more than the
fabric. When it comes to the fabric, the shrinkage is not uniform. There is
more shrinkage in the warp direction of the fabric as compared to the
weft direction which is due to the differences in tension between the yarns
in the warp and weft direction.
Apart from shrinkage, the fabric also changed colour due to the heat. A
yellow-brown discolouration was observed. This discolouration of Nylon is
a likely indication of the production of a conjugated structure. (Holland
and Hay, 2000)
As mentioned in the previous chapter, shrinkage tests were also carried
out on yarns by heating them in the DSC at different maximum
temperatures and different heating rates. These maximum temperatures
and heating rates were the same as those used for the tensile test
samples. The results are given in Table 7.
5.00
5.50
6.00
6.50
7.00
7.50
8.00
8.50
9.00
Fabric (Weft) Fabric (Warp) Yarn
Shri
nka
ge (
%)
Shrinkage of Fabric and Yarn

79
210°C at
10°C/min
210°C at
300°C/min
230°C at
10°C/min
230°C at
300°C/min
%
Shrinkage 18.10 ± 0.69 21.19 ± 0.71 35.88 ± 0.93 41.17 ± 0.96
Table 7: Shrinkage (%) of PA66 Yarn at different Maximum
Temperatures and Heating Rates
Figure 49 illustrates the different amounts of shrinkage for PA66 fibres.
Fig 49: Chart showing Shrinkage (%) of PA66 Fibres at different
Maximum Temperatures and Heating Rates
A trend can be seen from Figure 49. It can be seen that the shrinkage
(%) increases with both an increase in heating rate and an increase in
maximum temperature.
These shrinkage results suggest that the heat provided is sufficient to
change the structure of the material. The change in structure results in a
loss in orientation of the molecules, hence causing shrinkage. This is in
agreement with Prevorsek and Tobolsky, 1965 who found that the free
shrinkage of Nylon 6,6 fibres increased with temperate (100°C to melting
10.00
15.00
20.00
25.00
30.00
35.00
40.00
45.00
210°c at 10°c/min
210°c at 300°c/min
230°c at 10°c/min
230°c at 300°c/min
% S
hri
nka
ge
% Shrinkage at different temperatures and heating rates
80
point). The authors concluded that during the free shrinkage of an
oriented fibre, there is considerable disorientation of the primary axes of
the polymer crystallites, and the polymer reverts to the amorphous state
on melting.
However, others have explained free thermal shrinkage differently.
Dismore and Stratton, 1966 believed that the free thermal shrinkage of
oriented polymers involves a structural transformation between two
crystalline forms – the extended-chain and folded-chain conformations,
rather than a disorientation of the primary axes of polymer crystallites.
The authors explained that heat causes the intermolecular bonds to
loosen, and the chains move into folded conformation in which the bond
distances are smaller and the bond energies are lower.
The difference in views is likely due to the difference in temperature range
in which the authors have conducted their studies (Ribnick, 1969). Unlike
Dismore and Stratton, 1966, Prevorsek and Tobolsky, 1965 examined
samples which were heated close to their melting temperatures at which
point appreciable disorientation of the principal axis might be observed.
Buchanan and Dumbleton, 1969 analysed shrinkage behaviour of drawn
Nylon 6,6 yarns by annealing the yarns in air and in oil. The purpose of
this was to get different heating rates as the yarn absorbed heat from hot
oil much more rapidly than that from hot air. In both cases, the authors
found that the shrinkage increases with increasing annealing temperature,
however, the degree and also the rate of change is much greater for the
oil-annealed samples. This correlates well with the results obtained in this
research, i.e. shrinkage increases with both temperature and heating
rate.

81
4.6 Change in Diameter
The previous chapter mentioned that tests were carried out to find out the
associated change in diameter of the fibres due to shrinkage. The results
are given in Table 8.
Unheated
Fibre Heated Fibre % Increase
Diameter (µm)
18.6 ± 0.6 19.8 ± 0.9 6.42
Table 8: Diameter of PA66 Fibre before and after Heating
Figure 50 illustrates the change in diameter.
Fig 50: Chart showing the Diameter of PA66 Fibre before and after
Heating.
The diameter of the fibre increases as the fibre was heated without any
tension. The internal forces in the fibre relax when subjected to heat
which makes it swell in the radial direction giving a rise in diameter. Under
17.0
17.5
18.0
18.5
19.0
19.5
20.0
20.5
21.0
Unheated Fibre Heated Fibre
Dia
me
ter
(µm
)
Diameter of Unheated and Heated Fibre

82
tension heating, the diameter would be expected to go down (Zhang et
al., 2012).
Change in diameter tests were also carried out on yarns by heating them
in the DSC at different maximum temperatures and different heating
rates. These maximum temperatures and heating rates were the same as
those used for the tensile test samples. The results are given in Table 9.
Virgin
210°C @ 10°C/min
210°C @ 300°C/min
230°C @ 10°C/min
230°C @ 300°C/min
Diameter (µm)
18.6 ± 0.2 19.7 ± 0.3 19.8 ± 0.3 20.1 ± 0.4 20.2 ± 0.4
Table 9: Diameter of PA66 Fibre before and after Heating at
different Maximum Temperatures and Heating Rates
Just like shrinkage, the change in diameter also depends on the maximum
temperature and heating rate used. Figure 51 illustrates this.
Fig 51: Chart showing the Diameter of PA66 Fibre before and after
Heating at different Maximum Temperatures and Heating Rates
18.0
18.5
19.0
19.5
20.0
20.5
21.0
Virgin 210c @ 10c/min
210c @ 300c/min
230c @ 10c/min
230c @ 300c/min
Dia
me
ter
(µm
)
Diameter of Unheated and Heated Fibres

83
This is in good agreement with the shrinkage results. Higher shrinkage is
expected to give rise to higher diameter when the fibre is heated under
no tension. The result is also in agreement with the results obtained by
Zhang et al., 2012, although the authors have conducted their study
using PSU fibres. The authors have shown that the diameter increases
with treatment temperature. However, no relationship with heating rate
was mentioned. This study has shown that the diameter increases with
both temperature and heating rate.
During relaxation heating, the movement of the molecules cause the
internal force of the fibre to relax, therefore the fibre tended to shrink and
swell in the radial direction which explains the increase in diameter
(Zhang et al., 2012). Experiments done by Murthy, 1997 show that during
annealing, the diameter of drawn Nylon 6 increases. The author attributed
this increase to the crystallisation of the inter-fibrillar amorphous chain
segments, and melting and re-crystallisation of the smaller crystallites,
both of which could also contribute to fibre shrinkage.
Both shrinkage and diameter is seen to be influenced by heat and the
heating rate. The diameter of the fibre increases with an increase in
temperature and heating rate while the length of the fibre decreases
(increase in shrinkage). Figure 52 shows the relationship between the
shrinkage and the diameter of PA66 fibres.

84
Fig 52: Relationship between Change in Diameter and Shrinkage
of PA66 Fibres heated at different Temperatures and Heating
Rates
4.7 Correlation between Shrinkage and Tensile
Properties
From the tensile results, it was seen that PA66 fibres experienced
significant changes to tensile properties after being exposed to actual
airbag deployment conditions. The tests conducted in the DSC were seen
to give similar results.
Firstly, it was seen that there was a decrease in the average force at
failure. At the same time the average strain at failure increased after the
fibres were exposed to heat. Figure 53 shows the relationship between
the breaking force and the breaking strain for PA66 fibres heated at
different temperatures and heating rates.
5.0
5.5
6.0
6.5
7.0
7.5
8.0
8.5
9.0
9.5
15.0 20.0 25.0 30.0 35.0 40.0 45.0
Ch
ange
in D
iam
ete
r (%
)
Shrinkage (%)
Change in Diameter vs Shrinkage

85
Fig 53: Relationship of Breaking Force with Breaking Strain for
PA66 Fibres Heated at different Temperatures and Heating Rates
Secondly, it was seen that there is a decrease in initial stiffness of the
fibres after being exposed to heat. This decrease in stiffness is thought to
arise due to the loss in orientation of the molecules in the PA66 fibres,
which was confirmed by the shrinkage results. Orientation of molecular
chains gives rise to an increase of stiffness (Frank and Wendorff, 1988).
Since shrinkage is caused by a decrease in orientation, the stiffness in
this case is expected to go down.
Simpson et al., 1981 also found that tenactiy increases with increasing
crystalline and amorphous orientaion for Nylon 6,6 fibres while the
elongation decreases. Higher tenacity and lower elongation result from
higher stiffness. A reduction is molecular orientation (higher shrinkage)
will thus cause a reduction in stiffness. Figure 54 shows the relationship
between the stiffness and the shrinkage of PA66 heated at different
temperatures and heating rates.
180.0
190.0
200.0
210.0
220.0
230.0
240.0
250.0
260.0
270.0
280.0
25.0 27.0 29.0 31.0 33.0 35.0 37.0 39.0 41.0 43.0 45.0
Bre
akin
g Fo
rce
(m
N)
Breaking Strain (%)
Breaking Force vs Breaking Strain

86
Fig 54: Relationship of Initial Stiffness with Shrinkage for PA66
Fibres Heated at different Temperatures and Heating Rates
Similarly, the loss in orientation confirmed by the shrinkage tests is
thought to be the main cause for the fall in breaking force and the
resulting increase in breaking strain. Ribnick, A. 1969 studied the stress
dependency of thermal shrinkage for Nylon 6,6 yarns.. The author applied
a load to a yarn, heated it to a certain temperature and then removed the
load to measure shrinkage. It was found that increasing the load reduced
thermal shrinkage. It was also found that the final shrinkage was reached
in a shorter time as the load was increased.
Figures 55 and 56 show the relationships between the breaking force and
shrinkage, and the breaking strain and shrinkage respectively. It has not
been possible to outline an exact relationship due to a lack of data points,
however, Ribnick, A. 1969 found that thermal shrinkage fell rapidly with
increasing load which suggests that the relationships are likely to be
exponential.
4.5
4.7
4.9
5.1
5.3
5.5
5.7
5.9
15.0 20.0 25.0 30.0 35.0 40.0 45.0
Stif
fne
ss (
mN
)
Shrinkage (%)
Stiffness vs Shrinkage

87
Fig 55: Relationship of Breaking Force with Shrinkage for PA66
Fibres Heated at different Temperatures and Heating Rates
Fig 56: Relationship of Breaking Strain with Shrinkage for PA66
Fibres Heated at different Temperatures and Heating Rates
180.0
190.0
200.0
210.0
220.0
230.0
240.0
250.0
260.0
270.0
280.0
15.0 20.0 25.0 30.0 35.0 40.0 45.0
Bre
akin
g Fo
rce
(m
N)
Shrinkage (%)
Breaking Force vs Shrinkage
25.0
30.0
35.0
40.0
45.0
50.0
15.0 20.0 25.0 30.0 35.0 40.0 45.0
Bre
akin
g St
rain
(%
)
Shrinkage (%)
Breaking Strain vs Shrinkage

88
Chapter 5: Conclusions and Further
Research
This chapter summarises and concludes the major findings in this
research. It also suggests further areas of research which can be very
useful in order to better understand the effects of airbag deployment on
the airbag material.
5.1 Conclusions
Thermal tests were conducted on airbag fibres and fabrics. DSC was used
to measure the difference in enthalpy between fired and unfired airbags,
and between heated and unheated airbag fibres. DMA was used to
establish a path which the storage modulus takes as an airbag yarn is
heated from sub-zero temperature to melting temperature. The data
obtained from DMA will be used in future modelling work.
DSC results show that the fired airbag fabrics and the heated airbag fibres
show a higher value of delta H as compared to the unfired airbag fabric
and virgin airbag fibre. For both unheated and heated fibres and also for
unfired and fired fabrics, the delta H values seemed to be heating rate
dependant. The higher the heating rate used, the greater the value of
delta H obtained. Although the same trend was seen for both fibres and
fabrics, the actual delta H values were higher for fabrics that those of
fibres. DSC tests on fired airbags were done by extracting samples from
different regions of the bag. Compared to the unfired airbag, the delta H
value was higher for both the regions – inflator side and the vent.
However, the increase in delta H was greater for the vent region than that
of the inflator side.

89
DSC was also used to analyse the effect of cooling rate of delta H. The
delta H on second heating seemed to decrease with increasing cooling
rate. The delta H drops sharply between cooling rates of 10°C/min and
100°C/min. From 100°C/min to 600°C/min, the delta H continues to drop,
but at a much slower rate.
DMA was conducted on airbag yarns straight from a bobbin. The storage
modulus dropped as the sample was heated from sub-zero temperature to
melting point of the material. The drop was sharp in two regions – the
glass-transition and the melting point. As mentioned before, the main
purpose of conducting DMA was to establish a path which the storage
modulus takes when heated to be used in future modelling work.
Tensile tests were initially done on single fibres extracted from virgin
yarns and from yarns fired inside an airbag. There is a clear drop in
modulus and tensile strength. A range of values is found for modulus and
breaking force, with some fibres having a very low modulus breaking at
very low forces while some fibres seem to have a relatively high modulus
and breaking at higher forces. This breaking force is still lower than that
of virgin fibres. The range of values is likely due to the fact that fibres
were extracted randomly from the fired yarn, i.e. some of the fibres
originated from the surface of the yarn while some from the core of the
yarn.
Tensile tests were also carried out on fibres which were heated in a DSC
in a controlled environment. A similar trend was seen compared to the
uncontrolled heating environment, i.e. the modulus and breaking force
seemed to drop with heat. To be more precise, the modulus and breaking
forced dropped with increasing temperature and increasing heating rate.
DSC results showed that delta H increased with heat, which means that
there is a slight increase in crystallinity. At the same time, tensile results

90
showed that the modulus and breaking force decrease with heat. As the
modulus dropped, the fibre showed higher elongation at break but at the
same time becomes less elastic. This is confirmed by the drop in elastic
recovery of the fibre.
The drop in strength despite a rise in crystallinity can be explained by a
change in molecular orientation of the fibre. Change in orientation is
confirmed by shrinkage when the fibre is heated under no tension.
Shrinkage seemed to increase with temperature and heating rate which
led to an increase in fibre diameter which also followed the same trend
and increased with temperature and heating rate. Correlations of
stiffness, breaking force and breaking strain with shrinkage showed that
stiffness and breaking force decreases with increasing shrinkage while
breaking strain increases with increasing shrinkage.
5.2 Scope for Further Research
This project has been able to shed some light on what actually happens at
the fibre and fabric level when automotive airbag materials are subjected
to deployment conditions. However, further research is necessary in order
to fully understand the heat effects on automotive airbags.
Change or loss in orientation: this research has concluded that
there is a loss in orientation of the fibre molecules which results in
the drop in some tensile properties such as modulus and tensile
strength. However, it will be useful to look at exactly what
orientation these molecules take after heating. This can be achieved
using Raman Spectroscopy or Flat-plate X-ray diffraction for
example.
Test coated airbags: this research has only looked at uncoated
airbags, but coated airbags are also used widely in the industry.

91
Coated airbags might have a very different reaction to heat. The
properties of coated airbags after heating will be very interesting to
consider as the heat tends to cause physical degradation of the
coating material and the fabric, but it may also form some sort of a
composite structure.
Dynamic thermo-mechanical testing: the tests conducted in this
project were mostly static. To understand how heat and mechanical
loading works in combination to alter the properties of airbag
materials, dynamic thermo-mechanical testing needs to be carried
out. This can be done on both yarns and fabrics by developing high
strain rigs with bi-axial loading capability and with a controllable
heat source.

92
References
Airbag Inflators [Online]. The Clemson University Vehicular Electronics
Laboratory. Available:
http://www.cvel.clemson.edu/auto/actuators/airbag.html [Accessed
29th August 2012].
Airbags 101 [Online]. Available: http://nettleslawblog.com/blog-
old/?currentPage=45 [Accessed 19th August 2012].
Crash Test - Driver Airbag [Online]. Autoliv. Available:
http://adam.autoliv.com/Standard/CatalogAuto.jsp [Accessed 29th
September 2012].
European Commission [Online]. Available:
http://ec.europa.eu/health/opinions/en/dental-
amalgam/glossary/pqrs/polymer.htm [Accessed 17th August 2012].
Lexus [Online]. Available:
http://www.lexus.com/models/IS/features/safety/airbags.html
[Accessed 2nd May 2012].
International Union of Pure and Applied Chemistry [Online]. Available:
http://pac.iupac.org/publications/pac/pdf/1974/pdf/4003x0477.pdf
[Accessed 6th July 2013].
ARAKAWA, T., NAGATOSHI, F. & ARAI, N. 1969. Melting Behavior and
Morphology of Drawn Nylon 6. Journal of Polymer Science, 7, 1461-
1472.
BELL, J. P. 1972. The Effect of Rate and Temperature of Drawing on the
Properties of Nylon 6,6 Fibers. Textile Research Journal, 42, 292-
297.
BELL, J. P. & HUGHES, A. J. 1978. Selective Degradation of Nylon 6,6. II.
Application of the Degradation Technique to Commercially Drawn
Fibers. Journal of Polymer Science: Polymer Physics Edition, 16,
215-222.
BOWER, D. I. 2002. An Introduction to Polymer Physics, Cambridge
University Press.

93
BUCHANAN, D. R. & DUMBLETON, J. H. 1969. Effect of Annealing
Conditions in the Structure of Drawn Nylon 66 Yarns. Journal of
Polymer Science, 7, 113-122.
CRYSTAL, R. G. & HANSEN, D. 1968. Morphology of Cold-Drawn Nylon 66.
Journal of Polymer Science, Part A-2, 6, 981-993
BUNN, C. W. & GARNER, E. V. 1947. The Crystal Structures of Two
Polyamides (Nylons). Proceedings of the Royal Society of London -
Mathematical, Physical and Engineering Sciences, 189, 39-68.
DISMORE, P. E. & STRATTON, W. O. 1966. Chain Folding in Oriented Nylon
66 Fibers. Journal of Polymer Science, 13, 133-148.
ELAD, J. & SCHULTZ, J. M. 1984. Microstructural Rearrangement during
Heat Treatment of Drawn Nylon 66 Fiber Journal of Polymer
Science, 22, 781-792.
EMRI, I., BERNSTORFF, B. V. & VOLOSHIN, A. 2006. Effect of Heating on
Fiber Shrinkage. Proceedings of the 2006 SEM Annual Conference
and Exposition on Experimental and Applied Mechanics, Paper 23
FRANK, O. & WENDORFF, J. H. 1988. Polyamide 6,6 fibers: Tensile
deformation behavior and chain scission. Colloid & Polymer Science,
266, 216-226.
FULLER, C. S. 1940. The investigation of synthetic linear polymers by x-
rays. Chemical Reviews, 26, 143-167.
FULLER, C. S., BAKER, W. O. & PAPE, N. R. 1940. Crystalline behavior of
linear polyamides. Effect of heat treatment. Journal of the American
Chemical Society, 62, 3275-3281.
HOLLAND, B. J. & HAY, J. N. 2000. Thermal degradation of nylon
polymers. Polymer International, 49, 943-948.
HOU, Y., SUN, T., WANG, H. & WU, D. 2008. Effect of Heating Rate on the
Chemical Reaction during Stabilization of Polyacrylonitrile Fibers.
Textile Research Journal, 78, 806-811.
ILLERS, K. H. 1975. Dynamic mechanical behaviour of drawn nylon 66
and poly(ethylene terephthalate). Colloid and Polymer Science, 253,
329-331.
JAIN, A. & VIJAYAN, K. 2002. Effect of thermal ageing on Nylon 6,6 fibres.
Journal of Materials Science, 37, 2623-2633.

94
JENEKHE, S. A. & ROBERTS, M. F. 1993. Effects on Intermolecular Forces
on the Glass Transition of Polymers. Macromolecules, 26, 4981-
4983.
KESHAVARAJ, R., TOCK, R. W. & NUSHOLTZ, G. S. 1996. A Realistic
Comparison of Biaxial Performance of Nylon 6,6 and Nylon 6 Fabrics
Used in Passive Restraints - Airbags Journal of Applied Polymer
Science, 61, 1541-1552.
KONG, Y. & HAY, J. N. 2002. The measurement of the crystallinity of
polymers by DSC. Polymer, 43, 3873-3878.
LEUNG, W. P., HO, K. H. & CHOY, C. L. 1984. Mechanical Relaxations and
Moduli of Oriented Nylon 66 and Nylon 6 Journal of Polymer
Science: Polymer Physics Edition, 22, 1173-1191.
MORTON, W. E. & HEARLE, J. W. S. 1993. Physical properties of textile
fibres, Textile Institute.
MUKHOPADHAY, S. K. & PARTRIDGE, J. F. 1999. Automotive Textiles.
Textile Progress, 29, 1-125.
MURTHY, N. S. 1997. Fibrillar Structure and Its Relevance to Diffusion,
Shrinkage, and Relaxation Processes in Nylon Fibers. Textile
Research Journal, 67, 511-520.
NARTEN, A. H., HABENSCHUSS, A. & XENOPOULOS, A. 1991. Diffraction
pattern and structure of amorphous and crystalline regions in
semicrystalline nylon 6.6. Polymer, 32, 1923-1927.
PAI, C., JENG, J., GROSSMAN, S. J. & HUANG, J. 1989. Effects of Moisture
on Thermal and Mechanical Properties of Nylon-6,6. Advances in
Polymer Technology, 9, 157-163.
PREVORSEK, D. & TOBOLSKY, A. V. 1965. Determination of Non-Flow
Shrinkage in Oriented Fibers. Textile Research Journal, 33, 795-
802.
RAMESH, C., KELLER, A. & ELTINK, S. J. E. A. 1994. Studies on the
crystallization and melting of nylon-6,6: 1. The dependence of the
Brill transition on the crystallization temperature. Polymer, 35,
2483-2487.

95
RIBNICK, A. 1969. Thermal Shrinkage of Oriented Nylon 66 Yarns as a
Function of Time, Temperature, and Stress. Textile Research
Journal, 39, 428-434.
SEPE, M. 2011. The effects of temperature [Online]. Plastics Technology.
Available: http://www.ptonline.com/columns/the-effects-of-
temperature [Accessed 15th August 2012].
SIMPSON, P. G., SOUTHERN, J. H. & BALLMAN, R. L. 1981. Nylon 6,6
Fiber Tensile Properties as a Function of Morphology. Textile
Research Journal, 51, 97-100.
STACK, G. M., MANDELKERN, L. & VOIGT-MARTIN, I. G. 1982. Changes in
Crystallite Size Distribution During the Isothermal Crystallization of
Linear Polyethylene Polymer Bulletin, 8, 421-428.
STARKWEATHER JR., H. W., MOORE, G. E., HANSEN, J. E., RODER, T. M. &
BROOKS, R. E. 1956. Effect of Crystallinity on the Properties of
Nylons. Journal of Polymer Science, 21, 189-204.
STATTON, W. O. 1972. High-Temperature Annealing of Drawn Nylon 66
Fibers. Journal of Polymer Science, 10, 1587-1592.
SUN, J. & BARNES, J. A. 2010. Materials Selection for Airbag Fabrics. Du-
Pont. Available:
http://www2.dupont.com/Automotive/en_US/assets/downloads/mat
erialssselectionairbagfabrics.pdf [Accessed 12th September 2012].
WHITE, J. L. & CAKMAK, M. 1986. Orientation Development and
Crystallization in Melt Spinning of Fibers Advances in Polymer
Technology, 6, 295-338.
YONGQIANG, X., QINGSHENG, Z. & CHUNHUI, L. 2001. The
Thermodynamic Relations between the Melting Point and the Size of
Crystals. Journal of Colloid and Interface Science, 243, 388-390.
YOUNG, R. J. & LOVELL, P. A. 2011. Introduction to Polymers, CRC Press,
Taylor & Francis Group LLC.
ZHANG, L., LIU, L., PAN, F., WANG, D. & PAN, Z. 2012. Effects of Heat
Treatment on the Morphology and Performance of PSU Electrospun
Nanofibrous Membrane. Journal of Engineered Fibers and Fabrics, 7-
16.