effect of heat input on weld formation and tensile
TRANSCRIPT

University of Wollongong University of Wollongong
Research Online Research Online
Faculty of Engineering and Information Sciences - Papers: Part B
Faculty of Engineering and Information Sciences
2019
Effect of heat input on weld formation and tensile properties in Effect of heat input on weld formation and tensile properties in
keyhole mode TIG welding process keyhole mode TIG welding process
Zhenyu Fei University of Wollongong, [email protected]
Zengxi Stephen Pan University of Wollongong, [email protected]
Dominic Cuiuri University of Wollongong, [email protected]
Hui Jun Li University of Wollongong, [email protected]
Bintao Wu [email protected]
See next page for additional authors
Follow this and additional works at: https://ro.uow.edu.au/eispapers1
Part of the Engineering Commons, and the Science and Technology Studies Commons
Recommended Citation Recommended Citation Fei, Zhenyu; Pan, Zengxi Stephen; Cuiuri, Dominic; Li, Hui Jun; Wu, Bintao; Ding, Donghong; and Su, Lihong, "Effect of heat input on weld formation and tensile properties in keyhole mode TIG welding process" (2019). Faculty of Engineering and Information Sciences - Papers: Part B. 3475. https://ro.uow.edu.au/eispapers1/3475
Research Online is the open access institutional repository for the University of Wollongong. For further information contact the UOW Library: [email protected]

Effect of heat input on weld formation and tensile properties in keyhole mode TIG Effect of heat input on weld formation and tensile properties in keyhole mode TIG welding process welding process
Abstract Abstract 2019 by the authors. Licensee MDPI, Basel, Switzerland. Keyhole mode Tungsten Inert Gas (K-TIG) welding is a novel advanced deep penetration welding technology which provides an alternative to high power density welding in terms of achieving keyhole mode welding. In order to facilitate welding procedure optimisation in this newly developed welding technology, the relationship among welding parameters, weld formation and tensile properties during the K-TIG welding was investigated in detail. Results show that except for travel speed, the heat input level also plays an important role in forming undercut defect by changing the plasma jet trajectory inside keyhole channel, leading to the formation of hump in the weld centre and exacerbation of undercut formation. Both undercut defect and root side fusion boundary can act as a stress concentration point, which affects the fracture mode and tensile properties considerably. The research results provide a practical guidance of process parameter optimisation and quality assurance for the K-TIG welding process.
Disciplines Disciplines Engineering | Science and Technology Studies
Publication Details Publication Details Fei, Z., Pan, Z., Cuiuri, D., Li, H., Wu, B., Ding, D. & Su, L. (2019). Effect of heat input on weld formation and tensile properties in keyhole mode TIG welding process. Metals, 9 (12),
Authors Authors Zhenyu Fei, Zengxi Stephen Pan, Dominic Cuiuri, Hui Jun Li, Bintao Wu, Donghong Ding, and Lihong Su
This journal article is available at Research Online: https://ro.uow.edu.au/eispapers1/3475

metals
Article
Effect of Heat Input on Weld Formation and TensileProperties in Keyhole Mode TIG Welding Process
Zhenyu Fei 1,2, Zengxi Pan 1,2, Dominic Cuiuri 1,2, Huijun Li 1,2, Bintao Wu 1, Donghong Ding 3,*and Lihong Su 1,2
1 School of Mechanical, Materials, Mechatronic and Biomedical Engineering, University of Wollongong,Northfield Avenue, Wollongong, NSW 2522, Australia; [email protected] (Z.F.);[email protected] (Z.P.); [email protected] (D.C.); [email protected] (H.L.);[email protected] (B.W.); [email protected] (L.S.)
2 Defence Materials Technology Centre, 24 Wakefield Street, Hawthorn, VIC 3122, Australia3 School of Mechatronic Engineering, Foshan University, 33 Guangyun Road, Foshan 528225, China* Correspondence: [email protected]; Tel.: +86-13054466797
Received: 20 October 2019; Accepted: 4 December 2019; Published: 7 December 2019�����������������
Abstract: Keyhole mode Tungsten Inert Gas (K-TIG) welding is a novel advanced deep penetrationwelding technology which provides an alternative to high power density welding in terms ofachieving keyhole mode welding. In order to facilitate welding procedure optimisation in this newlydeveloped welding technology, the relationship among welding parameters, weld formation andtensile properties during the K-TIG welding was investigated in detail. Results show that except fortravel speed, the heat input level also plays an important role in forming undercut defect by changingthe plasma jet trajectory inside keyhole channel, leading to the formation of hump in the weld centreand exacerbation of undercut formation. Both undercut defect and root side fusion boundary can actas a stress concentration point, which affects the fracture mode and tensile properties considerably.The research results provide a practical guidance of process parameter optimisation and qualityassurance for the K-TIG welding process.
Keywords: K-TIG; heat input; weld formation; tensile properties; welding procedure optimisation
1. Introduction
Tungsten Inert Gas welding, also known as TIG or GTAW, is a clean and widely used weldingtechnology for metals. Nevertheless, a main disadvantage of this welding process is the limitedpenetration ability. It may require multipasses to complete the weld for medium thickness materials,which results in very low productivity. In order to overcome this drawback, K-TIG was developed as anew TIG variant to increase the penetration capability and production efficiency. In K-TIG welding, afree burning arc is applied as the heat source to melt the weldment by forming a cylindrical keyhole [1],which provides a nice alternative to high power density welding. This type of keyhole welding ischaracterized by its dependence on arc force, as opposed to ablation pressure in laser-based andelectron beam-based welding, and a combination of stagnation and recoil pressure in plasma arcwelding (PAW), as reported by Jarvis and Ahmed [2]. Compared with standard melt-in mode TIGwelding, K-TIG process possesses higher energy density, process efficiency and greater penetrationability. Although heat density of K-TIG is far lower compared to high power density welding, it iseasier to operate and more cost-effective, as stated by Liu et al. [3]. In addition, Liu et al. [4] reportedthat K-TIG was able to achieve continuous open keyhole and was more stable than PAW. It was alsodemonstrated by Liu et al. [5] that K-TIG had much wider operating window compared with PAWowing to the fact that it has much smaller arc pressure/arc current ratio.
Metals 2019, 9, 1327; doi:10.3390/met9121327 www.mdpi.com/journal/metals

Metals 2019, 9, 1327 2 of 15
To date, K-TIG has found applications in industries for joining medium thickness materials, saytitanium [6], zirconium [7], stainless steel [8], low carbon steel [9] and dissimilar metal welding [10].It was shown in these studies that K-TIG can complete the medium thickness weld in a single passwith a V-shaped morphology. It was also shown that K-TIG produced a welded joint with smallerfusion zone and larger heat-affected zone compared with conventional TIG welding process. Inaddition, it has been demonstrated that K-TIG has the potential to increase the productivity whilemaintaining the mechanical properties at a level similar to the joints produced by conventional TIGwelding. Recently, it was reported by Cui et al. [11] that K-TIG can even be used in underwatercondition and can produce a duplex stainless-steel weld that meets underwater welding standards. Inaddition, because of the fact that the material properties of some welded joints produced by K-TIGare not satisfactory, several optimisation technologies have been introduced into the K-TIG weldingprocess. For example, Fei et al. [12] introduced filler materials into K-TIG to improve the weldmicrostructure and mechanical properties of armour steel weld. Fei et al. [13] also applied speciallydesigned interlayer to tailor the microstructure and solidification sequence of K-TIG-welded armoursteel joint. Post-weld heat treatment and ultrahigh frequency were utilised by Xie et al. [14] to improveboth the mechanical properties and corrosion resistance of 430 ferritic stainless steel welded joint. Onthe other hand, since K-TIG has a narrower operating window for carbon steel because of its higherthermal conductivity, several studies have focused on the keyhole behaviour and stability improvement,such as the application of back purging unit [15], one pulse one keyhole technique [16] and highfrequency pulse current waveform [17]. Furthermore, in order to develop on-line control strategy forthe K-TIG welding process, several penetration monitoring systems have been developed, such asarc voltage-based oscillation frequency sensing [18] and combination of acoustics and vision-basedsensing [19].
Overall, the current research directions of the K-TIG welding technology can be divided into fourparts, namely metallurgical qualification of K-TIG welded joints, optimisation technology for jointmicrostructure and properties, process dynamics and stability improvement as well as developmentof on-line monitoring system. Up to date, there has been little research on the relationship amongprocess parameters, weld formation and mechanical properties in the K-TIG welding process. Moreimportantly, unlike conventional TIG welding for which the weld formation can be partially controlledor compensated by the operators, the K-TIG operates in a completely automated mode, with the weldformation being entirely dependent on the welding parameter combination. Although in some studies,small amount of welding trials were conducted to test the influence of welding parameters in theK-TIG welding, the main purpose was to find a parameter combination to achieve full penetration,as did by Cui et al. [8] and Feng et al. [20]. The mechanism for defect formation and the correlationbetween weld formation and mechanical properties in the K-TIG welding process have not beenaddressed. To a practical view, the mechanical properties, especially tensile properties, are easilyaffected by weld formation which is a function of process parameters used during welding. Figuringout the relationship among welding parameters, weld formation, and mechanical properties is helpfulto the process optimisation and is crucial for the avoidance of defect formation and premature failureduring service.
In this study, K-TIG welding was performed on 6.2 mm thickness high hardness armour (HHA)plates using different welding parameter combination, aiming at evaluating the effect of heat input onweld formation and tensile properties. The mechanism by which various behaviours occurred hasbeen discussed. The results would provide a practical guidance of parameter optimisation and qualityassurance for the K-TIG welding process.
2. Materials and Methods
The material used for investigation is 500 grade armour steel, also known as HHA. Detailedchemical composition and mechanical properties of the base plate are listed in Tables 1 and 2,respectively. The chemical composition was measured by atomic emission spectroscopy. The base

Metals 2019, 9, 1327 3 of 15
metal shows tempered martensite microstructure, as shown in Figure 1. It is worth noting here that asthis paper is intended to analyse the relationship among welding parameters, weld formation andtensile properties, the material-dependent aspect will not be discussed in detail.
Table 1. Chemical composition of HHA (wt%).
C Si Mn P S Ni Cr Mo B Fe
0.27 0.3 0.3 0.014 0.0025 0.19 1.05 0.25 0.0012 Bal.
Table 2. Mechanical properties of HHA.
Materials Ultimate Tensile Strength (MPa) Elongation (%) Hardness (HV)
HHA 1775 14 495
Metals 2019, 9, x FOR PEER REVIEW 3 of 15
as this paper is intended to analyse the relationship among welding parameters, weld formation and tensile properties, the material-dependent aspect will not be discussed in detail.
Table 1. Chemical composition of HHA (wt%).
C Si Mn P S Ni Cr Mo B Fe 0.27 0.3 0.3 0.014 0.0025 0.19 1.05 0.25 0.0012 Bal.
Table 2. Mechanical properties of HHA.
Materials Ultimate tensile strength (MPa) Elongation (%) Hardness (HV) HHA 1775 14 495
Figure 1. Microstructure of the HHA base metal.
As depicted in Figure 2, the experimental equipment designed to conduct the welding trials was composed of a K-TIG power supply, a data acquisition device and a high-speed camera. The welding output was provided by a special power source with capability up to 1000 A. A high-speed camera in combination with a 10% transparency neutral filter was placed beside the worktable in order to record the arc behaviour. An inert gas back purge unit was designed to provide shielding from the atmospheric contamination on the root side of the weld pool. The argon shielding gas was transferred into the back purging unit from the left-hand side hose hole and allowed to be ejected through the switch on the right-hand side to avoid accumulation of pressure inside the unit. The image capturing was conducted after the process reached stable. During welding, the torch and high-speed camera were kept stationary while the worktable moved at the pre-set speed.
Figure 2. Schematic of experimental system.
Figure 1. Microstructure of the HHA base metal.
As depicted in Figure 2, the experimental equipment designed to conduct the welding trials wascomposed of a K-TIG power supply, a data acquisition device and a high-speed camera. The weldingoutput was provided by a special power source with capability up to 1000 A. A high-speed camerain combination with a 10% transparency neutral filter was placed beside the worktable in order torecord the arc behaviour. An inert gas back purge unit was designed to provide shielding from theatmospheric contamination on the root side of the weld pool. The argon shielding gas was transferredinto the back purging unit from the left-hand side hose hole and allowed to be ejected through theswitch on the right-hand side to avoid accumulation of pressure inside the unit. The image capturingwas conducted after the process reached stable. During welding, the torch and high-speed camerawere kept stationary while the worktable moved at the pre-set speed.
To test the influence of process parameters on weld formation and tensile properties, sevenbutt-joint welding experiments were performed on 6.2 mm thickness HHA plates by using controlvariable method. Process window identification tests were conducted to find the appropriate parametercombination leading to full penetration with the absence of both incomplete penetration because ofinsufficient heat input and weld pool collapse because of excessive heat input. Detailed parametercombination is depicted in Table 3. The heat input was calculated by the product of welding currentand voltage divided by the travel speed plus a thermal coefficient of 0.6. The arc length was measuredby the stacked thickness measurement device before welding. The dimension of the plates used in thisstudy is 250 mm × 75 mm × 6.2 mm. The welding current and travel speed were chosen as variables.The fixed parameters for all experimental groups are depicted in Table 4. After welding, both transverseand longitudinal cross sections of the welds were cut from the weldments. The longitudinal crosssection was cut in the arc extinguishment area in a bid to capture the in-situ profile during welding.The surface morphology and cross section macrographs were captured by Nikon digital camera and

Metals 2019, 9, 1327 4 of 15
Leica M205A stereomicroscope, respectively. The mounted samples were etched with 2 wt% nitalfor both macro and microstructure observation. Microhardness test was undertaken using StruersDuraScan-70 automatic hardness tester 2 mm below the surface with 0.5 mm interval under a load of1 kg for 10 s dwell time. The preparation of tensile samples and the execution of tensile tests werein accordance with ASTM E8/E8M-16a guideline. The tensile samples were cut perpendicular to thewelding direction using Wire Electrical Discharge Machining. Tensile tests were performed in as-cutcondition without any finishing on the surface of tensile samples with 1 mm/min crosshead speed and25 mm gauge length (Figure 3). The thickness of all tensile test specimens is 6.2 mm. A CCD camerawas used to measure the total elongation by capturing the movement of two white spots with 25-mminterval on the tensile specimens. In order to ensure the reproducibility of tensile results, three sampleswere tested and the average value was considered.
Metals 2019, 9, x FOR PEER REVIEW 3 of 15
as this paper is intended to analyse the relationship among welding parameters, weld formation and tensile properties, the material-dependent aspect will not be discussed in detail.
Table 1. Chemical composition of HHA (wt%).
C Si Mn P S Ni Cr Mo B Fe 0.27 0.3 0.3 0.014 0.0025 0.19 1.05 0.25 0.0012 Bal.
Table 2. Mechanical properties of HHA.
Materials Ultimate tensile strength (MPa) Elongation (%) Hardness (HV) HHA 1775 14 495
Figure 1. Microstructure of the HHA base metal.
As depicted in Figure 2, the experimental equipment designed to conduct the welding trials was composed of a K-TIG power supply, a data acquisition device and a high-speed camera. The welding output was provided by a special power source with capability up to 1000 A. A high-speed camera in combination with a 10% transparency neutral filter was placed beside the worktable in order to record the arc behaviour. An inert gas back purge unit was designed to provide shielding from the atmospheric contamination on the root side of the weld pool. The argon shielding gas was transferred into the back purging unit from the left-hand side hose hole and allowed to be ejected through the switch on the right-hand side to avoid accumulation of pressure inside the unit. The image capturing was conducted after the process reached stable. During welding, the torch and high-speed camera were kept stationary while the worktable moved at the pre-set speed.
Figure 2. Schematic of experimental system. Figure 2. Schematic of experimental system.
Table 3. Welding parameter combination.
Test No. Welding Current(A)
Arc Voltage(V)
Travel Speed(cm/min)
Heat Input(kJ/cm)
1 450 16.41 34.2 7.782 465 16.52 34.2 8.13 480 16.69 34.2 8.424 510 17.11 34.2 9.185 450 16.59 30 8.966 450 16.44 26 10.227 450 16.57 24 11.16
Table 4. Fixed welding parameters (all experiments).
Process Parameters Details
Electrode materialElectrode diameter
Lanthanated tungsten6.4 mm
Electrode tip angle 45 degreeShielding gas 99.95% Ar
Shielding gas flow rate 20 l/minBack purging gas 99.95% Ar
Back purging gas flow rate 10 l/minPost flow shielding time
Arc length10 s
3 mm

Metals 2019, 9, 1327 5 of 15
Metals 2019, 9, x FOR PEER REVIEW 5 of 15
Figure 3. Dimension of tensile specimen.
3. Results and Discussion
3.1. Surface Formation
Tables 5 and 6 illustrate both the face side and root side surface formation for the weldments with different parameters. It can be observed that when the travel speed was fixed at 34.2 cm/min, undercut was experienced for all the weldments, as marked by red arrows and shown in Table 5. When the travel speed was reduced to 30 cm/min, the undercut defect disappeared, together with smooth surface formation on both sides, as shown in Table 6. A further decrease in travel speed led to wavy ripples along the face side weld edges, as highlighted by red circles, although undercut was not experienced. Also, even irregular bead face was produced on the root side when the travel speed was reduced to 24 cm/min in Test 7 sample.
Table 5. Weld surface formation with different arc current.
Fixed parameters: Speed = 34.2 cm/min, Arc length = 3 mm Face side Root side
Figure 3. Dimension of tensile specimen.
3. Results and Discussion
3.1. Surface Formation
Tables 5 and 6 illustrate both the face side and root side surface formation for the weldments withdifferent parameters. It can be observed that when the travel speed was fixed at 34.2 cm/min, undercutwas experienced for all the weldments, as marked by red arrows and shown in Table 5. When thetravel speed was reduced to 30 cm/min, the undercut defect disappeared, together with smooth surfaceformation on both sides, as shown in Table 6. A further decrease in travel speed led to wavy ripplesalong the face side weld edges, as highlighted by red circles, although undercut was not experienced.Also, even irregular bead face was produced on the root side when the travel speed was reduced to24 cm/min in Test 7 sample.
Table 5. Weld surface formation with different arc current.
TestNo.
DefectType
Fixed parameters: Speed = 34.2 cm/min, Arc length = 3 mm Variable
Face side Root side Current
1 Undercut
Metals 2019, 9, x FOR PEER REVIEW 5 of 15
Figure 3. Dimension of tensile specimen.
3. Results and Discussion
3.1. Surface Formation
Tables 5 and 6 illustrate both the face side and root side surface formation for the weldments with different parameters. It can be observed that when the travel speed was fixed at 34.2 cm/min, undercut was experienced for all the weldments, as marked by red arrows and shown in Table 5. When the travel speed was reduced to 30 cm/min, the undercut defect disappeared, together with smooth surface formation on both sides, as shown in Table 6. A further decrease in travel speed led to wavy ripples along the face side weld edges, as highlighted by red circles, although undercut was not experienced. Also, even irregular bead face was produced on the root side when the travel speed was reduced to 24 cm/min in Test 7 sample.
Table 5. Weld surface formation with different arc current.
Fixed parameters: Speed = 34.2 cm/min, Arc length = 3 mm Face side Root side
450 A
2 Undercut
Metals 2019, 9, x FOR PEER REVIEW 5 of 15
Figure 3. Dimension of tensile specimen.
3. Results and Discussion
3.1. Surface Formation
Tables 5 and 6 illustrate both the face side and root side surface formation for the weldments with different parameters. It can be observed that when the travel speed was fixed at 34.2 cm/min, undercut was experienced for all the weldments, as marked by red arrows and shown in Table 5. When the travel speed was reduced to 30 cm/min, the undercut defect disappeared, together with smooth surface formation on both sides, as shown in Table 6. A further decrease in travel speed led to wavy ripples along the face side weld edges, as highlighted by red circles, although undercut was not experienced. Also, even irregular bead face was produced on the root side when the travel speed was reduced to 24 cm/min in Test 7 sample.
Table 5. Weld surface formation with different arc current.
Fixed parameters: Speed = 34.2 cm/min, Arc length = 3 mm Face side Root side
465 A
3 Undercut
Metals 2019, 9, x FOR PEER REVIEW 5 of 15
Figure 3. Dimension of tensile specimen.
3. Results and Discussion
3.1. Surface Formation
Tables 5 and 6 illustrate both the face side and root side surface formation for the weldments with different parameters. It can be observed that when the travel speed was fixed at 34.2 cm/min, undercut was experienced for all the weldments, as marked by red arrows and shown in Table 5. When the travel speed was reduced to 30 cm/min, the undercut defect disappeared, together with smooth surface formation on both sides, as shown in Table 6. A further decrease in travel speed led to wavy ripples along the face side weld edges, as highlighted by red circles, although undercut was not experienced. Also, even irregular bead face was produced on the root side when the travel speed was reduced to 24 cm/min in Test 7 sample.
Table 5. Weld surface formation with different arc current.
Fixed parameters: Speed = 34.2 cm/min, Arc length = 3 mm Face side Root side
480 A
4 Undercut
Metals 2019, 9, x FOR PEER REVIEW 5 of 15
Figure 3. Dimension of tensile specimen.
3. Results and Discussion
3.1. Surface Formation
Tables 5 and 6 illustrate both the face side and root side surface formation for the weldments with different parameters. It can be observed that when the travel speed was fixed at 34.2 cm/min, undercut was experienced for all the weldments, as marked by red arrows and shown in Table 5. When the travel speed was reduced to 30 cm/min, the undercut defect disappeared, together with smooth surface formation on both sides, as shown in Table 6. A further decrease in travel speed led to wavy ripples along the face side weld edges, as highlighted by red circles, although undercut was not experienced. Also, even irregular bead face was produced on the root side when the travel speed was reduced to 24 cm/min in Test 7 sample.
Table 5. Weld surface formation with different arc current.
Fixed parameters: Speed = 34.2 cm/min, Arc length = 3 mm Face side Root side
510 A

Metals 2019, 9, 1327 6 of 15
Table 6. Weld surface formation with different travel speed.
TestNo.
DefectType
Fixed parameters: Arc length = 3 mm, Welding current = 450 A Variable
Face side Root side Speed
5 N/A
Metals 2019, 9, x FOR PEER REVIEW 6 of 15
Table 6. Weld surface formation with different travel speed.
Fixed parameters: Arc length = 3 mm, Welding current = 450 A Face side Root side
It is known that high welding speed is easy to cause undercut formation. This is because the molten metal experiences much stronger backwards momentum at higher travel speed. The mass flow rate is the highest along the centreline of the weld, which tends to draw molten metal towards the centreline of the flow and induces lack of melt on the side walls on the face side [21]. Thus, undercut was consistently observed when high travel speed was used. Considering that the Tests 4 and 5 samples possess similar heat input and different travel speed, the presence of undercut in Test 4 may further indicate that travel speed plays a part in the formation of undercut. In addition, as reported by Tomsic and Jackson [22], high heat input makes the keyhole widen, more molten metal displaced by the keyhole flows back to the trailing region for a longer distance and a uniform bead is hard to obtain. This could be the reason for the formation of wavy ripples on the face side and irregular bead face on the root side. As the mitigation of undercut defect was observed with increasing arc current, it is reasonable to believe that the heat input also plays certain role in the formation of undercut in the K-TIG welding process. The effect of heat input on the undercut formation is discussed in following section.
3.2. Weld Longitudinal Cross-Section
The weld longitudinal cross-section and arc behaviour are shown in Figure 4. After arc was extinguished, the weld pool was suddenly frozen. The profile inside the keyhole channel was retained. When lower heat input was used, as in Test 1 sample, strong arc plasma was experienced on the face side, together with very high deflection angle relative to the horizontal line, as shown in Figure 4a. As the heat input increased, the amount of arc plasma on the face side decreased significantly, along with the increase in the slope of keyhole leading wall, as shown in Figure 4b. What is more, the deflection angle of plasma cloud relative to the horizontal line decreased with increasing heat input.
As can be seen from the schematic in Figure 4, when lower heat input was used, there was insufficient heat deposited on the lower half of the keyhole leading wall. Thus, the keyhole leading wall exhibited a severely curved shape. Only small amount of the arc plasma can be ejected via the keyhole exit, leaving majority of them guided towards the face side. As the heat input was increased, more heat was deposited on the keyhole bottom region. The bottom region (A zone) of the keyhole leading wall in Figure 4a was melted away into liquid and displaced to the rear part to form the weld, which makes the keyhole exit deviate less from the welding torch. Therefore, larger amount of the arc plasma could be easily ejected through the keyhole exit, leaving very small amount of them guided towards the face side. In addition, the increase in heat input further decreased the slope of keyhole rear edge, which allowed the plasma cloud to be deflected at a very small angle.
30cm/min
6 Ripple
Metals 2019, 9, x FOR PEER REVIEW 6 of 15
Table 6. Weld surface formation with different travel speed.
Fixed parameters: Arc length = 3 mm, Welding current = 450 A Face side Root side
It is known that high welding speed is easy to cause undercut formation. This is because the molten metal experiences much stronger backwards momentum at higher travel speed. The mass flow rate is the highest along the centreline of the weld, which tends to draw molten metal towards the centreline of the flow and induces lack of melt on the side walls on the face side [21]. Thus, undercut was consistently observed when high travel speed was used. Considering that the Tests 4 and 5 samples possess similar heat input and different travel speed, the presence of undercut in Test 4 may further indicate that travel speed plays a part in the formation of undercut. In addition, as reported by Tomsic and Jackson [22], high heat input makes the keyhole widen, more molten metal displaced by the keyhole flows back to the trailing region for a longer distance and a uniform bead is hard to obtain. This could be the reason for the formation of wavy ripples on the face side and irregular bead face on the root side. As the mitigation of undercut defect was observed with increasing arc current, it is reasonable to believe that the heat input also plays certain role in the formation of undercut in the K-TIG welding process. The effect of heat input on the undercut formation is discussed in following section.
3.2. Weld Longitudinal Cross-Section
The weld longitudinal cross-section and arc behaviour are shown in Figure 4. After arc was extinguished, the weld pool was suddenly frozen. The profile inside the keyhole channel was retained. When lower heat input was used, as in Test 1 sample, strong arc plasma was experienced on the face side, together with very high deflection angle relative to the horizontal line, as shown in Figure 4a. As the heat input increased, the amount of arc plasma on the face side decreased significantly, along with the increase in the slope of keyhole leading wall, as shown in Figure 4b. What is more, the deflection angle of plasma cloud relative to the horizontal line decreased with increasing heat input.
As can be seen from the schematic in Figure 4, when lower heat input was used, there was insufficient heat deposited on the lower half of the keyhole leading wall. Thus, the keyhole leading wall exhibited a severely curved shape. Only small amount of the arc plasma can be ejected via the keyhole exit, leaving majority of them guided towards the face side. As the heat input was increased, more heat was deposited on the keyhole bottom region. The bottom region (A zone) of the keyhole leading wall in Figure 4a was melted away into liquid and displaced to the rear part to form the weld, which makes the keyhole exit deviate less from the welding torch. Therefore, larger amount of the arc plasma could be easily ejected through the keyhole exit, leaving very small amount of them guided towards the face side. In addition, the increase in heat input further decreased the slope of keyhole rear edge, which allowed the plasma cloud to be deflected at a very small angle.
26 cm/min
7 Ripple
Metals 2019, 9, x FOR PEER REVIEW 6 of 15
Table 6. Weld surface formation with different travel speed.
Fixed parameters: Arc length = 3 mm, Welding current = 450 A Face side Root side
It is known that high welding speed is easy to cause undercut formation. This is because the molten metal experiences much stronger backwards momentum at higher travel speed. The mass flow rate is the highest along the centreline of the weld, which tends to draw molten metal towards the centreline of the flow and induces lack of melt on the side walls on the face side [21]. Thus, undercut was consistently observed when high travel speed was used. Considering that the Tests 4 and 5 samples possess similar heat input and different travel speed, the presence of undercut in Test 4 may further indicate that travel speed plays a part in the formation of undercut. In addition, as reported by Tomsic and Jackson [22], high heat input makes the keyhole widen, more molten metal displaced by the keyhole flows back to the trailing region for a longer distance and a uniform bead is hard to obtain. This could be the reason for the formation of wavy ripples on the face side and irregular bead face on the root side. As the mitigation of undercut defect was observed with increasing arc current, it is reasonable to believe that the heat input also plays certain role in the formation of undercut in the K-TIG welding process. The effect of heat input on the undercut formation is discussed in following section.
3.2. Weld Longitudinal Cross-Section
The weld longitudinal cross-section and arc behaviour are shown in Figure 4. After arc was extinguished, the weld pool was suddenly frozen. The profile inside the keyhole channel was retained. When lower heat input was used, as in Test 1 sample, strong arc plasma was experienced on the face side, together with very high deflection angle relative to the horizontal line, as shown in Figure 4a. As the heat input increased, the amount of arc plasma on the face side decreased significantly, along with the increase in the slope of keyhole leading wall, as shown in Figure 4b. What is more, the deflection angle of plasma cloud relative to the horizontal line decreased with increasing heat input.
As can be seen from the schematic in Figure 4, when lower heat input was used, there was insufficient heat deposited on the lower half of the keyhole leading wall. Thus, the keyhole leading wall exhibited a severely curved shape. Only small amount of the arc plasma can be ejected via the keyhole exit, leaving majority of them guided towards the face side. As the heat input was increased, more heat was deposited on the keyhole bottom region. The bottom region (A zone) of the keyhole leading wall in Figure 4a was melted away into liquid and displaced to the rear part to form the weld, which makes the keyhole exit deviate less from the welding torch. Therefore, larger amount of the arc plasma could be easily ejected through the keyhole exit, leaving very small amount of them guided towards the face side. In addition, the increase in heat input further decreased the slope of keyhole rear edge, which allowed the plasma cloud to be deflected at a very small angle.
24 mm/min
It is known that high welding speed is easy to cause undercut formation. This is because themolten metal experiences much stronger backwards momentum at higher travel speed. The massflow rate is the highest along the centreline of the weld, which tends to draw molten metal towardsthe centreline of the flow and induces lack of melt on the side walls on the face side [21]. Thus,undercut was consistently observed when high travel speed was used. Considering that the Tests 4and 5 samples possess similar heat input and different travel speed, the presence of undercut in Test4 may further indicate that travel speed plays a part in the formation of undercut. In addition, asreported by Tomsic and Jackson [22], high heat input makes the keyhole widen, more molten metaldisplaced by the keyhole flows back to the trailing region for a longer distance and a uniform beadis hard to obtain. This could be the reason for the formation of wavy ripples on the face side andirregular bead face on the root side. As the mitigation of undercut defect was observed with increasingarc current, it is reasonable to believe that the heat input also plays certain role in the formation ofundercut in the K-TIG welding process. The effect of heat input on the undercut formation is discussedin following section.
3.2. Weld Longitudinal Cross-Section
The weld longitudinal cross-section and arc behaviour are shown in Figure 4. After arc wasextinguished, the weld pool was suddenly frozen. The profile inside the keyhole channel was retained.When lower heat input was used, as in Test 1 sample, strong arc plasma was experienced on the faceside, together with very high deflection angle relative to the horizontal line, as shown in Figure 4a. Asthe heat input increased, the amount of arc plasma on the face side decreased significantly, along withthe increase in the slope of keyhole leading wall, as shown in Figure 4b. What is more, the deflectionangle of plasma cloud relative to the horizontal line decreased with increasing heat input.
As can be seen from the schematic in Figure 4, when lower heat input was used, there wasinsufficient heat deposited on the lower half of the keyhole leading wall. Thus, the keyhole leadingwall exhibited a severely curved shape. Only small amount of the arc plasma can be ejected via thekeyhole exit, leaving majority of them guided towards the face side. As the heat input was increased,more heat was deposited on the keyhole bottom region. The bottom region (A zone) of the keyholeleading wall in Figure 4a was melted away into liquid and displaced to the rear part to form the weld,which makes the keyhole exit deviate less from the welding torch. Therefore, larger amount of the arcplasma could be easily ejected through the keyhole exit, leaving very small amount of them guidedtowards the face side. In addition, the increase in heat input further decreased the slope of keyholerear edge, which allowed the plasma cloud to be deflected at a very small angle.

Metals 2019, 9, 1327 7 of 15
Metals 2019, 9, x FOR PEER REVIEW 7 of 15
(a) (b)
Figure 4. Weld longitudinal cross section and arc shape; (a) Test 1; (b) Test 7.
3.3. Weld Transverse Cross-Section
The weld macrographs are depicted in Figure 5. It can be seen that both the face side and root side width increased with increasing heat input. More importantly, there existed slight hump in Tests 1 and 2 samples, as shown in Figure 5a,b. The hump decreased and even disappeared with increasing heat input, as shown in Figure 5c,d. This is consistent with the mitigation or elimination of undercut defect.
Figure 4. Weld longitudinal cross section and arc shape; (a) Test 1; (b) Test 7.
3.3. Weld Transverse Cross-Section
The weld macrographs are depicted in Figure 5. It can be seen that both the face side and root sidewidth increased with increasing heat input. More importantly, there existed slight hump in Tests 1 and2 samples, as shown in Figure 5a,b. The hump decreased and even disappeared with increasing heatinput, as shown in Figure 5c,d. This is consistent with the mitigation or elimination of undercut defect.
As mentioned above, the heat input is also believed to be a controlling factor in the formation ofundercut defect. Also, the variation trend of heat input, hump and undercut formation are consistent.Thus, it is necessary to consider the interaction among them. As mentioned above, when a high heatinput was used, the keyhole front wall was less curved, majority of the plasma gas jet spurted outvia the keyhole exit and very small amount of them was reflected by the keyhole front wall towardsthe rear keyhole wall, as indicated in Figure 6a. Therefore, the face side weld formation was smoothwith the absence of humping and evident undercut. While if the heat input was reduced, the keyholewall on the front side bent against the travel direction and the distance between the welding torch andthe keyhole exit would increase, as demonstrated previously in Figure 4a. In this case, the plasma

Metals 2019, 9, 1327 8 of 15
gas flow field changed dramatically as depicted in Figure 6b. Almost all of the plasma jet was guidedtowards the lower region of the keyhole wall on the backside. As the welding current used in K-TIGwelding process was relatively high, the pressure associated with the plasma jet flow could overwhelmthe surface tension coming from the weld pool on the backside. Therefore, the trailing weld pool wasseverely deformed. Certain amount of the weld pool was pushed towards the face side, and humpappeared in the weld centre. This kind of hump would reduce the amount of liquid metal on the edgesof the weld pool on the face side, which may facilitate the formation of undercut. This implies that theheat input level is also an important parameter in determining the undercut formation.
Metals 2019, 9, x FOR PEER REVIEW 7 of 15
(a) (b)
Figure 4. Weld longitudinal cross section and arc shape; (a) Test 1; (b) Test 7.
3.3. Weld Transverse Cross-Section
The weld macrographs are depicted in Figure 5. It can be seen that both the face side and root side width increased with increasing heat input. More importantly, there existed slight hump in Tests 1 and 2 samples, as shown in Figure 5a,b. The hump decreased and even disappeared with increasing heat input, as shown in Figure 5c,d. This is consistent with the mitigation or elimination of undercut defect.
Metals 2019, 9, x FOR PEER REVIEW 8 of 15
Figure 5. Macrographs of four typical welds with different heat input; (a) Test 1 (7.78 kJ/cm); (b) Test 2 (8.1 kJ/cm); (c) Test 4 (9.18 kJ/cm); (d) Test 7 (11.16 kJ/cm).
As mentioned above, the heat input is also believed to be a controlling factor in the formation of undercut defect. Also, the variation trend of heat input, hump and undercut formation are consistent. Thus, it is necessary to consider the interaction among them. As mentioned above, when a high heat input was used, the keyhole front wall was less curved, majority of the plasma gas jet spurted out via the keyhole exit and very small amount of them was reflected by the keyhole front wall towards the rear keyhole wall, as indicated in Figure 6a. Therefore, the face side weld formation was smooth with the absence of humping and evident undercut. While if the heat input was reduced, the keyhole wall on the front side bent against the travel direction and the distance between the welding torch and the keyhole exit would increase, as demonstrated previously in Figure 4a. In this case, the plasma gas flow field changed dramatically as depicted in Figure 6b. Almost all of the plasma jet was guided towards the lower region of the keyhole wall on the backside. As the welding current used in K-TIG welding process was relatively high, the pressure associated with the plasma jet flow could overwhelm the surface tension coming from the weld pool on the backside. Therefore, the trailing weld pool was severely deformed. Certain amount of the weld pool was pushed towards the face side, and hump appeared in the weld centre. This kind of hump would reduce the amount of liquid metal on the edges of the weld pool on the face side, which may facilitate the formation of undercut. This implies that the heat input level is also an important parameter in determining the undercut formation.
(a)
Figure 5. Macrographs of four typical welds with different heat input; (a) Test 1 (7.78 kJ/cm); (b) Test 2(8.1 kJ/cm); (c) Test 4 (9.18 kJ/cm); (d) Test 7 (11.16 kJ/cm).
Metals 2019, 9, x FOR PEER REVIEW 8 of 15
Figure 5. Macrographs of four typical welds with different heat input; (a) Test 1 (7.78 kJ/cm); (b) Test 2 (8.1 kJ/cm); (c) Test 4 (9.18 kJ/cm); (d) Test 7 (11.16 kJ/cm).
As mentioned above, the heat input is also believed to be a controlling factor in the formation of undercut defect. Also, the variation trend of heat input, hump and undercut formation are consistent. Thus, it is necessary to consider the interaction among them. As mentioned above, when a high heat input was used, the keyhole front wall was less curved, majority of the plasma gas jet spurted out via the keyhole exit and very small amount of them was reflected by the keyhole front wall towards the rear keyhole wall, as indicated in Figure 6a. Therefore, the face side weld formation was smooth with the absence of humping and evident undercut. While if the heat input was reduced, the keyhole wall on the front side bent against the travel direction and the distance between the welding torch and the keyhole exit would increase, as demonstrated previously in Figure 4a. In this case, the plasma gas flow field changed dramatically as depicted in Figure 6b. Almost all of the plasma jet was guided towards the lower region of the keyhole wall on the backside. As the welding current used in K-TIG welding process was relatively high, the pressure associated with the plasma jet flow could overwhelm the surface tension coming from the weld pool on the backside. Therefore, the trailing weld pool was severely deformed. Certain amount of the weld
(a)
Figure 6. Cont.

Metals 2019, 9, 1327 9 of 15
Metals 2019, 9, x FOR PEER REVIEW 9 of 15
(b)
Figure 6. Schematic of plasma gas flow inside keyhole; (a) high heat input; (b) low heat input.
Figure 6. Schematic of plasma gas flow inside keyhole; (a) high heat input; (b) low heat input.
3.4. Weld Microstructure
The weld microstructure with different heat input is depicted in Figure 7. The weld metal inTest 1 consists of martensite and small amount of bainite, whereas only bainite with larger grain sizeis observed in the weld metal of Test 7. The same is true for the microstructure in the coarse grainheat-affected zone (CGHAZ) where a combination of martensite with bainite is present in Test 1 andonly bainitic microstructure is found in Test 7. When it comes to fine grain heat-affected zone (FGHAZ),the microstructure consists predominantly of martensite. However, it is evident that the fraction ofbainite in FGHAZ of Test 7 is higher than that of Test 1.
It is known that microstructure is closely linked to welding thermal cycle and hardenability.During welding thermal cycle, CGHAZ and FGHAZ were heated to austenite phase region. Uponcooling, the reformed austenite would transform to martensite, bainite or ferrite, depending on thecooling rate and hardenability of the base metal. Since the base metal contains large amount of carbonand chromium, the hardenability is relatively high, which favours the formation of martensite and/orbainite instead of ferrite. As the heat input increases, the cooling rate decreases, which favours theformation of bainite rather than martensite. The same is true for the weld metal as it still experiencesphase transformation from austenite to various transformation products upon cooling, although it wasmelted during welding thermal cycle. That is why higher fraction of martensite was formed in theweld and HAZ with lower heat input.
3.5. Hardness
The hardness distribution of various welds is depicted in Figure 8. Lower hardness is observedin the weld metal region. The hardness increases when moving from the weld metal to the CGHAZand FGHAZ. After that, the hardness decreases again to the lowest point when it comes to theover-tempered region. Finally, the hardness would increase continuously until it reaches the hardnessvalue of the base metal (495 Hv). The hardness variation trend is very similar to that found in thearmour steel weld produced with conventional fusion welding, as shown by Reddy et al. [23]. Inaddition, the overall hardness decreases with increasing heat input. Once the heat input reaches10.22 kJ/cm and beyond, the overall hardness decrease becomes evident.

Metals 2019, 9, 1327 10 of 15
Metals 2019, 9, x FOR PEER REVIEW 10 of 15
3.4. Weld Microstructure
The weld microstructure with different heat input is depicted in Figure 7. The weld metal in Test 1 consists of martensite and small amount of bainite, whereas only bainite with larger grain size is observed in the weld metal of Test 7. The same is true for the microstructure in the coarse grain heat-affected zone (CGHAZ) where a combination of martensite with bainite is present in Test 1 and only bainitic microstructure is found in Test 7. When it comes to fine grain heat-affected zone (FGHAZ), the microstructure consists predominantly of martensite. However, it is evident that the fraction of bainite in FGHAZ of Test 7 is higher than that of Test 1.
(a) (b)
Figure 7. Microstructure in weld metal and heat-affected zone (HAZ); (a) Test 1 (HI = 7.78 kJ/cm); (b) Test 7 (HI = 11.16 kJ/cm) Note: M and B represent martensite and bainite respectively.
It is known that microstructure is closely linked to welding thermal cycle and hardenability. During welding thermal cycle, CGHAZ and FGHAZ were heated to austenite phase region. Upon cooling, the reformed austenite would transform to martensite, bainite or ferrite, depending on the cooling rate and hardenability of the base metal. Since the base metal contains large amount of carbon and chromium, the hardenability is relatively high, which favours the formation of martensite and/or bainite instead of ferrite. As the heat input increases, the cooling rate decreases, which favours the formation of bainite rather than martensite. The same is true for the weld metal as it still experiences phase transformation from austenite to various transformation products upon cooling, although it was melted during welding thermal cycle. That is why higher fraction of martensite was formed in the weld and HAZ with lower heat input.
Figure 7. Microstructure in weld metal and heat-affected zone (HAZ); (a) Test 1 (HI = 7.78 kJ/cm);(b) Test 7 (HI = 11.16 kJ/cm) Note: M and B represent martensite and bainite respectively.
Metals 2019, 9, x FOR PEER REVIEW 11 of 15
3.5. Hardness
The hardness distribution of various welds is depicted in Figure 8. Lower hardness is observed in the weld metal region. The hardness increases when moving from the weld metal to the CGHAZ and FGHAZ. After that, the hardness decreases again to the lowest point when it comes to the over-tempered region. Finally, the hardness would increase continuously until it reaches the hardness value of the base metal (495 Hv). The hardness variation trend is very similar to that found in the armour steel weld produced with conventional fusion welding, as shown by Reddy et al. [23]. In addition, the overall hardness decreases with increasing heat input. Once the heat input reaches 10.22 kJ/cm and beyond, the overall hardness decrease becomes evident.
Figure 8. Hardness distribution across weld with varying heat input
The variation trend of hardness across the weld is in good agreement with the microstructure change. As martensite and smaller grain size favours higher hardness, the increase in hardness from weld metal to FGHAZ is unexpected because of the increased fraction of martensite and decreased grain size from weld metal to FGHAZ, as shown in Figure 7. In the over-tempered region, the martensite was heavily tempered, which led to the reduction in dislocation density, precipitation of carbides and reduction in solid solution strengthening in the matrix. Thus, the hardness in the over-tempered region decreased dramatically compared with the HHA base metal (495Hv).
When the heat input was increased, the fraction of martensite decreased in both the weld metal and HAZ, as shown in Figure 7, because of the slower cooling rate induced from higher heat input. Furthermore, the softening behaviour in the over-tempered region became severer because of prolonged holding time in this region with increasing heat input, leading to more significant reduction in dislocation density, precipitation of carbides and reduction in solid solution strengthening. That is why the overall hardness of the welded joints decreased with increasing heat input.
3.6. Tensile Properties
The tensile results of the welded joints with different heat input are shown in Figure 9, while the fracture location of each welded joint is shown in Figure 10. Two tensile samples for each setting were used to present the fracture location on both face and root side, with the dotted yellow lines representing the weld metal region on both face and root sides. Figure 9b shows that the elongation of Test 1 (6.47%) and Test 3 (7.65%) is much lower than the other four samples although the ultimate tensile strength (UTS) remains at a high level. The fracture behaviour of these two samples is depicted in Figure 10a,b respectively. They both fractured from the face side undercut. Once the heat input was increased to more than 8.96 kJ/cm, as is the case in Tests 4–7 samples, the elongation reaches more than 10%. Although the Tests 4–7 tensile samples all fractured in the weld metal, the Tests 4 and 5 samples fractured in the weld metal from the root side fusion boundary (Figure 10c,d), while the fracture location of Tests 6 and 7 samples were randomly located in the weld metal (Figure
Figure 8. Hardness distribution across weld with varying heat input.
The variation trend of hardness across the weld is in good agreement with the microstructurechange. As martensite and smaller grain size favours higher hardness, the increase in hardness fromweld metal to FGHAZ is unexpected because of the increased fraction of martensite and decreased grainsize from weld metal to FGHAZ, as shown in Figure 7. In the over-tempered region, the martensite

Metals 2019, 9, 1327 11 of 15
was heavily tempered, which led to the reduction in dislocation density, precipitation of carbides andreduction in solid solution strengthening in the matrix. Thus, the hardness in the over-tempered regiondecreased dramatically compared with the HHA base metal (495Hv).
When the heat input was increased, the fraction of martensite decreased in both the weldmetal and HAZ, as shown in Figure 7, because of the slower cooling rate induced from higher heatinput. Furthermore, the softening behaviour in the over-tempered region became severer because ofprolonged holding time in this region with increasing heat input, leading to more significant reductionin dislocation density, precipitation of carbides and reduction in solid solution strengthening. That iswhy the overall hardness of the welded joints decreased with increasing heat input.
3.6. Tensile Properties
The tensile results of the welded joints with different heat input are shown in Figure 9, whilethe fracture location of each welded joint is shown in Figure 10. Two tensile samples for each settingwere used to present the fracture location on both face and root side, with the dotted yellow linesrepresenting the weld metal region on both face and root sides. Figure 9b shows that the elongationof Test 1 (6.47%) and Test 3 (7.65%) is much lower than the other four samples although the ultimatetensile strength (UTS) remains at a high level. The fracture behaviour of these two samples is depictedin Figure 10a,b respectively. They both fractured from the face side undercut. Once the heat input wasincreased to more than 8.96 kJ/cm, as is the case in Tests 4–7 samples, the elongation reaches morethan 10%. Although the Tests 4–7 tensile samples all fractured in the weld metal, the Tests 4 and 5samples fractured in the weld metal from the root side fusion boundary (Figure 10c,d), while thefracture location of Tests 6 and 7 samples were randomly located in the weld metal (Figure 10e,f). It isworth noting here that the wavy ripples seem to have no evident effect on the tensile properties inTests 6 and 7 samples.
Metals 2019, 9, x FOR PEER REVIEW 12 of 15
10
Figure 9. Tensile properties; (a) tensile curves for welded joints with different heat input; (b) tensile results for welded joints with different heat input.
Figure 10. Fracture behaviour of welded joints; (a) Test 1 (HI = 7.78 kJ/cm); (b) Test 3 (HI = 8.42 kJ/cm); (c) Test 5 (HI = 8.96 kJ/cm); (d) Test 4 (HI = 9.18 kJ/cm); (e) Test 6 (HI = 10.22 kJ/cm); (f) Test 7 (HI = 11.16 kJ/cm).
It is well accepted that the tensile strength is closely linked to the overall hardness of the welded joint. With the increase in heat input from 8.96 kJ/cm to 11.16 kJ/cm, the overall hardness decreases, as shown in Figure 8, which is probably a result of the change in cooling rate and microstructure. In addition, higher heat input also tends to produce wider weld metal and HAZ, which could increase the width of reduced hardness region, as is the case in this study. Both these two factors can contribute to the decrease in tensile strength with increasing heat input. The significant reduction in elongation in Tests 1 and 3 is a result of undercut defect, which is a well-known stress concentration
Figure 9. Tensile properties; (a) tensile curves for welded joints with different heat input; (b) tensileresults for welded joints with different heat input.
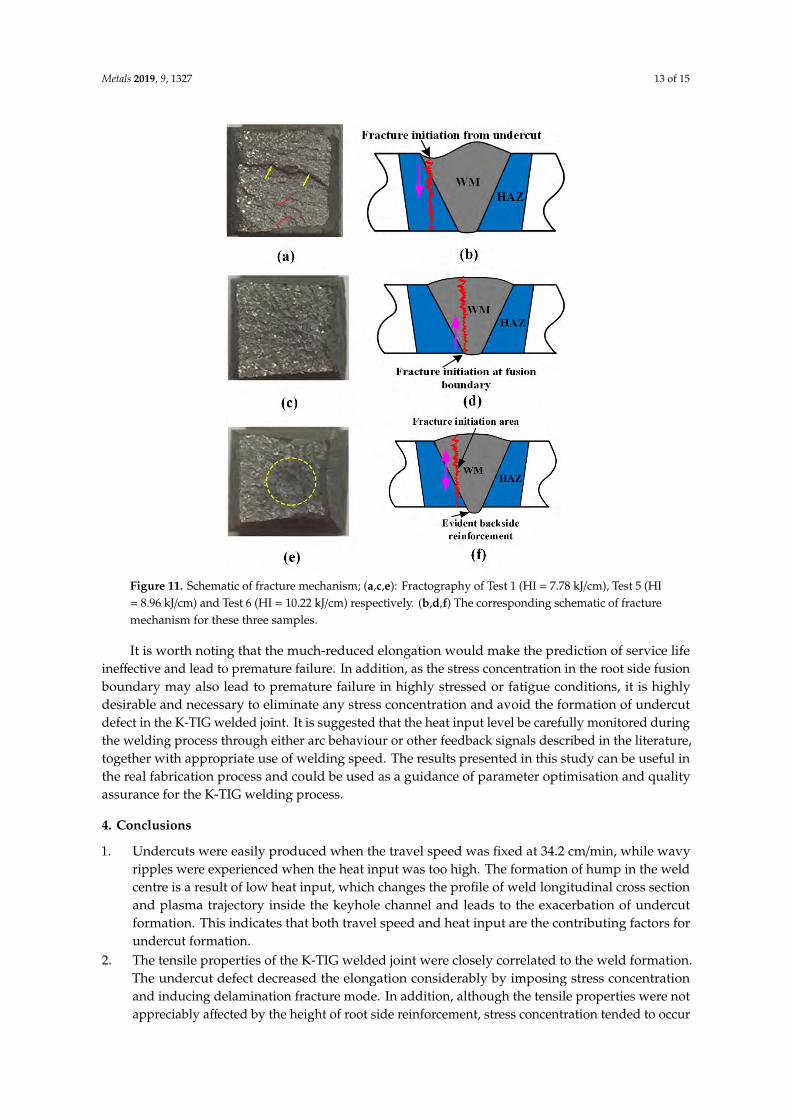
It is well accepted that the tensile strength is closely linked to the overall hardness of the weldedjoint. With the increase in heat input from 8.96 kJ/cm to 11.16 kJ/cm, the overall hardness decreases,as shown in Figure 8, which is probably a result of the change in cooling rate and microstructure. Inaddition, higher heat input also tends to produce wider weld metal and HAZ, which could increasethe width of reduced hardness region, as is the case in this study. Both these two factors can contributeto the decrease in tensile strength with increasing heat input. The significant reduction in elongation inTests 1 and 3 is a result of undercut defect, which is a well-known stress concentration point. This canalso be confirmed by fractography, as shown in Figure 11a,c and e. Note that the left-hand side onthe fracture surface is the face side of the tensile sample, whereas the right-hand side is the root sideof the tensile sample. The fracture surface in Test 1 sample consists predominantly of delaminationboth across two planes and on a single plane, as indicated by yellow and red arrows, respectively in

Metals 2019, 9, 1327 12 of 15
Figure 11a, as well as small amount of radial zone on the left. This means that after quick fractureinitiation and propagation, the tensile sample experienced delamination fracture mode along thevertical direction down to the root side, as shown in Figure 11b. The recovery of elongation in Tests 4–7samples indicates that the mitigation or elimination of undercut effect is an effective way to improvethe tensile properties by reducing or eliminating stress concentration. However, it is worth mentioningthat although the tensile properties of Test 4 were not affected by slight undercut in this study, it is stillhighly desirable to eliminate it in real fabrication. Even in the absence of undercut, the fracture stillpresents two different routes. As can be seen in Figure 11c, after crack initiated from the root side fusionboundary (dark grey area on the right-hand side), quick crack propagation occurred until reachingthe face side, as evidenced by the completely radial zone in the fracture surface. The schematic isshown in Figure 11d. This indicates that the fusion boundary on the root side can also act as a stressconcentration point in the absence of appreciable backside reinforcement, although it is less harmfulthan undercut. Thus, it is recommended that post-weld surface treatment be carried out for the K-TIGwelded joint if the workpiece root side is accessible. With the formation of appreciable reinforcementon the root side, as is the case in Test 6, evident fibrous zone is present in the centre region, as indicatedby the dotted yellow circle in Figure 11e. This is a result of plastic deformation occurring before crackinitiated. In addition, there is larger amount of shear lip formed on the fracture surface, indicatingthat this sample followed a regular fracture route in which the stress condition changed to shear fromtension and resulted in a fracture around 45 degree relative to the maximum stress direction after crackreached the edge. The schematic of fracture path is shown in Figure 11f.
Metals 2019, 9, x FOR PEER REVIEW 12 of 15
10
Figure 9. Tensile properties; (a) tensile curves for welded joints with different heat input; (b) tensile results for welded joints with different heat input.
Figure 10. Fracture behaviour of welded joints; (a) Test 1 (HI = 7.78 kJ/cm); (b) Test 3 (HI = 8.42 kJ/cm); (c) Test 5 (HI = 8.96 kJ/cm); (d) Test 4 (HI = 9.18 kJ/cm); (e) Test 6 (HI = 10.22 kJ/cm); (f) Test 7 (HI = 11.16 kJ/cm).
It is well accepted that the tensile strength is closely linked to the overall hardness of the welded joint. With the increase in heat input from 8.96 kJ/cm to 11.16 kJ/cm, the overall hardness decreases, as shown in Figure 8, which is probably a result of the change in cooling rate and microstructure. In addition, higher heat input also tends to produce wider weld metal and HAZ, which could increase the width of reduced hardness region, as is the case in this study. Both these two factors can contribute to the decrease in tensile strength with increasing heat input. The significant reduction in elongation in Tests 1 and 3 is a result of undercut defect, which is a well-known stress concentration
Figure 10. Fracture behaviour of welded joints; (a) Test 1 (HI = 7.78 kJ/cm); (b) Test 3 (HI = 8.42 kJ/cm);(c) Test 5 (HI = 8.96 kJ/cm); (d) Test 4 (HI = 9.18 kJ/cm); (e) Test 6 (HI = 10.22 kJ/cm); (f) Test 7 (HI =
11.16 kJ/cm).
Metals 2019, 9, 1327 13 of 15
Metals 2019, 9, x FOR PEER REVIEW 13 of 15
point. This can also be confirmed by fractography, as shown in Figure 11a,c and e. Note that the left-hand side on the fracture surface is the face side of the tensile sample, whereas the right-hand side is the root side of the tensile sample. The fracture surface in Test 1 sample consists predominantly of delamination both across two planes and on a single plane, as indicated by yellow and red arrows, respectively in Figure 11a, as well as small amount of radial zone on the left. This means that after quick fracture initiation and propagation, the tensile sample experienced delamination fracture mode along the vertical direction down to the root side, as shown in Figure 11b. The recovery of elongation in Tests 4–7 samples indicates that the mitigation or elimination of undercut effect is an effective way to improve the tensile properties by reducing or eliminating stress concentration. However, it is worth mentioning that although the tensile properties of Test 4 were not affected by slight undercut in this study, it is still highly desirable to eliminate it in real fabrication. Even in the absence of undercut, the fracture still presents two different routes. As can be seen in Figure 11c, after crack initiated from the root side fusion boundary (dark grey area on the right-hand side), quick crack propagation occurred until reaching the face side, as evidenced by the completely radial zone in the fracture surface. The schematic is shown in Figure 11d. This indicates that the fusion boundary on the root side can also act as a stress concentration point in the absence of appreciable backside reinforcement, although it is less harmful than undercut. Thus, it is recommended that post-weld surface treatment be carried out for the K-TIG welded joint if the workpiece root side is accessible. With the formation of appreciable reinforcement on the root side, as is the case in Test 6, evident fibrous zone is present in the centre region, as indicated by the dotted yellow circle in Figure 11e. This is a result of plastic deformation occurring before crack initiated. In addition, there is larger amount of shear lip formed on the fracture surface, indicating that this sample followed a regular fracture route in which the stress condition changed to shear from tension and resulted in a fracture around 45 degree relative to the maximum stress direction after crack reached the edge. The schematic of fracture path is shown in Figure 11f.
Figure 11. Schematic of fracture mechanism; (a,c,e): Fractography of Test 1 (HI = 7.78 kJ/cm), Test 5 (HI= 8.96 kJ/cm) and Test 6 (HI = 10.22 kJ/cm) respectively. (b,d,f) The corresponding schematic of fracturemechanism for these three samples.
It is worth noting that the much-reduced elongation would make the prediction of service lifeineffective and lead to premature failure. In addition, as the stress concentration in the root side fusionboundary may also lead to premature failure in highly stressed or fatigue conditions, it is highlydesirable and necessary to eliminate any stress concentration and avoid the formation of undercutdefect in the K-TIG welded joint. It is suggested that the heat input level be carefully monitored duringthe welding process through either arc behaviour or other feedback signals described in the literature,together with appropriate use of welding speed. The results presented in this study can be useful inthe real fabrication process and could be used as a guidance of parameter optimisation and qualityassurance for the K-TIG welding process.
4. Conclusions
1. Undercuts were easily produced when the travel speed was fixed at 34.2 cm/min, while wavyripples were experienced when the heat input was too high. The formation of hump in the weldcentre is a result of low heat input, which changes the profile of weld longitudinal cross sectionand plasma trajectory inside the keyhole channel and leads to the exacerbation of undercutformation. This indicates that both travel speed and heat input are the contributing factors forundercut formation.
2. The tensile properties of the K-TIG welded joint were closely correlated to the weld formation.The undercut defect decreased the elongation considerably by imposing stress concentrationand inducing delamination fracture mode. In addition, although the tensile properties were notappreciably affected by the height of root side reinforcement, stress concentration tended to occur

Metals 2019, 9, 1327 14 of 15
near the root side fusion boundary in the absence of appreciable reinforcement, which wouldalso affect the regular fracture route. The wavy ripples produced with high heat input had noevident effect on the tensile properties. It is required that a combination of appropriate heat inputlevel and travel speed be selected, leading to the absence of undercut defect, either appreciableroot side reinforcement or a combination of post-weld surface treatment with the absence ofappreciable root side reinforcement. It has been demonstrated that the welding parametersshould be carefully controlled to avoid defect formation and maintain tensile properties in theK-TIG-welded joint.
Author Contributions: Conceptualization, Z.F., B.W. and D.D.; methodology, Z.F. and L.S.; software, D.D. andL.S.; validation, Z.P. and D.C.; formal analysis, Z.F., B.W. and D.C.; investigation, Z.F. and D.C.; resources, Z.P. andH.L.; data curation, D.D., H.L. and Z.F.; writing—original draft preparation, Z.F.; writing—review and editing,Z.P., H.L. and D.C.; supervision, D.C., Z.P. and H.L.; project administration, L.S. and H.L.; funding acquisition, Z.Pand H.L.
Funding: This research has been conducted with the support of the Australian Government Research TrainingProgram Scholarship. This paper includes research that was supported by DMTC Limited (Australia). The authorshave prepared this paper in accordance with the intellectual property rights granted to partners from the originalDMTC project. This work was partially supported by NSFC under grant No. 51805085.
Conflicts of Interest: The authors declare that they have no conflict of interest.
References
1. Jarvis, B.L. Keyhole Gas Tungsten Arc Welding: A New Process Variant. Ph.D. Thesis, University ofWollongong, Wollongong, Australia, 2001.
2. Jarvis, B.L.; Ahmed, N.U. Development of keyhole mode gas tungsten arc welding process. Sci. Technol.Weld. Join. 2000, 5, 1–7. [CrossRef]
3. Liu, Z.M.; Fang, Y.X.; Cui, S.L.; Yi, S.; Qiu, J.Y.; Jiang, Q.; Liu, W.D.; Luo, Z. Sustaining the open keyhole inslow-falling current edge during K-TIG process: Principle and parameters. Int. J. Heat. Mass. Trans. 2017,112, 255–266. [CrossRef]
4. Liu, Z.M.; Fang, Y.X.; Cui, S.L.; Luo, Z.; Liu, W.D.; Liu, Z.Y.; Jiang, Q.; Yi, S. Stable keyhole welding processwith K-TIG. J. Mater. Process. Technol. 2016, 238, 65–72. [CrossRef]
5. Liu, Z.M.; Fang, Y.X.; Cui, S.L.; Yi, S.; Qiu, J.Y.; Jiang, Q.; Liu, W.D.; Luo, Z. Keyhole thermal behavior inGTAW welding process. Int. J. Therm. Sci. 2017, 114, 352–362. [CrossRef]
6. Lathabai, S.; Jarvis, B.L.; Barton, K.J. Comparison of keyhole and conventional gas tungsten arc welds incommercially pure titanium. Mater. Sci. Eng. A 2001, 299, 81–93. [CrossRef]
7. Lathabai, S.; Jarvis, B.L.; Barton, K.J. Keyhole gas tungsten arc welding of commercially pure zirconium. Sci.Technol. Weld. Join. 2008, 13, 573–581. [CrossRef]
8. Cui, S.W.; Shi, Y.H.; Sun, K.; Gu, S.Y. Microstructure evolution and mechanical properties of keyhole deeppenetration TIG welds of S32101 duplex stainless steel. Mater. Sci. Eng. A 2018, 709, 214–222. [CrossRef]
9. Fei, Z.Y.; Pan, Z.X.; Cuiuri, D.; Li, H.J.; Wu, B.T.; Ding, D.H.; Su, L.H.; Gazder, A.A. Investigation into theviability of K-TIG for joining armour grade quenched and tempered steel. J. Manuf. Process. 2018, 32, 482–493.[CrossRef]
10. Fei, Z.Y.; Pan, Z.X.; Cuiuri, D.; Li, H.J.; Van Duin, S.; Yu, Z.P. Microstructural characterization and mechanicalproperties of K-TIG welded SAF2205/AISI316L dissimilar joint. J. Manuf. Process. 2019, 45, 340–355.[CrossRef]
11. Cui, S.W.; Xian, Z.Y.; Shi, Y.H.; Liao, B.Y.; Zhu, T. Microstructure and Impact Toughness of Local-Dry KeyholeTungsten Inert Gas Welded Joints. Materials 2019, 12, 1638. [CrossRef]
12. Fei, Z.Y.; Pan, Z.X.; Cuiuri, D.; Li, H.J.; Wu, B.T.; Su, L.H. Improving the weld microstructure and materialproperties of K-TIG welded armour steel joint using filler material. Int. J. Adv. Manuf. Technol. 2019, 100,1931–1944. [CrossRef]
13. Fei, Z.Y.; Pan, Z.X.; Cuiuri, D.; Li, H.J.; Gazder, A.A. A Combination of Keyhole GTAW with a TrapezoidalInterlayer: A New Insight into Armour Steel Welding. Materials 2019, 12, 3571. [CrossRef]
14. Xie, Y.; Cai, Y.C.; Zhang, X.; Luo, Z. Characterization of keyhole gas tungsten arc welded AISI 430 steel andjoint performance optimization. Int. J. Adv. Manuf. Technol. 2018, 99, 347–361. [CrossRef]

Metals 2019, 9, 1327 15 of 15
15. Liu, Z.M.; Fang, Y.X.; Qiu, J.Y.; Feng, M.N.; Luo, Z.; Yuan, J.R. Stabilization of weld pool through jet flow argongas backing in C-Mn steel keyhole TIG welding. J. Mater. Process. Technol. 2017, 250, 132–143. [CrossRef]
16. Cui, S.L.; Liu, Z.M.; Fang, Y.Q.; Luo, Z.; Manladan, S.M.; Yi, S. Keyhole process in K-TIG welding on 4 mmthick 304 stainless steel. J. Mater. Process. Technol. 2017, 243, 217–228. [CrossRef]
17. Fang, Y.X.; Liu, Z.M.; Cui, S.L.; Zhang, Y.; Qiu, J.Y.; Luo, Z. Improving Q345 weld microstructure andmechanical properties with high frequency current arc in keyhole mode TIG welding. J. Mater. Process.Technol. 2017, 250, 280–288. [CrossRef]
18. Cui, Y.X.; Shi, Y.H.; Hong, X.B. Analysis of the frequency features of arc voltage and its application to therecognition of welding penetration in K-TIG welding. J. Manuf. Process. 2019, 46, 225–233. [CrossRef]
19. Zhu, T.; Shi, Y.H.; Cui, S.W.; Cui, Y.X. Recognition of Weld Penetration During K-TIG Welding Based onAcoustic and Visual Sensing. Sens. Imaging 2019, 20, 3. [CrossRef]
20. Feng, Y.Q.; Luo, Z.; Liu, Z.M.; Li, Y.; Luo, Y.C.; Huang, Y.X. Keyhole gas tungsten arc welding of AISI 316Lstainless steel. Mater. Des. 2015, 85, 24–33. [CrossRef]
21. Eriksson, I.; Powell, J.; Kaplan, A.F.H. Measurements of fluid flow on keyhole front during laser welding.Sci. Technol. Weld. Join. 2011, 16, 636–641. [CrossRef]
22. Tomsic, M.J.; Jackson, C.E. Energy distribution in keyhole mode plasma arc welds. Weld. J. 1973, 110s–115s.23. Reddy, G.M.; Mohandas, T.; Papukutty, K.K. Effect of welding process on the ballistic performance of
high-strength low-alloy steel weldments. J. Mater. Process. Technol. 1998, 74, 27–35. [CrossRef]
© 2019 by the authors. Licensee MDPI, Basel, Switzerland. This article is an open accessarticle distributed under the terms and conditions of the Creative Commons Attribution(CC BY) license (http://creativecommons.org/licenses/by/4.0/).