effect of grain size distribution on raman analyses and
TRANSCRIPT

HAL Id: insu-00819722https://hal-insu.archives-ouvertes.fr/insu-00819722
Submitted on 19 Aug 2013
HAL is a multi-disciplinary open accessarchive for the deposit and dissemination of sci-entific research documents, whether they are pub-lished or not. The documents may come fromteaching and research institutions in France orabroad, or from public or private research centers.
L’archive ouverte pluridisciplinaire HAL, estdestinée au dépôt et à la diffusion de documentsscientifiques de niveau recherche, publiés ou non,émanant des établissements d’enseignement et derecherche français ou étrangers, des laboratoirespublics ou privés.
Effect of grain size distribution on Raman analyses andthe consequences for in situ planetary missions
Frédéric Foucher, G. Lopes-Reyes, Nicolas Bost, F. Rull-Perez, P. Rüßmann,Francès Westall
To cite this version:Frédéric Foucher, G. Lopes-Reyes, Nicolas Bost, F. Rull-Perez, P. Rüßmann, et al.. Effect of grainsize distribution on Raman analyses and the consequences for in situ planetary missions. Journal ofRaman Spectroscopy, Wiley, 2013, 44 (6), pp.916-925. �10.1002/jrs.4307�. �insu-00819722�

Full title
Effect of grain size distribution on Raman analyses and the consequences for in situ planetary
missions
Short title
Effect of grain size distribution on Raman analyses
Authors and affiliations
F. Fouchera, G. Lopez-Reyes
b, N. Bost
a,c,d,e, F. Rull-Perez
b, P. Rüßmann
a,f and F. Westall
a
a Centre de Biophysique Moléculaire, UPR CNRS 4301, 45071 Orléans cedex 2, France,
b Universidad de Valladolid, Unidad Asociada Universidad de Valladolid - CSIC - Centro de
Astrobiologia (UVa-CAB), Valladolid, Spain.
c Univ d’Orléans, ISTO, UMR 7327, 45071, Orléans, France
d CNRS⁄ INSU, ISTO, UMR 7327, 45071 Orléans, France
e BRGM, ISTO, UMR 7327, BP 36009, 45060 Orléans, France
f Université d’Orléans, Château de La Source, Avenue du Parc Floral, BP 6749, 45067
Orléans cedex 2, France
([email protected] / Fax: +33-2-38631517)
Abstract
Raman spectroscopy can be used for analysing both mineral and organic phases, thus
allowing characterisation of the microbial-scale geological context as well as the search for
possible traces of life. This method is therefore very useful for in situ planetary exploration
missions. Compared to the myriad of sample preparation techniques available in terrestrial
laboratories, the possibilities for sample preparation during in situ missions on other planetary
bodies is extremely limited and is generally restricted to abrasion of rock surfaces or crushing
of the target samples. While certain techniques need samples to be prepared in powder form,
such as X-Ray Diffraction, this kind of preparation is not particularly suitable for optical
microscopy and/or Raman spectroscopy. In this contribution, we examine the effects of
powdering rock and mineral samples on optical observations and Raman analyses. We used a
commercial Raman spectrometer, as well as a Raman Laser Spectrometer (RLS) that
simulates the instrument being developed for the future ExoMars 2018 mission. The

commercial Raman spectrometer documents significant modifications to the spectra of the
powdered samples, including broadening of the peaks and shifts in their position, as well as
the appearance of new peaks. These effects are caused by localised heating of the sample
under the laser beam and amplification of nominal surface effects due to the increase in
surface area in finer grain sizes. However, most changes observed in the Raman spectra using
the RLS system are negligible because the relatively large (50 µm diameter) laser spot size
produces lower irradiance. Furthermore, minor phases were more easily detectable in the
powdered samples. Most importantly, however, this sample preparation method results in the
loss of the textural features and context making identification of potential fossilized microbial
remains more problematic.
Keywords: in situ Raman spectroscopy, powder, Mars, minerals, rock
Introduction
Raman spectroscopy can be used for analysing both inorganic (e.g. minerals) and organic
molecules making it a particularly interesting technique for in situ planetary science
exploration. This is particularly relevant because recent and future missions are focussing on
astrobiological investigations searching for complex organic molecules and traces of life.
Several studies have focussed on the development and calibration of Raman spectroscopy for
science space applications.[1-7]
Irrespective of the rocky body explored, one of the primary
goals of in situ missions is to understand the geological context of the landing sites and a
Raman Laser Spectrometer (RLS) will be included as part of the Pasteur payload on the
upcoming ExoMars rover mission (ESA/Roscosmos, 2018) whose goal is to search for
evidence of microbial remains in the Martian soil.[8]
Weight, size and power limitations of spaceflight instrumentation means that the resolution
and sensitivity of analyses made in situ are limited compared to those made in terrestrial
laboratories. In the same way, only limited sample preparation can be undertaken in situ. In
order to standardise the amount of material used for analysis by the mission instruments,
samples are crushed into powders. Powdered preparations are the preferred method of sample
preparation for techniques, such as X-Ray Diffraction (XRD) and gas chromatograph mass
spectrometry (GC-MS). Subsurface material obtained from depths from 0.5 to 2 meters will
be taken during the ExoMars mission and will be crushed for analysis by a suite of
instruments on the rover, including the RLS.[9,10]
Note that some indication of the spatial
context of different grains could be provided by the Close-Up Imager (CLUPI) instrument on
board the ExoMars rover, prior to crush the drilled core material.[11]
Many rocks and targets for in situ planetary investigations occur naturally as granular
materials with variable grain size distributions (e.g., sands, gravels, clays, etc.). Identification
of the individual minerals within these samples using optical microscopy can sometimes be
difficult, in particular for smaller grain sizes. Raman spectroscopy is particularly useful for
such investigations as it can identify each individual mineral phase at the microscopic scale.

However, in order to dissociate the individual spectra of each component, the grains must be
larger than the analysed volume.[12,13]
Of specific interest for Martian missions is the search for life and the presence of organic
matter in the rocks and soils of the red planet. Whether or not life emerged on Mars, organic
molecules should be detected because carbonaceous meteorites and micrometeorites
containing abiotic organic material reach the planet surface, even at the present day.[14]
Raman
spectroscopy is capable of detecting carbonaceous matter in geological materials, whether of
biological or abiological origin. Raman spectroscopy has been used to investigate abiogenic
carbon in a variety of Martian meteorites[15]
as well as to characterize modern biological
carbonaceous matter in rocks.[1,6]
Some studies have been able to detect biological carbon
molecules (e.g. beta-carotene, amino acids, etc) using various test conditions including
miniaturised and remote Raman spectrometers on powdered minerals and during in situ
measurements.[6,16-19]
In these tests, organics were added to the samples prior to analysis in
order to establish detection limits. In terrestrial materials, the presence of biogenic organic
matter produces abundant fluorescence in granular rocks (e.g., clays[20]
). Even in very ancient
rocks (e.g. ~3.5 billion years old) degraded biological carbon in the form of kerogen can be
easily detected by Raman spectroscopy. Although it is not possible to demonstrate a
biological origin of the kerogen in ancient rocks, Raman mapping of the organic component
in its mineralogical context can be used to aid detection of biosignatures, for example in rocks
~3.5 Ga old.[21,22]
The Raman spectra from crystalline materials may be modified by different parameters and
phenomena, as shown in Fig. 1. Since the crushing process can potentially influence all of
these conditions, the Raman spectrum obtained from a powdered sample may in fact be quite
different from that obtained from the (original) bulk sample. For example, changes in
wavenumber and peak width in the Raman spectra of powdered quartz and olivine powders
have previously been observed.[23]]
The aim of this study is therefore to determine whether
any additional Raman spectral parameters change when powdered rocks and minerals are
used and whether these changes impact the geological (and astrobiological) interpretations of
the data obtained. This investigation is focussed particularly on analytical conditions during
future extraterrestrial in situ missions. We first studied the effects of crushing on the Raman
spectra of different minerals using a micro-Raman laboratory device. Raman mapping of
several grain sizes was used to characterize the fine scale changes in the spectra. The RLS
simulator was used to determine if the observed grain size effects could potentially hamper
correct identification of minerals during the ExoMars mission. Additionally, the consequences
of crushing on the analyses of igneous rocks and sedimentary rocks (the latter containing
fossilised biosignatures) were examined. Finally, the advantages and disadvantages of using
crushed rocks are discussed.
Materials

Minerals
The following minerals were selected to study the changes in spectra induced by crushing.
Silicon
Silicon is more an inorganic material than a mineral since it occurs very rarely in nature[24]
as
small phases associated with gold.[24, 25]
Thus, although not a representative Martian mineral,
silicon was used as a control because it has a diamond structure (O7
h) and therefore only one
first-order Raman-active Si-Si stretching of symmetry F2g located at 520 cm-1
.[26,27]
Since its
spectrum is formed by only one peak, any changes induced by the sample preparation will be
easily detected. The material we used was obtained from the waste dump of the
electrometallurgy plant Pechiney in Montricher-Albanne, Haute-Savoie, France.
Quartz
Quartz (SiO2) is the standard mineral used to study the effects of crushing (i.e. sample
preparation) on Raman spectra.[23]
We used pure quartz (no traces of organic matter) from a
hydrothermal vein associated with a gold deposit in granite from Saint-Yrieix-la-Perche,
Haute-Vienne, France. The spatial symmetry of quartz (-quartz) is D4
3. Its spectrum consists
of several bands corresponding to A1 Si-O stretching (1085 cm-1
), E Si-O stretching (697 cm-
1, 795 cm
-1, 1070 cm
-1, 1162 cm
-1), A1 O-Si-O bending (356 cm
-1), E O-Si-O bending (394
cm-1
, 450 cm-1
), A1 Si-O stretching/O-Si-O bending (464 cm-1
), E O-Si-O bending/Si-O-Si
bending (265 cm-1
), A1 Si-O stretching/O-Si-O bending/Si-O torsion (207 cm-1
) and E O-Si-O
bending/Si-O-Si bending/Si-O torsion (128 cm-1
)[28]
. On Earth, quartz is ubiquitous but on
Mars it has only recently been detected in the form of amorphous silica associated with
hydrothermalism and/or diagenesis.[29]
This mineral phase is of particular relevance because it
was the lithifying phase of ancient terrestrial volcanic sediments (now largely
microcrystalline quartz or chert)[30]
and the fossilising medium of the traces of life contained
in the sediments .[31-34]
Two samples of the ancient sediments ~3.5 Ga-old terrains in Australia
(the Pilbara) and South Africa (Barberton) were included in this study and described below.
The relevance of these rocks for Mars is that the silicification of the ancient sediments was
induced due to the strong influence of silica-rich hydrothermal fluids on the saturation of
silica in the Early Archaean seawaters.[35]
This is of relevance to Early Mars because the
planet was as volcanically and hydrothermally active as the early Earth and water in impact
craters, or the hypothesised northern ocean, may also have been saturated in silica. The
presence of silica on Mars may thus indicate ancient hydrothermal activity.[36]
Graphite and charcoal
The graphite used for this study comes from the Alibert mine in the Sayan Mountains, Russia.
We used commercial charcoal as representative of biogenic carbon. The first order Raman
spectrum of graphite consists of a strong single line (G) at 1582 cm-1
and a smaller band at 42
cm-1
which corresponds to the E2g2 and E2g1 vibrational modes respectively.[37,38]
For
disordered carbon, additional bands appear at 1360 cm-1
(D), 1620 cm-1
(D’) and 2960 cm-1

(D’’). Second order Raman bands are also observed between 2400 cm-1
and 3200 cm-1
. The
ratio of intensities and the widths of the D and G peaks provide information about the degree
of disorder.[39,40]
The latter is very small in graphite but larger in the less well-ordered
charcoal. Despite this correlation between Raman spectra and the microstructure of
carbonaceous matter, ancient organic matter of biological origin in rocks (known as kerogen)
is difficult to distinguish from abiogenic carbon using Raman spectroscopy.[7,41]
Moreover,
high grade metamorphism tends to increase the intensity of peak G[42]
while abrasion can
increase the intensity of peak D.[43,44]
Rocks
A number of rock samples was used to examine the effect of crushing on the detection and
identification of mineral phases. In some cases, the samples included kerogenous traces of
life.
Basalt
Basalt is the most common rock on Mars.[45]
The sample we used was collected from Roca
Neyra, Perrier, France[46,47]
and is a geochemical and textural analogue of basalts analyzed on
Mars.[45,48]
Rocks are composites of several minerals and thus do not have a specific
characteristic Raman spectrum. Basalts consist of olivine, pyroxene, plagioclase, spinels and
accessory minerals (e.g. calcite, apatite, zeolite) in a glassy matrix.
Silicified volcanic sediments (cherts)
As noted above, the oldest sedimentary rocks on Earth are silicified volcanic sediments
(cherts).[30]
Here we use two Early Archaean cherts which both contain traces of ancient
life[22, 32-34]
: the 3.45 Ga-old Kitty’s Gap Chert, from Pilbara, Australia, and the 3.3 Ga-old
Josefsdal Chert from Barberton Greenstone Belt, South Africa. Volcanic sediments and their
alteration products are common on Mars although, to date, silicified volcanic sediments
(cherts) have not yet been found. Nevertheless, silica of possible hydrothermal origin has been
identified on Mars [36]
. Given the similarities in the microbial-scale environmental conditions
of early Mars and early Earth, primitive life forms on both planets (assuming that life
appeared on Mars) were likely to have had similar characteristics and lifestyles.[49]
Fossilised
traces of pre-Noachian/Noachian (-4,5 to -3,5 Ga) life on Mars may therefore be similar in
size and shape to the very primitive forms of life that exist as silicified microfossils in the
Josefsdal and Kitty’s Gap cherts.[22,34]
These sediments are therefore particularly relevant for
Mars.
Sample preparation
Bulk samples of the rocks and minerals were analysed. Subsamples of the rocks and minerals
were then crushed using an agate mortar and pestle. The crushed samples were sieved into
four different grain sizes according to the Wentworth classification system[50]
: 160-100 μm,
100-63 μm, 63-40 μm and <40 μm. The graphite powders tended to flocculate and were
therefore washed with deflocculating agent (phosphate-buffered saline solution diluted in
~200 ml of pure water), copiously rinsed and dried. This additional step removed small grains

which adhered to the lager graphite grains because of electrostatic forces, an effect not
observed with the other samples. The samples were prepared for Raman analysis by placing
the different grain size powders from individual samples next to each other on a glass slide
and pressing the powder flat to decrease the surface roughness.
Powders of the samples in the 200-250 µm size range were also produced because this is the
size of the crushed materials that will be produced by the ExoMars crusher.[51]
Methods
A WITec Alpha500 RA Raman spectrometer with a green laser (=532 nm, Nd:YAG
frequency doubled laser) was used (CBM, Orléans). The laser is connected to the system via a
polarized optical fibre and is focussed on the surface using optical microscope objectives.
Depending on the objective used, the spot size can be relatively small and the laser irradiance
on the sample surface, estimated using a calibration grid obtained from the constructor data,
can be relatively high (see Table S1). Two gratings were used for the spectrometer: 600
g/mm, with a spectral range of ~4000 cm-1
and a resolution of ~3 cm-1
, as well as a 1800
g/mm, with a spectral range of ~1300 cm-1
and a resolution of ~1 cm-1
. The system was
optimized for mapping with a piezo-electric positioning system mounted on a motorized
moving stage. The samples were scanned over areas ranging from a few µm² to up to several
cm² and several thousands of spectra were acquired per scan (see Table S1). Large area scans
were made of each glass slide. Very small changes in Raman spectra that would have been
impossible to detect using single spectra were highlighted on the Raman maps. In this way it
was possible to observe the variations in the spectra as a function of grain size. The average
spectrum for each grain size range was obtained from these maps.
A laboratory model of the ExoMars RLS device (Fig. S1a), developed at the Associated Unit
University of Valladolid-CSIC-Center of Astrobiology (UVa-CAB), was used to study the
effect of crushing on in situ measurements on Mars.[9]
The laboratory model has an XYZ
positioning system with 2.5 µm precision and imaging, autofocus, and spectral acquisition
capabilities. It can be programmed to work autonomously.[52]
The analytical strategy of the
RLS instrument is the acquisition of spectra along a linear series of points. At each point, the
optical head is focused on the sample, the acquisition parameters (i.e., integration time and
number of accumulations) are automatically calculated, and the spectrum acquired. The RLS
instrument is equipped with a green laser (=532 nm), a spot size of 50 µm diameter yielding
an irradiance level between 0.6 and 1.2 kW/cm², with a 6-7 cm-1
spectral resolution. Raman
spectra were also obtained at the UVa-CAB with a Horiba Jobin Yvon iHR320 spectrometer
using a Spex ISA Spectrum One Nitrogen refrigerated CCD with a grating of 1200 g/mm and
a green laser (=532 nm). This system was interfaced with the RLS simulator in order to
acquire the Stokes and Antistokes signals (Fig. S1b). Analyses with the ExoMars RLS
simulator and iHR320 spectrometer were carried out on the same sieved powders as those
analysed by the WITec laboratory instrument. The parameters used for the analyses with the
RLS simulator and the iHR320 systems are displayed in Table S2 and Table S3, respectively.

Results
Minerals
The Raman spectra of the bulk samples are displayed in Fig. S2.
Silicon
The Raman maps made with the WITec instrument shown in Fig. 2 demonstrate that the main
peak position has shifted from 521 cm-1
to 493 cm-1
with decreasing grain size. This is
associated with the observed increase in Full Width at Half Maximum (FWHM), from 6.7 cm-
1 to 27.7 cm
-1, an increase in peak asymmetry (broadening on the left of the peak), as well as
an increase in the background level. Moreover, new peaks appear in the spectrum at about 280
cm-1
. The RLS simulator documented similar effects on the different size classes but did not
observe the appearance of new peaks. Peak displacement and broadening, as well as a
decrease in intensity correlate with the reduction of grain size. For the smaller grain size, the
peak shifted from 521 cm-1
to 504 cm-1
and the FWHM increased to 8.2 cm-1
with respect to
the bulk sample. However, no significant changes were observed in size range of the
ExoMars-type powdered sample (200-250 µm). Complementary experiments made with the
iHR320 system on the sample powder showed that the peak displacement was only about 3
cm-1
and that the broadening was lower than 4.5 cm-1
with respect to the bulk sample. Such
variations are within the range of the resolution of the RLS simulator and explain why they
were not observed.
Quartz
In contrast to silicon, the quartz spectrum is not as significantly modified and the variations
are small; 1.4 cm-1
for the shift and 0.8 cm-1
for the FWHM, as seen in Fig. 3. A peak
located at 520 cm-1
, not detected in the bulk sample, increases in intensity with decreasing
grain size. Finally, the background levels strongly increase with corresponding decrease in
grain size. Using the RLS simulator, a very slight displacement of the main peak can be seen
in the spectrum of smallest grain size sample with respect to the bulk sample. A very weak
peak at 520 cm-1
also appeared. Irrespective of the grain size, an increase of the background
level with respect to the bulk sample is observed.
Graphite and charcoal
The Raman spectra of graphite and charcoal powders obtained using the WITec laboratory
instrument and the RLS system are shown in Fig. 4. The G/D intensity ratio remains
unchanged and the graphite remains clearly distinguishable from charcoal. However, the
signal/noise ratio dramatically decreases with corresponding decrease in grain size as a result
of a strong increase in the background level. The charcoal sample was also very sensitive to
laser power and burned easily, especially at the smallest grain sizes. Finally, the presence of
the D peak in the Raman spectrum of the bulk graphite (Fig. S2c and Fig. 4a,b) can be
explained by surface effects induced by the cutting process.[43,44]

Rocks
Basalt
Rocks consisting of multiple minerals require the acquisition of several Raman spectra to
detect each mineral and, thus, spectral mapping is very useful for detecting all the phases
within a sample. The Raman maps in Fig. 5 were made for the polished surface of the rock
and powdered rock in different grain size using the WITec system. The Raman map made on
the polished rock surface of the bulk sample demonstrates its fine crystalline structure and the
large number of mineral phases within a small area. Minerals identified include labradorite
(plagioclase), augite (pyroxene), forsterite (olivine) and apatite. Trace amounts of elemental
carbon were also detected, as well as an unidentified mineral, possibly spinel.
After crushing, recognition of the different minerals becomes more difficult with decreasing
grain size. The background level increases strongly and the empty spaces between the grains
diminish the number of spectra per scan. Without any prior knowledge of the studied sample,
detection of the different minerals in the scanned areas would be very difficult. Identification
of the minerals on the maps was made by a correlation process using the original spectra
accumulated on the bulk sample. Even with this technique, not all the minerals observed in
the bulk sample could be detected in the Raman maps. The crushing process also leads to the
loss of texture and the pattern of mineral distribution can no longer be used for petrological
interpretation of the rock. The value of Raman mapping is significantly reduced on powdered
material and the best way to study these samples was to make a series of single spectra. A line
scan of more than 100 single spectra using autofocus was thus made on the larger grain size
powder. With this method, it was possible to detect the major phases, as seen Fig. 5c.
However, due to the small spot size (<1.5 µm), the probability of detecting minor phases was
very low.
The RLS system uses a similar line scan procedure but, due to its larger spot size (50 µm), it
was capable of detecting more phases with fewer measurements (here 30 single spectra).
However, the individual spectra obtained correspond to a mixture of the spectra of a number
of minerals, as can be seen in Fig. 5d.
Silicified volcanic sediments (cherts)
The silicified volcanic sediments samples were first characterized on a cut surface of the rock
(similar to the surface of a rock prepared using the Rock Abrasion Tool of the Mars
Exploration Rovers) and in thin section preparations of the rock (Fig. 6). Although the rock
contains microfossils, these structures are too small to be observed by optical microscopy,
even in thin section. However, the black layers of the Josefsdal chert contain detectable intact
layers consisting of in situ or detrital fragments of microbial mats and other microbial remains
(see Fig. 6d,e). Likewise, in the Kitty’s Gap Chert sample carbonaceous remains of microbial
colonies can be observed microscopically on the surface of volcanic grains (Fig. 6i,j). The
relationship between the texture observed in the optical view and the distribution of the
carbonaceous matter detected by Raman spectroscopy is readily apparent in Fig. 6. Although
the Raman spectrum of kerogen is not sufficient to demonstrate its biogenicity, the

distribution of carbon within the rock and its association with particular minerals is sufficient
to, at least, locate interesting areas for further, potential biosignature investigation. Once
crushed, the powders of the originally black and white laminated rocks are relatively uniform
in colour. Raman mapping of the powder revealed only the presence of quartz. On the other
hand, the line scan method, similar to that used for the analysis of the basalt, provided several
spectra of carbonaceous matter, as well as quartz. However, the spatial relationship of the
carbonaceous matter with respect to particular minerals was lost.
The experiments performed with the RLS simulator showed that this instrument was capable
of easily detecting the carbonaceous matter in the sample and carbon peaks occurred in almost
all the spectra acquired. In addition, all other minerals detected in the bulk rock were found.
As for the basalt, this is due to the larger spot size of the RLS simulator compared to that of
the WITec instrument. Figure 7 shows a typical Raman spectrum acquired with the RLS
simulator compared with the average spectrum of 80 spectra obtained with the WITec system
in which ankerite was also observed.
Discussion
Minerals
Heating induced during measurement with a Raman laser can be very high, in particular with
the WITec system where the spot size is only about 1.5 µm in diameter. Thermal effects can
thus explain some of the changes observed in the silicon and quartz spectra. The shift and
broadening of the main peak of quartz[53]
and silicon[54]
with temperature is well known. In
order to confirm the thermal origin of the observed changes, complementary investigations
were made. The evolution of the Raman spectrum of the finest silicon powder with increasing
laser power was studied using the WITec system and a broadening and shift in the main peak
were observed (Fig. 8a). A series of spectra on the same powder were also acquired with the
iHR320 system interfaced with the RLS system (see Fig. S2b). This configuration allows
measurement of the intensity ratio between the Stokes and Antistokes signals that is known to
be function of the temperature:[55,56]
(1)
where h is the Planck constant, c the speed of light, k the Boltzmann constant, ̅ the peak
wavenumber, the laser wavelength, Is the Stokes and IAS the Antistokes peaks intensity.
Based on this equation, the evolution of the local temperature with the different grain sizes
was plotted in Fig. 8b. The temperature reaches more than 280°C for the smaller grain size,
despite the very low irradiance used (1.2 kW/cm²). Peak position with respect to temperature
has been previously measured on bulk silicon.[54]
For a temperature of 280°C it is ~519 cm-1
.
This is in accordance with the iHR320 measurement of 518 cm-1
. Using the same model, the
temperatures corresponding to ~504 cm-1
, as measured with the RLS system, and to ~493 cm-

1, as measured with the WITec system on the smallest grain size powder, are 760°C and
1200°C respectively. The strong increase of the temperatures with decreasing grain size can
be explained by the fact that small particles cannot evacuate heat as well as large particles, i.e.
the thermal conductivity of the material decreases with grain size. This effect is all the more
important since silicon is black. Changes in wavenumber and line width with decreasing grain
size have been observed previously and were explained by the contribution of surface modes
that are increased in finer grain sized powder.[23]
However, our experiments clearly
demonstrate that the major reason for this change is the local increase of temperature. Despite
its black colour, this study shows that the spectrum of carbonaceous matter was not as
affected by this strong increase in temperature as suggested by previous studies.[41]
Conversely, the appearance of the new peak at 520 cm-1
in the quartz spectrum is not a
thermal effect associated with the power of the laser. This peak is characteristic of coesite[57]
and corresponds to the symmetric stretching of oxygen in the four-membered SiO4
tetrahedra.[58]
However, the Raman spectrum of coesite is normally characterised by
additional peaks at 204 cm-1
, 270 cm-1
, 355 cm-1
, and 426 cm-1
which were not present in our
sample.[57]
A similar situation was previously noted in the quartz spectrum in an eclogite from
Antartica.[59]
In the latter case, it was proposed that the coesite crystalline structure was
attained at the nanometric scale within anomalous -quartz (called cryptic coesite), which
developed under high pressure. In order for this peak to appear experimentally, quartz must be
shocked at several tens of GPa.[60]
Since this level of pressure was not reached during the
crushing of our samples, we therefore propose that the presence of this peak is related to a
surface effect. Indeed, the crushing process may create grains with uncommon surface
crystalline orientations leading to particular dangling bonds which have a similar vibrational
mode to those of the cryptic coesite. Thus, the probability of observing this peak at 520 cm-1
increases with higher grain density in the crushed samples, which agrees with our
observations in this study.
In order to verify this assertion, several Raman analyses were made on the surface of large
fragments broken off of the quartz sample. As shown in Fig. 9, the peak at 520 cm-1
was
observed in spectra made on the surface of concentric rings of conchoidal fractures. The peak
disappears when the analysis is made deeper into the sample. These observations on an
uncrushed sample are in accordance with a surface effect.
The appearance of new peaks around 280 cm-1
in the silicon spectrum is explained by the
acoustic phonons of representation A1g+Eg+F2g appearing in a certain polarisation
configuration (z’(y’y’)z’).[26,27]
This phenomenon is only observable with the WITec system
which uses a linearly polarized laser beam, whereas the RLS simulator does not. In powders,
grains are randomly oriented and the density of specifically oriented grains increases with
decreasing grain size.
Mineral identification using Raman spectroscopy is made by comparing an acquired spectrum
with that of reference spectra from the literature or from compiled databases (e.g. RRUFF).
Significant changes in the characteristics of Raman spectra, such as those observed in silicon,
can lead to serious misidentification of species. Using the spectrum of the smallest grain size

powder of silicon, comparison with the RRUFF database via the CrystalSleuth software
(http://rruff.info/) shows a match of only 14% with silicon, the best match (93%) being
Paulingite, a rare zeolite mineral with the formula (K,Na,Ca)3-4(Si,Al)21O42 ·17-22H2O. This
experience underlines the potential problems that may arise by Raman analyses of crushed
minerals.[19]
Since larger spot sizes of the ExoMars RLS result in lower irradiance, the changes in spectral
parameters described above are strongly reduced and many of the thermal effects are
negligible or nonexistent, with the exception of the increase in background level. Changes
induced by the structure of the powder itself (eg. new peaks, surface effects, etc) are relatively
limited and we conclude that the crushing of samples during the future ExoMars mission will
not have a necessarily negative effect on identification of the Raman spectra of minerals.
Rocks
By definition, a rock contains several mineral phases that can sometimes be of very small
size, such as the basalt analysed in this study. If the Raman spot size is larger than these
phases, the resulting spectrum will correspond to a mixture of the individual spectra of several
minerals, as demonstrated by the RLS system with its 50 µm spot size. It was shown before
that the limit of identification of an unknown material is different from the limit of detection
of a known material.[19]
Indeed, a single peak is most of the time not sufficient to indentify a
material, in particular when mixed with other compounds that may exhibit similar Raman
bands. The technical parameters such as the wavelength of the laser, the spot size, the CCD
camera, etc. must be carefully chosen in order to improve this identification limit.[19]
This
assertion is all the more true while working on powdered rocks that are characterised by a
mixtures of several compounds. However, we have shown that deconvolution of the different
spectra can be facilitated by the acquisition of several tens of spectra at different locations on
the sample since the probability of always obtaining exactly the same mixture is very low.
Most of the minerals present in the rocks used in this experiment, as well as the carbonaceous
matter, were thus detected and indentified with the RLS system. Moreover, due to the mixing
of the components in the powder, the probability of detecting minor phases within a sample
(including those occurring at down to 1% of the mass[52]
) is strongly increased. For instance,
the RLS system allows detection of carbonaceous matter in the cherts when the probability of
detecting it by chance in the bulk sample would have been very low because of its specific
distribution. In this case, working on powders is advantageous, except if the detected phase
would not be “representative” of the sample (e.g. inclusion, alteration, contamination…).
The most important influence of the crushing process is on the loss of texture, i.e. the spatial
relationship between the minerals. Without this textural context, it would be difficult to
distinguish between rocks consisted of the same minerals but formed in different contexts
(basalts and gabbros for example). This loss of texture will also have consequences on the
search for past traces of life. As noted above, Raman spectroscopy cannot distinguish between
biotic and abiotic carbon. Only the direct correlation of carbonaceous matter with specific
structures and/or minerals in the Josefsdal and Kitty’s Gap cherts could indicate a potential

biosignature. Whereas Raman mapping and optical microscopy on bulk rock allow
observation of these very fine details, they are destroyed once the sample has been crushed
and, thus, the detection of biosignatures is strongly compromised.
Our study demonstrates that, despite the limitations of the analytical possibilities of the in situ
ExoMars RLS system (i.e. only few tens of spectra per sample, no high resolution mapping,
etc), this system is well adapted to analysing crushed samples and can efficiently identify
even minor phases in a sample. For instance, carbonaceous traces might be more easily
detected in powdered samples than on the bulk ones. In combination with the high resolution
images of the sample taken by the CLUPI instrument it might be possible to locate it or infer
its mineralogical association. The possibility of preparing polished sections of rocks in situ
during a mission would make Raman mapping on such samples very useful, in particular if
associated with optical observations made by a close-up imager or a high resolution camera.
Finally, classical analysis combining images of texture and spectral data on a bulk sample in
their relative context is preferable when working with laboratory systems.
Conclusion and perspectives
The crushing of minerals may induce changes in Raman spectra in comparison to spectra
generated from analyses made on bulk samples. A general increase of the background level,
shift in peak position, an increase in peak width, and the appearance of new peaks was
observed, depending on the material analysed. These effects are induced by a local increase in
heat and by the enhancement of crystallographic surface orientation interactions. Due to the
relatively large spot size of the ExoMars RLS system, most of these observed spectral
changes for powders analysed are negligible or nonexistent. Sample preparation (i.e.
crushing) causes a loss of texture unfavourable and potentially destructive of fine scale
features within rocks including any potential traces of life. Thus, detailed optical observations
of samples prior to crushing will be essential in order to ensure acceptable interpretations of
data generated by RLS and the other instruments of the Pasteur payload. This study
demonstrates that the ExoMars RLS system is suitable for analysing crushed samples and is
capable of detecting many phases with only few acquisitions. Furthermore, current work at
UVa-CAB demonstrates that the limit of detection is enhanced and that semi-quantification
could be possible using powdered samples, thus ensuring the best possible scientific return
from the RLS instrument in situ on Mars.
Acknowledgements
We acknowledge the reviewers and Liane Loiselle for their very useful comments which
contributed to the development of this paper. We thank Pr. E. Marcoux and M. Bellanger for
the provision of graphite and silicon samples respectively.

References
[1] H. G. M. Edwards, S. E. Jorge-Villar, J. L. Bishop, M. Bloomfield, J. Raman Spectrosc.
2004 ; 35, 458.
[2] A. Wang, L. A. Haskin, T. J. Wdowiak, S. W. Squyres, R. J. Wilson, L. E. Hovland, K. S.
Manatt, N. Raouf, C. D. Smith, J. Geophys. Res. 2003 ; 108E1, 5005.
[3] A. Wang, K. E. Kübler, B. L. Jolliff, L. A. Haskin, Am. Mineral. 2004 ; 89, 665.
[4] N. Tarcea, M. Harz, P. Rösch, T. Frosch, M. Schmitt, H. Thiele, R. Hochleitner, J. Popp,
Spectrochim. Acta, Part A 2007 ; 68, 1029.
[5] J. J. Freeman, A. Wang, K. E. Kübler, B. L. Jolliff, L. A. Haskin, Can. Mineral. 2008 ; 46,
1477.
[6] J. Jehlicka, H. G. M. Edwards, P. Vitek, Planet. Space Sci. 2009 ; 57, 606.
[7] C. P. Marshall, H. G. M. Edwards, J. Jehlicka, Astrobiology 2010 ; 10, 229.
[8] ESA ExoMars website - http://www.esa.int/SPECIALS/ExoMars/SEM10VLPQ5F_0.html
[9] F. Rull, S. Maurice, E. Diaz, C. Tato, A. Pacros, RLS Team, Abstr. 42nd
Lunar and
Planetary Science Conference 2011 ; 2400.
[10] F. Rull, G. López, A. Catalá, J. Medina, A. Sansano, A. Sanz, F. Sobrón, Abstr. The
International Conference: Exploring Mars Habitability, Lisbon, Portugal, June 13-15 2012.
[11] J.-L. Josset, F. Westall, B.A. Hofmann, J.G. Spray, C. Cockell, S. Kempe, A.D. Griffiths,
M.C. De Sanctis, L. Colangeli, D. Koschny, D. Pullan, K. Föllmi, L. Diamond, M. Josset, E.
Javaux, F. Esposito, D. Barnes, Geophys. Res. Abstr. 2012 ; 14, 13616.
[12] S. Andò, P. Vignola, E. Garzanti, Rend. Fis. Acc. Lincei 2011 ; 22, 327.
[13] E. Garzanti, S. Andò, C. France-Lanord, P. Censi, P. Vignola, V. Galy, M. Lupker, Earth
Planet. Sci. Lett. 2011 ; 302, 107.
[14] R. E. Summons, J. P. Amend, D. Bish, R. Buick, G. D. Cody, D. J. Des Marais, G.
Dromart, J. L. Eigenbrode, A. H. Knoll, D. Y. Sumner, Astrobiology 2011 ; 11, 157.
[15] A. Steele, F. M. McCubbin, M. Fries, L. Kater, N. Z. Boctor, M. L. Fogel, P. G. Conrad,
M. Glamoclija, M. Spencer, A. L. Morrow, M. R. Hammond, R. N. Zare, E. P. Vicenzi, S.
Siljeström, R. Bowden, C. D. K. Herd, B. O. Mysen, S. B. Shirey, H. E. F. Amundsen, A. H.
Treiman, E. S. Bullock, A. J. T. Jull, Sciencexpress 2012 ; 10, 1120.
[16] J. Jehlicka, H. G. M. Edwards, Org. Geochem. 2008 ; 39, 371.
[17] A. Culka, J. Jehlicka, P. Vandenabeele, H. G. M. Edwards, Spectrochim. Acta, Part A
2011 ; 80, 8.

[18] A. Culka, J. Jehlicka, L. Strnad, Spectrochim. Acta, Part A 2012 ; 86, 347.
[19] P. Vandenabeele, J. Jehlicka, P. Vitek, H. G. M. Edwards, Planet. Space Sci. 2012 ; 62,
48.
[20] U. Villanueva, J. C. Raposo, K. Castro, A. de Diego, G. Arana, J. M. Madariaga, J.
Raman Spectrosc. 2008 ; 39, 1195.
[21] F. Foucher, F. Westall, in Micro-Raman Spectroscopy and Luminescence Studies in the
Earth and Planetary Science, (Eds: A. Gucsik), American Institute of Physics, 2009 ; CP
1163, pp. 47-58.
[22] F. Westall, F. Foucher, B. Cavalazzi, S. T. de Vries, W. Nijman, V. Pearson, J. Watson,
A. Verchovsky, I. Wright, J.-N. Rouzaud, D. Marchesini, S. Anne, Planet. Space Sci. 2011 ;
59, 1093.
[23] S. K. Sharma, C. H. Chio, P. Deb, P. G. Lucey, N. Domergue-Schmidt, K. A. Horton,
XXXIth Lunar and Planetary Science Conference, Houston, USA, March 13-17 2000 ; 2030.
[24] M. E. Back, J. A. Mandarino, Fleischer's Glossary of Mineral Species 2008, The
Mineralogical Record Inc., Tucson, 2008, p. 213.
[25] J. L. Jambor, J. Puziewicz, Am. Mineral. 1991 ; 76, 665.
[26] P. A. Temple, C. E. Hathaway, Phys. Rev. B 1973 ; 7, 3685.
[27] R. Poilblanc, F. Crasnier, Spectroscopies infrarouge et Raman, EDP Sciences, Grenoble,
2006, pp. 466-470.
[28] J. Etchepare, M. Merian, L. Smetankine, J. Chem. Phys. 1974 ; 60, 1531.
[29] M. R. Smith, J. L. Bandfield, J. Geophys. Res. 2012 ; 117, E06007.
[30] A. P. Nutman, S. J. Mojzsis, C. R. L. Friend, Geochim. Cosmochim. Acta 1997 ; 61,
2475.
[31] F. Westall, M. J. de Wit, J. Dann, S. van der Gaast, C. E. J de Ronde, D. Gerneke,
Precambrian Res. 2001 ; 106, 93.
[32] F. Westall, C. E. J. de Ronde, G. Southam, N. Grassineau, M. Colas, M., C. Cockell, H.
Lammer, Philos. Trans. R. Soc., B 2006 ; 361, 18570.
[33] F. Westall, S. T. de Vries, W. Nijman, V. Rouchon, B. Orberger, V. Pearson, J. Watson,
A. Verchovsky, I. Wright, J.-N. Rouzaud, D. Marchesini, A. Severine, Spec. Pap. - Geol. Soc.
Am. 2006 ; 405, 105.
[34] F. Westall, B. Cavalazzi, L. Lemelle, Y. Marrocchi, J.-N. Rouzaud, A. Simionovici, M.
Salomé, S. Mostefaoui, C. Andreazza, F. Foucher, J. Toporski, A. Jauss, V. Thiel, G.
Southam, L. MacLean, S. Wirick, A. Hofmann, A. Meibom, F. Robert, C. Defarge, Earth
Planet. Sci. Lett. 2011 ; 310, 468.

[35] A. Hofmann, R. Bolhar, Astrobiology 2007 ; 7, 355.
[36] S. W. Squyres, R. E. Arvidson, S. Ruff, R. Gellert, R. V. Morris, D. W. Ming, L.
Crumpler, J. Farmer, D. J. des Marais, A. Yen, S. M. McLennan, W. Calvin, J. F. Bell III, B.
[37] F. Tuinstra, J. L. Koenig, J. Chem. Phys. 1970 ; 53, 1126.
[38] J. Jehlicka, C. Bény, J. Mol. Struct. 1999 ; 480-481, 541.
[39] C. Bény-Bassez, J.-N. Rouzaud, Scanning Electron Microsc. 1985 ; 1, 119.
[40] E. Quirico, G. Montagnac, J.-N. Rouzaud, L. Bonal, M. Bourot-Denise, S. Duber, B.
Reynard, Earth Planet. Sci. Lett. 2009 ; 287, 185.
[41] J. D. Pasteris, B. Wopenka, Astrobiology 2003 ; 3, 727.
[42] O. Beyssac, B. Goffé, C. Chopin, J.-N. Rouzaud, J. Metamorph. Geol. 2002 ; 20, 859.
[43] M. R. Ammar, J.-N. Rouzaud, J. Raman Spectrosc. 2011 ; 42, 5.
[44] O. A. Maslova, M. R. Ammar, G. Guimbretière, J.-N. Rouzaud, P. Simon, Phys. Rev. B
2012 ; 86, 134205-(5).
[45] H. Y. Mc Sween, G. J. Taylor, M. B. Wyatt, Science 2009 ; 324, 736.
[46] J.-F. Pastre, A. Chambaudet, J. Couthures, C. R. Séances Acad. Sci., Vie Acad. 1983 ;
296, 79.
[47] J.-F. Pastre, Quaternaire 2004 ; 15, 87.
[48] H. Y. McSween, R. E. Arvidson, J. F. Bell III, D. Blaney, N. A. Cabrol, P. R.
Christensen, B. C. Clark, J. A. Crisp, L. S. Crumpler, D. J. Des Marais, J. D. Farmer, R.
Gellert, A. Ghosh, S. Gorevan, T. Graff, J. Grant, L. A. Haskin, K. E. Herkenhoff, J. R.
Johnson, B. L. Jolliff, G. Klingelhoefer, A. T. Knudson, S. McLennan, K. A. Milam, J. E.
Moersch, R. V. Morris, R. Rieder, S. W. Ruff, P. A. de Souza, S. W. Squyres, H. Wänke, A.
Wang, M. B. Wyatt, A. Yen, J. Zipfel, Science 2004 ; 305, 842.
[49] F. Westall, Science 2005 ; 308, 366.
[50] C. K. Wentworth, J. Geology 1922 ; 30, 377.
[51] A. Sansano, G. Lopez, J. Medina, F. Rull, AMASE 10 team, Abstr. EPSC-DPS 2011 ; 6,
856.
[52] G. Lopez-Reyes, F. Rull, A. Sanz, J. Medina, A. Catala, I. Hermosilla, B. Lafuente,
Abstr. GEORAMAN X, Nancy, France, June 11-13, 2012.
[53] T. M. K. Nedungadi, Proc. - Indian Acad. Sci., Math. Sci. 1940 ; 11-2, 86.
[54] T. R. Hart, R. L. Aggarwal, B. Lax, Phys. Rev. B 1970 ; 1, 638.

[55] D. A. Long, Raman Spectroscopy, McGraw-Hill, New York, 1976, p. 84.
[56] R. Poilblanc, F. Crasnier, Spectroscopies infrarouge et Raman, EDP Sciences, Grenoble,
2006, p. 319.
[57] T. Kobayashi, T. Hirajima, Y. Hiroi, M. Svojtka, J. Min. Pet. Sci. 2008 ; 103, 105.
[58] S. K. Sharma, B. Simons, H. S. Yoder, Am. Mineral. 1983 ; 68, 1113.
[59] R. Palmeri, M. L. Frezzotti, G. Godard, R. J. Davies, J. Metamorph. Geol. 2009 ; 27,
685.
[60] T. de Rességuier, P. Berterretche, M. Hallouin, J. Appl. Phys. 2003 ; 93, 2123.
Figures captions
Figure 1. (Illustrative) Annotated Raman spectrum demonstrating the causality of potential
modification effects.

Figure 2. Raman analyses of silicon powders. (a) Photography and large area Raman maps
(decreasing in grain size from left to right) showing background level, position of the main
peak, and width of the main peak. (b) Average Raman spectra of the main peak for the bulk
sample and for each powder. (c) Detailed spectrum of <40 µm grain size powder highlighting
the bands in the 280 cm-1
region.
Figure 3. Raman analyses of quartz powders. (a) Photography and large area Raman maps
(decreasing in grain size from left to right) showing background level, position of the main
peak, width of the main peak and intensity of the peak at 520 cm-1
.

Figure 4. Raman analyses of various graphite and charcoal powders, using with the WITec
system (a and c respectively) and the RLS simulator (b and d respectively)2.
Figure 5. Background level (a) and compositional Raman maps (b) of bulk and powdered
basalt samples (scan size 200x200 µm²) acquired using the WITec system. Single Raman
spectra of 160 to 100 µm grain sized basalt powder (c) collected using the line scan method

with the WITec system, autofocus on. Single Raman spectra of 200-250 µm grain size
(ExoMars type) basalt powder (d), collected with the RLS simulator.
Figure 6. Chert samples from (a-e) Josefsdal, Barberton Greenstone Belt, South Africa, and
(f-j) Kitty’s Gap, Pilbara, Australia. (a,f) Photography of the cut and polished surfaces and
(b,g) corresponding Raman maps, where carbonaceous matter (kerogen) appears green,
anatase (TiO2) blue and quartz orange. These Raman maps allow rapid detection of areas of
interest which can be targeted for further analyses with higher resolution spectral (c,h) and
imaging (optical (d,i) and Raman (e,j)) techniques.
Figure 7. Raman spectra of silicified volcanic sediments powders from Josefsdal, Barberton,
South Africa. (a) Typical single spectrum obtained with the RLS instrument and (b)
“equivalent” spectrum obtained by averaging 80 spectra acquired with the WITec system.
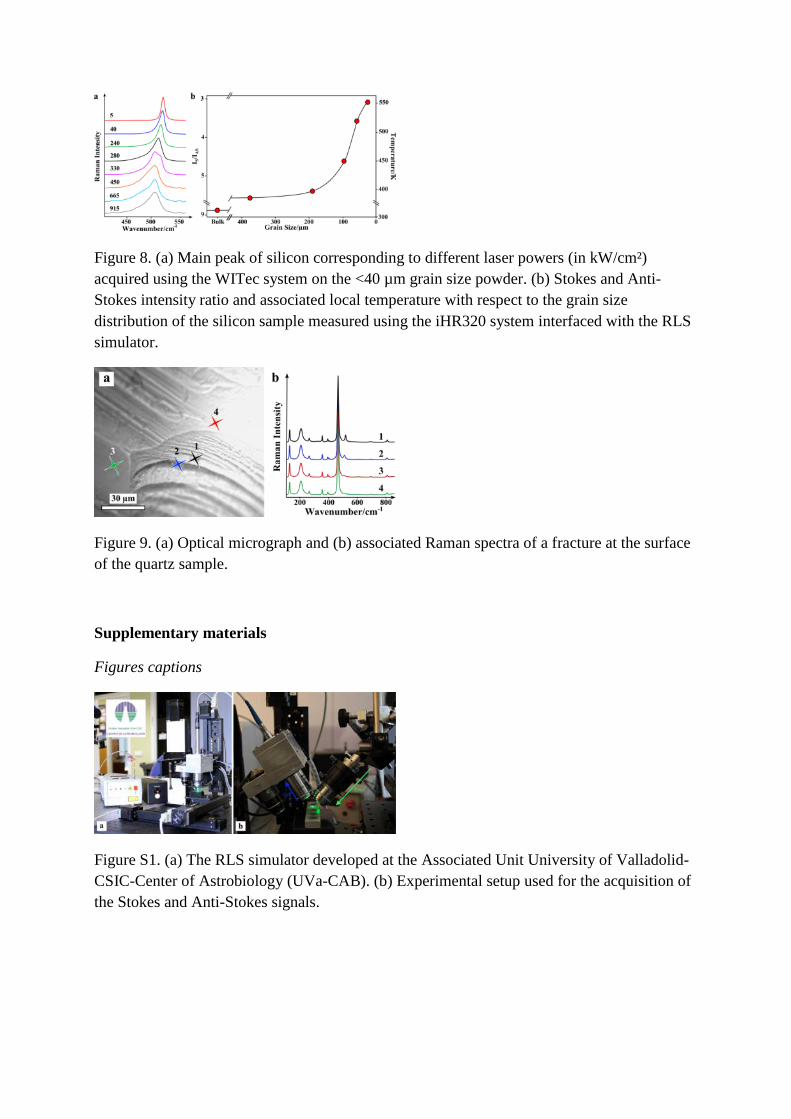
Figure 8. (a) Main peak of silicon corresponding to different laser powers (in kW/cm²)
acquired using the WITec system on the <40 µm grain size powder. (b) Stokes and Anti-
Stokes intensity ratio and associated local temperature with respect to the grain size
distribution of the silicon sample measured using the iHR320 system interfaced with the RLS
simulator.
Figure 9. (a) Optical micrograph and (b) associated Raman spectra of a fracture at the surface
of the quartz sample.
Supplementary materials
Figures captions
Figure S1. (a) The RLS simulator developed at the Associated Unit University of Valladolid-
CSIC-Center of Astrobiology (UVa-CAB). (b) Experimental setup used for the acquisition of
the Stokes and Anti-Stokes signals.

Figure S2. Raman spectra of bulk samples of (a) silicon, (b) quartz, (c) graphite and (d)
charcoal.
Tables captions

Table S1. Parameters used for data acquisition with the WITec Alpha500 RA system.
Table S2. Parameters used for data acquisition with the ExoMars RLS simulator system.
Table S3. Parameters used for data acquisition with the Horiba Jobin Yvon iHR320 system.