effect of gasoline–bioethanol blends on the properties and
TRANSCRIPT

RSC Advances
PAPER
Ope
n A
cces
s A
rtic
le. P
ublis
hed
on 0
7 M
arch
201
7. D
ownl
oade
d on
12/
28/2
021
3:37
:54
PM.
Thi
s ar
ticle
is li
cens
ed u
nder
a C
reat
ive
Com
mon
s A
ttrib
utio
n-N
onC
omm
erci
al 3
.0 U
npor
ted
Lic
ence
.
View Article OnlineView Journal | View Issue
Effect of gasoline
aDepartment of Mechanical Engineering, Fac
50603 Kuala Lumpur, Malaysia. E-mail: sok
my; Fax: +60 3 79675317; Tel: +60 1732386bMechanical Engineering Department, Colle
11421 Riyadh, Saudi Arabia
Cite this: RSC Adv., 2017, 7, 15005
Received 10th January 2017Accepted 27th February 2017
DOI: 10.1039/c7ra00357a
rsc.li/rsc-advances
This journal is © The Royal Society of C
–bioethanol blends on theproperties and lubrication characteristics ofcommercial engine oil
L. S. Khuong,*a H. H. Masjuki,*a N. W. M. Zulkifli,a E. Niza Mohamad,a M. A. Kalam,a
Abdullah Alabdulkarem,b A. Arslan,a M. H. Mosarof,a A. Z. Syahira and M. Jamshaida
Concerns over depleting fossil fuel reserves, energy security, and climate change have resulted in
stringent legislation demanding that automobiles use more renewable fuels. Bioethanol is being given
significant attention on a global scale and is being considered as a long-term gasoline replacement
that helps reduce exhaust emissions. The piston ring and cylinder wall interface is generally the largest
contributor to engine friction and these regions of the engine also suffer the highest levels of fuel
dilution into the lubricant from unburned fuel, especially for bioethanol as it has a high heat of
vaporization, which enhances the tendency of the fuel to enter the oil sump. As bioethanol is being
blended with gasoline at increasingly higher concentrations and the accumulation of fuel in the
crankcase is significant, it is crucial to study the effect of various bioethanol blends on the degradation
of engine oil's properties and the friction and wear characteristics of engine oil. A fully synthetic oil
was homogenously mixed with five formulated fuels such as gasoline blend (E0), gasoline–10%
ethanol (E10), gasoline–20% ethanol (E20), gasoline–30% ethanol (E30), and gasoline–85% ethanol
(E85). These mixtures were then tested in a four-ball wear tester according to the ASTM D4172
standard test. Under selected operating conditions, the results show that the addition of a gasoline–
bioethanol blend decreases the oil viscosity, whereas the acid number increases because bioethanol is
more reactive compared to gasoline, which enhances oil degradation and oxidation. Fuel dilution
reduces the lubricating efficiency and the wear protection of the engine oil. All fuel-diluted oil samples
have higher friction and wear losses, compared to the fresh synthetic oil. E10 has slight effects on the
friction and wear behaviors of the engine oil. Thus, it still has a high potential to be widely used as
a transportation fuel for existing gasoline engines.
1. Introduction
Fossil fuels such as diesel and gasoline which are non-renewable energy resources, are being depleted day by day. Itis believed that these conventional fuels will become scarceduring next several decades.1,2 To reduce the concern over thisundesirable issue, researchers have been putting in much effortto reduce the use of fossil fuels by using alternative biofuels, inparticular biodiesel and bioethanol fuels, which are beingblended with diesel and gasoline at increasingly higherconcentrations. USA is now the leading producer of bioethanolin the world, whereby 18.3 billion liters of bioethanol wasproduced by the USA in 2006.3 Nowadays most vehicles arefuelled with 10–15% ethanol, and the so-called ‘biofuel’ engines
ulty of Engineering, University of Malaya,
[email protected]; [email protected].
47
ge of Engineering, King Saud University,
hemistry 2017
are typically designed to run on pure hydrated ethanol (93%ethanol, 7% water) or E85 blends which are made up of 85%ethanol and 15% gasoline. Interestingly, in Brazil, ex fuelvehicles (FFV) have been manufactured to use with any bio-ethanol–gasoline blends.4 This can enhance energy indepen-dence whilst combating fundamental issues such as fossildepletion, oil price escalation, carbon emission, and particulatemass concentrations in the vehicle exhaust.5,6 According to theNational Association of Automotive Vehicle Manufacturers,more than 85% of ex-fuel vehicles are manufactured in Brazil.7
Both Sweden and Belgium aim to increase the use of bioethanolas a transportation fuel.8,9 More importantly, ethanol hasbecome one of the alternative fuels of interest in Sweden eversince the 1990s. The annual use of ethanol was 65 000 m3 in2001. About 3% of the public service bus eet (more than 400buses) use ethanol as fuel, and about 4450 ex-fuel vehicles runon E85 blends.10
However, the bioethanol employment also poses someundesirable issues. Firstly, bioethanol is miscible with waterwhich can cause a corrosive effect on engine components
RSC Adv., 2017, 7, 15005–15019 | 15005
RSC Advances Paper
Ope
n A
cces
s A
rtic
le. P
ublis
hed
on 0
7 M
arch
201
7. D
ownl
oade
d on
12/
28/2
021
3:37
:54
PM.
Thi
s ar
ticle
is li
cens
ed u
nder
a C
reat
ive
Com
mon
s A
ttrib
utio
n-N
onC
omm
erci
al 3
.0 U
npor
ted
Lic
ence
.View Article Online
such as fuel injector and electric fuel pump.4,11 Moreover,bioethanol attracts more water from the environmentbecause it is hygroscopic in nature.12 Secondly, vehicle start-up problem can happen in cold weather when the engine isfuelled with pure ethanol which is hard to vaporize.13 Thirdly,when bioethanol is used to fuel the engine, the tribologicaleffect on lubricant properties and performance resultingfrom fuel dilution always appears. During the combustionprocess, some amount of unburned fuel will impinge on thecold wall of the combustion chamber and then be scrappedinto the crankcase of engine oil through cylinder liner.14 Itshall be notied that the impact of bioethanol on lubricatingoil's properties and performance is completely different fromthat of gasoline due to the fact that bioethanol has a highertendency to enter the oil sump of an engine due to its highheat of evaporation compared to gasoline.11 The amount ofbioethanol inside lubricant can degrade the properties andperformance of engine oil signicantly. As mentioned earlier,bioethanol is miscible with water but immiscible with oil, sothat there would be the formation of emulsions inside bio-ethanol–water–oil mixture, which leads to serious enginewear and catastrophic engine failure.15 As a consequence,engine oil needs to be drained on a frequent basis. It has beenobserved that even a small amount of fuel dilution is possibleto degrade the physicochemical properties of lubricant(viscosity, total base number, and total acid number) whichplay an important role in the lubricating system.16,17
In gasoline engines, various sliding components producemore friction between metal-to-metal contact surfaces,especially the piston assembly consisting of the piston ringand cylinder liner which contribute to engine friction toapproximately 40–60%.18 This friction, in turn, affects enginedurability as well as fuel consumption. Therefore, variousmethods are used to improve the performance of automotiveengines such as coatings,19 laser texturing,20–23 reducing theweight of components and modifying the composition ofautomotive lubricants.24 Thus engine oil having high lubricityis needed to reduce friction and wear in order to extendengine life. Synthetic oil is widely used as lubricating oil inmost vehicle engines due to its high thermal and oxidativestability, alkalinity, and viscosity index. It has a strong lmstrength which can help improve its frictions behavior in longoperation.25–27
1.1. Objective of this study
Although bioethanol has been widely used as an alternativefuel, it is deemed important to look at its effects on thetribological characteristics of engine oil. This current workaims to investigate the oil degradation, and lubricating effi-ciency (friction and wear losses) of fully-synthetic oil dilutedwith various bioethanol–gasoline blends. It is believed thatthis paper will provide useful insights of the current workpertaining to fuel dilution so that practitioners andresearchers can select the optimum gasoline–bioethanolblend which has a slight lubricating effect on the engine andengine oil.
15006 | RSC Adv., 2017, 7, 15005–15019
2. Literature review
The study of bioethanol dilution is limited and its effect onlubricating oil is not clearly established. However, there issome literature in this eld as described in Table 1. Mostly, ithas been observed that the use of ethanol with fossil fuel cancause a signicant effect on automotive lubricant's propertiessuch a drop in engine oil viscosity, and total base number(TBN), as well as an increase in total acid number (TAN), andan effect on oil performance such as an increase in friction,wear losses and deposit formation resulting from oxidationand corrosion of bioethanol.28 The addition of bioethanol togasoline enhances the tendency of the fuel to reach thecrankcase of engine oil due to its higher heat of vaporization,thus increasing the rate of fuel dilution.11,29 Signicantamounts of diluted ethanol fuel, in particular, E85 (between6% and 25%) have been found in the engine oil crankcase aereld tests12 and bench sequence tests.11,30 A study of fueldilution was done by T. Hu et al.31 They explained that turbo-charged gasoline direct-injection (TGDI) engine operated athigh torque had a signicant inuence on fuel dilution (gasoline)which was found to be up to 9%. This percentage causeda decrease in oil viscosity, an increase in fuel consumption andthe formation of carbon on the piston ring area. Tippayawongand Sooksarn32 investigated into the lubricating performance oflubricant diluted with ethanol and gasoline. They prepared fourcombinations of fuels and lubricants to be tested with motor-cycle engine: (1) gasoline and mineral oil, (2) gasoline andsynthetic oil, (3) 5% ethanol and mineral oil and (4) 5% ethanoland synthetic oil. The results indicated that viscosity of all oilsamples decreased with operating time. Aer 3000 km mileage,the viscosity changed about 20% and 45% for synthetic-basedand mineral-based oil, respectively. Mineral oil produced largerscar areas, compared to synthetic oil. For the same type of engineoil, the wear scar areas from the gasohol-run engine were about10% larger than those from the gasoline-run engine. It alsoexplains that lubricant properties changed with operating timebecause of additive depletion, oxidation, thermal degradation,reaction with sliding surface and engine blow-by contamination.Another experiment on friction and wear characteristics wasconducted by Ajayi et al.33 They diluted lubricant with threedifferent fuels: gasoline (E0), gasoline–10% ethanol (E10), gaso-line–16% isobutanol (i-B16) and used with a marine machinewhich was operated under start-and-stop and on-water condi-tions. It was shown that ethanol showed the least amount of fueldilution due to its high evaporation while i-B16 showed thehighest rate of fuel dilution. It is also notied that high enginespeed enhanced fuel dilution, leading to a signicant decrease inoil viscosity as well as producing more wear. However, frictionwas slightly reduced probably due to the drop in viscosity. Costaand Spikes17 investigated the effect of temperature on the lubri-cating performance of fully-formulated oil contaminated with5% of both anhydrous and hydrated ethanol fuels and a solutionof ZDDP antiwear additive. They found that this additiondestroyed the pre-formed antiwear tribolm and deteriorated therubbing surface.
This journal is © The Royal Society of Chemistry 2017

Table 1 Previous studies of lubricant diluted with fuel contaminant
Ref. Methods/material Conditions Results
32 Engine testing Mileage: 3000 km Viscosity falls up to 45%Bench wear tester, mineral oil,synthetic oil, gasoline/gasohol
Load: 33 N, speed: 500 rpm, Temp:25 �C
Gasohol engine has 10% higherwear, mineral oil: high wear,synthetic oil: wear increased,friction (unknown)
33 Engine testing Load: 15 N Approx. 3.7–6% fuel dilutionUnidirectional sliding,reciprocating sliding, four-ball weartest, gasoline, ethanol, isobutanol,SAE 10W-30
Velocity: 0.1–20.0 cm s�1, speed: 10–300 rpm, frequency: 0.1–5 Hz, four-ball load: 15 kg, speed: 1200 rpm,Temp: 70 �C, time: 1 h
E0: viscosity 30–43% decreased,E10: viscosity 25–42% decreased, i-B16: viscosity 28–46% decreased, allfuels have slight effect on friction,wear protection of the oil reducedwith fuel dilution
15 Plint TE77 Duration: 2 h Friction reduction when tested withShell Helix HX7, SAE 5W-30, nofriction modier, ethanol 95%purity, water
Liner T: 70–110 �C, test Temp: 25–40 �C, speed: 2000 rpm, load: 150 N(4 MPa), Stroke length: 5 mm, cold-start/short-journey
Separated phase of ethanol–water–oil mixture, viscosity decreased,implication: fuel economy in a redgasoline engine
34 Tribotest (ball on discs) Duration: 20 min No effect on friction signicantlyBall: AISI 52100, discs: AISI H13,engine oil: SAE 5W30, E22, (E100,7% water)
Test sample: 3 ml, Temp: 40 �C,load: 35 N, Stroke length: 5 mm,frequency: 10 Hz, Max. speed: 0.159m s�1
Aged oil showed FC value similar tothose obtained from base oil.Viscosity and TAN analysis showthat E22 is more oxidized and maycause oxidative wear
35 Ball on disk wear test Dilution rate: 5 wt% Tribolm thickness was reduced bythe addition of ethanol to both oils.Anhydrous ethanol caused morelm thickness reduction thanhydrated ethanol. Tribolm wasallowed to form during rubbingusing an ethanol-free oil. Hydrateddestroyed pre-formed antiweartribolm and rubbed surface
A sliding/rolling contact of ball anddisc, ball: AISI 52100 steel, disc: AISI52100 steel, fully formulated oilwith 0.08 wt% ZDDP, hydratedethanol & anhydrous ethanol
Speed: 3500 mm s�1, reduce 25steps down to 7 mm s�1, load: 31 N,Hertz contact pressure: 0.95 GPa,contact diameter: 250 mm, slide-to-roll ratio: 50%
36 Modied Plint TE77 Cold-start: dilution (5 wt% ethanol+ 8 wt% water)
Interaction between ethanol andwater contributes signicantly tofriction, independently. Ethanoldoes not signicantly impact onfriction reduction. Interaction(water & temperature) has a smallimpact on friction reduction
Taguchi method, engine oil: SAE5W30 Shell Helix HX7, ethanol: 95%purity, distilled water, real pistonring and cylinder liner
Temp: 25 �C; load: 100 N, time: 2 h;speed: 1500 rpm, warm-up: dilution(10 wt% ethanol + 16 wt% water),Temp: 40 �C; load: 150 N, time: 2 h;speed: 2000 rpm
37 Minitraction machine ball-on-disctest, base oil (additive), fullyformulated oil without additive,hydrated ethanol and anhydrousethanol
Dilution rate: 5 wt%, speed: 1000mm s�1, reduce 31 steps down to 1mm s�1, load: 20 N; Temp: 40 �C,70 �C, 100 �C, Hertz pressure: 0.82GPa
At low speed, the addition ofethanol produces a boundary lm,which was not present in the baseoils, but the addition of ethanol toformulated oil reduced lmthickness in all lubrication regimes,and ethanol reduces friction athigher speed
Paper RSC Advances
Ope
n A
cces
s A
rtic
le. P
ublis
hed
on 0
7 M
arch
201
7. D
ownl
oade
d on
12/
28/2
021
3:37
:54
PM.
Thi
s ar
ticle
is li
cens
ed u
nder
a C
reat
ive
Com
mon
s A
ttrib
utio
n-N
onC
omm
erci
al 3
.0 U
npor
ted
Lic
ence
.View Article Online
3. Methodology3.1. Material used
Fully-synthetic oil (SO, SAE 5W40) was purchased from themarket in Malaysia. This lubricant is mostly used under themost heavy-duty condition. Table 2 shows the properties of theengine oil. Gasoline and pure bioethanol which were alsocollected from Malaysian market were added to the fully-synthetic oil. The properties of gasoline and bioethanol areshown in Table 3.
This journal is © The Royal Society of Chemistry 2017
3.2. Test sample preparation
Formulated fuels such as gasoline (E0), gasoline–10% v/v bio-ethanol (E10), gasoline–20% v/v bioethanol (E20), gasoline–30%v/v bioethanol (E30), and gasoline–85% v/v bioethanol (E85)were blended at a xed volume of 100 ml using shakingmachine. The properties of each gasoline–bioethanol blendswere measured and shown in Table 4. Each fuel blend was thenadded to fully-synthetic oil at the dilution rate of 6% v/v in orderto prepare fuel–oil samples for the test (i.e. E10–SO ¼ 10% v/vbioethanol fuel + 90% v/v synthetic oil). 6% v/v concentrationis selected because the permissible dilution rate of fuel in
RSC Adv., 2017, 7, 15005–15019 | 15007
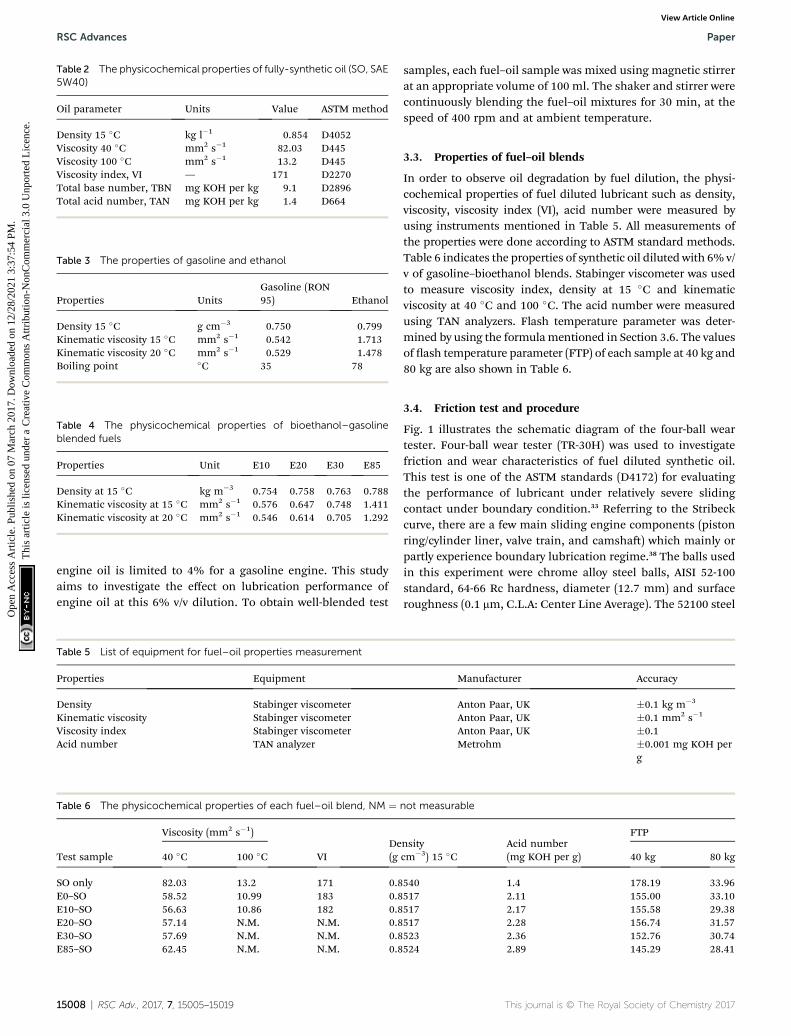
Table 4 The physicochemical properties of bioethanol–gasolineblended fuels
Properties Unit E10 E20 E30 E85
Density at 15 �C kg m�3 0.754 0.758 0.763 0.788Kinematic viscosity at 15 �C mm2 s�1 0.576 0.647 0.748 1.411Kinematic viscosity at 20 �C mm2 s�1 0.546 0.614 0.705 1.292
Table 3 The properties of gasoline and ethanol
Properties UnitsGasoline (RON95) Ethanol
Density 15 �C g cm�3 0.750 0.799Kinematic viscosity 15 �C mm2 s�1 0.542 1.713Kinematic viscosity 20 �C mm2 s�1 0.529 1.478Boiling point �C 35 78
Table 2 The physicochemical properties of fully-synthetic oil (SO, SAE5W40)
Oil parameter Units Value ASTM method
Density 15 �C kg l�1 0.854 D4052Viscosity 40 �C mm2 s�1 82.03 D445Viscosity 100 �C mm2 s�1 13.2 D445Viscosity index, VI — 171 D2270Total base number, TBN mg KOH per kg 9.1 D2896Total acid number, TAN mg KOH per kg 1.4 D664
RSC Advances Paper
Ope
n A
cces
s A
rtic
le. P
ublis
hed
on 0
7 M
arch
201
7. D
ownl
oade
d on
12/
28/2
021
3:37
:54
PM.
Thi
s ar
ticle
is li
cens
ed u
nder
a C
reat
ive
Com
mon
s A
ttrib
utio
n-N
onC
omm
erci
al 3
.0 U
npor
ted
Lic
ence
.View Article Online
engine oil is limited to 4% for a gasoline engine. This studyaims to investigate the effect on lubrication performance ofengine oil at this 6% v/v dilution. To obtain well-blended test
Table 5 List of equipment for fuel–oil properties measurement
Properties Equipment
Density Stabinger viscometerKinematic viscosity Stabinger viscometerViscosity index Stabinger viscometerAcid number TAN analyzer
Table 6 The physicochemical properties of each fuel–oil blend, NM ¼
Test sample
Viscosity (mm2 s�1)
VIDe(g40 �C 100 �C
SO only 82.03 13.2 171 0.8E0–SO 58.52 10.99 183 0.8E10–SO 56.63 10.86 182 0.8E20–SO 57.14 N.M. N.M. 0.8E30–SO 57.69 N.M. N.M. 0.8E85–SO 62.45 N.M. N.M. 0.8
15008 | RSC Adv., 2017, 7, 15005–15019
samples, each fuel–oil sample was mixed using magnetic stirrerat an appropriate volume of 100 ml. The shaker and stirrer werecontinuously blending the fuel–oil mixtures for 30 min, at thespeed of 400 rpm and at ambient temperature.
3.3. Properties of fuel–oil blends
In order to observe oil degradation by fuel dilution, the physi-cochemical properties of fuel diluted lubricant such as density,viscosity, viscosity index (VI), acid number were measured byusing instruments mentioned in Table 5. All measurements ofthe properties were done according to ASTM standard methods.Table 6 indicates the properties of synthetic oil diluted with 6% v/v of gasoline–bioethanol blends. Stabinger viscometer was usedto measure viscosity index, density at 15 �C and kinematicviscosity at 40 �C and 100 �C. The acid number were measuredusing TAN analyzers. Flash temperature parameter was deter-mined by using the formulamentioned in Section 3.6. The valuesof ash temperature parameter (FTP) of each sample at 40 kg and80 kg are also shown in Table 6.
3.4. Friction test and procedure
Fig. 1 illustrates the schematic diagram of the four-ball weartester. Four-ball wear tester (TR-30H) was used to investigatefriction and wear characteristics of fuel diluted synthetic oil.This test is one of the ASTM standards (D4172) for evaluatingthe performance of lubricant under relatively severe slidingcontact under boundary condition.33 Referring to the Stribeckcurve, there are a few main sliding engine components (pistonring/cylinder liner, valve train, and camsha) which mainly orpartly experience boundary lubrication regime.38 The balls usedin this experiment were chrome alloy steel balls, AISI 52-100standard, 64-66 Rc hardness, diameter (12.7 mm) and surfaceroughness (0.1 mm, C.L.A: Center Line Average). The 52100 steel
Manufacturer Accuracy
Anton Paar, UK �0.1 kg m�3
Anton Paar, UK �0.1 mm2 s�1
Anton Paar, UK �0.1Metrohm �0.001 mg KOH per
g
not measurable
nsitycm�3) 15 �C
Acid number(mg KOH per g)
FTP
40 kg 80 kg
540 1.4 178.19 33.96517 2.11 155.00 33.10517 2.17 155.58 29.38517 2.28 156.74 31.57523 2.36 152.76 30.74524 2.89 145.29 28.41
This journal is © The Royal Society of Chemistry 2017

Fig. 1 The schematic diagram of the four-ball wear machine [1:stationary balls, 2: steel cup, 3: heating zone, 4: rotating arm, 5:thermocouple, 6: torque arm].
Paper RSC Advances
Ope
n A
cces
s A
rtic
le. P
ublis
hed
on 0
7 M
arch
201
7. D
ownl
oade
d on
12/
28/2
021
3:37
:54
PM.
Thi
s ar
ticle
is li
cens
ed u
nder
a C
reat
ive
Com
mon
s A
ttrib
utio
n-N
onC
omm
erci
al 3
.0 U
npor
ted
Lic
ence
.View Article Online
is a common material used for internal combustion engine(ICE) piston rings. To set up each test, the test balls werecleaned by using toluene and wiped by using a neat tissue tomake them completely dry. Three test balls were placed into theoil cup and a fuel–oil sample was poured into the cup until itfully covered the balls. In this four-ball test, three balls in the oilcup were kept stationary and another ball was rotating incontact with these stationary balls. Four-ball machine wasperformed under conditions (time: 60 min, temperature: 75 �C,load: 40 kg and 80 kg, and rotational speed: 1200 rpm). Thereason for choosing these conditions is due to the fact that theparameters closely response to speed, load, and temperature ofthe piston-ring assembly conditions.39,40 The normal tempera-ture of engine oil during warm-up and short-journey drivingcondition is 40–80 �C. Therefore, to prevent frictional heatingand to reduce the evaporation of bioethanol which boils offquickly at the temperature above the boiling point (78 �C), thetest was performed at 75 �C. Aer completing the test, frictionaldata, and the stationary balls were collected for friction coeffi-cient and wear scar diameter (WSD) evaluations, respectively.Aer collecting all the data, the test was started over again usingthe same procedure.
3.5. Friction and wear evaluations
The friction coefficient (FC) can be evaluated from frictionaltorque and spring constant.41 In four-ball wear test, the lowerballs create the maximum torque which is determined by a loadcell. The eqn (1) is used to calculate the friction coefficient:
Friction coefficient ðmÞ ¼ frictional torque ðkg�mmÞ � ffiffiffi6
p
3� applied load ðkgÞ � distance ðmmÞ
¼ T � ffiffiffi6
p
3�W � r
(1)
where, T, W, and r can be expressed as friction torque (kg �mm), applied load (kg) and distance (mm), respectively. The
This journal is © The Royal Society of Chemistry 2017
distance (r) measured from the center of the lower ball contactsurface to the rotating axis is 3.67 mm.
According to the ASTM D4172 method, wear scar diameter(WSD) produced on the three tested balls was measured byoptical microscope model C2000 (IKA, UK) with �0.01 mmaccuracy. To obtain a clear wear scar image, the magnifying lenswas adjusted to a better position on the wear scar surface of theball. Aer measuring the wear scar diameter of those threeballs, the arithmetic average result was calculated betweenthem.
3.6. Flash temperature parameter (FTP) calculation
Flash temperature parameter (FTP) is a number used to expressthe critical temperature above which an engine oil will failunder selected conditions.42 The lubricating oil has failed at thecritical ash temperature. The FTP also refers to the possibilityof lubricant breakdown.43 The higher the FTP indicates the lesspossibility of lubricant lm to breakdown. This ash tempera-ture can be measured by the thermocouple and expressed bya solitary number of FTP. The discussion of FTP numberprediction model was discussed in ref. 44. For conditionsexisting in four-ball machine, the FTP was calculated using thefollowing relationship:45
FTP ¼ applied load
ðwear scar diameterÞ1:4 ¼W
d1:4(2)
where, W expresses applied load (kg), d expresses wear scardiameter (mm), FTP is the maximum value of the ratio W/d1.4
obtained from various run. It shall be notied that the FTP(kg mm�1.4) relationship is expressed as a number (maximumvalue) in most previous studies42,46 and therefore, the FTP(kg mm�1.4) is also considered as unit less in this study.
3.7. Surface analysis
The wear morphology of the tested ball was analyzed accordinglyusing a scanning electron microscope (SEM) which is the mostknown instrument for the surface analytical techniques. High-resolution images of surface topography, with excellent depthof eld, were taken using a highly-focused, scanning (primary)electron beam. Three areas of wear scar surfaces were capturedand discussed respectively to prove friction andwear behaviors ofeach fuel diluted synthetic oil.
3.8. Error analysis
Error analysis was calculated to determine the level of accuracyand uncertainty of the collected data due to the fact that, duringthe experiment, there might be errors arising from instrumentselection, testing condition, environmental condition, obser-vation, calibration and reading and collecting data.47 The testwas repeated three times, and the collected data was averagedand performed through graph plotting and precisionmeasuring. The accuracy for WSD and FC are �0.01 mm and�0.05, respectively. The acceptable uncertainty is less than orequal to 5%. Appendix (A) shows the statistical and error anal-yses associated with eachmeasurement and Appendix (B) showsthe summary of relative uncertainty and accuracy of this
RSC Adv., 2017, 7, 15005–15019 | 15009

RSC Advances Paper
Ope
n A
cces
s A
rtic
le. P
ublis
hed
on 0
7 M
arch
201
7. D
ownl
oade
d on
12/
28/2
021
3:37
:54
PM.
Thi
s ar
ticle
is li
cens
ed u
nder
a C
reat
ive
Com
mon
s A
ttrib
utio
n-N
onC
omm
erci
al 3
.0 U
npor
ted
Lic
ence
.View Article Online
experiment. The overall uncertainty of this study was calculatedby using eqn (3).
Overall uncertainty ¼ square root ofhðuncertainty of FCÞ2
þðuncertainty of WSDÞ2i
OU ¼ffiffiffiffiffiffiffiffiffiffiffiffiffiffiffiffiffiffiffiffiffiffiffiffiffiffiffiffiffiffiffiffiffiffiffiffiffiffiffiffiffiffiffiffiffiffiffiffiffiffiffiffiffiffiffiffiffiffiffiffiffiffiffiffiffiffiffiffiffiffiffiffiffiffiffiffiffiffiffiffiffiffiffiffiffiffiffiffiffiffiffiffiffiffiffiffiffiffiffiUFCL40
2 þUFCL802 þUWSDL40
2 þUWSDL802
q
¼ffiffiffiffiffiffiffiffiffiffiffiffiffiffiffiffiffiffiffiffiffiffiffiffiffiffiffiffiffiffiffiffiffiffiffiffiffiffiffiffiffiffiffiffiffiffiffiffiffiffiffiffiffiffiffiffiffiffiffiffiffiffiffiffiffiffiffiffiffiffiffi2:5012 þ 1:7732 þ 2:5562 þ 2:65692
p¼ 4:80%
(3)
where OU ¼ overall uncertainty; UFC ¼ uncertainty of FC;UWSD ¼ uncertainty of WSD.
4. Result and discussion4.1. Viscosity
Viscosity is an essential property of automotive engine oil,which should be high enough to resist the internal ow and lowenough to prevent substantial energy losses.48 Viscosity is highwhen used oil has been deteriorated by oxidation or by solidcontaminants while it is low when used oil is diluted with lowerviscosity oil or by fuel. Change in the engine oil viscosity asa result of fuel dilution is undesirable in the lubrication systemof an engine as it inuences the lubricating efficiency and oillm thickness. Inadequate oil viscosity affects lubricating lmand load bearing capacity leading to excessive wear of bearings,journals and other moving components, low oil pressure andpoor oil economy.49
Fig. 2 shows the degradation of the viscosity of synthetic oil(SO) diluted with different types of fuel blends, measured at40 �C. It is investigated that the viscosity decreased signicantlywhen synthetic oil was diluted with bioethanol blends. This isdue to the lower viscosity of the diluted fuels. The variations inthe viscosity of each diluted oil sample were almost identical.Synthetic oil diluted with E85 fuel had slightly higher viscositycompared to other fuel diluted oil samples. The viscosity ofE85–SO was dropped to 62.45mm2 s�1 from the base oil value of82.03 mm2 s�1. E85–SO sample also contains a large amount ofethanol, which may cause more interference with the formation
Fig. 2 Variation of viscosity of synthetic oil diluted with bioethanol blen
15010 | RSC Adv., 2017, 7, 15005–15019
of the boundary layer as well as corrosive wear, leading toa thinner boundary lm (low lubricating performance) and alsoto higher friction, compared to fresh oil because the decrease inviscosity may also cause more contact between the asperities ofthe surface.37 However, during full hydrodynamic lubrication,the reduction in viscosity may contribute to a decrease in fric-tion due to the fact that low viscosity plays a very important rolein reducing friction in this full lm lubrication regime. Thedrop in viscosity indicates that the amount of fuel deterioratedthe lubricating efficiency of the oil. E0–SO had the viscosity of58.52 mm2 s�1 which was slightly higher than the viscosities ofE10–SO, E20–SO, and E30–SO. This indicates that oil contami-nated with gasoline which is the hydrocarbon compound haslower lubricity and undergo more severe degradation comparedto the oil contaminated with a small amount of bioethanol. InTable 6, it can be seen that some viscosities of the oil samplescould not be determined at 100 �C. This was due to the evapo-ration of bioethanol at high temperature. It can be stated thatfuel dilution has a signicant effect on the oil viscosity. It canresult in two opposing effects: one benecial effect and onedetrimental effect. A decrease in viscosity is expected to lowerthe viscous losses of the lubricating oil, which reduce the overallengine friction and increase the efficiency of the engine.However, in boundary lubrication, the difference in viscosityhas no signicant effect on friction. The reduction in lubri-cating oil viscosity is also known to reduce engine oil lmthickness. As a result, it will push the contact surface more intothe boundary lubrication regime.33 This will result in highfriction and wear aer a long period of four-ball testing.
4.2. Acid number
The acid number is the quantity of the higher organic acid oracid-like derivatives in the lubricant and is the indicator of oilserviceability and higher susceptibility of the contact surface tocorrosion.50 At higher temperature, fuel molecules and otherorganic acids inside lubricant are decomposed during opera-tion and hence, increase the acidity. The acid number resultsare shown in Table 6. Since bioethanol is highly evaporative athigh temperature, the change in the acid number of each fuel–
ds measured at 40 �C.
This journal is © The Royal Society of Chemistry 2017

Paper RSC Advances
Ope
n A
cces
s A
rtic
le. P
ublis
hed
on 0
7 M
arch
201
7. D
ownl
oade
d on
12/
28/2
021
3:37
:54
PM.
Thi
s ar
ticle
is li
cens
ed u
nder
a C
reat
ive
Com
mon
s A
ttrib
utio
n-N
onC
omm
erci
al 3
.0 U
npor
ted
Lic
ence
.View Article Online
oil sample was determined before conducting four-ball weartests. Generally, the acid value of the new oil is not necessarilynil since oil additives can be acidic in nature. An increase inacid number indicates that lubricant is contaminated withbioethanol and when acid number increase, it makes the metalsurface more susceptible to corrosion.4,50 It can be seen thatsynthetic oil samples diluted with 6% of bioethanol–gasolinefuels show higher acid number, compared to fresh SO. This, inturn, may provoke undesirable corrosive wear on enginecomponents.16,51 Bioethanol is more chemically reactive thangasoline due to the presence of oxygen. This possibly interactswith lubricant base uid and dissolved additives such asdetergent and dispersants containing in the commercial engineoil, thus leading to oil degradation. The degradation of ethanolin the lubricant creates ethanoic (acetic) acid, which attacks sometals and increases oxidation of the oil.52 As a consequence, itis possible that 6% dilution rate may cause serious effects suchas oxidation and corrosion of engine oil, especially for syntheticoil diluted with fuel containing 85% v/v of bioethanol (E85–SO).Lubricant diluted with bioethanol–gasoline mixtures becomesdegraded and produces higher wear compared to fresh engineoil.
4.3. Flash temperature parameter (FTP)
As mention in Section 3.6, ash temperature parameter (FTP) isa single number that is used to express the critical ashtemperature at which an engine oil will fail under selectedconditions. The FTP also refers to the possibility of lubricantbreakdown.43 Generally, a greater FTP number indicates a betterlubricating efficiency of the lubricant while a smaller FTPnumber indicates the reduction in lubricating lm thickness.41
As seen in eqn (2), load and wear scar diameter (WSD) predictFTP number. Fig. 3 illustrates the variations of the FTP of freshsynthetic oil and diluted synthetic oils tested at both condi-tions. At the load of 40 kg, it can be seen that fresh synthetic oil(SO) had the highest FTP (178.19) indicating that fresh SO
Fig. 3 Flash temperature parameter of diluted synthetic oil at different l
This journal is © The Royal Society of Chemistry 2017
provided better lubricating performance and had less possi-bility of lubricating lm breakdown, while all fuel dilutedsynthetic oils showed lower FTP numbers. The FTP values ofE0–SO, E10–SO, E20–SO, E30–SO, and E85–SO were 155, 155.60,156.74, 152.76 and 145.29 which meant that their lubricatingperformance is worse compared non-diluted oil. The least FTPwas found in E85–SO which contained a higher amount ofbioethanol inside the synthetic oil while E10–SO showed lowerFTP value compared to other fuel diluted synthetic oils. The FTPnumber dropped signicantly when the load was increased to80 kg, which can be explained that at higher load and temper-ature the degradation of tested lubricating oil may occur andthus push the rubbing surface close to each other, whicheventually increase the friction.53 The FTP values of lubricatingoils were slightly different. SO, E0–SO, E10–SO, E20–SO, E30–SO, and E85–SO had FTP values of 34, 33.10, 29.38, 31.57, 30.74and 28.41, respectively. The fresh synthetic oil still had higherFTP compared to the fuel diluted oils which can be explainedthat it may have better lubricating performance during highload, compared to fuel–oil mixtures. However, fuel contaminantparticularly bioethanol inside synthetic oil deteriorated lubri-cating properties and may cause lubricating lm breakdown athigh load.
4.4. Effect of bioethanol fuels on friction
Fig. 4 describes the variation of FC of synthetic oil (SO)contaminated with bioethanol blended fuels at the load of 40kg. There were slight differences of FC between synthetic oil andbioethanol diluted synthetic oil samples. It was due to theevaporation of bioethanol at high temperature or their slightdifferences in viscosity which caused almost identical frictionbehaviors. The average FC values of fresh oil and fuel-dilutedoils tested at 40 kg and 80 kg are shown in Fig. 5. At 40 kg,the friction coefficients yielded by diluted synthetic oils wereslightly higher than that yielded by the fresh synthetic oil. Basedon the data averaged from the three tests, it is shown that E0–
oads.
RSC Adv., 2017, 7, 15005–15019 | 15011

Fig. 5 Average friction coefficient of each fuel diluted synthetic oil sample.
Fig. 4 Friction coefficient of synthetic oil contaminated with different blended fuels at 6% dilution at 75 �C and L40 kg.
RSC Advances Paper
Ope
n A
cces
s A
rtic
le. P
ublis
hed
on 0
7 M
arch
201
7. D
ownl
oade
d on
12/
28/2
021
3:37
:54
PM.
Thi
s ar
ticle
is li
cens
ed u
nder
a C
reat
ive
Com
mon
s A
ttrib
utio
n-N
onC
omm
erci
al 3
.0 U
npor
ted
Lic
ence
.View Article Online
SO, E10–SO, E20–SO, E30–SO, and E85–SO had FC values of0.111, 0.108, 0.106, 0.109 and 0.112, respectively. It can be seenthat the average FC of SO was not the lowest value (0.108) whileE20–SO had the lowest FC value (0.106). However, synthetic oilhad the lowest frictional behavior as shown in Fig. 4. At rst30 min, SO performed higher friction compared to E10–SO,E20–SO, and E30–SO while its friction decreased to theminimum value during the remaining time. It might be due tothe fact that oil additive has been activated to create lubricatinglm aer half an hour. All fuel diluted oils had increasing orstable frictional characteristics, compared to fresh synthetic oil.It is observed that all bioethanol diluted oils yielded lowerfriction at rst 30 min, which was probably because of thepresence of oxygen and polarity of bioethanol that couldenhance the lubricity of the oils.54 Moreover, there might bea stronger physical adsorption on surfaces of the rotating ballswhich reduce interference between asperities and increase
15012 | RSC Adv., 2017, 7, 15005–15019
contact resistance, thus stabilizing the friction behavior in thelubricant wear test.55 However, the synthetic oil contains baseuid and oil additive concentrations which possibly react withbioethanol under the presence of oxygen, causing oil degrada-tion and oxidation, thus increasing friction.4 The more fueldilutes into the lubricant, the more interactive effects onlubricant additive occurs aer a particular operating time; asa result, no lubricating lmmay generate. E85–SO yielded lowerfriction compared to SO, but aer 15 min it yielded the highestfriction value due to the higher amount of bioethanol. It shall benotied that gasoline would result in higher friction comparedto intermediate-level bioethanol fuels because gasoline (themixture of hydrocarbon) has less lubricity than a polar moleculesuch as bioethanol.54 The variation of FC of diluted syntheticoils tested under the load of 80 kg is shown in Fig. 6. At this highload, it can be seen that all fuel diluted synthetic oils showedhigher FC, compared to fresh synthetic oil. The average FC
This journal is © The Royal Society of Chemistry 2017
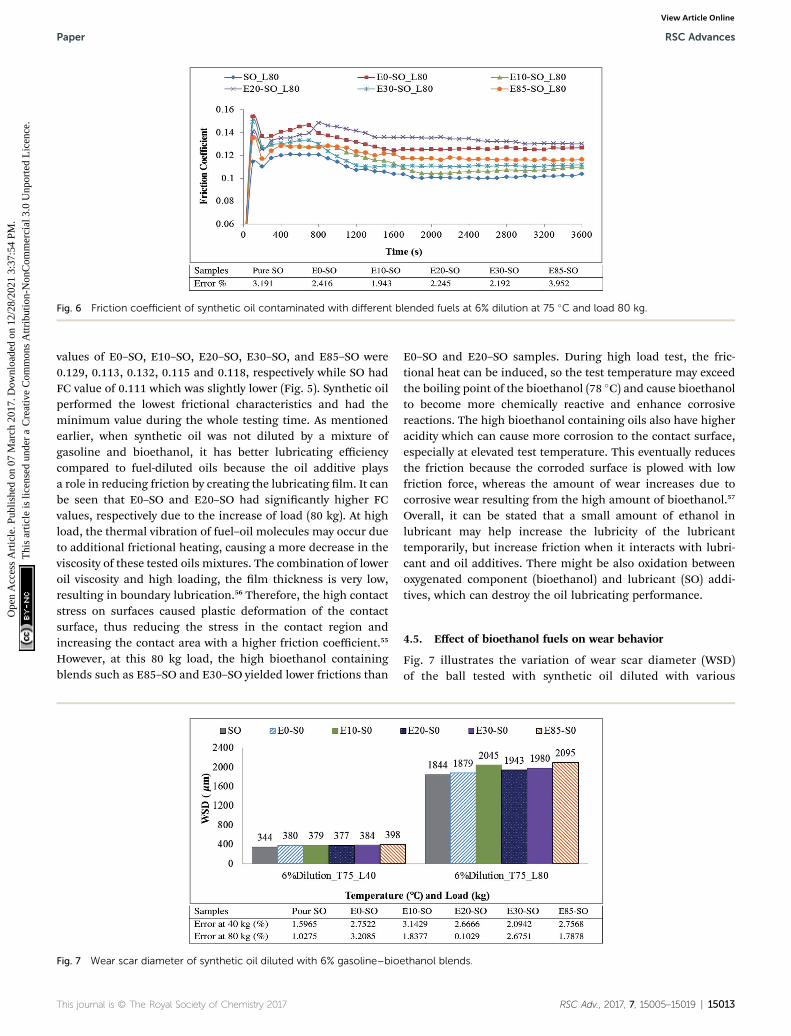
Fig. 6 Friction coefficient of synthetic oil contaminated with different blended fuels at 6% dilution at 75 �C and load 80 kg.
Paper RSC Advances
Ope
n A
cces
s A
rtic
le. P
ublis
hed
on 0
7 M
arch
201
7. D
ownl
oade
d on
12/
28/2
021
3:37
:54
PM.
Thi
s ar
ticle
is li
cens
ed u
nder
a C
reat
ive
Com
mon
s A
ttrib
utio
n-N
onC
omm
erci
al 3
.0 U
npor
ted
Lic
ence
.View Article Online
values of E0–SO, E10–SO, E20–SO, E30–SO, and E85–SO were0.129, 0.113, 0.132, 0.115 and 0.118, respectively while SO hadFC value of 0.111 which was slightly lower (Fig. 5). Synthetic oilperformed the lowest frictional characteristics and had theminimum value during the whole testing time. As mentionedearlier, when synthetic oil was not diluted by a mixture ofgasoline and bioethanol, it has better lubricating efficiencycompared to fuel-diluted oils because the oil additive playsa role in reducing friction by creating the lubricating lm. It canbe seen that E0–SO and E20–SO had signicantly higher FCvalues, respectively due to the increase of load (80 kg). At highload, the thermal vibration of fuel–oil molecules may occur dueto additional frictional heating, causing a more decrease in theviscosity of these tested oils mixtures. The combination of loweroil viscosity and high loading, the lm thickness is very low,resulting in boundary lubrication.56 Therefore, the high contactstress on surfaces caused plastic deformation of the contactsurface, thus reducing the stress in the contact region andincreasing the contact area with a higher friction coefficient.55
However, at this 80 kg load, the high bioethanol containingblends such as E85–SO and E30–SO yielded lower frictions than
Fig. 7 Wear scar diameter of synthetic oil diluted with 6% gasoline–bio
This journal is © The Royal Society of Chemistry 2017
E0–SO and E20–SO samples. During high load test, the fric-tional heat can be induced, so the test temperature may exceedthe boiling point of the bioethanol (78 �C) and cause bioethanolto become more chemically reactive and enhance corrosivereactions. The high bioethanol containing oils also have higheracidity which can cause more corrosion to the contact surface,especially at elevated test temperature. This eventually reducesthe friction because the corroded surface is plowed with lowfriction force, whereas the amount of wear increases due tocorrosive wear resulting from the high amount of bioethanol.57
Overall, it can be stated that a small amount of ethanol inlubricant may help increase the lubricity of the lubricanttemporarily, but increase friction when it interacts with lubri-cant and oil additives. There might be also oxidation betweenoxygenated component (bioethanol) and lubricant (SO) addi-tives, which can destroy the oil lubricating performance.
4.5. Effect of bioethanol fuels on wear behavior
Fig. 7 illustrates the variation of wear scar diameter (WSD)of the ball tested with synthetic oil diluted with various
ethanol blends.
RSC Adv., 2017, 7, 15005–15019 | 15013

RSC Advances Paper
Ope
n A
cces
s A
rtic
le. P
ublis
hed
on 0
7 M
arch
201
7. D
ownl
oade
d on
12/
28/2
021
3:37
:54
PM.
Thi
s ar
ticle
is li
cens
ed u
nder
a C
reat
ive
Com
mon
s A
ttrib
utio
n-N
onC
omm
erci
al 3
.0 U
npor
ted
Lic
ence
.View Article Online
gasoline–bioethanol fuels at 40 kg and 80 kg. Althoughgasoline–bioethanol fuel dilution has a little effect on fric-tional behavior, it is observed that the WSD seems to increasesignicantly with an increase in bioethanol amount insideengine oil. The WSD of the three stationary balls weremeasured and averaged for graph plotting. Generally, whenthe scar is large, it indicates a severe deterioration of materialon the contact surfaces. At 40 kg load, it can be seen that allfuel diluted synthetic oils had higher wear scar diameter,compared to their fresh oil (SO). The WSD of E0–SO, E10–SO,E20–SO, E30–SO, and E85–SO were 0.380 mm, 0.379 mm, 0.377mm, 0.384 mm and 0.398 mm, respectively while synthetic oilyielded WSD of 0.344 mm. The increase in the values of WSDfor fuel diluted oils is due to the fact that fuel dilution reduceswear performance of the engine oil. The amount of bioethanolfuel dilution degrades the engine oil and reduce the perfor-mance of the oil, especially in the case when SO is contami-nated with higher percentages of gasoline–bioethanolmixtures. The addition of bioethanol is known to reduce thelm thickness of the lubricating oil.37 Fresh synthetic oil whichwas not contaminated with fuel mixture had a better lubri-cating performance due to its oil additive concentration whichcan generate the lubricating lm. However, in the case of fueldilution of engine oil, it affects lubricating properties (weak-ening the lubricant detergency, forming acid and corrosion,and reducing of the oil lm causing metal asperities to contacteach other promoting engine wear), thus increasing in frictionand wear losses. Moreover, fuel dilution reduces oil viscosity,and the concentration of engine oil additives, potentiallycompromising lubricant's performance.58 Inadequate oilviscosity affects oil lm formation and load-bearing capacity.This can potentially lead to excessive wear of bearing, journalsand other moving components.58 The effect of load on wearscar is very signicant. The large amount of WSD could causemore wear. At 80 kg load, the contact area is very big; asa result, the WSD of each test lubricant is extremely large,compared to the ball tested at 40 kg. All fuel diluted oilsamples namely E0–SO, E10–SO, E20–SO, E30–SO and E85–SOhad WSD of 1.879 mm, 2.045 mm, 1.943 mm, 1.980 mm and2.095 mm respectively while the WSD of SO was 1.844 mm.Upon increasing of operation time, the oil additive will bedepleted gradually and bioethanol may react with base oiland lubricant additive under the presence of oxygen, andcauses oil oxidation of some of the lubricant constituents andsubsequent formation of carboxylic acid and eventuallydestroys lubricating performance.59 E0–SO, E20–SO, E30–SO,and E85–SO had higher WSD, respectively with an increase inthe amount of ethanol. These fuel-diluted oil samples alsocaused additional corrosive wear due to their higher acidity,compared to fresh synthetic oil. These samples are morechemically reactive and yield corrosive wear when there iselevated test temperature from frictional heat at this higherload (80 kg).57 E10–SO had higher WSD compared to other oilsexcept this E85–SO while still remaining low friction. Theincrease in WSD of this oil was probably due to the interac-tion between asperities and contact surface which increasethe contact area, thus increasing the amount of wear. It might
15014 | RSC Adv., 2017, 7, 15005–15019
be also due to the chemical attack on the surface of the ball bybioethanol presented in this oil.55 It shall be notied that theless effect on WSD is due to a large evaporated amount ofbioethanol from the lubricant. It is believed that the WSD willbe more severe when 6% of bioethanol fuel diluted into theoil sump in the vehicle engine where fuel is always dilutedduring engine operation, suggesting that ethanol-resistantengine oil should be produced in order to avoid seriouswear from bioethanol, which can lead to engine catastrophicfailure.
4.6. SEM analysis of worn surfaces
Fig. 8 shows the worn surface morphologies of stationaryballs tested in SO, E0–SO, E10–SO, E20–SO, E30–SO and E85–SO at 40 kg. For fresh synthetic oil, the ball surface indicatedmild abrasive wear. The micro grooves along the slidingdirection were presented on the worn surface (Fig. 8a). Itshall be notied that the adhesive wear is indicated on theworn surface when it is greater than 20 mm.60 In Fig. 8b–f,more severe surface deteriorations were found on the ballstested with lubricant diluted with gasoline–bioethanolmixtures. The balls tested with gasoline oil (E0–SO) showedmoderate wear mechanism including abrasive wear as shownin Fig. 8b. The grooves along the surface were slightly bigger,compared to the fresh SO. The ball surface of bioethanol oilslooked smoother, compared to that of gasoline oil becausebioethanol is a polar molecule which has a better lubricitycompared to gasoline (the mixture of hydrocarbon). However,the worn surface of the balls tested with bioethanol-dilutedsynthetic oils indicated more surface deterioration fromabrasive wear and chemical wears (Fig. 8c–f). E10–SO showsfracture and delamination on the surface. E20–SO and E30–SO indicate light abrasive wear as small grooves and pits canbe observed on the surfaces. The surface of E85–SO showssmoother surface and almost no groove indicated. This maybe due to higher acid in this oil which corrodes the surfaceand the corroded surface is eventually plowed away by itscounterpart. These fuel-diluted oils seem to undergo chem-ical reaction between lubricant (base uid and oil additives),and bioethanol which may cause chemical wears such asoxidative and corrosive wear, thus increasing wear losses.Oxidative wear occurs due to the higher oxygen content ofbioethanol inside the oil, which enhances the oxidation offuel–oil mixture (Fig. 8c–f). This wear caused materialremoval by oxidative chemical reaction of the metal surface.Corrosive wear is the gradual deterioration of unprotectedmetal surfaces, caused by atmosphere and acid, and thencreates pits and small cracks. This corrosive wear may alsodissolve metal parts and cause plowing on the surfaces. Itcan also be seen that there were presences of the corrosiveproduct of black colors due to the fact that oxidizationand corrosion occurred and corrosive acids enhancedcorrosive wear.61,62 Moreover, during the test at elevatedtemperature, the oxidation of fuel–oil mixture may generateperoxide in the present of oxygen, and this peroxide willundergo further reaction to form carboxylic acid, ketones,
This journal is © The Royal Society of Chemistry 2017

Fig. 8 Worn surface of steel balls tested with fresh and diluted synthetic oils (test condition: load ¼ 40 kg; speed ¼ 1200 rpm; duration ¼ 1 h;temperature ¼ 75 �C).
Paper RSC Advances
Ope
n A
cces
s A
rtic
le. P
ublis
hed
on 0
7 M
arch
201
7. D
ownl
oade
d on
12/
28/2
021
3:37
:54
PM.
Thi
s ar
ticle
is li
cens
ed u
nder
a C
reat
ive
Com
mon
s A
ttrib
utio
n-N
onC
omm
erci
al 3
.0 U
npor
ted
Lic
ence
.View Article Online
aldehydes, and alcohols; as a result, it may increase theacidity of the lubricant63,64 (Fig. 8d–f). From this SEM, it canbe deduced that bioethanol blend inside synthetic oil
This journal is © The Royal Society of Chemistry 2017
resulting from fuel dilution is possible to degrade lubricatingperformance and also affect the friction and wear behaviorsof lubricant.
RSC Adv., 2017, 7, 15005–15019 | 15015

RSC Advances Paper
Ope
n A
cces
s A
rtic
le. P
ublis
hed
on 0
7 M
arch
201
7. D
ownl
oade
d on
12/
28/2
021
3:37
:54
PM.
Thi
s ar
ticle
is li
cens
ed u
nder
a C
reat
ive
Com
mon
s A
ttrib
utio
n-N
onC
omm
erci
al 3
.0 U
npor
ted
Lic
ence
.View Article Online
5. Conclusion
This experimental study was conducted to assess the impactof bioethanol–gasoline blends, on the tribological perfor-mance of engine oil under selected conditions using four-ballwear tester. The results of the degradation of properties,friction, and wear losses of the contaminated engine oil havebeen thoroughly discussed. The conclusions can be drawn asthe followings:
� The 6% addition of all bioethanol–gasoline blends tofully-synthetic oil signicantly decreased the viscosity of thefresh oil to about 30%, compared to fresh synthetic oil. Thedecrease in viscosity from ethanol dilution may result in thethinner boundary lm and higher wear because viscosityreduction causes more contact between asperities of thesurface.
� Bioethanol–gasoline diluted oils show slightly higher theacid number, compared to fresh synthetic oil. The engine oilneeds to be more alkaline to prevent the metal surface fromcorrosion. However, bioethanol is more chemically reactivecompared to gasoline, which enhances the degradation of thefuel–oil mixture. Therefore, the fuel diluted lubricants containmore acidity making the surface more susceptible to corrosion,thus increasing wear losses.
� The addition of ethanol–gasoline fuels to synthetic oilshows that there is no clear trend or conclusive indication ofeach fuel–oil mixture is worse for friction at both loads, butduring the test, it was shown that the ethanol rapidly and fullyevaporated from the lubricant at the temperature of 75 �C. This
Table 8 Uncertainty analysis for FTP at 80 kg
Samples FTP 1 FTP 2 FTP 3 Min.
Pure SO 33.36 34.33 34.22 33.36E0–SO 31.86 34.86 32.62 31.86E10–SO 29.22 28.73 30.25 28.73E20–SO 31.54 31.63 31.54 31.54E30–SO 30.00 30.00 32.33 30.00E85–SO 28.50 27.67 29.09 27.67Uncertainty level
Table 7 Uncertainty analysis for FTP at 40 kg
Samples FTP 1 FTP 2 FTP 3 Min. M
Pure SO 180.39 181.88 173.93 173.93 1E0–SO 156.74 160.30 148.41 148.41 1E10–SO 162.75 155.01 148.94 148.94 1E20–SO 155.01 164.00 152.20 152.20 1E30–SO 149.48 162.75 151.65 149.48 1E85–SO 148.41 139.37 145.29 139.37 1Uncertainty level
15016 | RSC Adv., 2017, 7, 15005–15019
minimal effect on the friction behavior is also due to the factthat the tests were conducted under boundary lubricationregime.
� Although bioethanol fuels have slight impact on thefrictional characteristic of the oil, it has signicant differ-ences in the amount of wear. At both 40 kg and 80 kg loads,fuel–oil mixtures increase wear losses more or less with theincreased amount of bioethanol, compared to their fresh oil.E30–SO and E85–SO have higher wear losses but low frictionbecause acid corrodes the surface and causes additionalcorrosive wear. From the SEM of the worn surface of testedball, it can be seen that the worn surface of the fuel–oilsamples has more surface deterioration than fresh oil.Additional damage and chemical wears (oxidative wear andcorrosive wear) can be investigated on the surface of the balltested with these oils.
Overall, it can be concluded that 6% of bioethanol fueldilution can degrade properties performance (viscosityand alkalinity) and tribological behaviors of the syntheticoil. Ethanol fuel dilution may reduce friction, comparedto pure gasoline due to its polarity and acidity. However,high acid in the oil causes high wear due to its corrosion onthe surface, suggesting that ethanol-resistant engine oilshould be produced in order to avoid serious wear frombioethanol.
Appendix A and B
Tables 7–13
Max.
Accuracy
Avg.
Uncertainty%
0.01 �0.01 + �
34.33 34.338 33.345 33.841 1.438 �1.43834.86 34.871 31.85 33.362 4.490 �4.49030.25 30.260 28.72 29.492 2.572 �2.57231.63 31.644 31.53 31.589 0.144 �0.14432.33 32.342 29.99 31.165 3.744 �3.74429.09 29.095 27.66 28.375 2.502 �2.502
2.482 �2.482
ax.
Accuracy
Avg.
Uncertainty%
0.01 �0.01 + �
81.88 181.888 173.916 177.902 2.234 �2.23460.30 160.311 148.398 154.354 3.852 �3.85262.75 162.762 148.930 155.846 4.431 �4.43155.01 155.021 152.190 153.605 0.915 �0.91562.75 162.762 149.465 156.113 4.252 �4.25248.41 148.418 139.357 143.888 3.141 �3.141
3.137 �3.137
This journal is © The Royal Society of Chemistry 2017

Table 12 Uncertainty analysis for WSD at 80 kg
Samples WSD 1 WSD 2 WSD 3 Min. Max.
Accuracy
Avg.
Uncertainty%
0.01 �0.01 + �
Pure SO 1868 1830 1834 1830 1868 1868.01 1829.99 1849 1.02758 �1.02758E0–SO 1930 1810 1898 1810 1930 1930.01 1809.99 1870 3.20855 �3.20855E10–SO 2053 2078 2003 2003 2078 2078.01 2002.99 2040.5 1.83778 �1.83778E20–SO 1944 1940 1944 1940 1944 1944.01 1939.99 1942 0.10298 �0.10298E30–SO 2015 2015 1910 1910 2015 2015.01 1909.99 1962.5 2.67515 �2.67515E85–SO 2090 2135 2060 2060 2135 2135.01 2059.99 2097.5 1.78784 �1.78784Uncertainty level 1.773318 �1.77331
Table 11 Uncertainty analysis for WSD at 40 kg
Samples WSD 1 WSD 2 WSD 3 Min. Max.
Accuracy
Avg.
Uncertainty%
0.01 �0.01 + �
Pure SO 341 339 350 339 350 350.01 338.99 344.5 1.59651 �1.59651E0–SO 377 371 392 371 392 392.01 370.99 381.5 2.75229 �2.75229E10–SO 367 380 391 367 391 390.53 366.71 378.62 3.14299 �3.14299E20–SO 380 365 385 365 385 385.01 364.99 375 2.66666 �2.66666E30–SO 390 3674 386 374 390 390.01 373.99 382 2.09424 �2.09424E85–SO 388 410 398 388 410 410.01 387.99 399 2.75689 �2.75689Uncertainty level 2.50160 �2.50160
Table 10 Uncertainty analysis for FC at 80 kg
Samples FC 1 FC 2 FC 3 Min. Max.
Accuracy
Avg.
Uncertainty%
0.01 �0.01 + �
Pure SO 0.1093 0.1148 0.1077 0.1077 0.1148 0.1248 0.0977 0.1112 3.19101 �3.19101E0–SO 0.1314 0.1252 0.1292 0.1252 0.1314 0.1414 0.1152 0.1283 2.41621 �2.41621E10–SO 0.1110 0.1154 0.1125 0.1110 0.1154 0.1254 0.1010 0.1132 1.94346 �1.94346E20–SO 0.1323 0.1284 0.1343 0.1284 0.1343 0.1443 0.1184 0.1313 2.24590 �2.24590E30–SO 0.1115 0.1165 0.1157 0.1115 0.1165 0.1265 0.1015 0.1140 2.19298 �2.19298E85–SO 0.1176 0.1223 0.1130 0.1130 0.1223 0.1323 0.1030 0.1176 3.95240 �3.95240Uncertainty level 2.65699 �2.65699
Table 9 Uncertainty analysis for FC at 40 kg
Samples FC 1 FC 2 FC 3 Min. Max.
Accuracy
Avg.
Uncertainty%
0.01 �0.01 + �
Pure SO 0.109 0.110 0.115 0.109 0.115 0.125 0.0994 0.1122 2.49919 �2.49919E0–SO 0.114 0.114 0.109 0.109 0.114 0.124 0.0990 0.1115 2.24215 �2.24215E10–SO 0.103 0.111 0.103 0.103 0.111 0.1208 0.0931 0.1070 3.5998 �3.5998E20–SO 0.112 0.109 0.109 0.109 0.112 0.122 0.0987 0.1104 1.49524 �1.49524E30–SO 0.106 0.112 0.103 0.103 0.112 0.1219 0.0927 0.1073 4.28704 �4.28704E85–SO 0.110 0.113 0.1125 0.110 0.113 0.1228 0.1001 0.1115 1.21130 �1.21130Uncertainty level 2.55579 �2.55579
This journal is © The Royal Society of Chemistry 2017 RSC Adv., 2017, 7, 15005–15019 | 15017
Paper RSC Advances
Ope
n A
cces
s A
rtic
le. P
ublis
hed
on 0
7 M
arch
201
7. D
ownl
oade
d on
12/
28/2
021
3:37
:54
PM.
Thi
s ar
ticle
is li
cens
ed u
nder
a C
reat
ive
Com
mon
s A
ttrib
utio
n-N
onC
omm
erci
al 3
.0 U
npor
ted
Lic
ence
.View Article Online
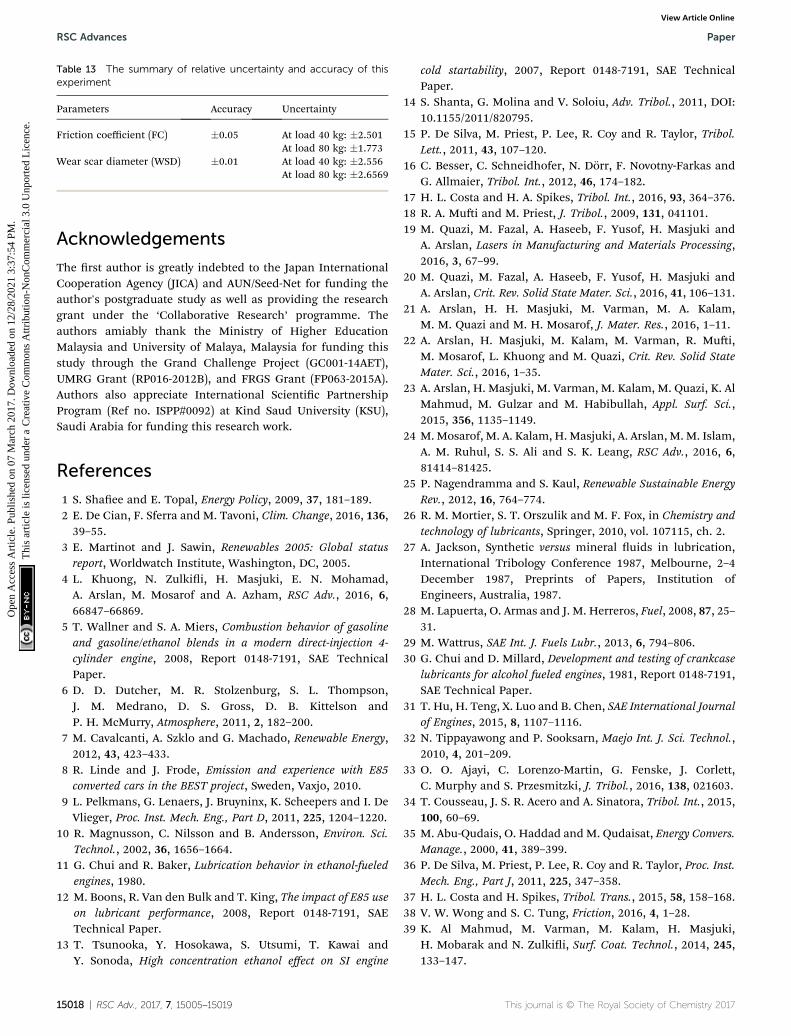
Table 13 The summary of relative uncertainty and accuracy of thisexperiment
Parameters Accuracy Uncertainty
Friction coefficient (FC) �0.05 At load 40 kg: �2.501At load 80 kg: �1.773
Wear scar diameter (WSD) �0.01 At load 40 kg: �2.556At load 80 kg: �2.6569
RSC Advances Paper
Ope
n A
cces
s A
rtic
le. P
ublis
hed
on 0
7 M
arch
201
7. D
ownl
oade
d on
12/
28/2
021
3:37
:54
PM.
Thi
s ar
ticle
is li
cens
ed u
nder
a C
reat
ive
Com
mon
s A
ttrib
utio
n-N
onC
omm
erci
al 3
.0 U
npor
ted
Lic
ence
.View Article Online
Acknowledgements
The rst author is greatly indebted to the Japan InternationalCooperation Agency (JICA) and AUN/Seed-Net for funding theauthor's postgraduate study as well as providing the researchgrant under the ‘Collaborative Research’ programme. Theauthors amiably thank the Ministry of Higher EducationMalaysia and University of Malaya, Malaysia for funding thisstudy through the Grand Challenge Project (GC001-14AET),UMRG Grant (RP016-2012B), and FRGS Grant (FP063-2015A).Authors also appreciate International Scientic PartnershipProgram (Ref no. ISPP#0092) at Kind Saud University (KSU),Saudi Arabia for funding this research work.
References
1 S. Shaee and E. Topal, Energy Policy, 2009, 37, 181–189.2 E. De Cian, F. Sferra and M. Tavoni, Clim. Change, 2016, 136,39–55.
3 E. Martinot and J. Sawin, Renewables 2005: Global statusreport, Worldwatch Institute, Washington, DC, 2005.
4 L. Khuong, N. Zulkii, H. Masjuki, E. N. Mohamad,A. Arslan, M. Mosarof and A. Azham, RSC Adv., 2016, 6,66847–66869.
5 T. Wallner and S. A. Miers, Combustion behavior of gasolineand gasoline/ethanol blends in a modern direct-injection 4-cylinder engine, 2008, Report 0148-7191, SAE TechnicalPaper.
6 D. D. Dutcher, M. R. Stolzenburg, S. L. Thompson,J. M. Medrano, D. S. Gross, D. B. Kittelson andP. H. McMurry, Atmosphere, 2011, 2, 182–200.
7 M. Cavalcanti, A. Szklo and G. Machado, Renewable Energy,2012, 43, 423–433.
8 R. Linde and J. Frode, Emission and experience with E85converted cars in the BEST project, Sweden, Vaxjo, 2010.
9 L. Pelkmans, G. Lenaers, J. Bruyninx, K. Scheepers and I. DeVlieger, Proc. Inst. Mech. Eng., Part D, 2011, 225, 1204–1220.
10 R. Magnusson, C. Nilsson and B. Andersson, Environ. Sci.Technol., 2002, 36, 1656–1664.
11 G. Chui and R. Baker, Lubrication behavior in ethanol-fueledengines, 1980.
12 M. Boons, R. Van den Bulk and T. King, The impact of E85 useon lubricant performance, 2008, Report 0148-7191, SAETechnical Paper.
13 T. Tsunooka, Y. Hosokawa, S. Utsumi, T. Kawai andY. Sonoda, High concentration ethanol effect on SI engine
15018 | RSC Adv., 2017, 7, 15005–15019
cold startability, 2007, Report 0148-7191, SAE TechnicalPaper.
14 S. Shanta, G. Molina and V. Soloiu, Adv. Tribol., 2011, DOI:10.1155/2011/820795.
15 P. De Silva, M. Priest, P. Lee, R. Coy and R. Taylor, Tribol.Lett., 2011, 43, 107–120.
16 C. Besser, C. Schneidhofer, N. Dorr, F. Novotny-Farkas andG. Allmaier, Tribol. Int., 2012, 46, 174–182.
17 H. L. Costa and H. A. Spikes, Tribol. Int., 2016, 93, 364–376.18 R. A. Mui and M. Priest, J. Tribol., 2009, 131, 041101.19 M. Quazi, M. Fazal, A. Haseeb, F. Yusof, H. Masjuki and
A. Arslan, Lasers in Manufacturing and Materials Processing,2016, 3, 67–99.
20 M. Quazi, M. Fazal, A. Haseeb, F. Yusof, H. Masjuki andA. Arslan, Crit. Rev. Solid State Mater. Sci., 2016, 41, 106–131.
21 A. Arslan, H. H. Masjuki, M. Varman, M. A. Kalam,M. M. Quazi and M. H. Mosarof, J. Mater. Res., 2016, 1–11.
22 A. Arslan, H. Masjuki, M. Kalam, M. Varman, R. Mui,M. Mosarof, L. Khuong and M. Quazi, Crit. Rev. Solid StateMater. Sci., 2016, 1–35.
23 A. Arslan, H. Masjuki, M. Varman, M. Kalam, M. Quazi, K. AlMahmud, M. Gulzar and M. Habibullah, Appl. Surf. Sci.,2015, 356, 1135–1149.
24 M. Mosarof, M. A. Kalam, H. Masjuki, A. Arslan, M. M. Islam,A. M. Ruhul, S. S. Ali and S. K. Leang, RSC Adv., 2016, 6,81414–81425.
25 P. Nagendramma and S. Kaul, Renewable Sustainable EnergyRev., 2012, 16, 764–774.
26 R. M. Mortier, S. T. Orszulik and M. F. Fox, in Chemistry andtechnology of lubricants, Springer, 2010, vol. 107115, ch. 2.
27 A. Jackson, Synthetic versus mineral uids in lubrication,International Tribology Conference 1987, Melbourne, 2–4December 1987, Preprints of Papers, Institution ofEngineers, Australia, 1987.
28 M. Lapuerta, O. Armas and J. M. Herreros, Fuel, 2008, 87, 25–31.
29 M. Wattrus, SAE Int. J. Fuels Lubr., 2013, 6, 794–806.30 G. Chui and D. Millard, Development and testing of crankcase
lubricants for alcohol fueled engines, 1981, Report 0148-7191,SAE Technical Paper.
31 T. Hu, H. Teng, X. Luo and B. Chen, SAE International Journalof Engines, 2015, 8, 1107–1116.
32 N. Tippayawong and P. Sooksarn, Maejo Int. J. Sci. Technol.,2010, 4, 201–209.
33 O. O. Ajayi, C. Lorenzo-Martin, G. Fenske, J. Corlett,C. Murphy and S. Przesmitzki, J. Tribol., 2016, 138, 021603.
34 T. Cousseau, J. S. R. Acero and A. Sinatora, Tribol. Int., 2015,100, 60–69.
35 M. Abu-Qudais, O. Haddad and M. Qudaisat, Energy Convers.Manage., 2000, 41, 389–399.
36 P. De Silva, M. Priest, P. Lee, R. Coy and R. Taylor, Proc. Inst.Mech. Eng., Part J, 2011, 225, 347–358.
37 H. L. Costa and H. Spikes, Tribol. Trans., 2015, 58, 158–168.38 V. W. Wong and S. C. Tung, Friction, 2016, 4, 1–28.39 K. Al Mahmud, M. Varman, M. Kalam, H. Masjuki,
H. Mobarak and N. Zulkii, Surf. Coat. Technol., 2014, 245,133–147.
This journal is © The Royal Society of Chemistry 2017
Paper RSC Advances
Ope
n A
cces
s A
rtic
le. P
ublis
hed
on 0
7 M
arch
201
7. D
ownl
oade
d on
12/
28/2
021
3:37
:54
PM.
Thi
s ar
ticle
is li
cens
ed u
nder
a C
reat
ive
Com
mon
s A
ttrib
utio
n-N
onC
omm
erci
al 3
.0 U
npor
ted
Lic
ence
.View Article Online
40 M. Soderall, A. Almqvist and R. Larsson, Tribol. Int., 2016,104, 57–63.
41 M. H. Mosarof, M. A. Kalam, H. H. Masjuki,A. Alabdulkarem, M. Habibullah, A. Arslan andI. M. Monirul, Ind. Crops Prod., 2016, 83, 470–483.
42 R. Rastogi, M. Yadav and A. Bhattacharya, Wear, 2002, 252,686–692.
43 H. Masjuki and M. Maleque, Wear, 1997, 206, 179–186.44 H. Masjuki, M. Saifullah, M. Husnawan, M. Faizul and
M. Shaaban, in World Tribology Congress III, ASMEProceedings, 2005, vol. 1, pp. 451–452.
45 T. C. Ing, A. Mohammed Raq, Y. Azli and S. Syahrullail,Tribol. Trans., 2012, 55, 539–548.
46 H. H. Masjuki and M. A. Maleque,Wear, 1997, 206, 179–186.47 M. Mojur, H. Masjuki, M. Kalam, A. Atabani, I. R. Fattah
and H. Mobarak, Ind. Crops Prod., 2014, 53, 78–84.48 D. Ljubas, H. Krpan and I. Matanovic, Naa, 2010, 61, 73–79.49 A. K. Agarwal and J. G. Gupta, in Novel Combustion Concepts
for Sustainable Energy Development, Springer, 2014, pp. 75–87.
50 S. Arumugam and G. Sriram, Aust. J. Mech. Eng., 2012, 10,119–128.
51 J. Jakobiec and A. Mazanek, Teka Komisji Motoryzacyjneji Energetyki Rolnictwa, 2009, 9, 99–113.
52 K. Howard, Towards Zero Carbon Transportation, inAlternative Fuels and Advanced Vehicle Technologies forImproved Environmental Performance, ed. R. Folkson,
This journal is © The Royal Society of Chemistry 2017
Elsevier, UK, 2014, ch. 6, DOI: 10.1533/9780857097422.1.138.
53 M. Shahabuddin, H. Masjuki, M. Kalam, M. Bhuiya andH. Mehat, Ind. Crops Prod., 2013, 47, 323–330.
54 J. Agudelo, A. Delgado and P. Benjumea, Rev. Fac. Ing., Univ.Antioquia, 2011, 9–16.
55 Y.-C. Lin, T.-H. Kan, J.-N. Chen, J.-C. Tsai, Y.-Y. Ku andK.-W. Lin, Tribol. Trans., 2013, 56, 997–1010.
56 V. W. Wong, in Encyclopedia of automotive engineering, ed. D.Crolla, John Wiley & Sons, 2015, ch. 22.
57 Tribology Series, ed. G. W. Stachowiak and A. W. Batchelor,Elsevier, 1993, vol. 24, pp. 637–656.
58 A. K. Agarwal, A. Pandey, A. K. Gupta, S. K. Aggarwal andA. Kushari, Novel combustion concepts for sustainable energydevelopment, Springer, 2014.
59 B. Rahimi, A. Semnani, A. Nezamzadeh-Ejhieh, H. ShakooriLangeroodi and M. Hakim Davood, J. Anal. Methods Chem.,2012, 2012, 819524, DOI: 10.1155/2012/819524.
60 X. Lu, J. Cotter and D. Eadie, Wear, 2005, 259, 1262–1269.61 B. Briscoe, P. Thomas and D.Williams,Wear, 1992, 153, 263–
275.62 N. W. M. Zulkii, M. A. Kalam, H. H. Masjuki,
M. Shahabuddin and R. Yunus, Energy, 2013, 54, 167–173.63 Y. Wu, W. Li, M. Zhang and X. Wang, Tribol. Int., 2013, 64,
16–23.64 S. Q. A. Rizvi, in Lubricant additives: chemistry and
applications, ed. L. R. Rudnick, CRC press, 2009, ch. 5.
RSC Adv., 2017, 7, 15005–15019 | 15019