effect of full-chord porosity on aerodynamic …mln/ltrs-pdfs/nasa-96-tp3591.pdf · effect of...
TRANSCRIPT

National Aeronautics and Space AdministrationLangley Research Center • Hampton, Virginia 23681-0001
NASA Technical Paper 3591
Effect of Full-Chord Porosity on AerodynamicCharacteristics of the NACA 0012 AirfoilRaymond E. MineckLangley Research Center • Hampton, Virginia
Peter M. HartwichViGYAN Inc. • Hampton, Virginia
April 1996

Printed copies available from the following:
NASA Center for AeroSpace Information National Technical Information Service (NTIS)800 Elkridge Landing Road 5285 Port Royal RoadLinthicum Heights, MD 21090-2934 Springfield, VA 22161-2171(301) 621-0390 (703) 487-4650
Available electronically at the following URL address: http://techreports.larc.nasa.gov/ltrs/ltrs.html

Summary
A wind tunnel test was conducted on a two-dimensional model of the NACA 0012 airfoil sectionwith either a conventional solid upper surface or a porousupper surface with a cavity beneath for passive venting.The purposes of the test were to investigate the aero-dynamic characteristics of an airfoil with full-chordporosity and to assess the ability of porosity to provide amultipoint or self-adaptive design. The tests were con-ducted in the Langley 8-Foot Transonic Pressure Tunnelover a Mach number range from 0.50 to 0.82 at chordReynolds numbers of 2× 10⁶, 4 × 10⁶, and 6× 10⁶. Theangle of attack was varied from−1° to 6° in 1° incre-ments. The porous surface nominally extended over theentire upper surface. The porosity was zero at the leadingand the trailing edges and was distributed by using asquare-root-sine function with a maximum value of2.44 percent at the model midchord. The average poros-ity (ratio of total hole area to total porous surface area) ofthe upper surface was 1.08 percent.
In general, full-chord porosity reduces the lift curveslope and increases the drag at a given section normalforce coefficient. At lower Mach numbers, porosity leadsto a dependence of the drag on the normal force. At sub-critical conditions, porosity tends to flatten the pressuredistribution, which reduces the suction peak near theleading edge and increases the suction over the middle ofthe chord. At supercritical conditions, the compressionregion on the porous upper surface is spread over alonger portion of the chord. In all cases, the pressurecoefficient in the cavity beneath the porous surface isfairly constant with a very small increase over the rearportion. For the porous upper surface, the trailing edgepressure coefficients exhibit a creep at the lower sectionnormal force coefficients, which suggests that the bound-ary layer on the rear of the airfoil is significantly thicken-ing with increasing normal force coefficient. Porousairfoils exhibit an adaptive characteristic in that thethickness and the leading edge radius of an equivalentsolid airfoil decrease with increasing Mach number, thusmaking the porous NACA 0012 airfoil perform more likea high-speed airfoil.
Introduction
For supercritical flow over a solid surface airfoil,the supersonic zone may be terminated by a strong nor-mal shock. In addition to causing wave drag, the pressurerise across the shock may lead to boundary layer separa-tion, which further increases the total drag. Narrowporous surface strips with cavities beneath the surface oftransonic airfoils have been proposed to delay the dragrise that is associated with the energy losses due toshocks and shock-induced boundary layer separation
(refs. 1 to 6). The principle underlying this passive dragreduction technique, often referred to as shock venting, ispresented in figure 1(a).
By placing a porous strip on the surface over a cavitybeneath the foot of the shock, a secondary flow isinduced into and out of the cavity. The velocities throughthe surface and the velocities in the cavity are relativelysmall by design. Since the velocity of the flow in the cav-ity is small, the pressure gradient in the cavity is alsosmall. The pressure level in the cavity can be considerednearly constant with a value between the minimum andthe maximum pressures on the porous surface. The pres-sure rise associated with the shock above the porous sur-face creates a chordwise pressure gradient. Aft of theshock, the pressure on the porous surface is greater thanthe pressure in the cavity, so the secondary flow goesinto the cavity. The secondary flow travels upstream inthe cavity and exits through the porous surface upstreamof the shock, where the pressure on the porous surface isless than that in the cavity. This secondary flow proceedsdownstream over the porous surface. The resulting bub-ble of recirculating flow acts like a bump on the airfoilsurface, which leads to an oblique compression wave(which can be isentropic) that forms the upstream edge ofa lambda shock. To be effective, the porous strip must belocated beneath the shock for the operating Mach numberand lift coefficient.
Flow visualization studies (refs. 1 and 2) show that aporous strip placed beneath a shock does lead to a weakerlambda shock system. Data from exploratory experi-ments (refs. 1 to 3) indicate that, at supercritical condi-tions with a strong shock, a narrow porous strip reducesthe drag, may increase the lift, and increases the buffetboundary. At subcritical conditions, the porous stripincreases the drag (ref. 1).
Computational studies of solutions to the full poten-tial flow, the Euler, and even the Navier-Stokes equa-tions have simulated the flow over an airfoil with aporous strip (refs. 4 to 7). Calculated results agree withthe experimental data in that a porous strip can increasethe lift and reduce the wave drag. The results also showthe formation of the lambda shock system over theporous strip. Calculations with viscous effects show thata porous strip can suppress transonic shock-inducedoscillations causing buffet (ref. 7). When the addition ofa porous strip leads to more negative pressure coeffi-cients on surfaces with downstream-directed, outwardnormal vectors, the calculated pressure drag willincrease. Viscous calculations indicate that porosity canlead to a separated flow region downstream of the porousstrip and to an increase in the viscous drag. Increases inthe pressure and the viscous drag offset to some degreethe reduction of the wave drag. As a result, the net drag

2
increases when there is either a weak shock or no shockand the net drag decreases when there is a strong shock.
A pressure gradient along the length of a porous sur-face creates a secondary flow field that acts like a bumpor a local increase in thickness. By locating a porous stripon the forward portion of the airfoil, the increase in localthickness can increase the effective leading edge radiusand can improve the performance of the airfoil at highincidence angles, which produces a self-adaptive airfoil(ref. 8). Results from an Euler study (ref. 9) show thatporosity that covers almost the entire chord (fig. 1(b)) notonly delays the drag divergence, but also produces sur-face pressure distributions, which suggest that full-chordporosity might provide a means for achieving multipointdesign for transonic airfoils.
The purpose of this report is to present experimentalsurface static pressure and wake total pressure distribu-tions so that the effect of full-chord porosity on airfoilaerodynamic characteristics is better understood. Theresults are also used to determine whether the delay indrag divergence and the multipoint design capability pre-dicted in the Euler study reported in reference 9 can beachieved. The experimental study presented herein wasconducted in the Langley 8-Foot Transonic PressureTunnel (ref. 10) with a two-dimensional model thatincorporated the NACA 0012 airfoil section.
Two upper surfaces were tested: one with full-chordporosity and the other with no porosity (solid surface).The lower surface of the model was solid. Measurementswere obtained over a Mach number range from 0.50to 0.82, an angle-of-attack range from−1° to 6°, andchord Reynolds numbers of 2× 10⁶, 4× 10⁶, and 6× 10⁶.Chordwise static pressure distributions were measuredon the upper and the lower exterior surfaces of the airfoiland along the bottom of the cavity. Total pressure distri-butions were measured across the airfoil wake. Thesepressure data, as well as the integrated force and momentcoefficients, are used to study the effect of porosity onthe airfoil aerodynamic characteristics. Equivalent solidairfoils were defined by an inverse design method andthe porous upper surface pressure distributions to assessany multipoint design characteristics in the porous airfoilresults.
Symbols
The results are presented in coefficient form with themoment reference center at the quarter-chord. All experi-mental measurements and calculations were made inU.S. customary units.
b model span, 83.9 in.
Cp pressure coefficient
Cp,te pressure coefficient near the trailing edge(x/c = 0.99)
Cp* pressure coefficient at local sonic conditions
c model chord, 25.00 in.
cd section drag coefficient
cm section pitching moment coefficient resolvedabout the quarter-chord
cn section normal force coefficient
M∞ free-stream Mach number
pt local total pressure in wake, psi
pt,∞ free-stream total pressure, psi
Rc Reynolds number based on model chord andfree-stream conditions
rle airfoil leading edge radius, in.
tmax airfoil maximum thickness, in.
x chordwise distance from the leading edge,positive downstream, in.
y normal distance from the chord line or raketube location, positive up, in.
z spanwise distance, positive out the rightwing, in.
α angle of attack, positive leading edge up, deg
∆y measured normal distance− design normaldistance from the chord line, in.
η nondimensional spanwise location,
σ surface permeability parameter
Subscript:
max maximum value
Wind Tunnel
The investigation was conducted in the Langley8-Foot Transonic Pressure Tunnel (8-ft TPT). Informa-tion about the wind tunnel may be found in reference 10.The tunnel is a single-return, fan-driven, continuous-operation pressure tunnel. The top and the bottom wallsare slotted and the sidewalls are solid. The test section is160 in. long with an 85.5-in-square cross section at thebeginning of the slots. The cross-sectional area of the testsection is equivalent to the cross-sectional area of an 8-ft-diameter circle. A photograph of an airfoil modelinstalled in the test section is presented in figure 2(a).The empty test section Mach number is continuouslyvariable from about 0.20 to 1.30. Stagnation pressure canbe varied from 0.25 atm to 2.00 atm. Air dryers are usedto control the dew point. A heat exchanger locatedupstream of the settling chamber controls the stagnationtemperature. Five turbulence reduction screens are
zb/2--------

3
located just downstream of the heat exchanger. Anarc-sector model support system with an angle rangefrom −12.5° to 12.5° is located in the high-speed dif-fuser. For this test, a wake rake was installed on themodel support system. The whole arc sector was trans-lated longitudinally to position the wake rake at thedesired test section station.
Model
An unswept, two-dimensional airfoil model wasused for this investigation. Photographs of the model arepresented in figure 2 and sketches are presented infigure 3. The model spanned the width of the tunnel at avertical station 1.4 in. above the tunnel centerline. Themodel chord was 25.00 in., which yields an aspect ratioof 3.36 and a ratio of tunnel height to model chordof 3.42. The angle of attack was set manually by rotatingthe model about pivots in the angle-of-attackplates mounted on the tunnel sidewalls. (See figs. 2(a)and 3(a).) Fixed pivot settings provided an angle-of-attack range from−1.00° to 6.00° in increments of 0.25°;however, only 1° increments were used.
The model was fabricated in two parts: a main sparand an interchangeable center insert. (See figs. 3(a)and 3(b).) The upper and the lower surfaces of the outerportions of the main spar were solid and followed thecontour of the NACA 0012 airfoil section. The centerportion of the main spar was also solid and the lower sur-face followed the contour of the NACA 0012 airfoil. Theinterchangeable insert, installed over the center portionof the main spar, defined the leading and the trailingedges of the lower surface, as well as the entire uppersurface of the center portion of the wing. (See fig. 3(b).)The upper surface of the interchangeable insert wasporous and the lower surface was solid. The model shapewas measured at three spanwise stations and the devia-tion of the measured airfoil shape from the desired shapeis presented in figure 4. The solid lower surface was veryclose to the desired contour, with the maximum deviationless than 0.0002c. The porous upper surface, with a max-imum deviation of 0.0009c, did not follow the desiredcontour as closely as the lower surface.
The interchangeable center insert was machined with46 chordwise cavities, each 0.94 in. wide and spaced at1.00 in. intervals. (See figs. 3(b) and 3(c).) The remain-ing 0.06 in. between the cavities formed ribs to supportthe porous surface. The maximum cavity depth of0.75 in. was maintained from near the nose to the 0.5clocation. The depth decreased linearly from that locationto zero at the trailing edge.
The porous surface was a perforated titanium sheet,0.020 in. thick. (See figs. 2(b) and 3(c).) The poroussheet had 368 chordwise rows with 440 holes in each
row. The holes were laser drilled with a diameter of0.010± .001 in. The porous sheet was bonded to the ribswith epoxy resin. Near the trailing edge, where the cavitywas shallow, the perforated plate was bonded to the solidlower surface, which eliminated the porosity there. Thechordwise rows were spaced 0.125 in. apart so that therewere 8 rows over each cavity. The chordwise distributionof the porosity is defined by
(1)
This distribution and the valueσmax= 0.6 wereselected to be consistent with the Euler study of ref-erence 9. This distribution was implemented by varyingthe spacing of the holes along the length of the chord.Determination of the chordwise spacing of the holes ispresented in the appendix. The average porosity (ratio oftotal hole area to total porous surface area) was 1.08 per-cent and the peak porosity was 2.44 percent.
A single chordwise row of pressure orifices wasinstalled on the upper surface and the lower surface nearthe model centerline. Two spanwise rows of pressure ori-fices were installed on the upper surface and the lowersurface. A single chordwise row was installed on the bot-tom of the cavity just to the right of the model centerline.A sketch of the locations of the pressure orifices is pre-sented in figure 3(a) and a listing is presented in table 1.The orifices were installed normal to the local surfaceand had a diameter of 0.020 in. For the chordwise row,the upper surface orifices were located on the centerline(except for the two orifices atx/c = 0 andx/c = 0.0029).The lower surface orifices were located 1.5 in. to theright of the centerline. There were 49 orifices on theupper surface that extended from the leading edge backto 0.99c and 47 orifices on the lower surface thatextended from 0.0068c back to 0.99c. The orifices wereconcentrated near the leading edge. In the cavity, the ori-fices were located along the center of the cavity bottom,0.5 in. from the model centerline. (See fig. 3(c).) Therewere 13 cavity orifices that extended from 0.033c to0.923c and spaced at approximately 0.07c intervals. Thetwo spanwise rows on each surface were located at 0.80cand 0.90c.
Wake Rake
A wake rake was mounted vertically on the modelsupport system to survey the total and the static pressuredistributions in the model wake on the tunnel centerline.The rake was pitched on the model support system toalign the maximum total pressure loss with the rakecenterline. Except where noted otherwise, the wake rakestreamwise location was fixed at 37.50 in. downstream ofthe model trailing edge. A sketch of the wake rake is pre-sented in figure 5 and a photograph is presented in
σ σmax π x/c( )sin=

4
figure 6. The rake tube locations are listed in table 2. Thewake rake had 61 total pressure tubes located between17.685 in. above and 17.685 in. below the rake center-line. The inside of each total pressure tube was flattenedinto an oval shape 0.02 in. high and 0.07 in. wide. Thetubes were concentrated near the center of the rake wherethe total pressure gradient was expected to be the largest.In addition, there were 7 static pressure probes installedbetween 10.015 in. above and 10.015 in. below the rakecenterline in a vertical plane 0.50 in. from the plane ofthe rake total pressure tubes.
Instrumentation
The test section total and static pressures were mea-sured with quartz Bourdon tube differential pressuretransducers referenced to a vacuum. Each transducer hada range from±30 psid and a quoted accuracy from themanufacturer of±0.003 psid. The test section stagnationtemperature was measured with a thermocouple mountedin the settling chamber. The wing static pressures and thewake rake static and total pressures were measured withan electronically scanned pressure measurement systemwith a transducer dedicated to each orifice. Each trans-ducer had a range of±5 psid and a quoted accuracy fromthe manufacturer of±0.005 psid. The model angle ofattack was determined by a pinhole selected to fix themodel attitude on the angle-of-attack plates.
Tests and Procedures
The model angle of attack was set manually. Theangles used for this test ranged from−1° to 6° in 1°increments. At each angle of attack, the free-streamMach number was varied from 0.50 to 0.82 at Reynoldsnumbers of 2× 10⁶, 4 × 10⁶, and 6× 10⁶ based on amodel chord of 25.00 in. The nominal test conditions arepresented in table 3. All tests were conducted at a stagna-tion temperature of 100°F. At each test condition, themodel support system (and consequently the wake rake)angle was adjusted so that the location of the maximumloss in total pressure coincided with the center tube of thewake rake. This ensured that the portion of the wake withthe largest total pressure gradient was measured by thatportion of the rake with the closest total pressure tubespacing. Normally, the total pressure tubes on the wakerake were positioned 1.5c (37.5 in.) downstream of themodel trailing edge at an angle of attack of 0°. A limitednumber of measurements were obtained with the wakerake positioned 1.0c (25.0 in.) downstream of the model.A comparison of the results obtained with the wake rakeat these two locations, presented in figure 7, shows nosignificant effects from the wake rake location on theintegrated force and moment coefficients.
Boundary layer transition was fixed for all tests witha 0.1-in.-wide strip of number 80 carborundum grit onboth the upper and the lower surfaces. The strip on eachsurface began 1.25 in. back (x/c = 0.05) from the leadingedge. The grit size was determined by using the tech-nique described in reference 11.
The section normal force and pitching moment coef-ficients were obtained by numerically integrating (withthe trapezoidal method) the local pressure coefficient ateach orifice multiplied by an area weighting function.(The area weighting function is determined by the loca-tion of the surface pressure orifices.) The section dragcoefficient was obtained by numerically integrating (withthe trapezoidal method) the point drag coefficient calcu-lated at each rake total pressure tube by using the proce-dure of Baals and Mourhess (ref. 12).
No corrections were applied to the model angle ofattack or to the free-stream Mach number for the effectsof top and bottom wall interference or to the Mach num-ber for sidewall interference. Corrections to the porousairfoil results should be similar to the corrections to thesolid airfoil results at similar test conditions. Therefore,comparisons of porous and solid airfoil results at similartest conditions should provide reasonable values for theeffects of porosity.
A single porous insert with 0.75-in-deep cavities wastested. The solid surface results were obtained from themodel with the porous insert covered with an impervioustape. The tape, which was 0.002 in. thick, covered theexterior of the model from the location of the transitionstrip on the lower surface, extending around the leadingedge, and continuing back to the upper surface trailingedge. By using the same upper surface shape for both thesolid and the porous surface tests, the effect of changes inthe shape between the solid and the porous surface testsshould be minimized.
Data Quality
As noted previously, the upper surface shape devi-ated slightly from the design shape. To evaluate theeffect of the difference, the results from the current testare compared in figure 8 with results obtained previouslyon an NACA 0012 airfoil section in the 8-ft TPT(ref. 13). For the tests reported in reference 13, theReynolds number was smaller and the grit size (number54 carborundum grit) used to fix transition was largerthan that used in the current test.
The comparison shows good agreement at a Machnumber of 0.50 except for the angle of zero normal forcecoefficient and some small scatter in the drag data for thecurrent test. These results suggest a model misalignment

5
of −0.10° in the current test that could be due to flowangularity and/or the actual model attitude atα = 0°. Thedifference between the section normal force coefficientsis larger at a Mach number of 0.70, but the drag coeffi-cients are in good agreement at normal force coefficientsbelow the break in the drag polar. At a Mach number of0.80, there is a sizable difference of 0.0020 in the dragcoefficients at zero normal force.
Although there are differences between the resultsfrom the current test and those from the test reported inreference 13 because of the difference in the transitiongrit, Reynolds number, and surface shape, the current testis consistent (i.e., same transition grit, Reynolds number,and surface shape were used for the solid and the poroussurface tests).
The porous upper surface extended from a non-dimensional spanwise location,η = z/(b/2), of aboutη =−0.6 toη = 0.6. Since the flow over the central poroussurface will be different from that over the outer solidsurface, the spanwise extent of two-dimensional flowwill be smaller for the porous surface than for the solidsurface. The spanwise rows of pressure orifices wereused to assess the extent of the two-dimensional flow.
The spanwise pressure distributions atx/c = 0.8 on theupper surface are presented in figure 9 at the lowest, anintermediate, and the highest test Mach numbers for boththe solid and the porous upper surfaces. For the solid sur-face, there is no significant spanwise variation in thepressure coefficient at these three Mach numbers. For theporous surface, there is no significant spanwise variationat the lowest Mach number. At the intermediate and thehighest Mach numbers, spanwise gradients develop atstations outboard ofη = 0.12 andη = −0.34, which indi-cates the presence of three-dimensional flow for thosetest conditions. However, there is still a region with littlespanwise pressure gradient around the model centerlineso that there is a region of two-dimensional flow aboutthe model centerline from the lowest to the highest testMach numbers. Thus, the flow at the model centerlinecan be assumed to be two-dimensional for the conditionsencountered in this test.
The model with the porous upper surface wasretested at an angle of attack of 0° during the test and theresults are presented in figure 10. Although there areonly a limited number of repeat points, the data repeat-ability is excellent.
Presentation of Results
The results from this investigation are presented with transition fixed on both surfaces atx/c = 0.05. The momentreference center was 0.25c. The results are presented in the following figures:
Figure
Chordwise pressure coefficient distributions for solid and porous surfaces at:
Constant angle of attack ....................................................................................................................................11 to 19
cn ≈ 0.3 ....................................................................................................................................................................... 20
Effect of porosity on pressure coefficient near trailing edge ............................................................................................ 21
Effect of porosity on total pressure profiles at constant angle of attack ........................................................................... 22
Effect of Mach number on integrated force and moment coefficients.............................................................................. 23
Effect of Reynolds number on integrated force and moment coefficients:
Solid upper surface..................................................................................................................................................... 24
Porous upper surface .................................................................................................................................................. 25
Effect of porosity on integrated force and moment coefficients ....................................................................................... 26
Variation of section drag coefficient with Mach number.................................................................................................. 27
Equivalent upper surface shape obtained from solid upper surfaceCp distributions........................................................ 28
Equivalent upper surface shape obtained from porous upper surfaceCp distributions ........................................ 29 and 30

6
Discussion of Results
Airfoil Surface Pressure Distributions
Comparisons of the chordwise pressure coefficientdistributions for the solid and the porous airfoils at thesame angle of attack are presented in figures 11 to 19 forMach numbers from 0.50 to 0.82 at a chord Reynoldsnumber of 4× 10⁶ over the angle-of-attack range. Itshould be noted that, although the comparisons are pre-sented at the same angle of attack, the section normalforce and the drag coefficients are different. Thus, theremay be small differences in the wall interference for thetwo points compared in each plot. For those cases withsupersonic flow, the pressure coefficient for sonic flow isnoted on the plot byCp
* . No data were obtained for thesolid upper surface airfoil model at an angle of attack of−1°. Assuming that the model is symmetric and that thetunnel upwash can be neglected, results from the lowersurface of the solid airfoil at an angle of attack of 1° canbe compared to the results from the upper surface of theporous airfoil at−1°. Therefore, results from the modelwith the solid surface at an angle of attack of 1° are plot-ted with the results from the porous surface at an angle ofattack of−1°.
The pressure coefficient along the length of the cav-ity is, in general, fairly constant with a small positivegradient toward the rear part of the cavity for some cases.The constant pressure level indicates that the flow in thecavity is small, which validates the assumption of con-stant cavity pressure used in reference 9. The pressurecoefficient in the cavity is about the same as the pressurecoefficient on the upper surface just aft of the midchordlocation.
If the addition of porosity to the upper surface doesnot significantly change the pressure coefficient at thetrailing edge, the flow along the lower surface should notbe changed by the addition of porosity. This is indeed thecase as shown by the measured chordwise pressure distri-butions. The lower surface pressure distribution is thesame with and without upper surface porosity when thereis no change in the trailing edge pressure coefficient.(Seeα = 2° in fig. 14.) However, if the addition of poros-ity reduces the pressure coefficient at the trailing edge,the change will be felt upstream on the lower surfacesince the pressure reduction will hinder the flow fromapproaching stagnation conditions at the trailing edge.The pressure coefficients on the lower surface are indeedreduced when porosity reduces the trailing edge pressurecoefficient, which is an indication of a significantlythickened upper surface boundary layer and possible sep-aration. (Seeα = 4° in fig. 14.)
For the solid airfoil at subcritical conditions, theflow accelerates over the forward portion of the upper
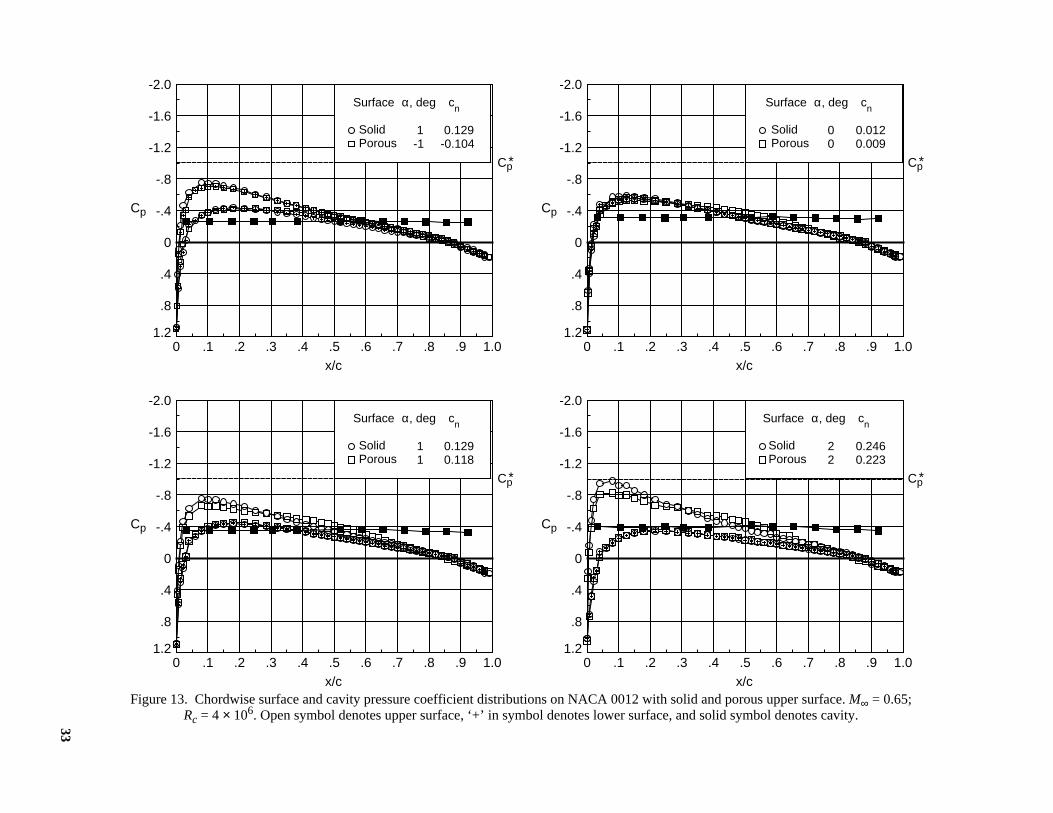
surface, which creates a leading edge suction peak athigher angles of attack. Aft of the initial acceleration, thepressure coefficient increases. Over the forward portionof the porous airfoil, where the surface static pressurecoefficient is less than the cavity pressure, flow will bedrawn out of the cavity. Over the rear portion of theporous airfoil, where the surface pressure coefficient isgreater, flow will be drawn into the cavity. This second-ary flow through the porous surface tends to flatten (orreduce the gradient in) the upper surface chordwise pres-sure distribution over the midchord region. The leadingedge suction peak (when present) is reduced, the suctionover the forward portion of the airfoil is reduced, and thesuction over the central portion of the airfoil is increased(e.g., compare pressure distributions with and withoutporosity forα = 5° in fig. 12).
For the solid airfoil at supercritical conditions, theaccelerated flow region on the upper surface is termi-nated by a shock. For the porous airfoil, flow is drawnout of the cavity on the forward portion of the upper sur-face and forced into the cavity on the aft portion. Theflow induced through the porous surface spreads thecompression region over a longer portion of the chord,which replaces the sharp compression associated with ashock on the solid upper surface (e.g., see pressure distri-butions forα = 0° in fig. 18). The compression on theporous upper surface becomes steeper, suggesting theformation of a weak shock, as the angle of attack (andsection normal force coefficient) increases (e.g., comparepressure gradients nearx/c = 0.20 forα = 2° andα = 4°in fig. 18). However, this steepening is reduced whencompared with that experienced by the shock on the solidsurface airfoil, which results in a reduction of the wavedrag portion of the total drag.
The effects of porosity on the chordwise surfacepressure distributions at a nominal section normal forcecoefficient of 0.3 are presented in figure 20. For the sub-critical case, the results are presented at the same angleof attack. Porosity reduces the leading edge suction peakon the upper surface, reduces the suction over the front ofthe upper surface, and increases the suction over the mid-dle of the upper surface, which results in a redistributionof the pressure loading on the forward portion of the air-foil. There is only a little change in the lower surfacepressure distributions. For the supercritical cases, theangle of attack for the model with the porous upper sur-face must be increased to match the section normal forcecoefficient. As the Mach number increases, the accelera-tion over the forward portion of the porous upper surfaceincreases, sometimes exceeding the suction pressurecoefficients for the solid upper surface. The compressionregion on the porous upper surface is spread over alonger portion of the chord. The compression doesbecome steeper as the Mach number increases. For these

7
cases, the trailing edge pressure does not recover to thesame level found for the solid upper surface. The lowersurface pressure coefficient distributions over the for-ward portion of the chord differ because of the differencein the angles of attack and the change in the trailing edgepressure coefficient due to porosity.
As previously indicated, porosity affects the growthof the upper surface boundary layer, and consequently,affects the pressure coefficient near the trailing edge.A comparison of the pressure coefficients near the uppersurface trailing edge (x/c = 0.99) is presented infigure 21. For the Mach numbers presented, the trailingedge pressure coefficient for the solid upper surface isrelatively constant until trailing edge separation begins.With separation, the trailing edge pressure coefficientbecomes less positive (more negative). For the porousupper surface, the trailing edge pressure coefficientsexhibit a creep at the lower section normal force coeffi-cients suggesting that the boundary layer on the rear por-tion of the airfoil is significantly thickening withincreasing normal force coefficient. The trailing edgepressure coefficient for the porous surface also exhibits arapid decrease at the higher normal force coefficients.
Wake Pressure Distributions
The shape of the total pressure profile in the airfoilwake can be used to assess the viscous and the wave dragcontributions to the total drag. Comparisons of the waketotal pressure ratio distributions for three angles of attackare presented in figure 22 for selected Mach numbersfrom 0.50 to 0.80 at a chord Reynolds number of 4× 10⁶.The profile below the peak total pressure loss is nearlythe same for the solid and the porous surfaces. This pro-file is consistent with the similar lower surface chordwisepressure distributions found for the solid and the poroussurfaces. At subcritical conditions, the peak total pres-sure loss and the thickness of the wake are larger for theporous surface. This difference indicates greater lossesfor the porous upper surface, probably due to increasedviscous losses (increased skin friction) and losses associ-ated with decelerating the flow into the cavity and accel-erating the flow out of the cavity. Measurements at aReynolds number of about 3× 10⁶ on a smooth solid anda smooth porous cylinder indicate that the skin frictionfor the porous wall is about 30 percent larger than thatfor the smooth wall (ref. 14). Thus, porosity significantlyincreases the viscous contribution to the total drag. Atsupercritical conditions, the wake profiles for the solidsurface show an additional triangular region of total pres-sure loss from the upper surface associated with the wavedrag due to the presence of shocks. Most of the wakeprofiles for the porous surface do not show the additionaltriangular region (e.g., seeα = 2° in fig. 22(d)). Exami-nation of the associated chordwise pressure distributions
(α = 2° in fig. 16) show a shock on the solid upper sur-face, but no shock on the porous upper surface. Thechordwise pressure distributions and wake profiles asso-ciated with the porous surface for more extreme cases(higher angles of attack and Mach numbers) show thatporosity does not always eliminate the shock or wavedrag. (Seeα = 4° in figs. 18 and 22(e).) Porosity reducesthe contribution of wave drag to the total drag.
Integrated Force and Moment Coefficients
Effect of Mach number.The effect of Mach numberon the integrated force and moment coefficients for theairfoil with the solid upper surface and the porous uppersurface is presented in figure 23. Results for the modelwith the solid upper surface (fig. 23(a)) follow theexpected trends. For the lower Mach numbers, the dragcoefficient is independent of the section normal forcecoefficient over the linear portion of the normal forcecurves. At transonic Mach numbers, increasing shockstrength and wave drag with increasing normal forcecoefficient leads to increasing drag. The positive slope ofthe pitching moment coefficient curve indicates that theaerodynamic center is slightly forward of the momentreference center (0.25c). The slope of the section normalforce curves increases with increasing Mach number. Asthe Mach number increases, the normal force curvebecomes nonlinear at progressively smaller angles ofattack.
Results for the model with the porous upper surface(fig. 23(b)) do not follow all of the same trends. As wasfound for the solid surface, at subcritical conditions, thenormal force curve slope at zero normal force increaseswith increasing Mach number. Unlike the results for thesolid surface, at the lower Mach numbers the drag coeffi-cient for the porous surface increases with increasingnormal force coefficient and increasing Mach number,which is a direct result of losses through the porous sur-face. At supercritical conditions, the normal force coeffi-cient at an angle of attack of 0° becomes more negativewith increasing Mach number.
Effect of Reynolds number.The effect of Reynoldsnumber on the integrated force and moment coefficientsfor the model with the solid upper surface is presented infigure 24 and for the model with the porous upper surfacein figure 25. The effect of Reynolds number on theporous surface is similar to that for the solid surface.Increasing the Reynolds number generally reduces theturbulent skin friction, and therefore, reduces the dragcoefficient at a given normal force coefficient. It has lit-tle effect on the linear portion of the normal force or onthe pitching moment curves.

8
Effect of porosity.The effect of porosity on the inte-grated force and moment coefficients is presented in fig-ure 26. In general, upper surface porosity reduces thenormal force curve slope and increases the drag at agiven section normal force coefficient. The loss in nor-mal force at a given angle of attack arises from the reduc-tion in the pressure over the forward portion of the airfoildiscussed previously. The increased drag arises from theincreased viscous drag noted in the wake pressure distri-butions. At the lower Mach numbers, porosity leads to adependence of the drag on the normal force. As the angleof attack and the normal force increase, the differencebetween the cavity pressure and the airfoil surface pres-sure increases and the flow through the porous surfaceincreases. The chordwise component of this flow must bedecelerated to zero and turned as the flow enters the cav-ity and accelerated and turned as the flow exits the cav-ity. The force required to decelerate and accelerate theflow increases the drag. Since the flow increases withnormal force, the drag also increases with normal force.At supercritical conditions, the normal force curves forthe airfoil with the porous upper surface develop a sec-ond, nearly linear segment (e.g., seeα > 3° in fig. 26(e)).The start of this second segment appears to correlate withthe formation of the localized steeper pressure gradientassociated with the presence of a weak shock and wavedrag noted in the discussion of the pressure distributions.
The effect of porosity on the variation of the sectiondrag coefficient with the free-stream Mach number attwo section normal force coefficients is presented in fig-ure 27. For this study, drag divergence is defined as thepoint on the drag coefficient versus Mach number curvewheredcd/dM∞ = 0.1. The solid surface exhibits a smallamount of drag creep at subcritical Mach numbers with adramatic increase at the transonic Mach numbers. Theporous surface exhibits a higher level of drag, a higherdrag creep, and a reduced drag divergence Mach number.For example atcn = 0 andM∞ = 0.5, the drag coefficienton the solid surface was 0.0085 and the drag coefficienton the porous surface was 0.0121. The Mach numberassociated with drag divergence decreased fromabout 0.78 for the solid surface to about 0.77 for theporous surface. Similarly atcn = 0.3 andM∞ = 0.5, thedrag coefficient on the solid surface was 0.0086 and thedrag coefficient on the porous surface was 0.0156. TheMach number associated with drag divergence decreasedfrom about 0.74 for the solid surface to about 0.70 for theporous surface. For these conditions, the increased vis-cous losses, pressure drag, and momentum losses associ-ated with the secondary flow into and out of the cavityarising from the porous surface are larger than the wavedrag reduction from the porous surface.
Effective Airfoil Shape
The pressure distribution obtained from the airfoilwith the porous upper surface could also be obtainedfrom an equivalent solid airfoil with a different uppersurface shape. The measured porous airfoil upper surfacepressure distribution was used as input to the Direct Iter-ative Surface Curvature (DISC) method described in ref-erence 15 coupled to the Euler solver described inreference 16 to obtain the new solid surface. Viscouseffects were modeled with the boundary layer displace-ment thickness by using a modified theory of Stratfordand Beavers (ref. 17). This particular combination of adesign algorithm and a flow solver was experimentallyverified in reference 18.
The airfoil design program should calculate theactual upper surface shape from the measured solid uppersurface pressure distribution. A comparison of the base-line NACA 0012 airfoil upper surface shape with the re-sulting equivalent solid upper surface shape is presentedin figure 28. The equivalent solid shapes are in goodagreement with each other and with the NACA 0012upper surface shape, thus validating the design process.
Next, the design program was used to generateequivalent solid upper surface shapes that correspond tothe measured pressure distributions from the porousupper surface. Equivalent upper surface shapes with aclosed trailing edge could not be generated for test condi-tions in which the upper surface trailing edge pressurecoefficients indicated significant separation. These sepa-rated flows were beyond the capability of the flow solverwith the attached-boundary-layer model.
A comparison of the equivalent solid upper surfaceshapes generated from the porous upper surface pressuredistributions at constant angles of attack is presented infigure 29 for several Mach numbers. At the lowest Machnumber, the addition of porosity atα = 0° leads to an air-foil that is thicker than the NACA 0012 airfoil sectionacross the midchord region but has a reduced leadingedge radius. The maximum airfoil thickness and the lead-ing edge radius decrease as the Mach number increases atboth of the angles of attack presented. The equivalentupper surface shape falls below that of the NACA 0012over the forward portion of the chord at the higher Machnumbers. Porosity leads to a desirable self-adaptive fea-ture of decreasing effective thickness with increasingMach number. A comparison of the equivalent solidupper surface shapes generated from the porous uppersurface pressure distributions at constant Mach numbersis presented in figure 30 for several angles of attack. Atboth Mach numbers presented, the maximum thicknessand the leading edge radius decrease as the angle of

9
attack increases. Thus, porosity bestows a self-adaptivequality to the airfoil, albeit at a penalty of increased dragdue to the venting losses.
Conclusions
A wind tunnel investigation was conducted on a two-dimensional airfoil model of an NACA 0012 airfoil sec-tion with a conventional solid upper surface and a porousupper surface. The purpose of the investigation was tostudy the effects of porosity on aerodynamic characteris-tics and to assess the ability of porosity to provide amultipoint or self-adaptive design. The tests were con-ducted in the Langley 8-Foot Transonic Pressure Tunnelover a Mach number range from 0.50 to 0.82 at chordReynolds numbers of 2× 10⁶, 4 × 10⁶, and 6× 10⁶. Theangle of attack was varied from−1° to 6°. The poroussurface nominally extended over the entire upper surface.When compared to the solid surface airfoil, the conclu-sions from this investigation are
1. At subcritical conditions, porosity tends to flattenthe pressure distribution, which reduces the suction peaknear the leading edge and increases the suction over themiddle portion of the chord.
2. At supercritical conditions, the compressionregion on the porous upper surface is spread over alonger portion of the chord.
3. At supercritical conditions, for the porous uppersurface, the trailing edge pressure coefficients exhibit acreep at the lower section normal force coefficients,which suggests that the boundary layer on the rear por-tion of the airfoil is significantly thickening with increas-ing normal force coefficient.
4. The pressure coefficient in the cavity is fairlyconstant with a very small increase over the rear portion,which indicates that the flow in the cavity is small.
5. Porosity reduces the lift curve slope and increasesthe drag at a given section normal force coefficient.
6. At the lower Mach numbers, porosity leads to adependence of the drag on the normal force and the Machnumber.
7. Porous airfoils exhibit an adaptive characteristicin that the thickness and the leading edge radius of anequivalent solid airfoil decrease with increasing Machnumber, albeit at a penalty of increased drag.
NASA Langley Research CenterHampton, VA 23681-0001February 2, 1996

10
Appendix A
Determination of Chordwise Spacing of Holeson Porous Surface
Symbols
b width of porous patch
D hole diameter
l length of porous patch
mass flow rate
N number of holes through porous patch
R unit Reynolds number based on free-streamconditions
equivalent normal transpiration velocity
average velocity through hole in poroussurface
V∞ free-stream velocity
∆p pressure difference across porous surface
µ∞ free-stream viscosity
ρ∞ free-stream density
ρ local density
σ permeability parameter
σmax maximum value of permeability parameter
τ thickness of porous surface
Determination of Spacing
The porous upper surface of the model was drilledwith 368 chordwise rows of holes. The effect of the dis-crete regions of flow into and out of the cavity throughthis surface is modeled by an equivalent normal transpi-ration velocity. Darcy’s law is used to relate the equiva-lent normal transpiration velocity to the pressuredifference across the porous surface:
(A1)
The flow through an individual hole can be esti-mated with the Hagen-Poiseuille solution for fully devel-oped, viscous flow through a circular pipe:
(A2)
If a porous patch of lengthl, width b, andN holes isselected, the mass flow through theN individual holesmust equal the mass flow from the equivalent transpira-tion velocity over the patch of area . Assuming thatthe selected porous patch is small enough that the pres-sure difference can be assumed constant, the equivalenceof the mass flow rates through the surface for the tworepresentations can be expressed as
(A3)
Upon substituting the expressions for from equa-tion (A1) and the expression for from equation (A2)into equation (A3), an expression is obtained that relatesthe geometric characteristics of the porous surface to thepermeability:
(A4)
Substituting for the unit Reynolds number produces
(A5)
For this study, the porous surface parameters wereτ = 0.020 in. andD = 0.010 in. The design was done at aunit Reynolds numberR of 2 × 10⁶/ft. A modified sinedistribution was chosen for the surface permeabilitydistribution:
(A6)
For this study,σmax = 0.6. The modified sine distri-bution and the value ofσmax were selected to be consis-tent with the computational study in reference 9.
The chordwise spacing of the holes can be deter-mined by selecting a section of the porous surface thatcontains one hole (N = 1). Since there are 8 longitudinalrows per inch, the width of the sectionb would be0.125 in. The length of the sectionl would be theunknown chordwise spacing. Solving equation (A5) forland substituting the value of the surface permeabilityσfrom equation (A6) for the desired chordwise locationwill yield the chordwise spacing at the selected chord-wise location:
(A7)
m
νn
ν
vnσ
ρ∞V∞--------------- ∆p⋅=
vD
2
32µ∞--------------∆p
τ-------=
l b⋅
m ρvπD
2
4----------N ρvnlb= =
νnν
πD4
128µ∞-----------------N
τ---- σ
ρ∞V∞--------------- lb=
πD4R
128--------------N
τ---- σlb=
σ σmax πx c⁄( )sin=
lNπD
4R
128τbσ-------------------=

11
References
1. Bahi, L.; Ross, J. M.; and Nagamatsu, H. T.: Passive ShockWave/Boundary Layer Control for Transonic Airfoil DragReduction. AIAA-83-0137, Jan. 1983.
2. Nagamatsu, H. T.; Trilling, T. W.; and Bossard, J. A.: PassiveDrag Reduction on a Complete NACA 0012 Airfoil at Tran-sonic Mach Numbers. AIAA-87-1263, June 1987.
3. Thiede, P.; Krogmann, P.; and Stanewsky, E.: Active and Pas-sive Shock/Boundary Layer Interaction Control on Super-critical Airfoils. Improvement of Aerodynamic PerformanceThrough Boundary Layer Control and High Lift Systems,AGARD CP-365, Aug 1984. (Available from DTIC asAD A147 396.)
4. Chen, C.-L.; Chow, C.-Y.; Holst, T. L.; and Van Dalsem,W. R.: Numerical Simulation of Transonic Flow Over PorousAirfoils. AIAA-85-5022, Oct. 1985.
5. Hsieh, Sheng-Jii; and Lee, Lung-Cheng: Numerical Simula-tion of Transonic Porous Airfoil Flows.Proceedings of theFifth International Symposium on Numerical Methods in Engi-neering—Volume 1, R. Gruber, J. Periaux, R. P. Shaw, eds.,1990, pp. 601–608.
6. Chen, Chung-Lung; Chow, Chuen-Yen; Van Dalsem,William R.; and Holst, Terry L.: Computation of ViscousTransonic Flow Over Porous Airfoils. AIAA-87-0359, Jan.1987.
7. Gillian, Mark A.: Computational Analysis of Drag Reductionand Buffet Alleviation in Viscous Transonic Flow Over PorousAirfoils. AIAA-93-3419, Aug. 1993.
8. Musat, Virgil M.: Permeable Airfoils in Incompressible Flow.J. Aircr., vol. 30, no. 3, May 1992, pp. 419–421.
9. Hartwich, Peter M.: Euler Study on Porous Transonic AirfoilsWith a View Toward Multipoint Design. AIAA-91-3286,Sept. 1991.
10. Brooks, Cuyler W., Jr.; Harris, Charles D.; and Reagon,Patricia G.:The NASA Langley 8-Foot Transonic PressureTunnel Calibration. NASA TP-3437, 1994.
11. Braslow, A. L.; and Knox, E. C.:Simplified Method for Deter-mination of Critical Height of Distributed Roughness Particlesfor Boundary-Layer Transition at Mach Numbers From 0 to 5.NACA TN-4363, 1958.
12. Baals, Donald D.; and Mourhess, Mary J.:Numerical Evalua-tion of the Wake-Survey Equations for Subsonic Flow Includ-ing the Effect of Energy Addition. NACA WR L-5 H27, 1945.
13. Harris, Charles D.:Two-Dimensional Aerodynamic Character-istics of the NACA 0012 Airfoil in the Langley 8-Foot Tran-sonic Pressure Tunnel. NASA TM-81927, 1981.
14. Kong, Fred Y.; Schetz, Joseph A.; and Collier, Fayette:Turbu-lent Boundary Layer Over Solid and Porous Surfaces WithSmall Roughness. NASA CR-3612, 1982.
15. Campbell, Richard L.:An Approach to Constrained Aero-dynamic Design With Application to Airfoils. NASA TP-3260,1992.
16. Hartwich, Peter M.: Fresh Look at Floating Shock Fitting.AIAA J., vol. 29, no. 7, July 1991, pp. 1084–1091.
17. Stratford, B. S.; and Beavers, G. S.:The Calculation of theCompressible Turbulent Boundary Layer in an Arbitrary Pres-sure—A Correlation of Certain Previous Methods. R. & M.No. 3207, British Aeronautical Research Council, 1961.
18. Mineck, Raymond E.; Campbell, Richard L.; and Allison,Dennis O.:Application of Two Procedures for Dual-PointDesign of Transonic Airfoils.NASA TP-3466, 1994.

12
Table 1. Pressure Orifice Locations
(a) Chordwise rows
Upper surfacex/c Lower surfacex/c Cavityx/c
0.0001 0.3503 0.7200 0.3500 0.7200 0.033
0.0029 0.3802 0.7401 0.3799 0.7400 0.105
0.0062 0.4102 0.7601 0.0068 0.4099 0.7599 0.176
0.0133 0.4352 0.7801 0.0136 0.4349 0.7799 0.246
0.0212 0.4601 0.8001 0.0216 0.4600 0.8000 0.315
0.0305 0.4801 0.8200 0.0306 0.4800 0.8200 0.384
0.0404 0.5002 0.8400 0.0398 0.5000 0.8401 0.452
0.0604 0.5202 0.8600 0.0599 0.5199 0.8601 0.520
0.0804 0.5400 0.8800 0.0799 0.5399 0.8795 0.587
0.1004 0.5602 0.8998 0.1000 0.5600 0.9007 0.654
0.1252 0.5802 0.9201 0.1249 0.5801 0.9209 0.721
0.1504 0.6001 0.9399 0.1500 0.6000 0.9408 0.789
0.1803 0.6201 0.9598 0.1799 0.6200 0.9609 0.856
0.2153 0.6401 0.9746 0.2150 0.6400 0.9759 0.923
0.2502 0.6601 0.9899 0.2500 0.6600 0.9908
0.2853 0.6801 0.2850 0.6800
0.3202 0.6999 0.3200 0.7000
(b) Spanwise rows
Upper surfaceη at— Lower surfaceη at—
x/c= 0.8 x/c= 0.9 x/c= 0.8 x/c= 0.9
−0.468 −0.456 −0.456 −0.456
−0.350 −0.340 −0.340 −0.340
−0.234 −0.222 −0.222 −0.222
−0.116 −0.106 −0.106 −0.106
0.116 0.106 0.106 0.106
0.234 0.222 0.222 0.222
0.350 0.340 0.340 0.340
0.468 0.456 0.456 0.456

13
Table 2. Wake Rake Pressure Tube Locations
(a) Total pressure tubes (b) Static pressure tubes
z, in. z, in.
17.685 2.295 0.540 −0.540 −2.295 10.015
15.885 2.475 0.450 −0.630 −2.475 4.015
14.085 1.935 0.360 −0.720 −2.655 1.665
12.285 1.755 0.270 −0.810 −3.285 0.000
10.485 1.575 0.180 −0.900 −4.365 −1.665
8.685 1.395 0.090 −1.035 −5.445 −4.015
6.885 1.215 0.000 −1.215 −6.885 −10.015
5.445 1.035 −0.090 −1.395 −8.685
4.365 0.900 −0.180 −1.575 −10.485
3.285 0.810 −0.270 −1.755 −12.285
2.655 0.720 −0.360 −1.935 −14.085
2.475 0.630 −0.450 −2.115 −15.885
−17.685
Table 3. Nominal Test Conditions
M∞
Rc
2 × 10⁶ 4 × 10⁶ 6 × 10⁶
0.50 X X X
0.60 X X X
0.65 X X X
0.70 X X X
0.74 X X
0.76 X X
0.78 X X
0.80 X X
0.82 X X

14
(a) Narrow porous strip for shock venting.
(b) Full chord porous upper surface.
Figure 1. Airfoil with porous surface in transonic flow.
Porous strip
λ shock wave
Cavity
α
x
y
Porous surface
Cavity
α
x
y

15
L-93-00490(a) Model installation.
Figure 2. Photographs of model in 8-ft TPT.
Angle-of-attack plate
Main spar
Flow
Porous insert
Wake rake

16
L-93-00491(b) Close-up of porous surface.
Figure 2. Concluded.
Flow

17
(a) Top view of model.
(b) Cross section of model.
Figure 3. Details of model. All dimensions are in inches.
����
��
���
���
����
���
���
��
~
Interchangeablecenterinsert
Solid NACA 0012 airfoil
Angle-of-attack plates
Spanwise tunnel width
50
40
M∞
30
20
10
22.520
25Pressure
taps
����
���
Holediameter
0.010
Detail
Maximumthickness
3
Chord 25.00
Cavity depth
Skin thickness 0.020
Chordwisespacing
Spanwisespacing0.125
Main spar
~
Interchangeableinsert
~
0.125

18
(c) Cross section of cavities.
Figure 3. Concluded.
�
���
�����
�������
��������
������
����
��
�
���
�����
�������
��������
��������
��������
��������
�������
����
��
0.94
0.06Spanwisespacing0.125
Skinthickness
0.020
Cavity pressure orificed0.47
Cavitydepth
Surface holes0.010 diameter
Modelcenterline

19
Figure 4. Deviation of model shape from design NACA 0012 shape.
0 .2 .4 .6 .8 1.0x/c
.001
∆y/c
Surface
Lower
Upper
η = -0.35
0 .2 .4 .6 .8 1.0x/c
∆y/c
η = 0
0 .2 .4 .6 .8 1.0x/c
∆y/c
η = 0.35
0
-.001
.001
0
-.001
.001
0
-.001

20
Figure 5. Details of wake rake. All dimensions in inches.
6.00
1.75
0.750.50Detail of
static pressure tubeStatic
orifices (7)
1.00
Detail oftotal pressure tube
y = 0
+y
Model supportcenterline
4.92
36.03
13.11
Totalpressure
tube
Staticpressure
tube

21
L-93-00493Figure 6. Photograph of wake rake in 8-ft TPT.
Wake rake
Total pressure tube
Flow
Static pressure tube

22
(a) Rc = 4× 10⁶.
Figure 7. Effect of rake position on integrated force and moment coefficients of baseline porous airfoil.α = 0°.
.3 .4 .5 .6 .7 .8 .9
M∞
.010
.015
.020
.025
.030
.035
cd
Rake position
25.0
37.5
-.02
0
.02
.04
cm
cn
-.10
-.05
0
.05

23
(b) Rc = 6× 10⁶.
Figure 7. Concluded.
Rake position
25.0
37.5
.3 .4 .5 .6 .7 .8 .9
M∞
.010
.015
.020
.025
.030
.035
cd
-.02
0
.02
.04
cm
cn
-.10
-.05
0
.05

24
(a) M∞ = 0.50.
Figure 8. Comparison of integrated force and moment coefficients with previous test results for solid surface.
-1 0 1 2 3 4 5 6
α, deg
cn
.005 .010 .015 .020 .025 .030 .035 .040 .045
cd
Test
Current Ref. 13
4 3
.02
cm Rc × 10-60
-.02
.7
.6
.5
4
.3
.2
.1
0
-.1

25
(b) M∞ = 0.70.
Figure 8. Continued.
Current Ref. 13
4 3
-1 0 1 2 3 4 5 6
α, deg
cn
.005 .010 .015 .020 .025 .030 .035 .040 .045
cd
Test
.02
cm Rc × 10-60
-.02
.7
.6
.5
4
.3
.2
.1
0
-.1

26
(c) M∞ = 0.80.
Figure 8. Concluded.
Current Ref. 13
4 3
-1 0 1 2 3 4 5 6
α, deg
cn
.005 .010 .015 .020 .025 .030 .035 .040 .045
cd
Test
.02
cm Rc × 10-60
-.02
.7
.6
.5
4
.3
.2
.1
0
-.1

27
Figure 9. Spanwise surface pressure coefficient distributions for upper surface.x/c = 0.8;Rc = 4× 10⁶.
-.6 -.4 -.2 0 .2 .4 .6 η
.2
0
-.2
-.4
-.6
Cp
M∞ = 0.50
Solid surface
-.6 -.4 -.2 0 .2 .4 .6 η
.2
0
-.2
-.4
-.6
Cp
M∞ = 0.74
-.6 -.4 -.2 0 .2 .4 .6 η
.2
0
-.2
-.4
-.6
Cp
M∞ = 0.82
-.6 -.4 -.2 0 .2 .4 .6 η
.2
0
-.2
-.4
-.6
Cp
α, deg
0 1 2 3 4 5 6
M∞ = 0.50
Porous surface
-.6 -.4 -.2 0 .2 .4 .6 η
.2
0
-.2
-.4
-.6
Cp
M∞ = 0.74
-.6 -.4 -.2 0 .2 .4 .6 η
.2
0
-.2
-.4
-.6
Cp
M∞ = 0.82

28
Figure 10. Repeatability of integrated force and moment coefficients of porous airfoil.α = 0°; Rc = 6× 10⁶.
Run
4
76
.3 .4 .5 .6 .7 .8 .9
M∞
.010
.015
.020
.025
.030
.035
cd
-.02
0
.02
.04
cm
cn
-.10
-.05
0
.05

29
Figure 11. Chordwise surface and cavity pressure coefficient distributions on NACA 0012 with solid and porous upper surface.M∞ = 0.50;Rc = 4× 10⁶. Open symbol denotes upper surface, ‘+’ in symbol denotes lower surface, and solid symbol denotes cavity.
0 .1 .2 .3 .4 .5 .6 .7 .8 .9 1.0 x/c
1.2
.8
.4
0
-.4
-.8
-1.2
-1.6
-2.0
Cp
1 -1
0.116 -0.088
0 .1 .2 .3 .4 .5 .6 .7 .8 .9 1.0 x/c
1.2
.8
.4
0
-.4
-.8
-1.2
-1.6
-2.0
Cp
0 0
Surface
Solid Porous
α, deg cn
0.010 0.013
0 .1 .2 .3 .4 .5 .6 .7 .8 .9 1.0 x/c
1.2
.8
.4
0
-.4
-.8
-1.2
-1.6
-2.0
Cp
1 1
0.116 0.112
0 .1 .2 .3 .4 .5 .6 .7 .8 .9 1.0 x/c
1.2
.8
.4
0
-.4
-.8
-1.2
-1.6
-2.0
Cp
2 2
0.220 0.209
Surface
Solid Porous
α, deg cn
Surface
Solid Porous
α, deg cn Surface
Solid Porous
α, deg cn

30
Figure 11. Concluded.
0 .1 .2 .3 .4 .5 .6 .7 .8 .9 1.0 x/c
1.2
.8
.4
0
-.4
-.8
-1.2
-1.6
-2.0
Cp
3 3
0.321 0.310
0 .1 .2 .3 .4 .5 .6 .7 .8 .9 1.0 x/c
1.2
.8
.4
0
-.4
-.8
-1.2
-1.6
-2.0
Cp
4 4
0.428 0.407
0 .1 .2 .3 .4 .5 .6 .7 .8 .9 1.0 x/c
1.2
.8
.4
0
-.4
-.8
-1.2
-1.6
-2.0
Cp
5 5
0.539 0.499
0 .1 .2 .3 .4 .5 .6 .7 .8 .9 1.0 x/c
1.2
.8
.4
0
-.4
-.8
-1.2
-1.6
-2.0
Cp
6 0.586
Surface
Solid Porous
α, deg cnSurface
Solid Porous
α, deg cn
Surface
Solid Porous
α, deg cn Surface
Porous
α, deg cn

31
Figure 12. Chordwise surface and cavity pressure coefficient distributions on NACA 0012 with solid and porous upper surface. M∞ = 0.60;Rc = 4× 10⁶. Open symbol denotes upper surface, ‘+’ in symbol denotes lower surface, and solid symbol denotes cavity.
0 .1 .2 .3 .4 .5 .6 .7 .8 .9 1.0 x/c
1.2
.8
.4
0
-.4
-.8
-1.2
-1.6
-2.0
Cp
1 -1
0.124 -0.097
0 .1 .2 .3 .4 .5 .6 .7 .8 .9 1.0 x/c
1.2
.8
.4
0
-.4
-.8
-1.2
-1.6
-2.0
Cp
0 0
0.011 0.012 Cp*
0 .1 .2 .3 .4 .5 .6 .7 .8 .9 1.0 x/c
1.2
.8
.4
0
-.4
-.8
-1.2
-1.6
-2.0
Cp
1 1
0.124 0.116
0 .1 .2 .3 .4 .5 .6 .7 .8 .9 1.0 x/c
1.2
.8
.4
0
-.4
-.8
-1.2
-1.6
-2.0
Cp
2 2
0.234 0.219 Cp*
Cp*
Cp*
Surface
Solid Porous
α, deg cnSurface
Solid Porous
α, deg cn
Surface
Solid Porous
α, deg cn Surface
Solid Porous
α, deg cn

32
Figure 12. Concluded.
0 .1 .2 .3 .4 .5 .6 .7 .8 .9 1.0 x/c
1.2
.8
.4
0
-.4
-.8
-1.2
-1.6
-2.0
Cp
3 3
0.342 0.321
0 .1 .2 .3 .4 .5 .6 .7 .8 .9 1.0 x/c
1.2
.8
.4
0
-.4
-.8
-1.2
-1.6
-2.0
Cp
4 4
0.466 0.419
0 .1 .2 .3 .4 .5 .6 .7 .8 .9 1.0 x/c
1.2
.8
.4
0
-.4
-.8
-1.2
-1.6
-2.0
Cp
5 5
0.577 0.511
0 .1 .2 .3 .4 .5 .6 .7 .8 .9 1.0 x/c
1.2
.8
.4
0
-.4
-.8
-1.2
-1.6
-2.0
Cp
6 0.571
Cp*
Cp*
Cp*
Cp*
Surface
Solid Porous
α, deg cnSurface
Solid Porous
α, deg cn
Surface
Solid Porous
α, deg cn Surface
Porous
α, deg cn
33
Figure 13. Chordwise surface and cavity pressure coefficient distributions on NACA 0012 with solid and porous upper surface.M∞ = 0.65;Rc = 4× 10⁶. Open symbol denotes upper surface, ‘+’ in symbol denotes lower surface, and solid symbol denotes cavity.
0 .1 .2 .3 .4 .5 .6 .7 .8 .9 1.0 x/c
1.2
.8
.4
0
-.4
-.8
-1.2
-1.6
-2.0
Cp
1 -1
0.129 -0.104
0 .1 .2 .3 .4 .5 .6 .7 .8 .9 1.0 x/c
1.2
.8
.4
0
-.4
-.8
-1.2
-1.6
-2.0
Cp
0 0
0.012 0.009
0 .1 .2 .3 .4 .5 .6 .7 .8 .9 1.0 x/c
1.2
.8
.4
0
-.4
-.8
-1.2
-1.6
-2.0
Cp
1 1
0.129 0.118
0 .1 .2 .3 .4 .5 .6 .7 .8 .9 1.0 x/c
1.2
.8
.4
0
-.4
-.8
-1.2
-1.6
-2.0
Cp
2 2
0.246 0.223
Cp*
Cp*
Cp*
Cp*
Surface
Solid Porous
α, deg cnSurface
Solid Porous
α, deg cn
Surface
Solid Porous
α, deg cn Surface
Solid Porous
α, deg cn

34
Figure 13. Concluded.
0 .1 .2 .3 .4 .5 .6 .7 .8 .9 1.0 x/c
1.2
.8
.4
0
-.4
-.8
-1.2
-1.6
-2.0
Cp
3 3
0.363 0.326
0 .1 .2 .3 .4 .5 .6 .7 .8 .9 1.0 x/c
1.2
.8
.4
0
-.4
-.8
-1.2
-1.6
-2.0
Cp
4 4
0.482 0.424
0 .1 .2 .3 .4 .5 .6 .7 .8 .9 1.0 x/c
1.2
.8
.4
0
-.4
-.8
-1.2
-1.6
-2.0
Cp
5 5
0.613 0.491
0 .1 .2 .3 .4 .5 .6 .7 .8 .9 1.0 x/c
1.2
.8
.4
0
-.4
-.8
-1.2
-1.6
-2.0
Cp
6 0.516
Cp*
Cp*
Cp*
Cp*
Surface
Solid Porous
α, deg cnSurface
Solid Porous
α, deg cn
Surface
Solid Porous
α, deg cn Surface
Porous
α, deg cn

35
Figure 14. Chordwise surface and cavity pressure coefficient distributions on NACA 0012 with solid and porous upper surface.M∞ = 0.70;Rc = 4× 10⁶. Open symbol denotes upper surface, ‘+’ in symbol denotes lower surface, and solid symbol denotes cavity.
0 .1 .2 .3 .4 .5 .6 .7 .8 .9 1.0 x/c
1.2
.8
.4
0
-.4
-.8
-1.2
-1.6
-2.0
Cp
1 -1
0.138 -0.113
0 .1 .2 .3 .4 .5 .6 .7 .8 .9 1.0 x/c
1.2
.8
.4
0
-.4
-.8
-1.2
-1.6
-2.0
Cp
0 0
0.013 0.005
0 .1 .2 .3 .4 .5 .6 .7 .8 .9 1.0 x/c
1.2
.8
.4
0
-.4
-.8
-1.2
-1.6
-2.0
Cp
1 1
0.138 0.118
0 .1 .2 .3 .4 .5 .6 .7 .8 .9 1.0 x/c
1.2
.8
.4
0
-.4
-.8
-1.2
-1.6
-2.0
Cp
2 2
0.266 0.225
Cp*
Cp*
Cp*
Cp*
Surface
Solid Porous
α, deg cnSurface
Solid Porous
α, deg cn
Surface
Solid Porous
α, deg cn Surface
Solid Porous
α, deg cn

36
Figure 14. Concluded.
0 .1 .2 .3 .4 .5 .6 .7 .8 .9 1.0 x/c
1.2
.8
.4
0
-.4
-.8
-1.2
-1.6
-2.0
Cp
3 3
0.389 0.327
0 .1 .2 .3 .4 .5 .6 .7 .8 .9 1.0 x/c
1.2
.8
.4
0
-.4
-.8
-1.2
-1.6
-2.0
Cp
4 4
0.526 0.402
0 .1 .2 .3 .4 .5 .6 .7 .8 .9 1.0 x/c
1.2
.8
.4
0
-.4
-.8
-1.2
-1.6
-2.0
Cp
5 5
0.641 0.425
0 .1 .2 .3 .4 .5 .6 .7 .8 .9 1.0 x/c
1.2
.8
.4
0
-.4
-.8
-1.2
-1.6
-2.0
Cp
6 0.459
Cp*
Cp*
Cp*
Cp*
Surface
Solid Porous
α, deg cnSurface
Solid Porous
α, deg cn
Surface
Solid Porous
α, deg cn Surface
Porous
α, deg cn

37
Figure 15. Chordwise surface and cavity pressure coefficient distributions on NACA 0012 with solid and porous upper surface.M∞ = 0.74;Rc = 4× 10⁶. Open symbol denotes upper surface, ‘+’ in symbol denotes lower surface, and solid symbol denotes cavity.
0 .1 .2 .3 .4 .5 .6 .7 .8 .9 1.0 x/c
1.2
.8
.4
0
-.4
-.8
-1.2
-1.6
-2.0
Cp
1 -1
0.147 -0.126
0 .1 .2 .3 .4 .5 .6 .7 .8 .9 1.0 x/c
1.2
.8
.4
0
-.4
-.8
-1.2
-1.6
-2.0
Cp
0 0
0.014 -0.002
0 .1 .2 .3 .4 .5 .6 .7 .8 .9 1.0 x/c
1.2
.8
.4
0
-.4
-.8
-1.2
-1.6
-2.0
Cp
1 1
0.147 0.114
0 .1 .2 .3 .4 .5 .6 .7 .8 .9 1.0 x/c
1.2
.8
.4
0
-.4
-.8
-1.2
-1.6
-2.0
Cp
2 2
0.290 0.218
Cp*
Cp*
Cp*
Cp*
Surface
Solid Porous
α, deg cnSurface
Solid Porous
α, deg cn
Surface
Solid Porous
α, deg cn Surface
Solid Porous
α, deg cn

38
Figure 15. Concluded.
0 .1 .2 .3 .4 .5 .6 .7 .8 .9 1.0 x/c
1.2
.8
.4
0
-.4
-.8
-1.2
-1.6
-2.0
Cp
3 3
0.412 0.296
0 .1 .2 .3 .4 .5 .6 .7 .8 .9 1.0 x/c
1.2
.8
.4
0
-.4
-.8
-1.2
-1.6
-2.0
Cp
4 4
0.529 0.336
0 .1 .2 .3 .4 .5 .6 .7 .8 .9 1.0 x/c
1.2
.8
.4
0
-.4
-.8
-1.2
-1.6
-2.0
Cp
5 5
0.574 0.371
0 .1 .2 .3 .4 .5 .6 .7 .8 .9 1.0 x/c
1.2
.8
.4
0
-.4
-.8
-1.2
-1.6
-2.0
Cp
6 0.410
Cp*
Cp*
Cp*
Cp*
Surface
Solid Porous
α, deg cnSurface
Solid Porous
α, deg cn
Surface
Solid Porous
α, deg cn Surface
Porous
α, deg cn

39
Figure 16. Chordwise surface and cavity pressure coefficient distributions on NACA 0012 with solid and porous upper surface.M∞ = 0.76;Rc = 4× 10⁶. Open symbol denotes upper surface, ‘+’ in symbol denotes lower surface, and solid symbol denotes cavity.
0 .1 .2 .3 .4 .5 .6 .7 .8 .9 1.0 x/c
1.2
.8
.4
0
-.4
-.8
-1.2
-1.6
-2.0
Cp
1 -1
0.157 -0.138
0 .1 .2 .3 .4 .5 .6 .7 .8 .9 1.0 x/c
1.2
.8
.4
0
-.4
-.8
-1.2
-1.6
-2.0
Cp
0 0
0.015 -0.009
0 .1 .2 .3 .4 .5 .6 .7 .8 .9 1.0 x/c
1.2
.8
.4
0
-.4
-.8
-1.2
-1.6
-2.0
Cp
1 1
0.157 0.106
0 .1 .2 .3 .4 .5 .6 .7 .8 .9 1.0 x/c
1.2
.8
.4
0
-.4
-.8
-1.2
-1.6
-2.0
Cp
2 2
0.299 0.203
Cp*
Cp*
Cp*
Cp*
Surface
Solid Porous
α, deg cnSurface
Solid Porous
α, deg cn
Surface
Solid Porous
α, deg cn Surface
Solid Porous
α, deg cn

40
Figure 16. Concluded.
0 .1 .2 .3 .4 .5 .6 .7 .8 .9 1.0 x/c
1.2
.8
.4
0
-.4
-.8
-1.2
-1.6
-2.0
Cp
3 3
0.416 0.258
0 .1 .2 .3 .4 .5 .6 .7 .8 .9 1.0 x/c
1.2
.8
.4
0
-.4
-.8
-1.2
-1.6
-2.0
Cp
4 4
0.507 0.302
0 .1 .2 .3 .4 .5 .6 .7 .8 .9 1.0 x/c
1.2
.8
.4
0
-.4
-.8
-1.2
-1.6
-2.0
Cp
5 5
0.508 0.339
0 .1 .2 .3 .4 .5 .6 .7 .8 .9 1.0 x/c
1.2
.8
.4
0
-.4
-.8
-1.2
-1.6
-2.0
Cp
6 0.384
Cp*
Cp*
Cp*
Cp*
Surface
Solid Porous
α, deg cnSurface
Solid Porous
α, deg cn
Surface
Solid Porous
α, deg cn Surface
Porous
α, deg cn

41
Figure 17. Chordwise surface and cavity pressure coefficient distributions on NACA 0012 with solid and porous upper surface.M∞ = 0.78;Rc = 4× 10⁶. Open symbol denotes upper surface, ‘+’ in symbol denotes lower surface, and solid symbol denotes cavity.
0 .1 .2 .3 .4 .5 .6 .7 .8 .9 1.0 x/c
1.2
.8
.4
0
-.4
-.8
-1.2
-1.6
-2.0
Cp
1 -1
0.164 -0.153
0 .1 .2 .3 .4 .5 .6 .7 .8 .9 1.0 x/c
1.2
.8
.4
0
-.4
-.8
-1.2
-1.6
-2.0
Cp
0 0
0.016 -0.023
0 .1 .2 .3 .4 .5 .6 .7 .8 .9 1.0 x/c
1.2
.8
.4
0
-.4
-.8
-1.2
-1.6
-2.0
Cp
1 1
0.164 0.089
0 .1 .2 .3 .4 .5 .6 .7 .8 .9 1.0 x/c
1.2
.8
.4
0
-.4
-.8
-1.2
-1.6
-2.0
Cp
2 2
0.303 0.165
Cp*
Cp*
Cp*
Cp*
Surface
Solid Porous
α, deg cnSurface
Solid Porous
α, deg cn
Surface
Solid Porous
α, deg cn Surface
Solid Porous
α, deg cn

42
Figure 17. Concluded.
0 .1 .2 .3 .4 .5 .6 .7 .8 .9 1.0 x/c
1.2
.8
.4
0
-.4
-.8
-1.2
-1.6
-2.0
Cp
3 3
0.402 0.219
0 .1 .2 .3 .4 .5 .6 .7 .8 .9 1.0 x/c
1.2
.8
.4
0
-.4
-.8
-1.2
-1.6
-2.0
Cp
4 4
0.427 0.262
0 .1 .2 .3 .4 .5 .6 .7 .8 .9 1.0 x/c
1.2
.8
.4
0
-.4
-.8
-1.2
-1.6
-2.0
Cp
5 5
0.440 0.310
0 .1 .2 .3 .4 .5 .6 .7 .8 .9 1.0 x/c
1.2
.8
.4
0
-.4
-.8
-1.2
-1.6
-2.0
Cp
6 0.365
Cp*
Cp*
Cp*
Cp*
Surface
Solid Porous
α, deg cnSurface
Solid Porous
α, deg cn
Surface
Solid Porous
α, deg cn Surface
Porous
α, deg cn

43
Figure 18. Chordwise surface and cavity pressure coefficient distributions on NACA 0012 with solid and porous upper surface.M∞ = 0.80;Rc = 4× 10⁶. Open symbol denotes upper surface, ‘+’ in symbol denotes lower surface, and solid symbol denotes cavity.
0 .1 .2 .3 .4 .5 .6 .7 .8 .9 1.0 x/c
1.2
.8
.4
0
-.4
-.8
-1.2
-1.6
-2.0
Cp
1 -1
0.160 -0.168
0 .1 .2 .3 .4 .5 .6 .7 .8 .9 1.0 x/c
1.2
.8
.4
0
-.4
-.8
-1.2
-1.6
-2.0
Cp
0 0
0.013 -0.048
0 .1 .2 .3 .4 .5 .6 .7 .8 .9 1.0 x/c
1.2
.8
.4
0
-.4
-.8
-1.2
-1.6
-2.0
Cp
1 1
0.160 0.042
0 .1 .2 .3 .4 .5 .6 .7 .8 .9 1.0 x/c
1.2
.8
.4
0
-.4
-.8
-1.2
-1.6
-2.0
Cp
2 2
0.290 0.108
Cp*
Cp*
Cp*
Cp*
Surface
Solid Porous
α, deg cnSurface
Solid Porous
α, deg cn
Surface
Solid Porous
α, deg cn Surface
Solid Porous
α, deg cn

44
Figure 18. Concluded.
0 .1 .2 .3 .4 .5 .6 .7 .8 .9 1.0 x/c
1.2
.8
.4
0
-.4
-.8
-1.2
-1.6
-2.0
Cp
3 3
0.346 0.169
0 .1 .2 .3 .4 .5 .6 .7 .8 .9 1.0 x/c
1.2
.8
.4
0
-.4
-.8
-1.2
-1.6
-2.0
Cp
4 4
0.349 0.228
0 .1 .2 .3 .4 .5 .6 .7 .8 .9 1.0 x/c
1.2
.8
.4
0
-.4
-.8
-1.2
-1.6
-2.0
Cp
5 5
0.387 0.283
0 .1 .2 .3 .4 .5 .6 .7 .8 .9 1.0 x/c
1.2
.8
.4
0
-.4
-.8
-1.2
-1.6
-2.0
Cp
6 0.338
Cp*
Cp*
Cp*
Cp*
Surface
Solid Porous
α, deg cnSurface
Solid Porous
α, deg cn
Surface
Solid Porous
α, deg cn Surface
Porous
α, deg cn

45
Figure 19. Chordwise surface and cavity pressure coefficient distributions on NACA 0012 with solid and porous upper surface.M∞ = 0.82;Rc = 4× 10⁶. Open symbol denotes upper surface, ‘+’ in symbol denotes lower surface, and solid symbol denotes cavity.
0 .1 .2 .3 .4 .5 .6 .7 .8 .9 1.0 x/c
1.2
.8
.4
0
-.4
-.8
-1.2
-1.6
-2.0
Cp
1 -1
0.137 -0.180
0 .1 .2 .3 .4 .5 .6 .7 .8 .9 1.0 x/c
1.2
.8
.4
0
-.4
-.8
-1.2
-1.6
-2.0
Cp
0 0
0.011 -0.097
0 .1 .2 .3 .4 .5 .6 .7 .8 .9 1.0 x/c
1.2
.8
.4
0
-.4
-.8
-1.2
-1.6
-2.0
Cp
1 1
0.137 -0.027
0 .1 .2 .3 .4 .5 .6 .7 .8 .9 1.0 x/c
1.2
.8
.4
0
-.4
-.8
-1.2
-1.6
-2.0
Cp
2 2
0.221 0.045
Cp*
Cp*
Cp*
Cp*
Surface
Solid Porous
α, deg cnSurface
Solid Porous
α, deg cn
Surface
Solid Porous
α, deg cn Surface
Solid Porous
α, deg cn

46
Figure 19. Concluded.
0 .1 .2 .3 .4 .5 .6 .7 .8 .9 1.0 x/c
1.2
.8
.4
0
-.4
-.8
-1.2
-1.6
-2.0
Cp
3 3
0.251 0.112
0 .1 .2 .3 .4 .5 .6 .7 .8 .9 1.0 x/c
1.2
.8
.4
0
-.4
-.8
-1.2
-1.6
-2.0
Cp
4 0.184
Cp* Cp*
Surface
Porous
α, deg cnSurface
Solid Porous
α, deg cn

47
Figure 20. Effect of porosity on chordwise surface pressure coefficient distributions.cn ≈ 0.3;Rc = 4× 10⁶. Open symbol denotesupper surface, ‘+’ in symbol denotes lower surface, and solid symbol denotes cavity.
0 .1 .2 .3 .4 .5 .6 .7 .8 .9 1.0 x/c
.4
.2
0
-.2
-.4
-.6
-.8
-1.0
-1.2
-1.4
Cp
Surface
Solid Porous
α, deg
3 3
cn
0.321 0.310
M∞ = 0.50
0 .1 .2 .3 .4 .5 .6 .7 .8 .9 1.0 x/c
.4
.2
0
-.2
-.4
-.6
-.8
-1.0
-1.2
-1.4
Cp
Surface
Solid Porous
α, deg
2 3
cn
0.290 0.296
MMM∞ = 0.74
0 .1 .2 .3 .4 .5 .6 .7 .8 .9 1.0 .4
.2
0
-.2
-.4
-.6
-.8
-1.0
-1.2
-1.4
Cp
Surface
Solid Porous
α, deg
2 4
cn
0.299 0.302
MMM∞ = 0.76
0 .1 .2 .3 .4 .5 .6 .7 .8 .9 1.0 .4
.2
0
-.2
-.4
-.6
-.8
-1.0
-1.2
-1.4
Cp
Surface
Solid Porous
α, deg
2 5
cn
0.303 0.310
MMM∞ = 0.78
Cp*
Cp* Cp*

48
Figure 21. Effect of porosity on upper surface pressure coefficient near trailing edge.Rc = 4 × 10⁶. Open symboldenotes solid upper surface and ‘+’ in symbol denotes porous upper surface.
-.2 -.1 0 .1 .2 .3 .4 .5 .6
cn
Cp,te
0
0
0
0
0
M∞
0.50
0.60
0.70
0.74
0.78
0.80
.2
0
-.2
-.4

49
(a) M∞ = 0.50.
Figure 22. Effect of porosity on total pressure profiles in airfoil wake.Rc = 4× 10⁶.
1.00 .99 .98 .97
pt/pt,∞
-1.2
-1.1
-1.0
-.9
-.8
-.7
-.6
-.5
-.4
-.3
-.2
-.1
0
.1
.2
.3
.4
y/c
1.00 .99 .98 .97
pt/pt,∞
1.00 .99 .98 .97 .96 .95 .94 .93 .92 .91 .90
pt/pt,∞
Surface
Solid Porous Solid Porous Solid Porous
α, deg
0 0 2 2 4 4
cd
0.0085 0.0122 0.0090 0.0143 0.0094 0.0184

50
(b) M∞ = 0.60.
Figure 22. Continued.
1.00 .99 .98 .97 -1.2
-1.1
-1.0
-.9
-.8
-.7
-.6
-.5
-.4
-.3
-.2
-.1
0
.1
.2
.3
.4
y/c
1.00 .99 .98 .97 1.00 .99 .98 .97 .96 .95 .94 .93 .92 .91 .90
Surface
Solid Porous Solid Porous Solid Porous
α, deg
0 0 2 2 4 4
cd
0.0087 0.0129 0.0092 0.0154 0.0096 0.0208
pt/pt,∞ pt/pt,∞ pt/pt,∞
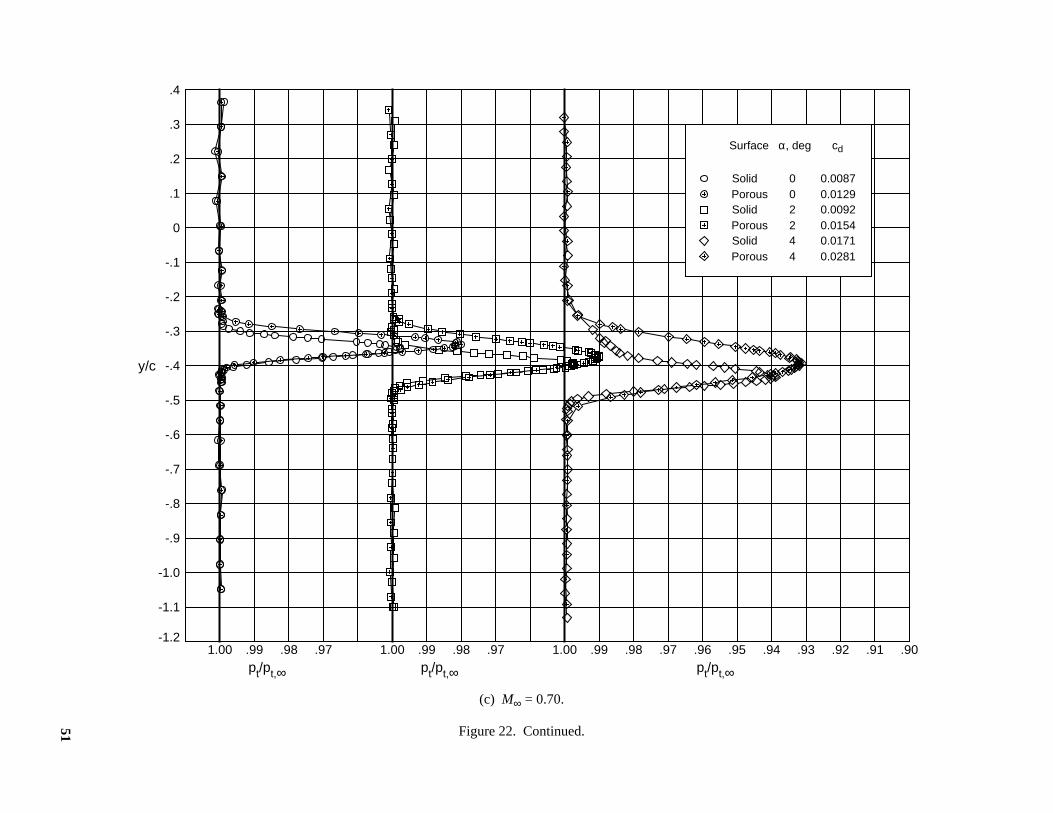
51
(c) M∞ = 0.70.
Figure 22. Continued.
1.00 .99 .98 .97 -1.2
-1.1
-1.0
-.9
-.8
-.7
-.6
-.5
-.4
-.3
-.2
-.1
0
.1
.2
.3
.4
y/c
1.00 .99 .98 .97 1.00 .99 .98 .97 .96 .95 .94 .93 .92 .91 .90
Surface
Solid Porous Solid Porous Solid Porous
α, deg
0 0 2 2 4 4
cd
0.0087 0.0129 0.0092 0.0154 0.0171 0.0281
pt/pt,∞ pt/pt,∞ pt/pt,∞

52
(d) M∞ = 0.76.
Figure 22. Continued.
1.00 .99 .98 .97 -1.2
-1.1
-1.0
-.9
-.8
-.7
-.6
-.5
-.4
-.3
-.2
-.1
0
.1
.2
.3
.4
y/c
1.00 .99 .98 .97 1.00 .99 .98 .97 .96 .95 .94 .93 .92 .91 .90
Surface
Solid Porous Solid Porous Solid Porous
α, deg
0 0 2 2 4 4
cd
0.0087 0.0129 0.0092 0.0154 0.0341 0.0332
pt/pt,∞ pt/pt,∞ pt/pt,∞

53
(e) M∞ = 0.80.
Figure 22. Concluded.
1.00 .99 .98 .97 -1.2
-1.1
-1.0
-.9
-.8
-.7
-.6
-.5
-.4
-.3
-.2
-.1
0
.1
.2
.3
.4
y/c
1.00 .99 .98 .97 1.00 .99 .98 .97 .96 .95 .94 .93 .92 .91 .90
Surface
Solid Porous Solid Porous Solid Porous
α, deg
0 0 2 2 4 4
cd
0.0087 0.0129 0.0092 0.0154 0.0447 0.0393
pt/pt,∞ pt/pt,∞ pt/pt,∞

54
(a) Solid surface.
Figure 23. Effect of Mach number on integrated force and moment coefficients.Rc = 4× 10⁶.
M∞
0.50 0.60 0.65 0.70 0.74 0.76 0.78 0.80 0.82
-1 0 1 2 3 4 5 6
α, deg
cn
.005 .010 .015 .020 .025 .030 .035 .040 .045
cd
.02
cm
0
-.02
.7
.6
.5
4
.3
.2
.1
0
-.1
.04

55
(b) Porous surface.
Figure 23. Concluded.
-1 0 1 2 3 4 5 6 .010 .015 .020 .025 .030 .035 .040 .045 .050
M∞
0.50 0.60 0.65 0.70 0.74 0.76 0.78 0.80 0.82
α, deg
cn
cd
.02
cm
0
-.02
.6
.5
4
.3
.2
.1
0
-.1
.04
-.2

56
(a) M∞ = 0.50.
Figure 24. Effect of Reynolds number on integrated force and moment coefficients for solid upper surface.
Rc × 10-6
2 4 6
-1 0 1 2 3 4 5 6
α, deg
cn
.005 .010 .015 .020 .025 .030 .035 .040 .045
cd
.02
cm 0
-.02
.7
.6
.5
4
.3
.2
.1
0
-.1

57
(b) M∞ = 0.60.
Figure 24. Continued.
2 4 6
Rc × 10-6
-1 0 1 2 3 4 5 6
α, deg
cn
.005 .010 .015 .020 .025 .030 .035 .040 .045
cd
.02
cm 0
-.02
.7
.6
.5
4
.3
.2
.1
0
-.1

58
(c) M∞ = 0.65.
Figure 24. Continued.
2 4 6
Rc × 10-6
-1 0 1 2 3 4 5 6
α, deg
cn
.005 .010 .015 .020 .025 .030 .035 .040 .045
cd
.02
cm 0
-.02
.7
.6
.5
4
.3
.2
.1
0
-.1

59
(d) M∞ = 0.70.
Figure 24. Continued.
2 4 6
Rc × 10-6
-1 0 1 2 3 4 5 6
α, deg
cn
.005 .010 .015 .020 .025 .030 .035 .040 .045
cd
.02
cm 0
-.02
.7
.6
.5
4
.3
.2
.1
0
-.1

60
(e) M∞ = 0.74.
Figure 24. Continued.
4 6
Rc × 10-6
-1 0 1 2 3 4 5 6
α, deg
cn
.005 .010 .015 .020 .025 .030 .035 .040 .045
cd
.02
cm 0
-.02
.6
.5
4
.3
.2
.1
0
-.1
-.2

61
(f) M∞ = 0.76.
Figure 24. Continued.
4 6
Rc × 10-6
-1 0 1 2 3 4 5 6
α, deg
cn
.005 .010 .015 .020 .025 .030 .035 .040 .045
cd
.02
cm 0
-.02
.6
.5
4
.3
.2
.1
0
-.1
-.2

62
(g) M∞ = 0.78.
Figure 24. Continued.
4 6
Rc × 10-6
-1 0 1 2 3 4 5 6
α, deg
cn
.010 .015 .020 .025 .030 .035 .040 .045
cd
.02
cm 0
-.02
.6
.5
4
.3
.2
.1
0
-.1
.050 -.2

63
(h) M∞ = 0.80.
Figure 24. Continued.
4 6
Rc × 10-6
-1 0 1 2 3 4 5 6
α, deg
cn
.010 .015 .020 .025 .030 .035 .040 .045
cd
.02
cm 0
-.02
.6
.5
4
.3
.2
.1
0
-.1
.050 -.2

64
(i) M∞ = 0.82.
Figure 24. Concluded.
4 6
Rc × 10-6
-1 0 1 2 3 4 5 6
α, deg
cn
.010 .015 .020 .025 .030 .035 .040 .045
cd
.02
cm 0
-.02
.6
.5
4
.3
.2
.1
0
-.1
.050 -.2

65
(a) M∞ = 0.50.
Figure 25. Effect of Reynolds number on integrated force and moment coefficients for porous upper surface.
2 4 6
Rc × 10-6
-1 0 1 2 3 4 5 6
α, deg
cn
.005 .010 .015 .020 .025 .030 .035 .040 .045
cd
.02
cm 0
-.02
.7
.6
.5
4
.3
.2
.1
0
-.1

66
(b) M∞ = 0.60.
Figure 25. Continued.
2 4 6
Rc × 10-6
-1 0 1 2 3 4 5 6
α, deg
cn
.005 .010 .015 .020 .025 .030 .035 .040 .045
cd
.02
cm 0
-.02
.7
.6
.5
4
.3
.2
.1
0
-.1

67
(c) M∞ = 0.65.
Figure 25. Continued.
2 4 6
Rc × 10-6
-1 0 1 2 3 4 5 6
α, deg
cn
.005 .010 .015 .020 .025 .030 .035 .040 .045
cd
.02
cm 0
-.02
.7
.6
.5
4
.3
.2
.1
0
-.1

68
(d) M∞ = 0.70.
Figure 25. Continued.
2 4 6
Rc × 10-6
-1 0 1 2 3 4 5 6
α, deg
cn
.005 .010 .015 .020 .025 .030 .035 .040 .045
cd
.02
cm 0
-.02
.7
.6
.5
4
.3
.2
.1
0
-.1

69
(e) M∞ = 0.74.
Figure 25. Continued.
4 6
Rc × 10-6
-1 0 1 2 3 4 5 6
α, deg
cn
.010 .015 .020 .025 .030 .035 .040 .045
cd
.02
cm 0
-.02
.6
.5
4
.3
.2
.1
0
-.1
.050 -.2

70
(f) M∞ = 0.76.
Figure 25. Continued.
4 6
Rc × 10-6
-1 0 1 2 3 4 5 6
α, deg
cn
.010 .015 .020 .025 .030 .035 .040 .045
cd
.02
cm 0
-.02
.6
.5
4
.3
.2
.1
0
-.1
.050 -.2

71
(g) M∞ = 0.78.
Figure 25. Continued.
4 6
Rc × 10-6
-1 0 1 2 3 4 5 6
α, deg
cn
.010 .015 .020 .025 .030 .035 .040 .045
cd
.02
cm 0
-.02
.6
.5
4
.3
.2
.1
0
-.1
.050 -.2

72
(h) M∞ = 0.80.
Figure 25. Continued.
4 6
Rc × 10-6
-1 0 1 2 3 4 5 6
α, deg
cn
.010 .015 .020 .025 .030 .035 .040 .045
cd
.02
cm 0
-.02
.6
.5
4
.3
.2
.1
0
-.1
.050 -.2

73
(i) M∞ = 0.82.
Figure 25. Concluded.
4 6
Rc × 10-6
-1 0 1 2 3 4 5 6
α, deg
cn
.010 .015 .020 .025 .030 .035 .040 .045
cd
.02
cm 0
-.02
.6
.5
4
.3
.2
.1
0
-.1
.050 -.2

74
(a) M∞ = 0.50.
Figure 26. Effect of porosity on integrated force and moment coefficients.Rc = 4× 10⁶.
Surface
Solid Porous
-1 0 1 2 3 4 5 6
α, deg
cn
.005 .010 .015 .020 .025 .030 .035 .040 .045
cd
.02
cm 0
-.02
.7
.6
.5
4
.3
.2
.1
0
-.1

75
(b) M∞ = 0.60.
Figure 26. Continued.
Surface
Solid Porous
-1 0 1 2 3 4 5 6
α, deg
cn
.005 .010 .015 .020 .025 .030 .035 .040 .045
cd
.02
cm 0
-.02
.7
.6
.5
4
.3
.2
.1
0
-.1

76
(c) M∞ = 0.65.
Figure 26. Continued.
Surface
Solid Porous
-1 0 1 2 3 4 5 6
α, deg
cn
.005 .010 .015 .020 .025 .030 .035 .040 .045
cd
.02
cm 0
-.02
.7
.6
.5
4
.3
.2
.1
0
-.1

77
(d) M∞ = 0.70.
Figure 26. Continued.
Surface
Solid Porous
-1 0 1 2 3 4 5 6
α, deg
cn
.005 .010 .015 .020 .025 .030 .035 .040 .045
cd
.02
cm 0
-.02
.7
.6
.5
4
.3
.2
.1
0
-.1

78
(e) M∞ = 0.74.
Figure 26. Continued.
Surface
Solid Porous
-1 0 1 2 3 4 5 6
α, deg
cn
.010 .015 .020 .025 .030 .035 .040 .045
cd
.02
cm 0
-.02
.6
.5
4
.3
.2
.1
0
-.1
.050 -.2

79
(f) M∞ = 0.76.
Figure 26. Continued.
Surface
Solid Porous
-1 0 1 2 3 4 5 6
α, deg
cn
.010 .015 .020 .025 .030 .035 .040 .045
cd
.02
cm 0
-.02
.6
.5
4
.3
.2
.1
0
-.1
.050 -.2

80
(g) M∞ = 0.78.
Figure 26. Continued.
Surface
Solid Porous
-1 0 1 2 3 4 5 6
α, deg
cn
.010 .015 .020 .025 .030 .035 .040 .045
cd
.02
cm 0
-.02
.6
.5
4
.3
.2
.1
0
-.1
.050 -.2

81
(h) M∞ = 0.80.
Figure 26. Continued.
Surface
Solid Porous
-1 0 1 2 3 4 5 6
α, deg
cn
.015 .020 .025 .030 .035 .040 .045
cd
.02
cm 0
-.02
.6
.5
4
.3
.2
.1
0
-.1
.050 -.2
.055

82
(i) M∞ = 0.82.
Figure 26. Concluded.
Surface
Solid Porous
-1 0 1 2 3 4 5 6
α, deg
cn
.015 .020 .025 .030 .035 .040 .045
cd
.02
cm 0
-.02
.6
.5
4
.3
.2
.1
0
-.1
.050 -.2
.055

83
Figure 27. Variation of section drag coefficient with free-stream Mach number.Rc = 4× 10⁶.
.4 .5 .6 .7 .8 .9
M∞
0
.005
.010
.015
.020
.025
.030
.035
cd
Surface
Solid Porous
cn = 0
.4 .5 .6 .7 .8 .9
M∞
0
.005
.010
.015
.020
.025
.030
.035
cd
cn = 0.3
dcd/dM∞ = 0.1

84
Figure 28. Comparison of baseline NACA 0012 upper surface shape and equivalent solid upper surface shapes obtained from solid surfaceCpdistributions.
.07
.06
.05
.04
.03
.02
.01
0
y/c
0 .1 .2 .3 .4 .5 .6 .7 .8 .9 1.0
NACA 0012
M∞ = 0.5 α = 0°
M∞ = 0.7 α = 0°
M∞ = 0.8 α = 0°
M∞ = 0.5 α = 5°
M∞ = 0.7 α = 3°
0.120
0.121
0.121
0.121
0.120
0.121
tmaxc
0.015
0.015
0.015
0.014
0.015
0.014
rlec
x/c

85
(a) α = 0°.
Figure 29. Comparison of baseline NACA 0012 upper surface shape and equivalent solid upper surface airfoils obtained from porous surfaceCp distributions at constantα's.
.07
.06
.05
.04
.03
.02
.01
0
y/c
0 .1 .2 .3 .4 .5 .6 .7 .8 .9 1.0
NACA 0012
M∞ = 0.50
M∞ = 0.70
M∞ = 0.76
M∞ = 0.78
0.120
0.123
0.122
0.120
0.118
tmaxc
0.015
0.013
0.013
0.013
0.011
rlec
x/c

86
(b) α = 2°.
Figure 29. Concluded.
.07
.06
.05
.04
.03
.02
.01
0
y/c
0 .1 .2 .3 .4 .5 .6 .7 .8 .9 1.0
NACA 0012
M∞ = 0.50
M∞ = 0.70
M∞ = 0.74
M∞ = 0.76
0.120
0.120
0.119
0.118
0.116
tmaxc
0.015
0.011
0.011
0.011
0.010
rlec
x/c

87
(a) M∞ = 0.50.
Figure 30. Comparison of baseline NACA 0012 upper surface shape and equivalent solid upper surface shapes obtained from porous surfaceCp distributions at constantM∞’s.
.07
.06
.05
.04
.03
.02
.01
0
y/c
0 .1 .2 .3 .4 .5 .6 .7 .8 .9 1.0
NACA 0012
α = 0°
α = 3°
α = 5°
0.120
0.123
0.122
0.121
tmaxc
0.015
0.013
0.012
0.011
rlec
x/c

88
(b) M∞ = 0.76.
Figure 32. Concluded.
.07
.06
.05
.04
.03
.02
.01
0
y/c
0 .1 .2 .3 .4 .5 .6 .7 .8 .9 1.0
NACA 0012
α = 0°
α = 2°
0.120
0.120
0.116
tmaxc
0.015
0.013
0.010
rlec
x/c

89

Form ApprovedOMB No. 0704-0188
Public reporting burden for this collection of information is estimated to average 1 hour per response, including the time for reviewing instructions, searching existing data sources,gathering and maintaining the data needed, and completing and reviewing the collection of information. Send comments regarding this burden estimate or any other aspect of thiscollection of information, including suggestions for reducing this burden, to Washington Headquarters Services, Directorate for Information Operations and Reports, 1215 JeffersonDavis Highway, Suite 1204, Arlington, VA 22202-4302, and to the Office of Management and Budget, Paperwork Reduction Project (0704-0188), Washington, DC 20503.
1. AGENCY USE ONLY (Leave blank) 2. REPORT DATE 3. REPORT TYPE AND DATES COVERED
4. TITLE AND SUBTITLE 5. FUNDING NUMBERS
6. AUTHOR(S)
7. PERFORMING ORGANIZATION NAME(S) AND ADDRESS(ES)
9. SPONSORING/MONITORING AGENCY NAME(S) AND ADDRESS(ES)
11. SUPPLEMENTARY NOTES
8. PERFORMING ORGANIZATIONREPORT NUMBER
10. SPONSORING/MONITORINGAGENCY REPORT NUMBER
12a. DISTRIBUTION/AVAILABILITY STATEMENT 12b. DISTRIBUTION CODE
13. ABSTRACT (Maximum 200 words)
14. SUBJECT TERMS
17. SECURITY CLASSIFICATIONOF REPORT
18. SECURITY CLASSIFICATIONOF THIS PAGE
19. SECURITY CLASSIFICATIONOF ABSTRACT
20. LIMITATIONOF ABSTRACT
15. NUMBER OF PAGES
16. PRICE CODE
NSN 7540-01-280-5500 Standard Form 298 (Rev. 2-89)Prescribed by ANSI Std. Z39-18298-102
REPORT DOCUMENTATION PAGE
April 1996 Technical Paper
Effect of Full-Chord Porosity on Aerodynamic Characteristics of theNACA 0012 Airfoil WU 505-59-10-30
Raymond E. Mineck and Peter M. Hartwich
L-17492
NASA TP-3591
Mineck: Langley Research Center, Hampton, VA; Hartwich: ViGYAN Inc., Hampton, VA.
A test was conducted on a model of the NACA 0012 airfoil section with a solid upper surface or a porous uppersurface with a cavity beneath for passive venting. The purposes of the test were to investigate the aerodynamiccharacteristics of an airfoil with full-chord porosity and to assess the ability of porosity to provide a multipoint orself-adaptive design. The tests were conducted in the Langley 8-Foot Transonic Pressure Tunnel over a Mach num-ber range from 0.50 to 0.82 at chord Reynolds numbers of 2× 10⁶, 4 × 10⁶, and 6× 10⁶. The angle of attack wasvaried from−1° to 6°. At the lower Mach numbers, porosity leads to a dependence of the drag on the normal force.At subcritical conditions, porosity tends to flatten the pressure distribution, which reduces the suction peak near theleading edge and increases the suction over the middle of the chord. At supercritical conditions, the compressionregion on the porous upper surface is spread over a longer portion of the chord. In all cases, the pressure coefficientin the cavity beneath the porous surface is fairly constant with a very small increase over the rear portion. For theporous upper surface, the trailing edge pressure coefficients exhibit a creep at the lower section normal force coef-ficients, which suggests that the boundary layer on the rear portion of the airfoil is significantly thickening withincreasing normal force coefficient.
Porous airfoils 89
A05
NASA Langley Research CenterHampton, VA 23681-0001
National Aeronautics and Space AdministrationWashington, DC 20546-0001
Unclassified–UnlimitedSubject Category 02Availability: NASA CASI (301) 621-0390
Unclassified Unclassified Unclassified