effect of foam concentration on structural characteristics ... · pdf fileeffect of foam...
TRANSCRIPT
The Pacific Journal of Science and Technology –32– http://www.akamaiuniversity.us/PJST.htm Volume 15. Number 1. May 2014 (Spring)
Effect of Foam Concentration on Structural Characteristics of Steel Reinforced Aerated Concrete Beams.
Efe Ikponmwosa, Ph.D*1; Funso Falade, Ph.D.1; Christopher Fapohunda, MASc.2; Toyin Akinniyi, M.Sc.1; and Kehinde Olori, M.Sc.1
1Department of Civil and Environmental Engineering, University of Lagos, Nigeria.
2Department of Building, Caleb University, Imota, Lagos, Nigeria
E-mail: [email protected]
ABSTRACT This work presents the results of investigation conducted to evaluate the effect of foam concentration on the structural properties of steel-reinforced foamed aerated concrete beams. The properties investigated were the density, compressive strength, shear strength, and flexural strength. Relationships between compressive strengths and densities were developed, as well as comparison between the compressive strengths and the shear strengths. The foam concentrate/water ratios adopted in this investigation are 1:20, 1:25, 1:29, 1:33, 1:40, and 1:50. For the compressive strength and the dry density determinations, 150 x 150 x 150 mm cube specimens were cast and tested; and 225 x 225 x 2300 mm reinforced beam specimens were used for the shear and flexural strengths tests. The results of the investigation shows that: (i) a reduction in foam concentration through the use of higher foaming agent to water ratio resulted in decrease in density, decrease in compressive strength and increased in deflection. (ii) there was increase compressive strength, density with curing ages at all foamed concentrations (iii) the relationship between the compressive strength and the density of the specimens were observed to be linear for all the foam concentrations, (iv) the mathematical expressions developed between the compressive strengths and the densities for the different foam concentration can be considered valid for the specimens used in this work, and (v) the shear strengths developed by the beam specimens used in this investigation were between 13.15% and 20% of the compressive strengths.
(Keywords: compressive strength, foamed aerated
concrete, foam concentration, density, shear strength)
INTRODUCTION Foamed aerated concrete, a lightweight concrete, hitherto considered not fit for structural applications is now accepted as a structural material for construction purposes. There are many reasons for this. Apart from its characteristic properties of being a thermal and acoustic insulating material and possession of higher fire resistance than normal weight concrete, there is now emerging technologies that can be used to produce foamed aerated concrete with adequate strength at low cost (Shetty, 2005). However, being a relatively new material in the area of structural application, every facet of it constitution under all structural conditions and configurations are being subjected to various investigations, so that its behavior could further be understood, and thus leading to increased confidence in its usage. For example, Litebuilt (2010) and Jones and McCarthy (2005) showed that the compressive strength of foamed aerated concrete is influenced by density, method of pore formation, testing technique, water content, methods and age of curing, as well as the physical and chemical characteristics of the constituents materials. Puttappa et al. (2008) observed that foamed aerated concrete could develop up to 80% increase in strength between 28 days and 180 days of curing. However, strength increase thereafter is marginal. The use of finer sand resulted in improved strength of foamed aerated concrete was the results of the work done by Kunhanadan and Ramamurthy (2006). They further discovered that for a given density, replacement of sand with fly ash resulted in higher strength. In their works, Bing et al. (2012) found out that the use of fiber in foamed concrete containing silica as partial replacement of cement significantly improved the splitting tensile

The Pacific Journal of Science and Technology –33– http://www.akamaiuniversity.us/PJST.htm Volume 15. Number 1. May 2014 (Spring)
strength. Shabbar et al. (2010), in their studies on the strength adequacy and cost effectiveness of foamed concrete in structural applications, showed that one-way ribbed slab with beams of foamed concrete is more economical than 2-way solid slab. Foamed aerated concrete has also been found to allow for the use of some wastes, like palm kernel shell, pulverized bone, etc., in its composition without sustaining any loss in strength (Alengaram et al., 2009, Falade et al., 2012, Falade et al., 2013). Mydin and Wang (2010) conducted studies to investigate the effect of elevated temperatures on the mechanical properties of foamed concrete. They reported that the observed reduction in stiffness for the specimens tested occurred at temperature of 90
oC. Many mathematical
expressions, relating compressive strength to other parameters, were also obtained from mix with different compositions (Sin, 2007, Zain and Abd, 2009, Nambiar and Ramamurthy, 2008). This work is concerned with the investigation of the effect of foam concentration on some structural properties of steel-reinforced foamed aerated concrete beams, for which few literatures exist. Earlier work on shear strength of foamed concrete include Kum et al. (2007) on one-way slab, Mohamad et al. (2012) on foamed concrete sandwich panel as load bearing wall, and Alengaram et al. (2010) on foamed aerated concrete reinforced beams with palm kernel shell as aggregate. Also Narayanan and Ramamurthy (2000) and Ramamurthy et al (2009) did reviews on classification of foam concrete. None of these included definitive effects of varying the foam concentration as part of the investigation or as part of their literature reviews. Some of the parameters investigated in the present study include: density, compressive strength, shear and flexural characteristics. MATERIALS AND METHODS Materials In this investigation, ordinary Portland cement which conformed to British Standard BS 12 (1996) was used. The fine aggregate (sharp sand) was obtained from upland source of Ogun River to ensure that it has low chloride content and organic impurities. It has a specific gravity of 2.66, with all size particles passing through 2.36mm sieve. A protein-based foaming agent, Lithofoam SL 200L,
supplied by Dr. Lucas and Partners, a company based in Germany was used for this work. To produce the required foam concentration and to mix the concrete, clean and potable water was used. The ratios of foam concentrate to water adopted for this work were: 1:20, 1:25, 1:29, 1:33, 1:40, 1:50; the quantity of foaming agent being kept constant at 100g for all mixes. The water to cement ratio was kept at 0.5, while cement to sand ratio was 1:3. The reinforcement for the beams consisted of hot-rolled, deformed 2Y12mm diameter bars with yield and tensile stresses of 488.20N/mm
2 and 625.51N/mm
2
respectively. 10mm diameter bars with yield and tensile stresses of 464N/mm
2 and 706/mm
2 were
used as links. Experimental Investigation Preliminary Tests: The preliminary tests carried out on the cement are setting time(s) and consistency tests while those carried out on the fine (sharp sand) are moisture content, determination of organic impurities, sieve analysis and density tests. The high yield tensile reinforcing bars were tested to determine their tensile and yield strengths and ductility of the material. All tests on constituent materials, experiments and tests on specimens were carried out at the concrete and structures laboratories, Department of Civil and Environmental Engineering, University of Lagos, Akoka, Lagos, Nigeria. Compression and Density Tests: Compressive strength and density tests were conducted on 150x150x150 cube specimens, at 7-, 14-, 21-, and 28-day curing ages in accordance with BS EN 12390-3: 2009 and BS EN 12390-7:2009. For each of the six (6) variants of foam concentrate/water mix adopted for this investigation, six (6) sets of twelve (12) nos. 150x150x150mm cube specimens were cast. The cube specimens were de-molded 24 ± 0.5 hours. Three (3) cubes for each foam concentration were tested at the stipulated curing ages. Cube strengths were determined on 600 kN Avery Denison Universal Testing machine at a loading rate of 120 kN/min while the beam specimens were set up on the testing stand and tested to failure. The crushing (compressive) strength of cubes is reported to the nearest 0.5 N/mm². Three cubes (3) were tested for each foam concentration at each curing age with the mean value taken as the strength for each set.

The Pacific Journal of Science and Technology –34– http://www.akamaiuniversity.us/PJST.htm Volume 15. Number 1. May 2014 (Spring)
Typical test on cubes is shown in Figure 1. The weight of each cube was taken prior to the compression strength test, and was used to calculate the density. Shear and Flexural Strengths Tests: In order to execute this project, 72 numbers of 225 x 225 x 2350 mm steel reinforced concrete beam specimens designed in accordance with BS 8110 (1997) were cast and tested at 7-, 14-, 21-, and 28-day curing ages to determine the load carrying capacities and deflection characteristics (12 numbers of beams for each foam concentration). The reinforcement for the beams consisted of hot-rolled, deformed 2Y12mm diameter while 10mm diameter bars were used for the links. Air-curing method was adopted for the investigation. The beam specimens de-molded 48 hours after casting to allow for initial hardening, and were subsequently sprinkled with water all over, and left in the open to cure. Three (3) beam specimens for each foam concentration were tested at the stipulated curing ages, and the average values of shear were noted. Figure 2 shows the arrangement. Experimental values (results) obtained were compared with theoretical values determined in accordance with BS 8110.
Theoretical Basis for Maximum Bending Moment and Shear Stress Calculation Bending Moment: The theoretical moment of resistance of the beam was computed from the expression in BS 8110 (1997) as: Mu = 0.156bd
2f cu (1)
where: Mu = ultimate moment of resistance, b = width of the beam, d = effective depth, fcu = characteristic compressive strength of concrete at 28-day curing age. The lever arm factor was evaluated from equation 2 (Mosley and Bungey, 1995)
cu
u
fbd
M2
= 0.89 (l - la)la (2)
where la = lever arm The experimental bending moment was calculated from Equation 3 (Steel Designers Manual, 1983).
(3)
where Pf = load at failure in kg, and l = beam span.
Figure 1: A Cube Specimen on 600 kN Avery Denison Universal Testing Machine.
Cube Specimen

The Pacific Journal of Science and Technology –35– http://www.akamaiuniversity.us/PJST.htm Volume 15. Number 1. May 2014 (Spring)
Shear Strength: In order to calculate the theoretical shear strength of the beams, a method adopted by Aroni (1990) was used. He based his method on the equation developed by ACI for shear strength of aerated concrete beam with shear reinforcement based on the addition of shear strength due to concrete with that due to shear reinforcement using a truss analogy to obtain the expression:
(4)
Where τu = shear strength, a = shear span ( ,
fc = characteristic strength of concrete, fyw = characteristic strength of steel, μ = total percent of tension reinforcement, ρw = total percent of shear reinforcement, d = effective depth, while a0, a1, and a2, are constants.
Aroni (1990) later carried out a regression analysis to obtain the values of 0.077, 0.719, and 0.001 respectively for the constants a0, a1, and a2 to obtain the final equation for predicting ultimate shear strength as:
(5)
The experimental Shear strength was
calculated from the expression:
(6)
where Vu is the load at failure, b = width of the beam, d = effective depth. Figure 2 shows the loading configuration.
RESULTS AND DISCUSSIONS Preliminary Investigations The initial and final settings times for the pastes were 114minutes and 227minutes. These values are within the range specified by BS 12: 1996. The results of the sieve analysis conducted for the sand shows that the coefficient of uniformity (Cu) and coefficient of curvature (Cc) of the sand were respectively 3.55 and 1.40. Also the fineness modulus was 0.90. As these values fall within the range considered for good quality concrete production (Mindess et al., 2003), it can be concluded that the sand was fine enough, well graded and suitable for foamed aerated concrete production. Also the yield and the ultimate stresses of the reinforcing bars were respectively 488.20N/mm
2 and 625.50N/mm
2. For the links,
the yield and ultimate stresses were found to be 464.20N/mm
2 and 706.40N/mm
2. Thus the bars
used for this investigation, both as reinforcement bars and for the links exceeded the 460N/mm
2,
which is the BS 4449: 1997 minimum requirements for high yield steel strength reinforcing steel.
Load
75
Fixed support
Support
Load
Spreader
Roller
Support
I-Beam
Y12 mm bars.
225
Y10 links (2legs at 100mm c/c)
av av
75 75
Figure 2: Typical Beam and Loading Arrangement.
2150
225

The Pacific Journal of Science and Technology –36– http://www.akamaiuniversity.us/PJST.htm Volume 15. Number 1. May 2014 (Spring)
Density The results of density tests carried out on cube specimens for the different ratios of foaming agent to water, and at different curing ages are shown in Table 1 and Figure 3. The results show that the densities fell within the range considered for lightweight concrete classification; being less than 1950kg/m
3 (Sin,
2007 and Neville, 2010), thus fulfilling one of the object of this study. It can be further observed that the densities decreased with curing ages for all the foam concentration. This is characteristics of air-cured foamed aerated concrete. This could be attributed partly to the loss of water in the pores, and partly to the effect associated with the loss of water in the pores, which means progressive reduction in the water that is available to maintain the strength-forming hydration process. The reduction in the production of hydration products, as a result of loss of water results reduced densification of the matrix. This can be observed in Figure 3. Also the density reduced as the ratio of foaming agent to water increased at all the curing ages. Results show that increasing the ratio of foaming agent to water result in increase in aeration of the matrix. Increase in aeration means increase in the number of pores or cells of air in the matrix which has the effect of making the resultant foamed concrete lighter, consequent upon which is the reduction in density observed. The numbers in parenthesis represent the percent reduction in density. Although no consistent pattern can be discerned, but the percent reduction in densities observed for foam concentration: 1: 29 and 1: 33
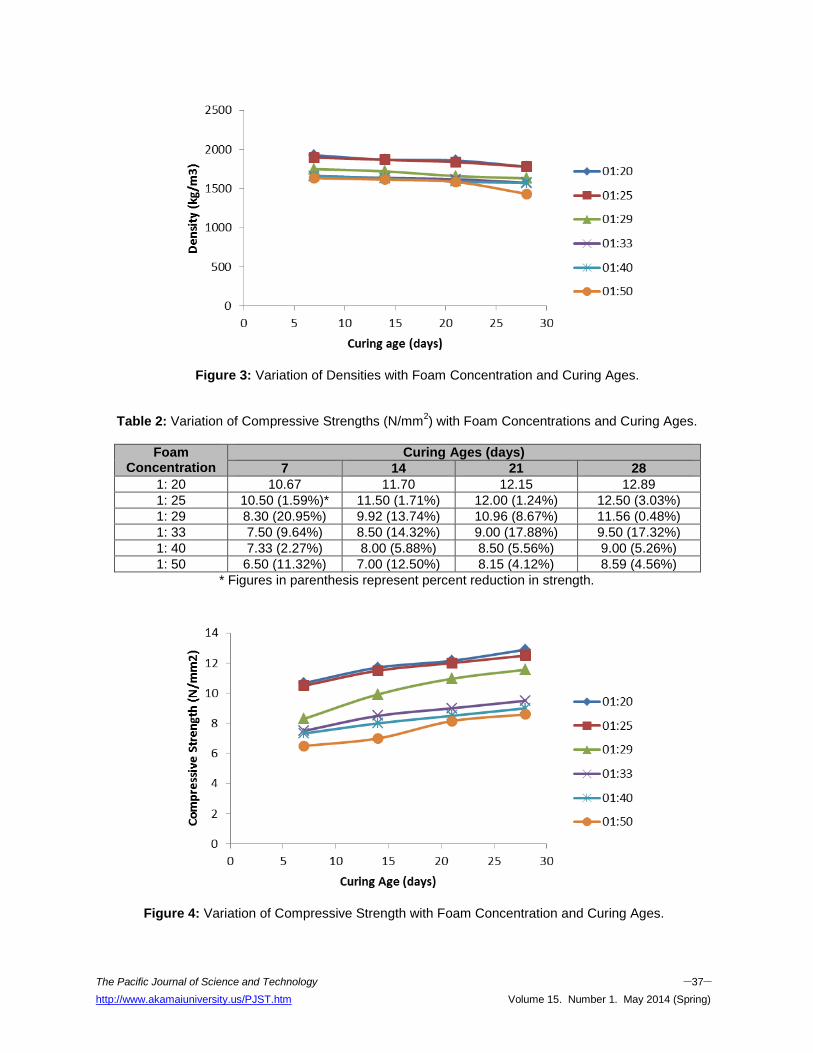
seem to be higher than all others at all the curing ages. Compressive Strength The results of the compressive strengths for all the foam concentrations and the curing ages are presented in Table 2 and Figure 4. From the table, it is could be observed that the compressive strength increased with curing ages. This is due to the continuing formation of strength-forming products of hydration, as long as there is enough water in the pores to maintain the hydration process. However, the strength decreased as ratio of foaming agent to water increased. The percent strength reduction is shown in the parenthesis. Although no consistent strength reduction pattern was observed, the progressive strength reduction as the ratio of foam concentration to water increased is a resultant of more aeration and subsequently increase in the number of air voids in the concrete matrix. More air voids into the concrete brings about a material that is light and of lower weight and density. Reduced density translated into lower strength development. Figure 5 shows the plot of strength development with the ratio of foam concentration to water. From Figure 5, it is obvious that the values strengths strength measured drop as the ratio of foam concentration to water increased but the relationship appears not to be linear but non-linear. Also the pattern of strength development is the same for all the ratio of foam concentration to water.
Table 1: Variation of Density (in kg/m3) with Foam Concentration
Fc/w ratio
Curing Age (Days)
7 14 21 28
1: 20 1926 1867 1858 1778
1: 25 1896 (1.56%)* 1867 (0.00%) 1837 (1.13%) 1778 (0.0%)
1: 29 1748 (7.81%) 1719 (7.93%) 1659 (9.69%) 1630 (8.32%)
1: 33 1659 (5.1%) 1635 (4.89%) 1618 (2.47%) 1674 (2.70%)
1: 40 1658 (0.0%) 1629 (0.37%) 1590 (1.73%) 1570 (0.06%)
1: 50 1633 (1.5%) 1614 (0.92%) 1584 (0.38%) 1432 (8.79%)
* Figures in parenthesis represent percent reduction
The Pacific Journal of Science and Technology –37– http://www.akamaiuniversity.us/PJST.htm Volume 15. Number 1. May 2014 (Spring)
Figure 3: Variation of Densities with Foam Concentration and Curing Ages.
Table 2: Variation of Compressive Strengths (N/mm2) with Foam Concentrations and Curing Ages.
Foam Concentration
Curing Ages (days)
7 14 21 28
1: 20 10.67 11.70 12.15 12.89
1: 25 10.50 (1.59%)* 11.50 (1.71%) 12.00 (1.24%) 12.50 (3.03%)
1: 29 8.30 (20.95%) 9.92 (13.74%) 10.96 (8.67%) 11.56 (0.48%)
1: 33 7.50 (9.64%) 8.50 (14.32%) 9.00 (17.88%) 9.50 (17.32%)
1: 40 7.33 (2.27%) 8.00 (5.88%) 8.50 (5.56%) 9.00 (5.26%)
1: 50 6.50 (11.32%) 7.00 (12.50%) 8.15 (4.12%) 8.59 (4.56%)
* Figures in parenthesis represent percent reduction in strength.
Figure 4: Variation of Compressive Strength with Foam Concentration and Curing Ages.

The Pacific Journal of Science and Technology –38– http://www.akamaiuniversity.us/PJST.htm Volume 15. Number 1. May 2014 (Spring)
Figure 5: Variation of Compressive Strength with Ratio of Foam Concentration to Water.
Figure 6: Relationship between Density and the Compressive Strength. Relationship between the Compressive Strength and the Density Figure 6 represents the scatter plot between the compressive strengths and the density for the purpose of expressing relationships for the different foam concentration used by correlation and regression analysis. There appears to be a straight line relationship between the compressive strength and the density. The correlation coefficients were 0.9455, 0.8873, 0.9327, 0.9842, and 0.7113 respectively for 1:20, 1:25, 1:29, 1:33, 1:40, and 1:50 foam
concentrations. These values indicated positive linear relationships. A regression analysis yielded the following mathematical expressions:
(1:20) (7)
(1:25) (8)
(1:29) (9)
(1:33) (10)
(1:40) (11)

The Pacific Journal of Science and Technology –39– http://www.akamaiuniversity.us/PJST.htm Volume 15. Number 1. May 2014 (Spring)
(1:50) (12)
Where is the compressive strength in N/mm2,
and ρ is the density in kg/m3.
Since the correlation coefficients are close to 1, it shows that the formulas can best describe the relationship statistically between the compressive strengths and density for the different foam concentration. Shear Strength The shear behavior of the beam specimens at different foam concentrations for all the curing ages are shown in Figure 7 and a comparison between the shear and compressive strength is presented in Table 3. From the figure, it can be observed that the shear strength observed from the testing of the beam specimens increased with
curing ages but decreased with the increased in the ratio of foaming agent to water. The possible explanation for decreasing shear resistance of beam with reduction in foam concentration through increased foaming agent to water ratio is attributable to weakening internal resistance to shear forces due to more aeration with its attendant increase in the volume of air pores in the matrix. From the data presented in Table 3, it is observed that the foamed concrete used in this investigation exhibited a high shear to compressive strengths ratio. The least was 13.15% and the highest was 20%. These values are higher than the values of 6% to 10% of compressive strength observed by Litebuilt (2010). The reason could be due to the characteristics of foaming agent used for this study.
Figure 7: Variation of Shear Strength with Foam Concentration and Curing Ages.
Table 3: Comparison between the Compressive and the Shear Strengths (N/mm2) for the Beam
Specimens with Curing Age (days).
fc/w ratio.
7 14 21 28
τ fc % τ fc % τ fc % τ fc %
1:20 1.80 10.67 16.87 1.79 11.70 15.30 1.97 12.15 16.24 2.20 12.89 17.07
1:25 1.63 10.50 15.52 1.69 11.50 14.43 1.86 12.00 15.50 2.03 12.50 16.24
1:29 1.46 8.30 17.59 1.63 9.92 16.43 1.92 10.96 17.52 1.92 11.56 13.15
1:33 1.41 7.50 18.80 1.46 8.50 17.18 1.50 9.00 16.67 1.52 9.50 16.00
1:40 1.38 7.33 18.83 1.41 8.00 17.63 1.43 8.50 16.83 1.50 9.00 16.67
1:50 1.30 6.50 20.00 1.35 7.00 19.29 1.38 8.15 16.93 1.42 8.59 16.53
The Pacific Journal of Science and Technology –40– http://www.akamaiuniversity.us/PJST.htm Volume 15. Number 1. May 2014 (Spring)
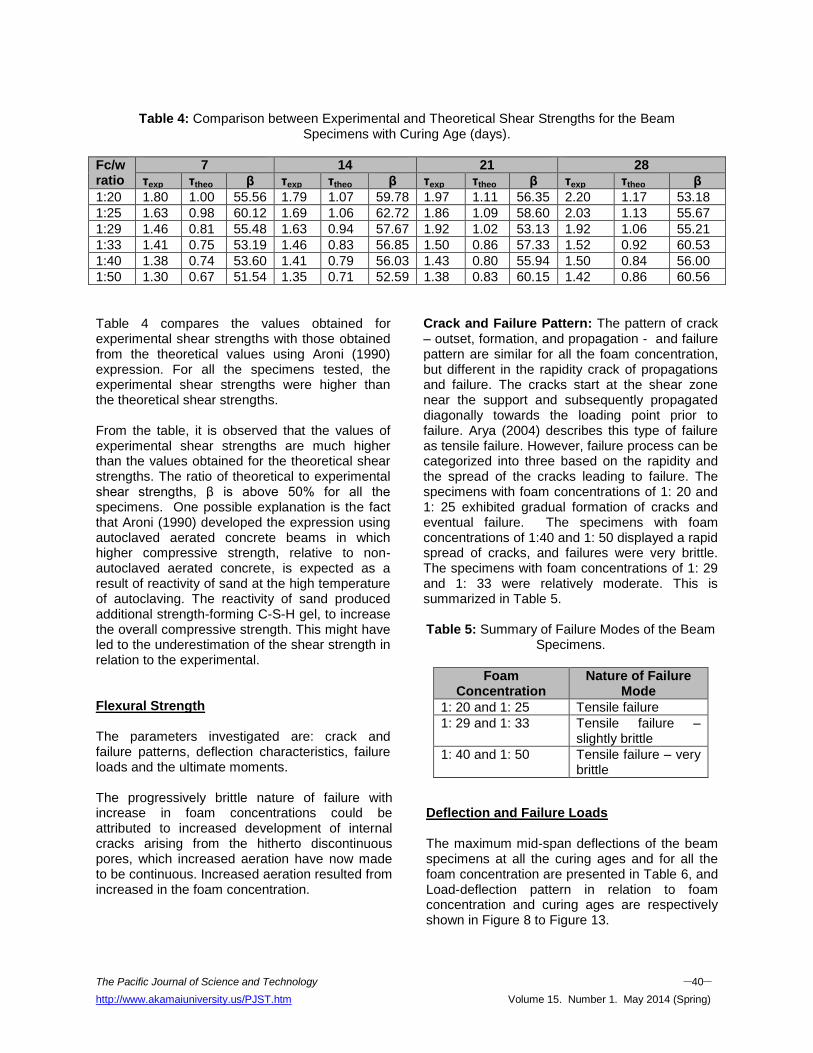
Table 4: Comparison between Experimental and Theoretical Shear Strengths for the Beam
Specimens with Curing Age (days).
Fc/w ratio
7 14 21 28
τexp τtheo β τexp τtheo β τexp τtheo β τexp τtheo β
1:20 1.80 1.00 55.56 1.79 1.07 59.78 1.97 1.11 56.35 2.20 1.17 53.18
1:25 1.63 0.98 60.12 1.69 1.06 62.72 1.86 1.09 58.60 2.03 1.13 55.67
1:29 1.46 0.81 55.48 1.63 0.94 57.67 1.92 1.02 53.13 1.92 1.06 55.21
1:33 1.41 0.75 53.19 1.46 0.83 56.85 1.50 0.86 57.33 1.52 0.92 60.53
1:40 1.38 0.74 53.60 1.41 0.79 56.03 1.43 0.80 55.94 1.50 0.84 56.00
1:50 1.30 0.67 51.54 1.35 0.71 52.59 1.38 0.83 60.15 1.42 0.86 60.56
Table 4 compares the values obtained for experimental shear strengths with those obtained from the theoretical values using Aroni (1990) expression. For all the specimens tested, the experimental shear strengths were higher than the theoretical shear strengths. From the table, it is observed that the values of experimental shear strengths are much higher than the values obtained for the theoretical shear strengths. The ratio of theoretical to experimental shear strengths, β is above 50% for all the specimens. One possible explanation is the fact that Aroni (1990) developed the expression using autoclaved aerated concrete beams in which higher compressive strength, relative to non-autoclaved aerated concrete, is expected as a result of reactivity of sand at the high temperature of autoclaving. The reactivity of sand produced additional strength-forming C-S-H gel, to increase the overall compressive strength. This might have led to the underestimation of the shear strength in relation to the experimental. Flexural Strength The parameters investigated are: crack and failure patterns, deflection characteristics, failure loads and the ultimate moments.
Crack and Failure Pattern: The pattern of crack – outset, formation, and propagation - and failure pattern are similar for all the foam concentration, but different in the rapidity crack of propagations and failure. The cracks start at the shear zone near the support and subsequently propagated diagonally towards the loading point prior to failure. Arya (2004) describes this type of failure as tensile failure. However, failure process can be categorized into three based on the rapidity and the spread of the cracks leading to failure. The specimens with foam concentrations of 1: 20 and 1: 25 exhibited gradual formation of cracks and eventual failure. The specimens with foam concentrations of 1:40 and 1: 50 displayed a rapid spread of cracks, and failures were very brittle. The specimens with foam concentrations of 1: 29 and 1: 33 were relatively moderate. This is summarized in Table 5. Table 5: Summary of Failure Modes of the Beam
Specimens.
Foam Concentration
Nature of Failure Mode
1: 20 and 1: 25 Tensile failure
1: 29 and 1: 33 Tensile failure – slightly brittle
1: 40 and 1: 50 Tensile failure – very brittle
The progressively brittle nature of failure with increase in foam concentrations could be attributed to increased development of internal cracks arising from the hitherto discontinuous pores, which increased aeration have now made to be continuous. Increased aeration resulted from increased in the foam concentration.
Deflection and Failure Loads The maximum mid-span deflections of the beam specimens at all the curing ages and for all the foam concentration are presented in Table 6, and Load-deflection pattern in relation to foam concentration and curing ages are respectively shown in Figure 8 to Figure 13.

The Pacific Journal of Science and Technology –41– http://www.akamaiuniversity.us/PJST.htm Volume 15. Number 1. May 2014 (Spring)
Table 6: The Mid Span Deflection at Failure (mm).
Ratio Curing Age (Days)
7 14 21 28
Load Def Load Def Load Def Load Def
1:20 74.60 7.61 76.90 7.63 81.60 8.53 90.90 8.68
1:25 67.60 7.85 69.90 8.22 76.90 8.42 83.90 9.65
1: 29 60.60 7.85 67.60 10.80 79.30 12.10 79.30 12.35
1: 33 58.20 9.70 60.60 11.80 62.00 12.80 62.90 13.60
1: 40 57.10 10.60 58.30 12.50 59.20 13.33 62.20 15.70
1: 50 53.60 10.80 55.90 13.40 57.30 15.30 58.70 17.30
From Table 6, it can be observed that the deflection increased with curing ages for all the foam concentrations. This increase however was at a decreasing. For example, for 1:20 foam concentration, the increases when expressed as a percentage of 28 day deflection, are 12.33%, 12. 10%, and 1.73% respectively for 7-, 14-, and 14-day curing ages. This trend was observed for all the foam concentration and shown in Table 3. Table 7: Rate of increase in Deflection expressed
As Percentage of 28-Day Deflection.
Ratio 7-Day 14-Day 21-Day
1:20 12.33 12.10 1.73
1:25 18.65 14.82 12.75
1:29 36.44 12.55 2.03
1:33 28.68 13.22 5.88
1:40 32.48 20.38 15.10
1:50 37.57 22.54 11.56
The decreasing rate of deflection with curing age can be attributed to the densification effect of increased production of C-S-H gel as a result of increase in hydration with curing ages. Also the deflection increased with increase in foam concentration for all the curing ages. This is due to loss of stiffness because; increasing foam concentration introduces more voids into the matrix thereby reducing the overall cross-sectional area. The failure load can be observed from the table to increase with curing ages for all foam concentration. The load-deflection curves for all the foam concentration are shown in Figures 8 – Figure 13.
Figure 8: Load-Deflection for 1:20 Foam
Concentration.
Figure 9: Load-Deflection for 1:25 Foam
Concentration.

The Pacific Journal of Science and Technology –42– http://www.akamaiuniversity.us/PJST.htm Volume 15. Number 1. May 2014 (Spring)
Figure 10: Load-Deflection for 1:29 Foam
Concentration.
Figure 11: Load-Deflection for 1:33 Foam
Concentration.
Figure 12: Load-Deflection for 1:40 Foam Concentration.
Figure 13: Load-Deflection for 1:50 Foam
Concentration. This is attributable to increased resistance that the increase in strength-forming C-S-H gel attendant to increase in curing ages. Failure loads however decreased with increase in foam concentration for all the curing ages. This is due to reduction in the area of cross-section due to a more porous matrix occasioned by greater aeration attendant to increase in foam concentration. From these figures, the load-deflection curves appear to be linear in behavior for all the foam concentration. The plots of 28-day load-deflection with curing ages for all the foam concentration are shown in Figure 14. It can be observed that the deflection increased as the foam concentration increased.
Figure 14: Load-Deflection at 28-day Curing for
all the Foam Concentrations. From the figure, it is obvious that failure of beam specimens occurred at different loads for the foam concentration. For relative comparison, at
The Pacific Journal of Science and Technology –43– http://www.akamaiuniversity.us/PJST.htm Volume 15. Number 1. May 2014 (Spring)
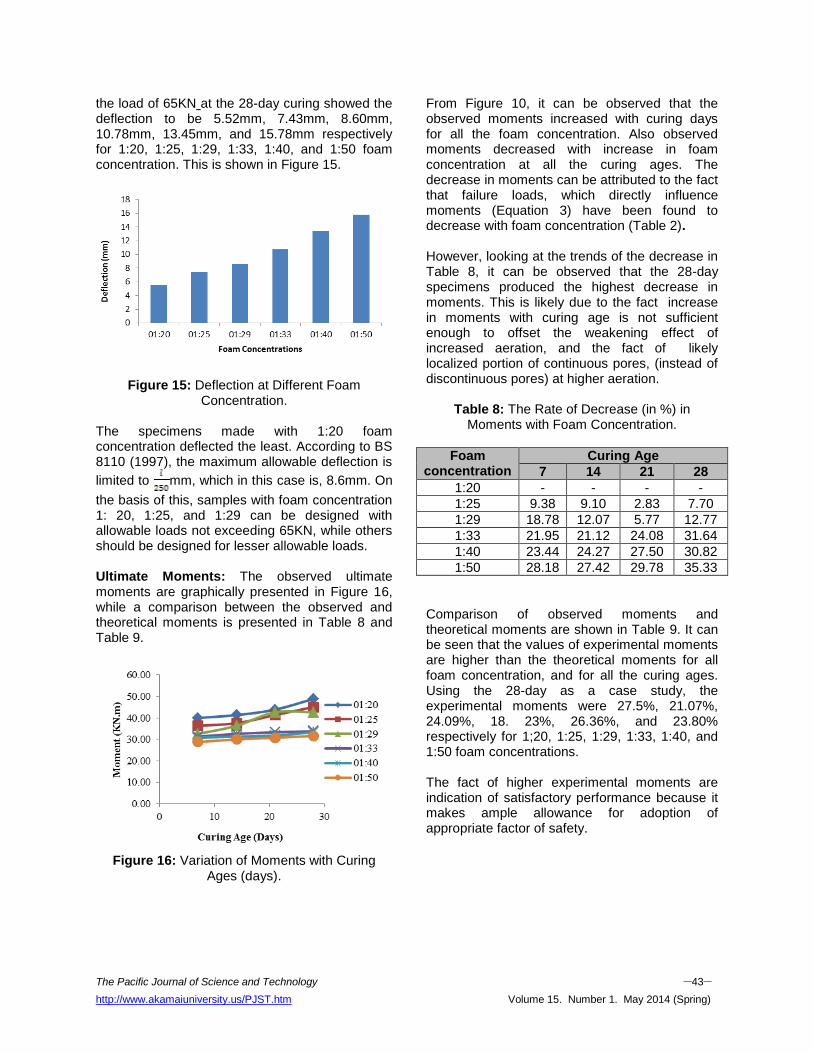
the load of 65KN at the 28-day curing showed the deflection to be 5.52mm, 7.43mm, 8.60mm, 10.78mm, 13.45mm, and 15.78mm respectively for 1:20, 1:25, 1:29, 1:33, 1:40, and 1:50 foam concentration. This is shown in Figure 15.
Figure 15: Deflection at Different Foam
Concentration. The specimens made with 1:20 foam concentration deflected the least. According to BS 8110 (1997), the maximum allowable deflection is
limited to mm, which in this case is, 8.6mm. On
the basis of this, samples with foam concentration 1: 20, 1:25, and 1:29 can be designed with allowable loads not exceeding 65KN, while others should be designed for lesser allowable loads. Ultimate Moments: The observed ultimate moments are graphically presented in Figure 16, while a comparison between the observed and theoretical moments is presented in Table 8 and Table 9.
Figure 16: Variation of Moments with Curing
Ages (days).
From Figure 10, it can be observed that the observed moments increased with curing days for all the foam concentration. Also observed moments decreased with increase in foam concentration at all the curing ages. The decrease in moments can be attributed to the fact that failure loads, which directly influence moments (Equation 3) have been found to decrease with foam concentration (Table 2). However, looking at the trends of the decrease in Table 8, it can be observed that the 28-day specimens produced the highest decrease in moments. This is likely due to the fact increase in moments with curing age is not sufficient enough to offset the weakening effect of increased aeration, and the fact of likely localized portion of continuous pores, (instead of discontinuous pores) at higher aeration.
Table 8: The Rate of Decrease (in %) in Moments with Foam Concentration.
Foam concentration
Curing Age
7 14 21 28
1:20 - - - -
1:25 9.38 9.10 2.83 7.70
1:29 18.78 12.07 5.77 12.77
1:33 21.95 21.12 24.08 31.64
1:40 23.44 24.27 27.50 30.82
1:50 28.18 27.42 29.78 35.33
Comparison of observed moments and theoretical moments are shown in Table 9. It can be seen that the values of experimental moments are higher than the theoretical moments for all foam concentration, and for all the curing ages. Using the 28-day as a case study, the experimental moments were 27.5%, 21.07%, 24.09%, 18. 23%, 26.36%, and 23.80% respectively for 1;20, 1:25, 1:29, 1:33, 1:40, and 1:50 foam concentrations. The fact of higher experimental moments are indication of satisfactory performance because it makes ample allowance for adoption of appropriate factor of safety.

The Pacific Journal of Science and Technology –44– http://www.akamaiuniversity.us/PJST.htm Volume 15. Number 1. May 2014 (Spring)
Table 9: Comparison between Experimental and Theoretical Moments (KN.m).
Foam concentration
Curing Age
7 14 21 28
Exp Theo Exp Theo Exp Theo Exp Theo
1:20 16.04 12.68 16.53 13.90 17.54 14.44 19.54 15.32
1:25 14.54 12.50 15.03 13.60 17.05 14.30 18.04 14.90
1:29 13.03 9.86 14.54 11.79 16.53 13.02 17.05 13.74
1:33 12.52 8.90 13.04 10.10 13.32 10.70 13.36 11.30
1:40 12.28 8.71 12.52 9.51 12.72 10.10 13.52 10.70
1:50 11.52 7.70 12.06 8.30 12.32 9.69 12.64 10.21
CONCLUSION From the results of this investigation, the followings conclusions are drawn:
Reduction in foam concentration through the use of higher foaming agent to water ratio resulted in decreased in density. However, the density increased with curing age for all the foam concentrations.
The compressive strength reduced with higher foaming agent to water ratio, but increased with curing age.
The relationship between the compressive strength and the density observed in this work appeared to be linear for all the foam concentration.
The deflection of the beam specimens increased with reduction in foam concentration.
All the beam specimens displayed tensile failure pattern, but the rapidity of failure accompanied reduction in foam concentration.
Reduction in foam concentration resulted in reduction in ultimate moment for all the curing ages.
The mathematical expressions developed between the compressive strengths and the densities for the different foam concentration can be considered valid for the specimens used for this work.
The shear strengths developed by the beam specimens used for this investigation were
between 13.15% and 20% of the compressive strengths.
ACKNOWLEDGEMENT
We wish to appreciate the Management of the University of Lagos, Nigeria, for providing substantial part of the funds for this research, as well as creating the enabling environment for the execution of the work at the structures and concrete laboratories, Civil and Environmental Engineering Department of the institution. REFERENCES 1. Alengaram, U.J., M.Z. Jumat, and H. Mahnud.
2010. “Structural Behaviour of Reinforced Palm Kernel Shell Foamed Concrete Beams”. Challenges, Opportunities and Solutions in Structural Engineering. Taylor and Francis Group: London, UK. 265 – 270.
2. Aroni, S. 1990. “Shear Strength of Reinforced Aerated Concrete Beams with Shear Reinforcement”. Materials and Structures. 23: 217–222.
3. Bing, C., W. Zhan, and L. Ning. 2012. “Experimental Research on Properties of High-Strength Foamed Concrete”. Journal of Materials of Civil Engineering. 24(1):113 – 119.
4. BS 12. 1996. “Specifications for Portland Cement”.
British Standard Institution: London, UK.
5. BS 8110. 1997. “Structural Use of Concrete”. British Standard Institution: London, UK.
6. BS EN 12390-3. 2009. “Testing Hardened Concrete: Compressive Strength of Test

The Pacific Journal of Science and Technology –45– http://www.akamaiuniversity.us/PJST.htm Volume 15. Number 1. May 2014 (Spring)
Specimens”. British Standard Institution: London, UK.
7. BS EN 12390-7. 2009. “Testing Hardened Concrete: Density of Hardened Concrete”. British Standard Institution: London, UK.
8. Falade, F., E. Ikponmwosa, and C. Fapohunda. 2012. “Potential of Pulverized Bone as a Pozzolanic Material”. International Journal of Scientific and Engineering Research. 3(7).
9. Falade, F., E. Ikponmwosa, and C. Fapohunda.
2013. “A Study on the Compressive and Tensile Strength of Foamed Concrete Containing Pulverized Bone as a Partial Replacement of Cement”. Pakistan Journal of Engineering and Applied Science. 13:82-93.
10. Jones, M.R. and A. McCarthy. 2005. “Preliminary Views on the Potential of Foamed Concrete as a Structural Material”. Magazine of Concrete Research. 57(1):21 – 31.
11. Kum, Y.K., T.H. Wee, and M.A. Mansur. 2007.
“Shear Strength of Lightweight Concrete One-Way Slabs”. 32nd Conference on Our World in Concrete and Structures, Singapore, CI-Premier PTE Ltd.
12. Kunhanadan, E.K. and K. Ramamurthy. 2006. “Influence of Filler Type on Properties of Foamed Concrete”. Cement and Concrete Composites. 28(3):475 – 480.
13. Litebuilt. 2010. “Aerated Lightweight Concrete Foamed Technology”. Pan Pacific Management Resources PY Ltd. (http://www.litebuilt.com, assessed 12/8/10).
14. Mindess, S., J. Young, and D. Darwin. 2003. Concrete. 2
nd Edition. Pearson International
Education: London, UK.
15. Mohamad, N., W. Omar, and R. Abdullah. 2012. “Structural Behaviour of Precast Lightweight Foamed Concrete Sandwich Panel as a Load Bearing Wall”. OIDA International Journal of Sustainable Development. 5(3):49 – 58.
16. Mosley, W.H. and J.H. Bungey. 1995. Reinforced
Concrete Design. MacMillan Publishers: New York, NY. 530.
17. Mydin, M.A.O. and Y.C. Wang. 2010. “An Experimental Investigation of Mechanical Properties of Lightweight Foamed Concrete Subjected to Elevated Temperatures up to 6000C”. Concrete Research Letters. 1(4):142 – 156.
18. Nambiar, E.K. and K. Ramamurthy. 2008. “Models for Strength Prediction of Foamed Concrete”. Materials and Structures. 41:247 – 254.
19. Narayanan, N. and K. Ramamurthy. 2000.
“Structure and Properties of Aerated Concrete: A Review”. Cement and Concrete Composites. 22:321 – 329.
20. Neville, A. M. 2010. Properties of Concrete. 4th Edition. Pearson Education: London, UK 844.
21. Puttappa, C.G., A. Ibrahim, K.U. Muthu, and H.S. Raghavendra. 2008. “Mechanical Properties of Foamed Aerated Concrete”. ICCBT. 43:491 – 500
22. Ramamurthy, K., E.K.K. Nambiar, and G.I. Ranjani. 2009. “A Classification of Studies on Properties of Foam Concrete”. Cement and Concrete Composites. 31:388 – 396.
23. Shabbar, R., N. Noordin, E.T. Dawood, and M.Z. Sulieman. 2010. “Comparison between Ribbed Slab Structure Using Lightweight Foam Concrete and Solid Slab Structure Using Normal Concrete”. Concrete Research Letters. 1(1):19 – 34.
24. Shetty, M.S. 2005. Concrete Technology. S.
Chand and Company Limited: London, UK. 624.
25. Sin, L.H. 2007. “Structural Response of LWC Beams in Flexure”. PhD Thesis in the Department of Civil Engineering, National University: Singapore, 269.
26. ELBS. 1983. Steel Designers Manual. The English Language Book Society and Granada Publishing: London, UK.
27. Zain, M.F.M. and S.M. Abd. 2009. “Multiple Regression Model for Compressive Strength Prediction of High Performance Concrete”. Journal of Applied Science. 9:155 – 160.
ABOUT THE AUTHORS Efe Ikponmwosa (Ph.D.,) is an Associate Professor at the Civil and Environmental Engineering Department, Faculty of Engineering, University of Lagos, Nigeria. Ikponmwosa is a member of the Nigerian Society of Engineers and a COREN registered and practicing engineer in Nigeria. He has published over twenty-five articles in local and international journals and conferences. He has successfully produced many students at the graduate and M.Phil. levels. He is currently working jointly with others to produce Ph.D. candidates. His area of research focus is materials and structures and pozzolans. Telephone: +2348055897732, E-mail: [email protected] or [email protected] .

The Pacific Journal of Science and Technology –46– http://www.akamaiuniversity.us/PJST.htm Volume 15. Number 1. May 2014 (Spring)
Funso Falade (Ph.D.), is a Professor of Engineering at the Civil and Environmental Engineering Department, Faculty of Engineering, University of Lagos, Nigeria. Falade is a member of the Nigerian Society of Engineers and a COREN registered and practicing engineer in Nigeria. He has published over sixty (60) articles in local and international journals and conferences. He has successfully produced over ten (10) M.Phil. and Ph.D. candidates. His areas of research interest include natural fibres as reinforcement in concrete and pozzolans. Telephone: +2348023073313, E-mail.: [email protected]. Christopher Fapohunda (MASc.), is currently pursuing a Doctor of Philosophy degree program in Materials and Structures at the Civil and Environmental Engineering Department of the University of Lagos, Nigeria. He is a member of the Nigerian Society of Engineers and a COREN registered and practicing engineer in Nigeria. He works as a lecturer at Caleb University, Imota, Lagos. Telephone: +2348066020802, E-mail: [email protected]. Toyin Akinniyi (M.Sc.), was a post-graduate student in Materials and Structures at the Civil and Environmental Engineering Department of the University of Lagos, Nigeria. She is a member of the Nigerian Society of Engineers and a COREN registered and practicing engineer in Nigeria. Currently, she works as a lecturer at Afe Babalola University, Ade Ekiti, Nigeria. Telephone: +2348062210702, E-mail: [email protected] Kehinde Olori (M.Sc.), was a post-graduate student in Materials and Structures at the Civil and Environmental Engineering Department of the University of Lagos, Nigeria. He is a member of the Nigerian Society of Engineers and a COREN registered and practicing engineer in Nigeria. Currently, he works as an engineer with Globacon Nigeria Limited in Nigeria. Telephone +2348062210702.
SUGGESTED CITATION Ikponmwosa, E., F. Falade, C. Fapohunda, T. Akinniyi, and K. Olori. 2014. “Effect of Foam Concentration on Structural Characteristics of Steel Reinforced Aerated Concrete Beams”. Pacific Journal of Science and Technology. 15(1):32-46.
Pacific Journal of Science and Technology