effect of fly ash, silica fume, glass fiber and
TRANSCRIPT
International Journal of Engineering Trends and Technology Volume 69 Issue 5, 69-84, May 2021 ISSN: 2231 – 5381 /doi:10.14445/22315381/IJETT-V69I5P212 © 2021 Seventh Sense Research Group®
This is an open access article under the CC BY-NC-ND license (http://creativecommons.org/licenses/by-nc-nd/4.0/)
Effect of Fly ash, Silica fume, Glass Fiber and
Polypropylene Fiber on Strength Properties of
Composite Fiber Reinforced High Performance
Concrete Sachin Patil #1, Dr.H.M. Somasekharaiah *2, Dr. H. Sudarsana Rao*3, Dr.Vaishali G.Ghorpade *4
#1Research Scholar, Department of Civil Engineering, J.N.T. University, Anantapur-515002, AP, India.
2Professor, Department of Civil Engineering, RYMEC, Ballari -583104, Karnataka, India.
3,4 Professor, Department of Civil Engineering, J.N.T.U.A college of Engineering, Anantapur-515002, AP, India.
[email protected] , [email protected], [email protected]
Abstract - Pozzolanic materials Fly ash (FA) and Silica
fume (SF), finer than cement, are emerging in the production
of concrete proven to individually enhance the concrete
properties. This investigation utilizes the combined effect of
FA and SF as replacement of cement partially. Glass fibers
(GF) and Polypropylene fibers (PPF) are used as an addition to produce Composite-Fiber Reinforced High-
Performance Concrete (CFRHPC), and it was proposed to
investigate its mechanical properties. The water to binder
ratios (W/B) of 0.275, 0.300, 0.325, and 0.350, with an
aggregate to binder ratio (A/B) of 1.75, were adopted. FA
and SF were replaced in the range from 0% to 15% each,
GF were added in volume percentages from 0% to 1%, and
PPF were kept constant at 0.25%. The combined effect of
FA and SF at 5% each as replacement of cement and
composite fiber dosage of GF=1% and PPF=0.25% for W/B
of 0.275 was found to be an optimum combination to obtain
maximum strength properties for CFRHPC. A relationship in the form of mathematical models between cube
compressive strength with cylindrical compressive strength,
split tensile strength, and flexural strength of FA and SF
based CFRHPC was also derived from this investigation's
experimental results.
Keywords: Composite fibers, Glass fiber, High-
Performance Concrete, Polypropylene fiber, Fly ash, Silica
fume, Mechanical properties.
I. INTRODUCTION Large quantities of concrete are being consumed due
to urbanization and its demand globally, leading to the
development of high-performance concrete (HPC), and its
demand has increased due to its enhanced strength, which
leads to leaner sections, reducing the weight of the structure.
This will benefit consumers economically as HPC is used to
construct skyscrapers, tunnels, bridges, foundations, etc.,
which are heavy structures[1]. Recent investigations have
concluded that cement production using Portland cement
leads to greenhouse gas emissions [2]. Global cement
production in 2018 was estimated at approximately 3.99 bn
tonnes[3]. To reduce cement consumption, CO2 emissions,
and energy consumption, researchers have proposed various
cement replacements from other materials. Additionally, this
replacement leads to the enhancement of the properties of
concrete[4].
Researchers have reported that fly ash (FA), when
used as a replacement of cement partially, will yield
enhanced permeability and chemical resistance in concrete as
FA combines with calcium hydroxide chemically to form
additional products of cement [5]–[8]. K.Torii et al. reported
a substantial reduction in permeability of chloride ions by the
addition of SF in concrete, also causing a noteworthy
increase in strength. This enhancement was due to micro-
level changes in the transition zone and cement paste phase
[9]. S. Barbhuiya et al. reported that the use of silica fume
(SF) transformed concrete to resist water penetration and, in
turn, enhancing chloride ion penetration resistance of
concrete [10]. The widespread application of FA and SF in
the construction industry is the result of extensive
investigations on the use of FA and SF in concrete in the past
twenty years [11]-[16]. Present authors also have
investigated the effect of FA and SF based composite fiber-
reinforced HPC on strength and durability properties and
concluded the viability of using FA, SF, and Composite
fibers in CFRHPC production for enhanced strength and
durability properties [17]-[18]
Investigation[19], with intent to evaluate GF's
effective utilization on concrete, concluded that compressive
strength moderately increased for M20 grade concrete using
GF with 0.33, 0.67, and 1.0 percentage compared with the
control mix. Detailed studies[20]-[29] have proven that
compression, bending, impact, tensile strength, and
Sachin Patil et al./ IJETT, 69(3), 69-84, 2021
70
durability significantly improved with fibers' use, preferably
glass fibers, which are lightweight, possess high tensile
strength, and cost-effective. GF's inclusion has proved to be
resistant to cracks due to shrinkage and achieved enhanced
bending and tensile strengths. However, if fibers are used
beyond 1%, there is a tendency to form lumps with
workability problems. The hardened properties of HPC with
the inclusion of PPF were investigated in the study [30], and
results indicated that the strength of HPC reinforced with
PPF revealed an increasing trend with the PPF volume.
HPC's strength properties using FA and SF as a
cement replacement, with the addition of GF and PPF with
superplasticizers, are yet to receive sufficient exploration
from the research community as minimal studies are carried
out to uphold their effectiveness in the context of strength
behavior. Hence, there is a shortfall of research material
available. Besides, Indian Standard Codes do not specify the
tests to be executed for assessing the strength properties of
HPC. This investigation presents the outcomes of
experimental exploration performed to understand FA and
SF-based composite fiber-reinforced HPC's strength
behavior.
II. MATERIALS AND PROPERTIES
The cement used was OPC of grade 53, having a specific
gravity of 3.10. Fine aggregates used were of specific
gravity 2.67 collected from a locally available riverbed.
Coarse aggregates used were of specific gravity 2.75, from
a stone quarry available locally with 40% of 12.5 mm and
60% of 20 mm. Fly ash used was having a specific gravity of
2.18 with a specific surface area of 0.398 m2/g and had SiO2
and Al2O3 at 59.16% and 30.64%, respectively. The silica
fume used was light to dark grey, having a specific gravity of
2.20 with a specific surface area of 22.2 m2/g, and had SiO2
as a significant ingredient at 91.36%. A CemFil AntiCrack
HD Glass fiber with 14 μm diameter and 12 mm length was
used during concrete production. These fibers are water
dispersible, allowing complete GF dispersion into individual
filaments upon mixing in an aqueous environment.
Polypropylene fibers used were engineered microfibers with
a unique triangular cross-section of length 12mm and 38-μm
diameter. Potable fresh water without organic and acid
ingredients was used for concrete mixing. A chloride-free
Superplasticizer (SP) of Fosroc make with a specific gravity
of 1.18 was used.
III. EXPERIMENTAL PROCEDURE
A. Mix proportions
To study the behavior of CFRHPC, 19 mixes along with
one HPC mix without any mineral admixtures and composite fibers were prepared for each water binder ratio. The
CFRHPC mixes were designed with W/B of 0.275, 0.300,
0.325, and 0.350 with a constant A/B of 1.75. FA and SF of
5%, 10% and 15% each were adapted as cement replacement
with addition of 0%, 0.25%, 0.5%, 0.75% and 1% GF
content along with constant PPF of 0.25% of concrete
volume. SP was used at 0.8% by the weight of the binder.
These relative proportions were obtained by the absolute
volume method. Recently manufactured single batch OPC of
53 grade has been used. The first letter in the mix designation indicates composite matrix containing GF and PPF, second
letter indicates percentage of GF and PPF used, i.e. P=0%GF
& 0%PPF, Q=0.25%GF & 0.25%PPF, R=0.5%GF &
0.25%PPF, S=0.75%GF & 0.25%PPF and T=1%GF &
0.25%PPF. F indicates FA, and S indicates SF. The
following number indicates the total percentage of cement
replaced by FA and SF. Last alphabet indicates water binder
ratios, i.e. A=0.275, B=0.300, C=0.325 and D=0.350.
CPFS0A indicates a plain high-performance concrete mix
without any cement replacement by mineral admixtures and
without the addition of any fibers for W/B of 0.275 with the
cement of 805.43 kg/m3. CTFS10A mix indicates a composite fiber-reinforced high-performance concrete mix
with combined 10% cement replacement by mineral
admixtures fly ash and silica fume and with the addition of
1% glass fiber and 0.25% polypropylene fiber for W/B of
0.275 with the cement of 717.15kg/m3 and the quantity of fly
ash and silica fume was 39.84 kg/m3 each. The proportion of
ingredients used for W/B of 0.275 are tabulated in Table 1.
Similar patterns of ingredients were used for W/B of 0.300,
0.325, and 0.350.
Table 1: Nomenclature of mix with W/B of 0.275.
Mix
Designation W/B A/B
SP FA SF GF PPF
(%)
CPFS0A 0.275 1.75 0.8 0 0 0 0
CPFS10A 0.275 1.75 0.8 5 5 0 0
CPFS20A 0.275 1.75 0.8 10 10 0 0
CPFS30A 0.275 1.75 0.8 15 15 0 0
CQFS0A 0.275 1.75 0.8 0 0 0.25 0.25
CQFS10A 0.275 1.75 0.8 5 5 0.25 0.25
CQFS20A 0.275 1.75 0.8 10 10 0.25 0.25
CQFS30A 0.275 1.75 0.8 15 15 0.25 0.25
CRFS0A 0.275 1.75 0.8 0 0 0.5 0.25
CRFS10A 0.275 1.75 0.8 5 5 0.5 0.25
CRFS20A 0.275 1.75 0.8 10 10 0.5 0.25
CRFS30A 0.275 1.75 0.8 15 15 0.5 0.25
CSFS0A 0.275 1.75 0.8 0 0 0.75 0.25
CSFS10A 0.275 1.75 0.8 5 5 0.75 0.25
CSFS20A 0.275 1.75 0.8 10 10 0.75 0.25
CSFS30A 0.275 1.75 0.8 15 15 0.75 0.25
CTFS0A 0.275 1.75 0.8 0 0 1 0.25
CTFS10A 0.275 1.75 0.8 5 5 1 0.25
CTFS20A 0.275 1.75 0.8 10 10 1 0.25
CTFS30A 0.275 1.75 0.8 15 15 1 0.25
W/B - Water to Binder ratio
A/B - Aggregate to Binder ratio
SP - Superplasticizer
FA – Fly ash
SF – Silica fume
GF - Glass fiber
PPF - Polypropylene fiber
Sachin Patil et al./ IJETT, 69(3), 69-84, 2021
71
B. Sample preparation, curing, and testing
Samples were prepared by mixing cement, fine
aggregate, FA, and SF thoroughly by manual means first to
achieve a uniform mix, and then composite fibers were added
to the mixture, followed by coarse aggregates and water mixed with a superplasticizer.
80 mixes were prepared with 6 specimens each of cubes
and beams with 12 specimens of cylinders for each mix.
Cube specimens of 150mm, cylindrical specimens of 150mm
diameter and 300mm height, and prismatic specimens of 100
x 100 x 500mm were cast.
As initial curing, a wet cloth was used for covering the
exposed portion of specimens before demoulding. After the
concrete was set, specimens were demoulded and were cured
in a transparent water tank at 27° ± 2°C until the testing age.
After the curing period for the specified testing age (7
and 28 days), samples were removed from the water and dried under the shade before testing. Cube compression,
cylindrical compression, and split tensile tests were done on
the digital compression testing machine of 3000 kN capacity,
with the least count of 1 kN. Loads on the cube and cylinder
(placed horizontally for split tensile strength and vertical for
cylindrical compressive strength) were applied at a constant
rate until the specimens' failure. A flexural testing machine
was supported at the bottom with two steel rollers of 38 mm
diameter, and these rollers were mounted at a distance of
400mm from center to center of specimens. The load was
applied through two 38mm diameter steel rollers from the top at the third point from the center to the center of the
supporting span. The load was evenly divided among these
rollers. Each strength result was the average of the specimens
tested at the same time for the same mix.
IV. RESULTS AND DISCUSSION
Mechanical properties obtained for CFRHPC mixes are
tabularized in Tables 2 and 3.
A. Cube compressive strength
a) Effects of water binder ratios on cube compressive
strength of CFRHPC: To understand the development of
strength for each mix, cube compressive strengths for both
ages of testing were plotted against the water binder ratios for different volumes of composite fibers in Figs. 1 and 2,
respectively. Values presented in Table 2 represent the 7
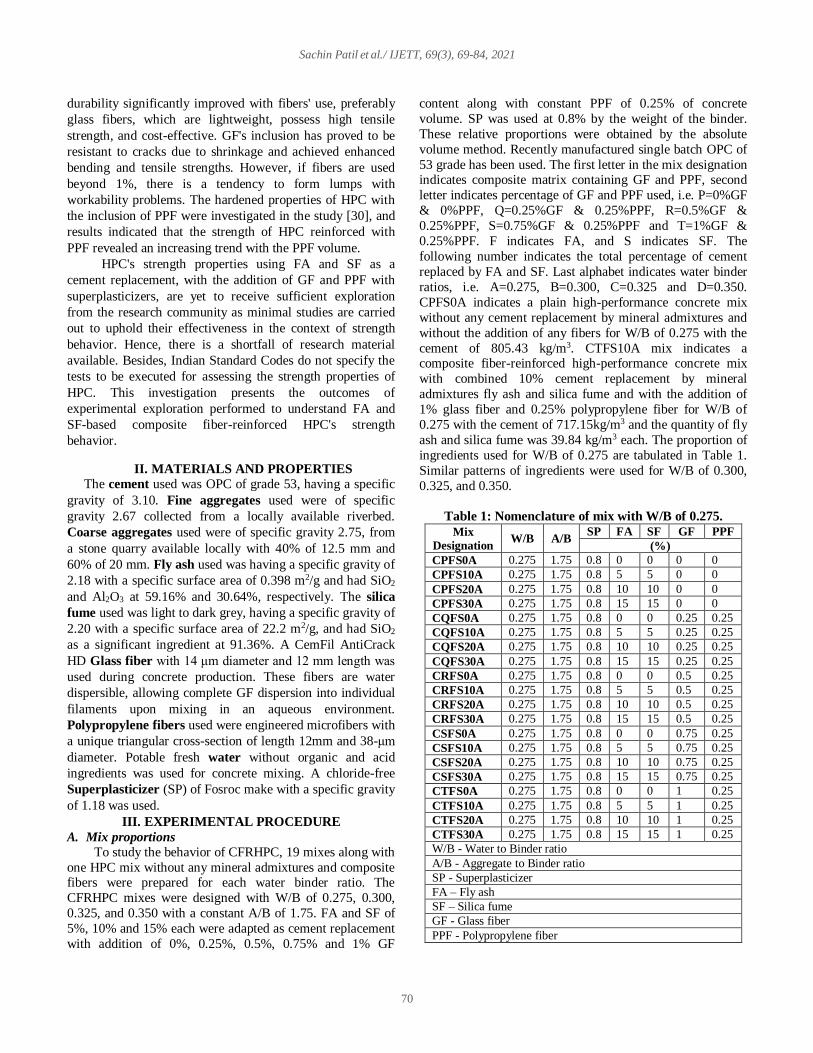
days and 28 days cube compressive strength results. Fig.1
shows that 7 days cube compressive strength of CFRHPC
reduced with an escalation in water binder ratio, with all
other mixes presenting the same trend.
Fig 1. 7 days cube compressive strength versus water
binder ratios for various volumes of composite fibers.
Fig 2. 28 days cube compressive strength versus water
binder ratios for various volumes of composite fibers.
0.275 0.3 0.325 0.3556
60
64
68
72
62.9
66.6
70.3
74.0
59.5
63.0
66.5
70.0
56.1
59.4
62.7
66.0
69.3
Water Binder Ratio (W/B)
Cu
be
Co
mp
ress
ive S
tren
gth
(M
Pa
)
0% GF & 0% PPF
0.25% GF & 0.25% PPF
0.5% GF & 0.25% PPF
0.75% GF & 0.25% PPF
1% GF & 0.25% PPF
5% Fly ash and 5% Silica fume
10% Fly ash and 10% Silica fume
15% Fly ash and 15% Silica fume
7 Days curing
0% Fly ash and 0% Silica fume
0.275 0.3 0.325 0.35
67.6
72.8
78.0
83.2
79.8
85.5
91.2
96.974.1
79.8
85.5
91.2
96.9
70.8
76.7
82.6
Water Binder Ratio (W/B)
Cu
be
Co
mp
ress
ive S
tren
gth
(M
Pa
)
0% GF & 0% PPF
0.25% GF & 0.25% PPF
0.5% GF & 0.25% PPF
0.75% GF & 0.25% PPF
1% GF & 0.25% PPF
28 Days curing
0% Fly ash and 0% Silica fume
5% Fly ash and 5% Silica fume
10% Fly ash and 10% Silica fume
15% Fly ash and 15% Silica fume

Sachin Patil et al./ IJETT, 69(3), 69-84, 2021
72
Table 2. Cube and Cylindrical compressive strengths of CFRHPC mixes.
Mix
Designation
Cube
Compressive
strength
Cylindrical
Compressive
strength
Mix
Designation
Cube
Compressive
strength
Cylindrical
Compressive
strength
MPa
MPa
7 28 7 28
7 28 7 28
Days
Days
CPFS0A 61.36 76.20 45.41 56.39 CPFS0C 58.91 72.40 43.59 53.58
CPFS10A 66.27 86.10 49.04 63.72 CPFS10C 63.62 81.81 47.08 60.54
CPFS20A 63.62 83.91 47.08 62.09 CPFS20C 61.08 79.72 45.20 58.99
CPFS30A 60.93 74.39 45.09 55.05 CPFS30C 58.49 70.69 43.28 52.31
CQFS0A 62.28 78.04 45.77 57.35 CQFS0C 59.78 74.14 43.94 54.49
CQFS10A 67.38 88.18 49.52 64.80 CQFS10C 64.68 83.78 47.54 61.57
CQFS20A 64.69 86.27 47.54 63.39 CQFS20C 62.10 81.96 45.64 60.23
CQFS30A 61.71 76.78 45.36 56.42 CQFS30C 59.24 72.95 43.54 53.60
CRFS0A 63.20 79.88 46.13 58.31 CRFS0C 60.66 75.89 44.28 55.40
CRFS10A 68.49 90.26 50.00 65.89 CRFS10C 65.74 85.75 47.99 62.60
CRFS20A 65.75 88.63 48.00 64.70 CRFS20C 63.11 84.19 46.07 61.46
CRFS30A 62.50 79.16 45.62 57.79 CRFS30C 59.99 75.21 43.79 54.90
CSFS0A 66.46 84.00 48.52 61.32 CSFS0C 62.49 80.63 45.62 58.86
CSFS10A 72.70 94.93 53.07 69.30 CSFS10C 68.36 91.11 49.90 66.51
CSFS20A 69.80 92.21 50.95 67.31 CSFS20C 65.62 88.51 47.90 64.61
CSFS30A 65.05 83.37 47.49 60.86 CSFS30C 61.16 80.02 44.65 58.42
CTFS0A 70.41 86.14 52.10 63.75 CTFS0C 66.90 81.84 49.50 60.56
CTFS10A 74.87 97.34 55.40 72.03 CTFS10C 71.14 92.48 52.64 68.44
CTFS20A 71.87 95.95 53.19 71.01 CTFS20C 68.29 91.17 50.53 67.46
CTFS30A 68.73 85.84 50.86 63.52 CTFS30C 65.30 81.56 48.33 60.35
CPFS0B 60.14 74.30 44.50 54.98 CPFS0D 58.28 71.63 43.13 53.00
CPFS10B 64.95 83.96 48.06 62.13 CPFS10D 62.95 80.94 46.58 59.89
CPFS20B 62.35 81.81 46.14 60.54 CPFS20D 60.43 78.87 44.72 58.36
CPFS30B 59.71 72.54 44.19 53.68 CPFS30D 57.87 69.93 42.82 51.75
CQFS0B 61.03 76.09 44.85 55.92 CQFS0D 59.11 73.34 43.38 53.90
CQFS10B 66.03 85.98 48.53 63.19 CQFS10D 64.07 82.88 47.03 60.91
CQFS20B 63.39 84.11 46.59 61.81 CQFS20D 61.49 81.08 45.20 59.58
CQFS30B 60.48 74.86 44.45 55.01 CQFS30D 58.71 72.16 43.14 53.03
CRFS0B 61.93 77.88 45.21 56.85 CRFS0D 59.93 75.06 43.59 54.79
CRFS10B 67.12 88.01 49.00 64.25 CRFS10D 65.41 84.82 47.51 61.92
CRFS20B 64.43 86.41 47.04 63.08 CRFS20D 62.21 83.28 45.66 60.80
CRFS30B 61.24 77.18 44.71 56.34 CRFS30D 59.53 74.39 43.45 54.30
CSFS0B 64.47 82.32 47.07 60.09 CSFS0D 61.83 78.96 45.14 57.64
CSFS10B 70.53 93.02 51.49 67.90 CSFS10D 67.64 89.23 49.38 65.14
CSFS20B 67.71 90.36 49.43 65.96 CSFS20D 64.93 86.68 47.40 63.27
CSFS30B 63.11 81.70 46.07 59.64 CSFS30D 61.08 78.37 44.18 57.21
CTFS0B 68.65 83.99 50.80 62.16 CTFS0D 65.48 79.29 48.45 58.67
CTFS10B 73.00 94.91 54.02 70.24 CTFS10D 69.63 89.59 51.52 66.30
CTFS20B 70.08 93.56 51.86 69.23 CTFS20D 66.84 88.32 49.46 65.35
CTFS30B 67.02 83.70 49.59 61.94 CTFS30D 63.92 79.01 47.30 58.47
Sachin Patil et al./ IJETT, 69(3), 69-84, 2021
73
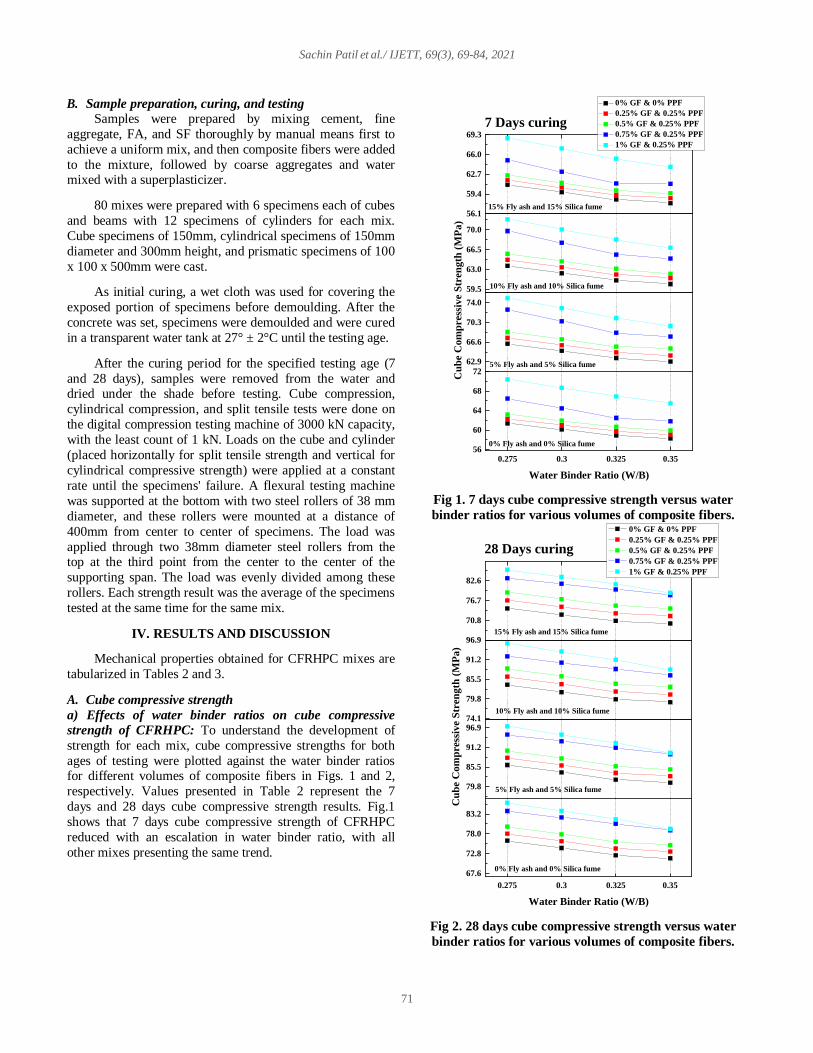
Table 3. Split tensile and flexural strengths of CFRHPC mixes.
Mix
Designation
Split
tensile
strength
Flexural
strength Mix
Designation
Split
tensile
strength
Flexural
strength
MPa MPa
7 28 7 28 7 28 7 28
Days Days
CPFS0A 3.86 5.29 5.93 8.13 CPFS0C 3.61 4.94 5.29 7.25
CPFS10A 4.09 5.68 6.20 8.62 CPFS10C 3.75 5.04 5.88 7.90
CPFS20A 3.89 5.38 5.99 8.21 CPFS20C 3.65 4.98 5.33 7.31
CPFS30A 3.74 5.14 5.82 8.02 CPFS30C 3.41 4.69 5.03 6.93
CQFS0A 3.97 5.52 5.95 8.27 CQFS0C 3.73 5.18 5.38 7.47
CQFS10A 4.32 6.04 6.47 9.02 CQFS10C 3.92 5.42 6.01 8.31
CQFS20A 4.06 5.67 6.04 8.43 CQFS20C 3.77 5.22 5.44 7.53
CQFS30A 3.85 5.35 5.88 8.16 CQFS30C 3.52 4.87 5.06 7.00
CRFS0A 4.10 5.77 6.19 8.72 CRFS0C 3.85 5.42 5.47 7.71
CRFS10A 4.43 6.21 7.04 9.86 CRFS10C 4.10 5.68 6.31 8.76
CRFS20A 4.13 5.92 6.27 8.98 CRFS20C 3.88 5.46 5.51 7.77
CRFS30A 3.98 5.58 6.08 8.52 CRFS30C 3.73 5.17 5.32 7.39
CSFS0A 4.14 5.91 6.24 8.84 CSFS0C 3.97 5.67 5.52 7.88
CSFS10A 4.56 6.48 7.34 10.43 CSFS10C 4.15 6.03 6.53 9.48
CSFS20A 4.33 6.16 6.32 9.12 CSFS20C 4.01 5.71 5.56 7.94
CSFS30A 4.05 5.75 6.12 8.65 CSFS30C 3.80 5.34 5.36 7.44
CTFS0A 4.26 6.09 6.29 8.98 CTFS0C 4.12 5.88 5.62 8.03
CTFS10A 4.79 6.81 7.59 10.79 CTFS10C 4.35 6.18 6.77 9.62
CTFS20A 4.52 6.43 6.61 9.40 CTFS20C 4.17 5.92 5.66 8.09
CTFS30A 4.16 5.96 6.20 8.87 CTFS30C 4.01 5.69 5.55 7.89
CPFS0B 3.78 5.18 5.68 7.78 CPFS0D 3.20 4.38 4.99 6.84
CPFS10B 3.90 5.40 5.97 8.27 CPFS10D 3.51 4.84 5.47 7.54
CPFS20B 3.87 5.28 5.76 7.86 CPFS20D 3.31 4.56 5.09 7.01
CPFS30B 3.57 4.91 5.39 7.42 CPFS30D 3.12 4.28 4.90 6.71
CQFS0B 3.88 5.39 5.73 7.96 CQFS0D 3.36 4.66 5.08 7.06
CQFS10B 4.11 5.71 6.21 8.63 CQFS10D 3.81 5.26 5.68 7.84
CQFS20B 3.97 5.51 5.81 8.04 CQFS20D 3.48 4.80 5.19 7.16
CQFS30B 3.76 5.21 5.58 7.73 CQFS30D 3.26 4.48 4.94 6.79
CRFS0B 4.00 5.64 5.81 8.18 CRFS0D 3.59 5.05 5.24 7.38
CRFS10B 4.23 5.90 6.51 9.07 CRFS10D 4.03 5.56 5.86 8.08
CRFS20B 4.10 5.71 5.89 8.26 CRFS20D 3.68 5.31 5.34 7.49
CRFS30B 3.91 5.45 5.72 7.98 CRFS30D 3.46 4.82 5.13 7.15
CSFS0B 4.08 5.83 5.86 8.24 CSFS0D 3.73 5.33 5.27 7.53
CSFS10B 4.36 6.27 6.80 9.76 CSFS10D 4.06 5.83 6.07 8.72
CSFS20B 4.24 6.08 5.94 8.40 CSFS20D 3.88 5.45 5.38 7.70
CSFS30B 3.98 5.57 5.76 8.01 CSFS30D 3.57 5.09 5.17 7.27
CTFS0B 4.16 5.94 5.96 8.52 CTFS0D 3.86 5.51 5.47 7.81
CTFS10B 4.58 6.50 6.95 9.88 CTFS10D 4.22 5.94 6.33 8.91
CTFS20B 4.41 6.26 6.04 8.60 CTFS20D 3.94 5.58 5.57 7.98
CTFS30B 4.07 5.81 5.89 8.39 CTFS30D 3.76 5.34 5.36 7.60
Sachin Patil et al./ IJETT, 69(3), 69-84, 2021
74
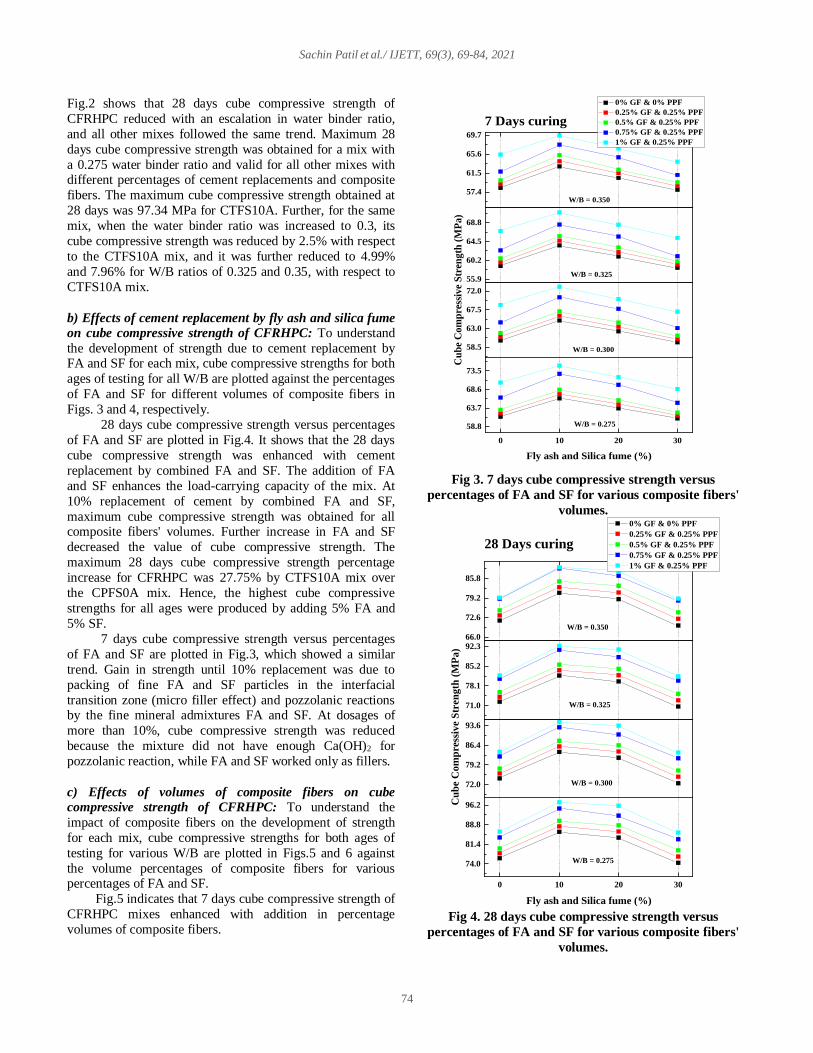
Fig.2 shows that 28 days cube compressive strength of
CFRHPC reduced with an escalation in water binder ratio,
and all other mixes followed the same trend. Maximum 28
days cube compressive strength was obtained for a mix with
a 0.275 water binder ratio and valid for all other mixes with different percentages of cement replacements and composite
fibers. The maximum cube compressive strength obtained at
28 days was 97.34 MPa for CTFS10A. Further, for the same
mix, when the water binder ratio was increased to 0.3, its
cube compressive strength was reduced by 2.5% with respect
to the CTFS10A mix, and it was further reduced to 4.99%
and 7.96% for W/B ratios of 0.325 and 0.35, with respect to
CTFS10A mix.
b) Effects of cement replacement by fly ash and silica fume
on cube compressive strength of CFRHPC: To understand
the development of strength due to cement replacement by FA and SF for each mix, cube compressive strengths for both
ages of testing for all W/B are plotted against the percentages
of FA and SF for different volumes of composite fibers in
Figs. 3 and 4, respectively. 28 days cube compressive strength versus percentages
of FA and SF are plotted in Fig.4. It shows that the 28 days
cube compressive strength was enhanced with cement
replacement by combined FA and SF. The addition of FA
and SF enhances the load-carrying capacity of the mix. At
10% replacement of cement by combined FA and SF,
maximum cube compressive strength was obtained for all composite fibers' volumes. Further increase in FA and SF
decreased the value of cube compressive strength. The
maximum 28 days cube compressive strength percentage
increase for CFRHPC was 27.75% by CTFS10A mix over
the CPFS0A mix. Hence, the highest cube compressive
strengths for all ages were produced by adding 5% FA and
5% SF.
7 days cube compressive strength versus percentages
of FA and SF are plotted in Fig.3, which showed a similar
trend. Gain in strength until 10% replacement was due to
packing of fine FA and SF particles in the interfacial
transition zone (micro filler effect) and pozzolanic reactions by the fine mineral admixtures FA and SF. At dosages of
more than 10%, cube compressive strength was reduced
because the mixture did not have enough Ca(OH)2 for
pozzolanic reaction, while FA and SF worked only as fillers.
c) Effects of volumes of composite fibers on cube
compressive strength of CFRHPC: To understand the
impact of composite fibers on the development of strength
for each mix, cube compressive strengths for both ages of
testing for various W/B are plotted in Figs.5 and 6 against
the volume percentages of composite fibers for various percentages of FA and SF.
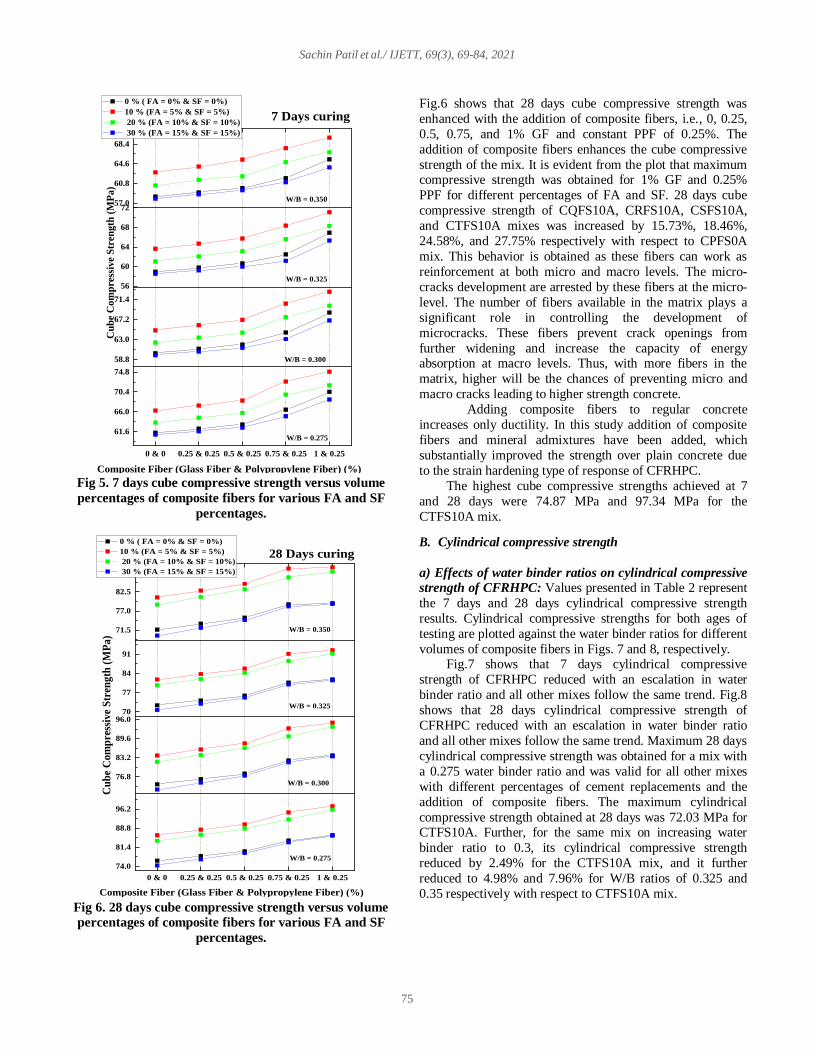
Fig.5 indicates that 7 days cube compressive strength of
CFRHPC mixes enhanced with addition in percentage
volumes of composite fibers.
Fig 3. 7 days cube compressive strength versus
percentages of FA and SF for various composite fibers'
volumes.
Fig 4. 28 days cube compressive strength versus
percentages of FA and SF for various composite fibers'
volumes.
0 10 20 30
58.8
63.7
68.6
73.5
58.5
63.0
67.5
72.0
55.9
60.2
64.5
68.8
57.4
61.5
65.6
69.7
Fly ash and Silica fume (%)
Cu
be
Co
mp
ress
ive
Str
eng
th (
MP
a)
0% GF & 0% PPF
0.25% GF & 0.25% PPF
0.5% GF & 0.25% PPF
0.75% GF & 0.25% PPF
1% GF & 0.25% PPF
7 Days curing
W/B = 0.350
W/B = 0.325
W/B = 0.300
W/B = 0.275
0 10 20 30
74.0
81.4
88.8
96.2
72.0
79.2
86.4
93.6
71.0
78.1
85.2
92.366.0
72.6
79.2
85.8
Fly ash and Silica fume (%)
Cu
be
Co
mp
ress
ive
Str
eng
th (
MP
a)
0% GF & 0% PPF
0.25% GF & 0.25% PPF
0.5% GF & 0.25% PPF
0.75% GF & 0.25% PPF
1% GF & 0.25% PPF
28 Days curing
W/B = 0.350
W/B = 0.325
W/B = 0.300
W/B = 0.275
Sachin Patil et al./ IJETT, 69(3), 69-84, 2021
75
Fig 5. 7 days cube compressive strength versus volume
percentages of composite fibers for various FA and SF
percentages.
Fig 6. 28 days cube compressive strength versus volume
percentages of composite fibers for various FA and SF
percentages.
Fig.6 shows that 28 days cube compressive strength was
enhanced with the addition of composite fibers, i.e., 0, 0.25,
0.5, 0.75, and 1% GF and constant PPF of 0.25%. The
addition of composite fibers enhances the cube compressive
strength of the mix. It is evident from the plot that maximum compressive strength was obtained for 1% GF and 0.25%
PPF for different percentages of FA and SF. 28 days cube
compressive strength of CQFS10A, CRFS10A, CSFS10A,
and CTFS10A mixes was increased by 15.73%, 18.46%,
24.58%, and 27.75% respectively with respect to CPFS0A
mix. This behavior is obtained as these fibers can work as
reinforcement at both micro and macro levels. The micro-
cracks development are arrested by these fibers at the micro-
level. The number of fibers available in the matrix plays a
significant role in controlling the development of
microcracks. These fibers prevent crack openings from
further widening and increase the capacity of energy absorption at macro levels. Thus, with more fibers in the
matrix, higher will be the chances of preventing micro and
macro cracks leading to higher strength concrete.
Adding composite fibers to regular concrete
increases only ductility. In this study addition of composite
fibers and mineral admixtures have been added, which
substantially improved the strength over plain concrete due
to the strain hardening type of response of CFRHPC.
The highest cube compressive strengths achieved at 7
and 28 days were 74.87 MPa and 97.34 MPa for the
CTFS10A mix.
B. Cylindrical compressive strength
a) Effects of water binder ratios on cylindrical compressive
strength of CFRHPC: Values presented in Table 2 represent
the 7 days and 28 days cylindrical compressive strength
results. Cylindrical compressive strengths for both ages of
testing are plotted against the water binder ratios for different
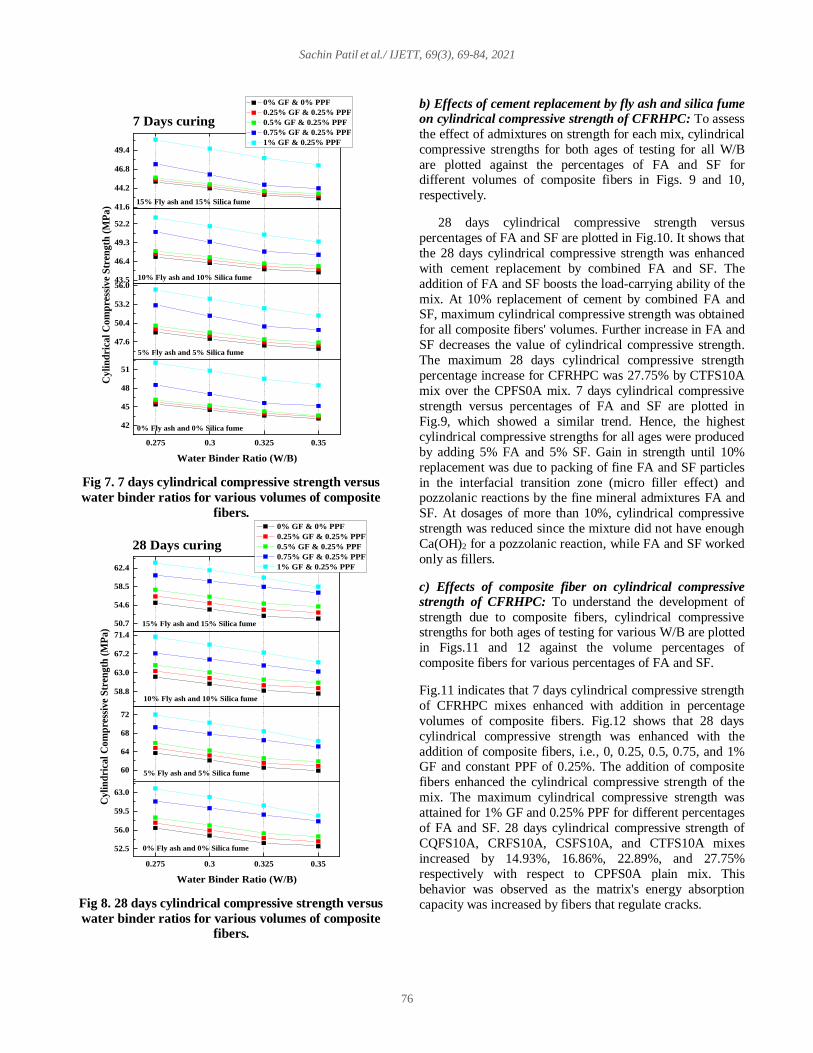
volumes of composite fibers in Figs. 7 and 8, respectively. Fig.7 shows that 7 days cylindrical compressive
strength of CFRHPC reduced with an escalation in water
binder ratio and all other mixes follow the same trend. Fig.8
shows that 28 days cylindrical compressive strength of
CFRHPC reduced with an escalation in water binder ratio
and all other mixes follow the same trend. Maximum 28 days
cylindrical compressive strength was obtained for a mix with
a 0.275 water binder ratio and was valid for all other mixes
with different percentages of cement replacements and the
addition of composite fibers. The maximum cylindrical
compressive strength obtained at 28 days was 72.03 MPa for CTFS10A. Further, for the same mix on increasing water
binder ratio to 0.3, its cylindrical compressive strength
reduced by 2.49% for the CTFS10A mix, and it further
reduced to 4.98% and 7.96% for W/B ratios of 0.325 and
0.35 respectively with respect to CTFS10A mix.
0 & 0 0.25 & 0.25 0.5 & 0.25 0.75 & 0.25 1 & 0.25
61.6
66.0
70.4
74.8
58.8
63.0
67.2
71.4
56
60
64
68
7257.0
60.8
64.6
68.4
Composite Fiber (Glass Fiber & Polypropylene Fiber) (%)
Cu
be
Co
mp
ress
ive
Str
eng
th (
MP
a)
7 Days curing
0 % ( FA = 0% & SF = 0%)
10 % (FA = 5% & SF = 5%)
20 % (FA = 10% & SF = 10%)
30 % (FA = 15% & SF = 15%)
W/B = 0.350
W/B = 0.325
W/B = 0.300
W/B = 0.275
0 & 0 0.25 & 0.25 0.5 & 0.25 0.75 & 0.25 1 & 0.25
74.0
81.4
88.8
96.2
76.8
83.2
89.6
96.070
77
84
91
71.5
77.0
82.5
88.0
Composite Fiber (Glass Fiber & Polypropylene Fiber) (%)
Cu
be
Com
pre
ssiv
e S
tren
gth
(M
Pa
)
28 Days curing
0 % ( FA = 0% & SF = 0%)
10 % (FA = 5% & SF = 5%)
20 % (FA = 10% & SF = 10%)
30 % (FA = 15% & SF = 15%)
W/B = 0.350
W/B = 0.325
W/B = 0.300
W/B = 0.275
Sachin Patil et al./ IJETT, 69(3), 69-84, 2021
76
Fig 7. 7 days cylindrical compressive strength versus
water binder ratios for various volumes of composite
fibers.
Fig 8. 28 days cylindrical compressive strength versus
water binder ratios for various volumes of composite
fibers.
b) Effects of cement replacement by fly ash and silica fume
on cylindrical compressive strength of CFRHPC: To assess
the effect of admixtures on strength for each mix, cylindrical
compressive strengths for both ages of testing for all W/B
are plotted against the percentages of FA and SF for different volumes of composite fibers in Figs. 9 and 10,
respectively.
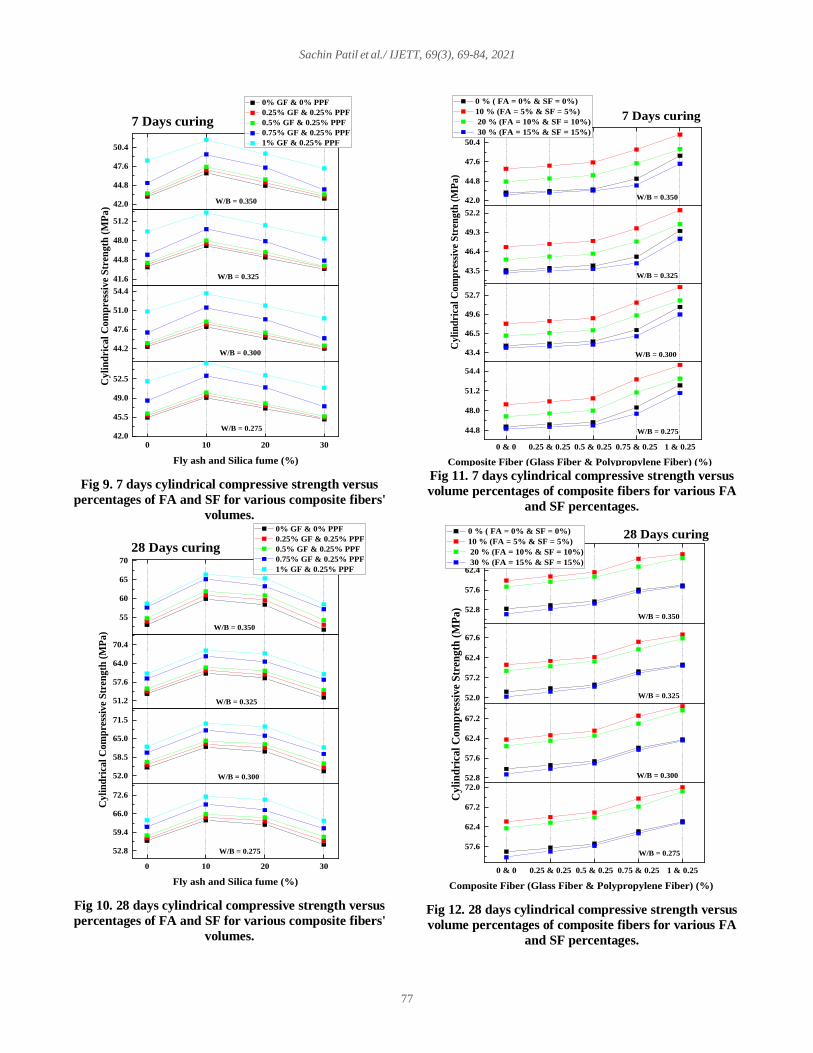
28 days cylindrical compressive strength versus
percentages of FA and SF are plotted in Fig.10. It shows that
the 28 days cylindrical compressive strength was enhanced
with cement replacement by combined FA and SF. The
addition of FA and SF boosts the load-carrying ability of the
mix. At 10% replacement of cement by combined FA and SF, maximum cylindrical compressive strength was obtained
for all composite fibers' volumes. Further increase in FA and
SF decreases the value of cylindrical compressive strength.
The maximum 28 days cylindrical compressive strength
percentage increase for CFRHPC was 27.75% by CTFS10A
mix over the CPFS0A mix. 7 days cylindrical compressive
strength versus percentages of FA and SF are plotted in
Fig.9, which showed a similar trend. Hence, the highest
cylindrical compressive strengths for all ages were produced
by adding 5% FA and 5% SF. Gain in strength until 10%
replacement was due to packing of fine FA and SF particles
in the interfacial transition zone (micro filler effect) and pozzolanic reactions by the fine mineral admixtures FA and
SF. At dosages of more than 10%, cylindrical compressive
strength was reduced since the mixture did not have enough
Ca(OH)2 for a pozzolanic reaction, while FA and SF worked
only as fillers.
c) Effects of composite fiber on cylindrical compressive
strength of CFRHPC: To understand the development of
strength due to composite fibers, cylindrical compressive strengths for both ages of testing for various W/B are plotted
in Figs.11 and 12 against the volume percentages of
composite fibers for various percentages of FA and SF.
Fig.11 indicates that 7 days cylindrical compressive strength
of CFRHPC mixes enhanced with addition in percentage
volumes of composite fibers. Fig.12 shows that 28 days
cylindrical compressive strength was enhanced with the
addition of composite fibers, i.e., 0, 0.25, 0.5, 0.75, and 1% GF and constant PPF of 0.25%. The addition of composite
fibers enhanced the cylindrical compressive strength of the
mix. The maximum cylindrical compressive strength was
attained for 1% GF and 0.25% PPF for different percentages
of FA and SF. 28 days cylindrical compressive strength of
CQFS10A, CRFS10A, CSFS10A, and CTFS10A mixes
increased by 14.93%, 16.86%, 22.89%, and 27.75%
respectively with respect to CPFS0A plain mix. This
behavior was observed as the matrix's energy absorption
capacity was increased by fibers that regulate cracks.
0.275 0.3 0.325 0.35
42
45
48
51
47.6
50.4
53.2
56.043.5
46.4
49.3
52.2
41.6
44.2
46.8
49.4
Water Binder Ratio (W/B)
Cyli
nd
rica
l C
om
pre
ssiv
e S
tren
gth
(M
Pa)
0% GF & 0% PPF
0.25% GF & 0.25% PPF
0.5% GF & 0.25% PPF
0.75% GF & 0.25% PPF
1% GF & 0.25% PPF
5% Fly ash and 5% Silica fume
10% Fly ash and 10% Silica fume
15% Fly ash and 15% Silica fume
7 Days curing
0% Fly ash and 0% Silica fume
0.275 0.3 0.325 0.35
52.5
56.0
59.5
63.0
60
64
68
72
58.8
63.0
67.2
71.4
50.7
54.6
58.5
62.4
Water Binder Ratio (W/B)
Cy
lin
dri
cal
Co
mp
ress
ive
Str
eng
th (
MP
a)
0% GF & 0% PPF
0.25% GF & 0.25% PPF
0.5% GF & 0.25% PPF
0.75% GF & 0.25% PPF
1% GF & 0.25% PPF
28 Days curing
0% Fly ash and 0% Silica fume
5% Fly ash and 5% Silica fume
10% Fly ash and 10% Silica fume
15% Fly ash and 15% Silica fume
Sachin Patil et al./ IJETT, 69(3), 69-84, 2021
77
Fig 9. 7 days cylindrical compressive strength versus
percentages of FA and SF for various composite fibers'
volumes.
Fig 10. 28 days cylindrical compressive strength versus
percentages of FA and SF for various composite fibers'
volumes.
Fig 11. 7 days cylindrical compressive strength versus
volume percentages of composite fibers for various FA
and SF percentages.
Fig 12. 28 days cylindrical compressive strength versus
volume percentages of composite fibers for various FA
and SF percentages.
0 10 20 3042.0
45.5
49.0
52.5
44.2
47.6
51.0
54.4
41.6
44.8
48.0
51.2
42.0
44.8
47.6
50.4
Fly ash and Silica fume (%)
Cyli
nd
rica
l C
om
pre
ssiv
e S
tren
gth
(M
Pa)
0% GF & 0% PPF
0.25% GF & 0.25% PPF
0.5% GF & 0.25% PPF
0.75% GF & 0.25% PPF
1% GF & 0.25% PPF
7 Days curing
W/B = 0.350
W/B = 0.325
W/B = 0.300
W/B = 0.275
0 10 20 30
52.8
59.4
66.0
72.6
52.0
58.5
65.0
71.5
51.2
57.6
64.0
70.4
55
60
65
70
Fly ash and Silica fume (%)
Cy
lin
dri
cal
Co
mp
ress
ive
Str
eng
th (
MP
a)
0% GF & 0% PPF
0.25% GF & 0.25% PPF
0.5% GF & 0.25% PPF
0.75% GF & 0.25% PPF
1% GF & 0.25% PPF
28 Days curing
W/B = 0.350
W/B = 0.325
W/B = 0.300
W/B = 0.275
0 & 0 0.25 & 0.25 0.5 & 0.25 0.75 & 0.25 1 & 0.25
44.8
48.0
51.2
54.4
43.4
46.5
49.6
52.7
43.5
46.4
49.3
52.2
42.0
44.8
47.6
50.4
Composite Fiber (Glass Fiber & Polypropylene Fiber) (%)
Cy
lin
dri
cal
Co
mp
ress
ive
Str
eng
th (
MP
a)
7 Days curing
0 % ( FA = 0% & SF = 0%)
10 % (FA = 5% & SF = 5%)
20 % (FA = 10% & SF = 10%)
30 % (FA = 15% & SF = 15%)
W/B = 0.350
W/B = 0.325
W/B = 0.300
W/B = 0.275
0 & 0 0.25 & 0.25 0.5 & 0.25 0.75 & 0.25 1 & 0.25
57.6
62.4
67.2
72.0
52.8
57.6
62.4
67.2
52.0
57.2
62.4
67.6
52.8
57.6
62.4
67.2
Composite Fiber (Glass Fiber & Polypropylene Fiber) (%)
Cy
lin
dri
cal
Co
mp
ress
ive
Str
eng
th (
MP
a)
28 Days curing 0 % ( FA = 0% & SF = 0%)
10 % (FA = 5% & SF = 5%)
20 % (FA = 10% & SF = 10%)
30 % (FA = 15% & SF = 15%)
W/B = 0.350
W/B = 0.325
W/B = 0.300
W/B = 0.275

Sachin Patil et al./ IJETT, 69(3), 69-84, 2021
78
Hence, the addition of composite fibers also contributes to
the cylindrical compressive strength of the mix.
Adding composite fibers to regular concrete increases
only ductility. In this study addition of composite fibers and
mineral admixtures have been added, which substantially
improved the strength over plain concrete due to the strain
hardening type of response of CFRHPC.
The highest cylindrical compressive strengths achieved
at 7 and 28 days were 55.40 MPa and 72.03 MPa for the
CTFS10A mix.
C. Split tensile strength
a) Effects of water binder ratios on split tensile strength of
CFRHPC: To understand the effect of water binder ratio on
the development of strength for each mix, split tensile strengths for both ages of testing are plotted against the
water binder ratios for different volumes of composite fibers
in Figs. 13 and 14 respectively.
Values presented in Table 3 represent the 7 days and 28
days split tensile strength results. Fig.13 shows that 7 days
split tensile strength of CFRHPC decreased with an increase
in water binder ratio, and all other mixes follow the same
trend.
Fig.14 shows that 28 days split tensile strength of
CFRHPC also reduced with an escalation in water binder
ratio and all other mixes followed the same trend. Maximum
28 days split tensile strength was obtained for a mix with a
0.275 water binder ratio and was valid for all other mixes
with different percentages of cement replacements and the
addition of composite fibers. The maximum split tensile
strength obtained at 28 days was 6.81 MPa for CTFS10A.
Further, for the same mix, when the water binder ratio was increased to 0.3, its split tensile strength was reduced by
4.55% for the CTFS10A mix, and it further reduced to
9.25% and 12.78% for W/B ratios of 0.325 and 0.35
respectively, with respect to CTFS10A mix.
b) Effects of cement replacement by fly ash and silica fume
on split tensile strength of CFRHPC: To assess the
development of strength for each mix due to mineral
admixtures, split tensile strengths for both ages of testing for all W/B are plotted against the percentages of FA and SF for
different volumes of composite fibers in Figs. 15 and 16,
respectively.
28 days split tensile strength versus percentages of FA
and SF are plotted in Fig.16. It shows that the 28 days split
tensile strength was enhanced with cement replacement by
combined FA and SF. The addition of FA and SF boosts the
load-carrying ability of the mix. 7 days of split tensile strength versus percentages of FA and SF are plotted in
Fig.15, which showed a similar trend.
Fig 13. 7 days split tensile strength versus water
binder ratios for various volumes of composite fibers.
Fig 14. 28 days split tensile strength versus water
binder ratios for various volumes of composite fibers.
0.275 0.3 0.325 0.35
3.12
3.51
3.90
4.29
3.60
4.05
4.50
4.95
3.51
3.90
4.29
4.68
3.15
3.50
3.85
4.20
Water Binder Ratio (W/B)
Sp
lit
Ten
sile
Str
ength
(M
Pa)
0% GF & 0% PPF
0.25% GF & 0.25% PPF
0.5% GF & 0.25% PPF
0.75% GF & 0.25% PPF
1% GF & 0.25% PPF
5% Fly ash and 5% Silica fume
10% Fly ash and 10% Silica fume
15% Fly ash and 15% Silica fume
7 Days curing
0% Fly ash and 0% Silica fume
0.275 0.3 0.325 0.35
3.90
4.55
5.20
5.85
4.32
5.04
5.76
6.48
4.02
4.69
5.36
6.03
4.27
4.88
5.49
6.10
Water Binder Ratio (W/B)
Sp
lit
Ten
sile
Str
eng
th (
MP
a)
0% GF & 0% PPF
0.25% GF & 0.25% PPF
0.5% GF & 0.25% PPF
0.75% GF & 0.25% PPF
1% GF & 0.25% PPF
28 Days curing
0% Fly ash and 0% Silica fume
5% Fly ash and 5% Silica fume
10% Fly ash and 10% Silica fume
15% Fly ash and 15% Silica fume
Sachin Patil et al./ IJETT, 69(3), 69-84, 2021
79
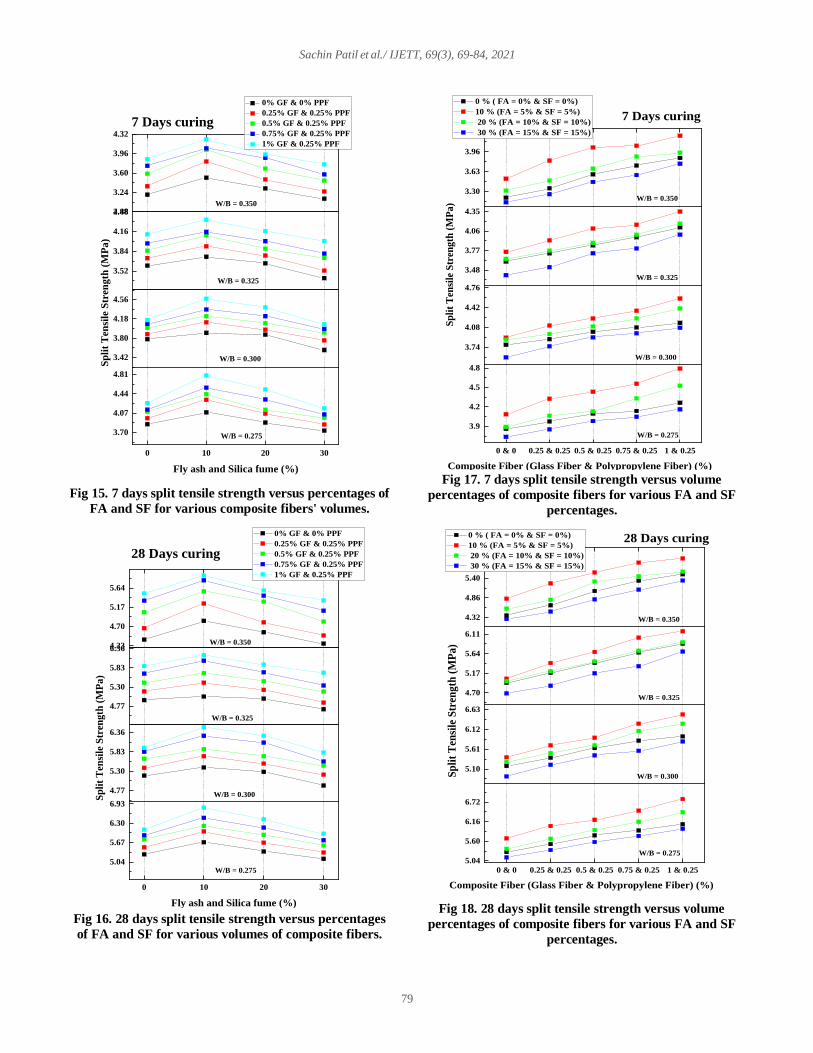
Fig 15. 7 days split tensile strength versus percentages of
FA and SF for various composite fibers' volumes.
Fig 16. 28 days split tensile strength versus percentages
of FA and SF for various volumes of composite fibers.
Fig 17. 7 days split tensile strength versus volume
percentages of composite fibers for various FA and SF
percentages.
Fig 18. 28 days split tensile strength versus volume
percentages of composite fibers for various FA and SF
percentages.
0 10 20 30
3.70
4.07
4.44
4.81
3.42
3.80
4.18
4.56
3.52
3.84
4.16
4.482.88
3.24
3.60
3.96
4.32
Fly ash and Silica fume (%)
Sp
lit
Ten
sile
Str
eng
th (
MP
a)
0% GF & 0% PPF
0.25% GF & 0.25% PPF
0.5% GF & 0.25% PPF
0.75% GF & 0.25% PPF
1% GF & 0.25% PPF
7 Days curing
W/B = 0.350
W/B = 0.325
W/B = 0.300
W/B = 0.275
0 10 20 30
5.04
5.67
6.30
6.93
4.77
5.30
5.83
6.36
4.77
5.30
5.83
6.364.23
4.70
5.17
5.64
Fly ash and Silica fume (%)
Sp
lit
Ten
sile
Str
ength
(M
Pa)
0% GF & 0% PPF
0.25% GF & 0.25% PPF
0.5% GF & 0.25% PPF
0.75% GF & 0.25% PPF
1% GF & 0.25% PPF
28 Days curing
W/B = 0.350
W/B = 0.325
W/B = 0.300
W/B = 0.275
0 & 0 0.25 & 0.25 0.5 & 0.25 0.75 & 0.25 1 & 0.25
3.9
4.2
4.5
4.8
3.74
4.08
4.42
4.76
3.48
3.77
4.06
4.35
3.30
3.63
3.96
4.29
Composite Fiber (Glass Fiber & Polypropylene Fiber) (%)
Sp
lit
Ten
sile
Str
eng
th (
MP
a)
7 Days curing
0 % ( FA = 0% & SF = 0%)
10 % (FA = 5% & SF = 5%)
20 % (FA = 10% & SF = 10%)
30 % (FA = 15% & SF = 15%)
W/B = 0.350
W/B = 0.325
W/B = 0.300
W/B = 0.275
0 & 0 0.25 & 0.25 0.5 & 0.25 0.75 & 0.25 1 & 0.25
5.04
5.60
6.16
6.72
5.10
5.61
6.12
6.63
4.70
5.17
5.64
6.11
4.32
4.86
5.40
5.94
Composite Fiber (Glass Fiber & Polypropylene Fiber) (%)
Sp
lit
Ten
sile
Str
eng
th (
MP
a)
28 Days curing 0 % ( FA = 0% & SF = 0%)
10 % (FA = 5% & SF = 5%)
20 % (FA = 10% & SF = 10%)
30 % (FA = 15% & SF = 15%)
W/B = 0.350
W/B = 0.325
W/B = 0.300
W/B = 0.275

Sachin Patil et al./ IJETT, 69(3), 69-84, 2021
80
At 10% replacement of cement by combined FA and
SF, maximum split tensile strength was obtained for all
volumes of composite fibers as combined pozzolanic
activity, and the addition of FA and SF enhanced micro filler
effects. Further increase in FA and SF decreases the value of split tensile strength due to lack of Ca(OH)2 for the
pozzolanic reaction. The maximum 28 days split strength
percentage increase for CFRHPC was 28.72% for the
CTFS10A mix over the CPFS0A mix. Hence, the highest
split tensile strengths for all ages were produced by adding
5% FA and 5% SF.
c) Effects of composite fiber on split tensile strength of
CFRHPC: To understand the development of split tensile strength for each mix, split tensile strengths for both ages of
testing for all W/B are plotted in Figs.17 and 18 against the
volume percentages of composite fibers for various
percentages of FA and SF.
Fig.17 indicates that 7 days split tensile strength of
CFRHPC mixes enhanced with addition in percentage
volumes of composite fibers. Fig.18 shows that 28 days split
tensile strength was enhanced with the addition of composite fibers, i.e., 0, 0.25, 0.5, 0.75, and 1% GF and constant PPF
of 0.25%. These results justify that the reinforcing of
composite fibers contributes to the split tensile strength for
the CFRHPC. It can be further observed that maximum split
tensile strength was obtained for 1% GF and 0.25% PPF for
different FA and SF percentages. Split tensile strength of
CQFS10A, CRFS10A, CSFS10A, and CTFS10A mixes
were increased by 14.10%, 17.41%, 22.40%, and 28.72%,
respectively, with respect to the CPFS0A mix for 28 days. It
can be confidently concluded that higher volumes of fibers
in the medium delay forming the foremost major crack as
bonding is formed between matrix and fibers, which stabilizes the micro-cracks forming at the micro-level. This
action increases the matrix's tensile strength, proving that
fiber inclusion in CFRHPC mixes is more productive in
improving tensile strength than compressive strength. The
highest split tensile strengths achieved at 7 and 28 days were
4.79 MPa and 6.81 MPa, respectively, for the CTFS10A
mix.
D. Flexural strength
a) Effects of water binder ratios on flexural strength of
CFRHPC: Values presented in Table 3 represent the 7 days
and 28 days flexural strength results. For both ages of
testing, flexural strengths are plotted against the water binder
ratios for different volumes of composite fibers in Figs. 19
and 20 respectively.
Fig.19 shows that 7 days flexural strength of
CFRHPC reduced with an escalation in water binder ratio,
and all other mixes follow the same trend.
Fig 19. 7 days split tensile strength versus water binder
ratios for various volumes of composite fibers.
Fig 20. 28 days split tensile strength versus water binder
ratios for various volumes of composite fibers.
0.275 0.3 0.325 0.35
4.95
5.40
5.85
6.30
5.76
6.40
7.04
7.68
5.10
5.61
6.12
6.63
4.73
5.16
5.59
6.02
Water Binder Ratio (W/B)
Fle
xu
ral
Str
ength
(M
Pa)
0% GF & 0% PPF
0.25% GF & 0.25% PPF
0.5% GF & 0.25% PPF
0.75% GF & 0.25% PPF
1% GF & 0.25% PPF
5% Fly ash and 5% Silica fume
10% Fly ash and 10% Silica fume
15% Fly ash and 15% Silica fume
7 Days curing
0% Fly ash and 0% Silica fume
0.275 0.3 0.325 0.35
6.3
7.2
8.1
9.0
7.7
8.8
9.9
11.06.4
7.2
8.0
8.8
6.75
7.50
8.25
9.00
Water Binder Ratio (W/B)
Fle
xu
ral
Str
eng
th (
MP
a)
0% GF & 0% PPF
0.25% GF & 0.25% PPF
0.5% GF & 0.25% PPF
0.75% GF & 0.25% PPF
1% GF & 0.25% PPF
28 Days curing
0% Fly ash and 0% Silica fume
5% Fly ash and 5% Silica fume
10% Fly ash and 10% Silica fume
15% Fly ash and 15% Silica fume

Sachin Patil et al./ IJETT, 69(3), 69-84, 2021
81
Fig.20 shows that 28 days flexural strength of
CFRHPC also reduced with an escalation in water binder
ratio, and all other mixes follow the same trend. Maximum
28 days flexural strength was obtained for a mix with a
0.275 water binder ratio and was valid for all other mixes with different percentages of cement replacements and the
addition of composite fibers. The maximum flexural strength
obtained at 28 days was 10.79 MPa for the CTFS10A mix.
Further, for the same mix, when the water binder ratio was
increased to 0.3, its compressive strength was reduced by
8.43% for the CTFS10A mix, and it was further reduced to
10.84% and 17.42% for W/B ratios of 0.325 and 0.35,
respectively with respect to CTFS10A mix.
b) Effects of cement replacement by fly ash and silica fume
on flexural strength of CFRHPC: Flexural strengths for
both ages of testing are plotted versus the percentages of FA
and SF for all W/B with different volumes of composite
fibers in Figs. 21 and 22, respectively.
Values presented in Table 2 represent the 7 days and 28
days flexural strength results. 28 days flexural strength
versus percentages of FA and SF are plotted in Fig.22. It shows that the flexural strength at 28 days was also
enhanced with cement replacement by combined FA and SF.
The combined effect of FA and SF boosts the load-carrying
ability of the mix. FA and SF obtain maximum flexural
strength at 10% replacement of cement for all composite
fibers' volumes. Fig.21 shows that 7 days flexural strength of
CFRHPC mixes also showed a similar trend.
Further increase in FA and SF decreases the value of
flexural strength as these mineral admixtures acted only as fillers rather than contributing to pozzolanic reaction due to
lack of calcium hydroxide. The maximum 28 days flexural
strength percentage increase for CFRHPC was 32.67% by
CTFS10A mix over the CPFS0A mix. Hence, the highest
flexural strengths for all ages were produced by adding 5%
FA and 5% SF.
c) Effects of composite fiber on flexural strength of
CFRHPC: To understand the effects of volumes of composite fibers on flexural strength for each mix, the 7
days and 28 days flexural strengths for all W/B are plotted in
figs.23 and 24 against the volume percentages of composite
fibers for various percentages of FA and SF.
Fig.23 indicates that 7 days flexural strengths of the
CFRHPC mix were enhanced with the addition of
percentage volumes of composite fibers. Fig.24 shows that
28 days of flexural strength was also enhanced with the addition of composite fibers, i.e., 0, 0.25, 0.5, 0.75, and 1%
GF and constant PPF of 0.25%. The adding of composite
fibers enhanced the flexural strength of the CFRHPC.
Maximum flexural strength was obtained for 1% GF and
0.25% PPF for different percentages of FA and SF. 28 days
flexural strength of CQFS10A, CRFS10A, CSFS10A, and
CTFS10A mixes
Fig 21. 7 days flexural strength versus percentages of FA
and SF for various composite fibers volumes.
Fig 22. 28 days flexural strength versus percentages of
FA and SF for various composite fibers' volumes.
0 10 20 30
5.58
6.20
6.82
7.44
5.5
6.0
6.5
7.0
5.12
5.76
6.40
7.04
4.80
5.28
5.76
6.24
Fly ash and Silica fume (%)
Fle
xu
ral
Str
ength
(M
Pa)
0% GF & 0% PPF
0.25% GF & 0.25% PPF
0.5% GF & 0.25% PPF
0.75% GF & 0.25% PPF
1% GF & 0.25% PPF
7 Days curing
W/B = 0.350
W/B = 0.325
W/B = 0.300
W/B = 0.275
0 10 20 30
7.68
8.64
9.60
10.56
7.11
7.90
8.69
9.48
6.80
7.65
8.50
9.35
6.39
7.10
7.81
8.52
Fly ash and Silica fume (%)
Fle
xu
ral
Str
eng
th (
MP
a)
0% GF & 0% PPF
0.25% GF & 0.25% PPF
0.5% GF & 0.25% PPF
0.75% GF & 0.25% PPF
1% GF & 0.25% PPF
28 Days curing
W/B = 0.350
W/B = 0.325
W/B = 0.300
W/B = 0.275

Sachin Patil et al./ IJETT, 69(3), 69-84, 2021
82
Fig 23. 7 days flexural strength versus volume
percentages of composite fibers for various FA and SF
percentages.
Fig 24. 28 days flexural strength versus volume
percentages of composite fibers for various FA and SF
percentages.
increased by 11%, 21.27%, 28.31%, and 32.67%,
respectively, with respect to CPFS0A mix. Hence, the
addition of composite fibers also contributes to the flexural
strength of the mix due to the presence of these uniformly
dispersed composite fibers, which acts as crack arresters to enhance the properties of concrete as bonding is formed
between matrix and fibers, which in turn stabilizes the
micro-cracks forming at the micro-level.
The highest flexural strengths achieved at 7 and 28
days were 7.59 MPa and 10.79 MPa for the CTFS10A mix.
E. Inter-Relationships between various properties of fly
ash and silica fume based CFRHPC
There is an absence of efficient research to propose
an inter-relationship between Cube compressive strength
with cylindrical compressive strength, split tensile strength,
and flexural strength for FA and SF based CFRHPC. From
the experimental investigation results on various FA and SF-
based CFRHPC mixes, inter-relationships between the
different properties such as cube compressive strength,
cylindrical compressive strength, split tensile strength, and
flexural strength were derived. The inter-relationships will be valuable to estimate the cylindrical compressive strength,
tensile strength, and flexural strength of any FA and SF
based CFRHPC mixes from its cube compressive strength.
a) Relationship between cube compressive strength and
cylindrical compressive strength: The relationship between
the cube compressive strength and cylindrical compressive
strength of FA and SF based CFRHPC mixes are presented in Fig 25.
Fig 25. The square root of 28 days cubes compressive
strength versus 28 days cylindrical compressive strength
of FA and SF based CFRHPC. Using the square root function, a basic regression model has been established based on the CFRHPC behavior
in the present investigation to forecast the cylindrical
compressive strength of FA and SF based CFRHPC mixes
0 & 0 0.25 & 0.25 0.5 & 0.25 0.75 & 0.25 1 & 0.25
6.24
6.76
7.28
7.80
5.72
6.24
6.76
7.28
5.13
5.70
6.27
6.84
4.92
5.33
5.74
6.15
Composite Fiber (Glass Fiber & Polypropylene Fiber) (%)
Fle
xu
ral
Str
ength
(M
Pa)
7 Days curing
0 % ( FA = 0% & SF = 0%)
10 % (FA = 5% & SF = 5%)
20 % (FA = 10% & SF = 10%)
30 % (FA = 15% & SF = 15%)
W/B = 0.350
W/B = 0.325
W/B = 0.300
W/B = 0.275
0 & 0 0.25 & 0.25 0.5 & 0.25 0.75 & 0.25 1 & 0.25
7.65
8.50
9.35
10.20
7.04
7.92
8.80
9.68
6.93
7.70
8.47
9.24
7.04
7.68
8.32
8.96
Composite Fiber (Glass Fiber & Polypropylene Fiber) (%)
Fle
xu
ral
Str
eng
th (
MP
a)
28 Days curing 0 % ( FA = 0% & SF = 0%)
10 % (FA = 5% & SF = 5%)
20 % (FA = 10% & SF = 10%)
30 % (FA = 15% & SF = 15%)
W/B = 0.350
W/B = 0.325
W/B = 0.300
W/B = 0.275
8.19 8.40 8.61 8.82 9.03 9.24 9.45 9.66 9.87
50
55
60
65
70
75
Cylindrical Compressive Strength (28 Days)
Linear Fit
Cyli
nd
rica
l C
om
pre
ssiv
e S
tren
gth
(2
8 D
ay
s) (
Mp
a)
Square Root of Cube Compressive Strength (28 Days) (Mpa)
Equation y = a + b*x
PlotCylindrical Compressiv
e Strength (28 Days)
Weight No Weighting
Intercept 0 ± --
Slope 6.6903 ± 0.03012
Residual Sum of Squa 472.90624
Pearson's r 0.9992
R-Square (COD) 0.9984
Adj. R-Square 0.99838

Sachin Patil et al./ IJETT, 69(3), 69-84, 2021
83
and shown below.
𝑓𝑐𝑐𝑠 = 6.690√𝑓𝑐𝑘
Where fccs is the Cylindrical compressive strength
and fck is the Cube compressive strength in MPa. This
relation can be used for predicting the cylindrical
compressive strength of FA and SF based CFRHPC mixes.
b) Relationship between cube compressive strength and
split tensile strength: The relationship between the cube
compressive strength and split tensile strength of FA and SF
based CFRHPC mixes is presented in Figure 26.
Fig 26. The square root of 28 days cube compressive
strength versus 28 days split tensile strength of FA and
SF based CFRHPC. Using the square root function, a basic regression
model has been established based on the CFRHPC behavior
in the present investigation for forecasting the split tensile
strength of FA and SF based CFRHPC mixes and is shown
below.
𝑓𝑠𝑡𝑠 = 0.608√𝑓𝑐𝑘
Where fsts is the Split tensile strength and fck is
the Cube compressive strength in MPa. This relation can be
used for predicting the split tensile strength of FA and SF
based CFRHPC mixes.
c) Relationship between cube compressive strength and flexural strength: The relationship between the cube
compressive and flexural strengths of FA and SF based
CFRHPC mixes is presented in Fig 27 from the present
experimental study results.
The following relationship between cube
compressive strength and flexural strength of CFRHPC is
developed from the linear regression presented in the figure.
𝑓𝑓𝑠 = 0.901√𝑓𝑐𝑘
Where ffs is the Flexural strength and fck is the
Cube compressive strength in MPa.
Fig 27. The square root of 28 days cubes compressive
strength versus 28 days flexural strength of FA and SF
based CFRHPC.
V. CONCLUSIONS In this experimental work, the performance of CFRHPC
produced with FA, SF, GF, and PPF was investigated. The
following conclusions are drawn after the analysis of the
results
• It can be concluded that the compressive, tensile, and
flexural strengths of CFRHPC reduced with an escalation in
water binder ratio, and all other mixes followed the same trend. For both ages of curing, maximum strengths were
obtained for a mix with a 0.275 water binder ratio and valid
for all other mixes with different percentages of cement
replacements and composite fibers.
• It is evident from the analysis of experimental results
that for all the ages of concrete testing done, the mechanical
properties of CFRHPC mix increases with a rise in the
percentage of FA and SF up to 10% replacement level and further, strength decreases with an increase in cement
replacement beyond 10% level. Thus, CFRHPC mixes with a
10% mineral admixture replacement level produced
maximum values of mechanical properties and is valid for
both ages of testing done.
• For both testing ages of concrete done, composite fibers'
addition enhanced the strength properties of CFRHPC mixes.
The maximum values of strength properties were obtained for CFRHPC mixes with 1% GF and 0.25% PPF and valid
for both ages of testing.
• It can be concluded that the split tensile strength and
flexural strength of high-performance concrete reinforced
with GF and PPF were enhanced with the composite fibers'
inclusion. However, composite fibers' effect on the cube
8.19 8.40 8.61 8.82 9.03 9.24 9.45 9.66 9.87
4.0
4.5
5.0
5.5
6.0
6.5
7.0
Split Tensile Strength (28 Days)
Linear Fit
Sp
lit
Ten
sile
Str
eng
th (
28
Da
ys)
(M
pa
)
Square Root of Compressive Strength (28 Days) (Mpa)
Equation y = a + b*x
PlotSplit Tensile Strength (28
Days)
Weight No Weighting
Intercept 0 ± --
Slope 0.60882 ± 0.00417
Residual Sum of Squar 9.05947
Pearson's r 0.99815
R-Square (COD) 0.99631
Adj. R-Square 0.99626
8.19 8.40 8.61 8.82 9.03 9.24 9.45 9.66 9.87
6.5
7.0
7.5
8.0
8.5
9.0
9.5
10.0
10.5
11.0
Flexural Strength (28 Days)
Linear Fit
Fle
xu
ral
Str
eng
th (
28
Da
ys)
(M
pa
)
Square Root of Compressive Strength (28 Days) (Mpa)
Equation y = a + b*x
Plot Flexural Strength (2
Weight No Weighting
Intercept 0 ± --
Slope 0.90145 ± 0.00732
Residual Sum of Sq 27.94965
Pearson's r 0.9974
R-Square (COD) 0.99481
Adj. R-Square 0.99475
Sachin Patil et al./ IJETT, 69(3), 69-84, 2021
84
compressive strength and cylindrical compressive strength
was minimal.
• The regression equations developed to indicate a good
correlation. These relationships can be effectively used for
predicting the cylindrical compressive strength, split tensile
strength flexural strength of FA and SF based CFRHPC
mixes.
• Hence, it can be concluded that the combined effect of
FA and SF at 5% each as replacement of cement and the addition of composite fiber dosage of GF=1% and
PPF=0.25% for W/B of 0.275 was found to be the optimum
combination to obtain maximum mechanical properties for
CFRHPC.
The conclusions above demonstrate the viability of using FA
and SF and composite fibers (GF and PFF) in CFRHPC
production, minimizing enormous cement production and
safeguards the environment from pollution.
REFERENCES [1] E.G. Nawy, Fundamentals of high strength high performance
concrete, Addison-Wesley Longman, (1996).
[2] S.A. Abdul-Wahab, G.A. Al-Rawas, S. Ali, H. Al-Dhamri,
Assessment of greenhouse CO2 emissions associated with the cement
manufacturing process, Environ. Forensics. 17(2016) 338–354.
https://doi.org/10.1080/15275922.2016.1177752.
[3] A.Report, ACTIVITY., (2019).
[4] P.K. Mehta, Role of pozzolanic and cementious material in
sustainable development of the concrete industry, Spec. Publ.
178(1998) 1–20.
[5] Malhotra, V. M., Superplasticized fly ash concrete for structural
applications., Concrete International 8(12)(1986) 28-31.
[6] Nath, Pradip, and Prabir Sarker., Effect of fly ash on the durability
properties of high strength concrete., Procedia Engineering 14 (2011)
1149-1156.
[7] Malhotra, V. M., Durability of concrete incorporating high-volume of
low-calcium (ASTM Class F) fly ash., Cement and Concrete
Composites 12(4)(1990) 271-277.
[8] Karahan, Okan, and Cengiz Duran Atiş., The durability properties of
polypropylene fiber reinforced fly ash concrete., Materials & Design
32(2)(2011) 1044-1049.
[9] K. Torii and M. Kawamura., Pore structure and chloride ion
permeability of mortars containing silica fume., Cem. Concr.
Compos., 16(4)(1994) 279–286.
[10] S. Barbhuiya and M. Qureshi., Effects of Silica Fume on the Strength
and Durability Properties of Concrete., Cesdoc, no. December 2016,
(2016) 117–120.
[11] D. Pedro, J. de Brito, and L. Evangelista., Durability performance of
high-performance concrete made with recycled aggregates, fly ash
and densified silica fume., Cem. Concr. Compos., 93(2018) 63–74
doi: 10.1016/j.cemconcomp.2018.07.002.
[12] P. Muthupriya, K. Subramanian, and B. G. Vishnuram., Strength and
durability characteristics of high performance concrete., Int. J. Earth
Sci. Eng., 3(3)(2010) 416–433.
[13] K. S. Rebeiz., Strength and durability properties of polyester concrete
using pet and fly ash wastes., Adv. Perform. Mater., 3(2)(1996) 205–
214 doi: 10.1007/BF00136746.
[14] P. M. Anilkumar, R. M, and S. J., Effects of silica fume and fly ash
on durability characteristics of high performance concrete., Int. J.
Emerg. Technol. Adv. Eng., 4(10)(2014) 298–303.
[15] P. Zhang and Q. F. Li., Effect of silica fume on durability of concrete
composites containing fly ash., Sci. Eng. Compos. Mater.,
20(1)(2013) 57–65, doi: 10.1515/secm-2012-0081.
[16] P. Zhang and Q. F. Li., Effect of polypropylene fiber on durability of
concrete composite containing fly ash and silica fume., Compos. Part
B Eng., 45(1)(2013) 1587–1594, doi:
10.1016/j.compositesb.2012.10.006.
[17] Sachin Patil, Dr.H.M. Somasekharaiah, Dr. H. Sudarsana Rao.,
Evaluation of Strength Properties of Fly ash and Metakaolin Based
Composite Fiber (Glass and Polypropylene) Reinforced High-
Performance Concrete International Journal of Engineering Trends
and Technology 69.4(2021) 188-203.doi: 10.14445/22315381/IJETT-
V69I4P227
[18] Sachin Patil, Dr.H.M. Somasekharaiah, Dr. H. Sudarsana Rao.,
Chloride Penetration Resistance and Behaviour Under Acid Attack of
Metakaolin and Silica Fume Based Composite Fiber (Glass and
Polypropylene) Reinforced High Performance Concrete.,
International Journal of Engineering Trends and Technology
69.4(2021) 146-161. doi: 10.14445/22315381/IJETT-V69I4P222
[19] G. Barluenga, F. Hernández-Olivares, Cracking control of concretes
modified with short AR-glass fibers at early age. Experimental results
on standard concrete and SCC, Cem. Concr. Res. 37(2007) 1624–
1638. https://doi.org/10.1016/j.cemconres.2007.08.019.
[20] I. Journal, G. S. Volume, and C. Jyothi., Mechanical characteristics
of Hardened concrete with mineral admixtures Silica fume and fly
ash, 6(3)(2018) 21–29.
[21] M. S. T. Ansari, A. Swarup, and D. Yadav., Partially replacement of
cement with flyash and silica fumes., 4(2018) 872–877.
[22] R. M. D. M. Sanjeewa, P. S. K. Pathirana, and H. D. Yapa., Mix
Design Aspects of High Performance Concrete Comprised of Silica
Fume and Fly Ash, Eng. J. Inst. Eng. Sri Lanka, 50(4) 23, (2017),
doi: 10.4038/engineer.v50i4.7272.
[23] M. A. Samee, M. A. Samee, M. A. S. Ahmed, M. Kaiser, and M.
Safiuddin., Partial Replacement of Cement in Concrete with Fly Ash
and Micro Silica., Int. J. Civ. Eng., 4(4)(2017) 49–51 doi:
10.14445/23488352/ijce-v4i4p110.
[24] S. Sundararaman and S. Azhagarsamy., Partial Replacement of
Cement with Fly Ash and Silica Fume for Sustainable Construction.,
Int. Res. J. Eng. Technol., (2016) 752–755, [Online]. Available:
www.irjet.net.
[25] S. Goyal, M. Kumar, and B. Bhattacharjee., The Influence of Flyash
Addition on Fresh Properties of Silica Fume Concrete, 1–16 (2018).
[26] K. R. S. Maruthi Raj, M. Prathap, V. Srinivas, and M. Zoheb Nawaz.,
Total replacement of cement using silica fume and fly ash, Int. J. Civ.
Eng. Technol., 8(11)(2017) 421–426.
[27] T. V. S. V. Lakshmi, P. S. Adiseshu, and F. Ash., A Study on
Preparing Of High Performance Concrete Using Silica Fume and Fly
Ash Chemical Properties,(2016) 29–35, 2016.
[28] A. Kumar, N. Kisku, and F. Ash., Effect of Silica Fume and Fly Ash
as Partial, 18618–18624, doi: 10.15680/IJIRSET.2016.0510070.
[29] A. Sadrmomtazi, B. Tahmouresi, and R. K. Khoshkbijari., Effect of
fly ash and silica fume on transition zone, pore structure and
permeability of concrete., Mag. Concr. Res., 70(10)(2018) 519–532,
doi: 10.1680/jmacr.16.00537.
[30] D. Wang, Y. Ju, H. Shen, L. Xu, Mechanical properties of high
performance concrete reinforced with basalt fiber and polypropylene
fiber, Constr. Build. Mater. 197(2019) 464–473.
https://doi.org/10.1016/j.conbuildmat.2018.11.181.