effect of exchange sodium on the moisture equivalent and
TRANSCRIPT

EFFECT OF EXCHANGE SODIUM ON THE MOISTUREEQUIVALENT AND THE WILTING COEFFICIENT OFSOILS l
By FRANK M. EATON,~ senior plant physiologist, United States Regional SalinityLaboratory,,3 Bureau of Plant Industry, and CHARLES R. HO R T O N, formerlyagent, Division of Irrigation Agriculture, Bureau of Plant Industry, UnitedStates Department of Agriculture 4
INTRODUCTION
Laboratory research by numerous investigators has shown thatsodium adsorbed by the clay complex of soils increases dispersion,pH values, swelling, osmotic imbibition, migration velocity, apparentdensity of puddled soils, and the hardness of dry aggregates; and lowersheat of wetting, sticky point, and permeability.
The moisture equivalent (3, 4)” and wilting coefficient (5), morethan any other soil constants, have come into extensive use as ref-erence points for the water relations of soils and plants. Sharp andWaynick (17), Joseph (10), Anderson (1), and others (20) have beenin agreement in finding that adsorbed sodium markedly increases themoisture equivalent. Veihmeyer and Hendrickson (21) have con-cluded, however, that the change, when any, can be attributed tosoil puddling. In connection with all results it can be appropriatelymentioned that the magnitude of the effect that adsorbed sodium hason soil characteristics is related to the amount and character of theclay of the soil, to the extent to which other ions are replaced bysodium, and to the extent to which flocculating electrolytes areremoved.
No one has reported on the effects of adsorbed sodium on the avail-ability of moisture to plants in the wilting range, and,. so far as thewriters have been able to learn, no investigations have been conducted.
In agreement with laboratory findings, it has been extensivelyobserved that when lands are irrigated with water containing a highproportion of sodium relative to the concentrations of other bases the
permeability tends to be reduced. Accompanying the effects ofadsorbed sodium on permeability are other adverse consequences,such as the accumulation in the root zone of the salt constituents ofirrigation waters, increased erodibility, the loss of good tilth, andconsequent unsatisfactory seedbeds. It is a common observation that
1 Received for publication April 10, 1940.1 Formerly physiologist, Division of Irrigation Agriculture; now of the Division of Cotton and Other
Fiber Plants and Diseases, stationed at College Station, Tex.1 Riverside, Calif.4 The authors gratefully acknowledge their indebtedness to George Y. Blair, assistant pomologist, Divi-
sion of Irrigation Agriculture. for the major portion of the measurements of the willing points reported inthis paper.
b Italic numbers in parentheses refer to Literature Cited, p. 424.
Journal of Agricultural Research,Washington, D . C.
(401)

402 Journal of Agricultural Research Vol. 61, No. 6
soils with much adsorbed sodium are less permeable to rain waterthan they are to saline irrigation waters.
The expression “percent sodium,” as used by Eaton (7) to designatethe relation
Sodium-total base ratio=milliequivalents Na X 100
milliequivalents of total bases ’
has come to be regarded as an important water-quality characteriza-tion. Because of the diversity of factors that bear on permeabilityand exchange reactions and the quantitative relationships involved,it has not been possible to closely delimit the concentrations and pro-portions of sodium in natural waters that should be avoided ordesignated as undesirable.
The relationships between adsorbed sodium and moisture equiva-lent that are reported on in this paper were investigated for the pur-pose of exploring the possibility of utilizing the moisture equivalentas an index to sodium-induced dispersion. As a part of the inquiry,comparisons were made between calcium-treated and sodium-treatedsoils with respect to (1) the effect of the acceleration rate of the cen-trifuge on the moisture equivalent; (2) the migration and segregationof sand, silt, and clay in dispersed soils during centrifuging; (3) thedistribution of moisture in Ca soils and Na soils after centrifuging;(4) the effect of flocculation by electrolytes on the moisture equivalentof Na soils; and (5) the quantity of sodium that significantly affectedmoisture equivalent values when Ca and Na soils were mixed indifferent proportions. Finally, moisture equivalent and hydro-scopicity comparisons were made between soils saturated with calcium,magnesium, sodium, and potassium. This was done for the purposeof determining whether the effects of potassium most closely resem-bled those of calcium and magnesium or those of sodium.
The relationships between the adsorbed sodium and moisture avail-ability were investigated with 12 soils, both at the wilting coefficientand at the ultimate wilting point. The resulting data, together withthe moisture equivalent values, are graphically presented with theuse of a pF scale.6 (See fig. 3.)
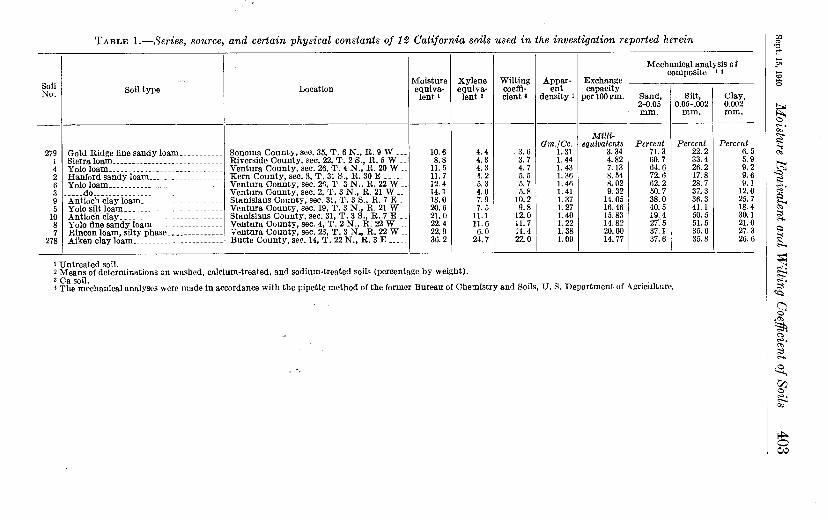
DESCRIPTION OF SOILS, DEFINITIONS, AND METHODS. The source, classification, and certain physical constants of the
12 soils used for these investigations are reported in table 1.MOISTURE EQUIVALENT
The moisture-equivalent values represent the percentage of mois-ture remaining in 30-gm. samples of soil that had been saturated for24 hours, drained for 30 minutes, and then centrifuged for 30 minutesin standard cups in a standard moisture equivalent centrifuge drumoperated at a rotational speed of 2,440 r. p. rn.’ The centrifuge cameto full speed in 15 seconds. Any free water remaining on the surfaceof the soil after centrifuging was removed by inverting the cups forseveral minutes and then wiping their inside walls with blotting paper,
0 The pF value of soils is the logarithm of the equivalent capillary tension expressed in centimeters of watercolumn.
7 The centrifuge drum was belt-driven from a 1-hp. polyphase induction motor following a principle ofoperation worked out by E. S. Babcock, of Riverside. Calif.. By the use of a large motor with a low connectedload, the speed of the drum is determined alone by the cycles of the alternating current and the ratio of thetwo pulleys. The centrifuge drum was mounted o n the vertical pulley, within which were two roller bear-ings set on a 1 $&-inch shaft anchored in a concrete pedestal. With this machine tbe acceleration rate israpid, though it is possible to reduce it by installing an autotransformer (choke coil) in the line.
404 Journal of Agricultural Research, Vol. 61, No. 6
XYLENE EQUIVALENT
The xylene technique was the same as that used for the moistureequivalent, except that the samples were oven-dried just before theywere wet with xylene. Xylene-equivalent measurements were made onwashed, calcium-treated, and sodium-treated soils. The character ofthe adsorbed cation, in accordance with Joseph’s (IO) findings for soilclays, was without effect on the percentage of xylene held against aforce of 1,000 times gravity. The greatest single departure betweenthe xylene equivalents of any soil as treated with calcium and sodiumwas 2.6. The average of the values of the xylene equivalents was12.9 for the 12 Ca soils and also for the 12 Na soils.
W ILTING COEFFICIENT AND ULTIMATE WILTING POINT
The exhaustion of soil water that accompanies the wilting of plants,as recognized by Briggs and Shantz (5) and subsequently by others,is progressive, and extends through what is now termed the “wiltingrange.” The fact that wilting does occur over a range of moisturepercentages for a given soil adds to the difficulties associated withthe selection of a uniform end point. The wilting coefficient, as hereused, represents a degree of wilting from which only about one-thirdof the leaves of sunflowers recovered when the plants were placed ina dark, humid chamber overnight. Except as noted in table 10, eachwilting coefficient and ultimate wilting point value is the average ofsix determinations.
Water and soil were alternately added (washed, Ca, and Na soilsalike) as the cans were filled for the wilting coefficient measurements.After germination of the sunflower seeds additional water was addedto the soil surface until a plant of the desired size was developed,after which the openings in the covers of the cans were closed withcotton. After the plants had been wilted and cropped, the soils weredried at 105’ to llO” C. for 4 days. The soil of each can was thenbroken up and passed through a 2-mm. screen and rolled in a paperto remix. One sample was withdrawn from each wilting coefficientcan for moisture equivalent measurement. Any moisture equivalentdetermination that appeared out of line was repeated with a newsample. The soil of the six cans of each treatment was then com-posited as stock samples for use in other parts of the investigation.
The “ultimate wilting point,” a term suggested by Taylor, Blaney,and McLaughlin (18), is used in the present work to designate themoisture content at which the rate of movement of water into a 15-to 30-cm. sunflower plant, after wilting, from a 600-gm. mass of soilwas only sufficient to bring about the recovery of the terminal pairof leaves (1 to 2 cm. long) when the plant, was placed overnight inthe moist chamber. As this end point was approached the loss ofwater was a fraction of a gram per day, or in the order of 0.1 percentof the weight of the soil mass. The atmospheric conditions in theRiverside, Calif., greenhouse where the plants were grown were con-ducive to high transpiration rates. After recording the pot weightsat the wilting coefficient, the same plants were reexposed in the green-house until t h e ultimate wilting point was reached.
The old leaves of plants on the majority of the Na soils deterioratedsomewhat more rapidly than those on the Ca soils, and the death ofleaves on the former plants was sometimes accompanied by marginal
Sept. 15, 1940 Moisture Equivalent and Wilting Coefficient of Soils 405
burnmg. Equally good distributions of roots were observed in theCa and Na soils. A further reference is made to the wilting measure-ments under soil treatments.
APPARENT DENSITY
Apparent density of untreated soils, as reported in table 1, repre-sents the weight per unit volume of an-dry soil that had been passedthrough a 2-mm. sieve. The volume was measured in a 5 by 5 by2.5 cm. box. The box was filled and lightly tapped on the desk topand leveled off before weighing; the method of filling the boxes wasas nearly alike as possible for all soils.
EXCHANGE CAPACITY
For the measurements of the exchange capacity, a 20-gm. portion ofsoil was digested with 250 cc. of neutral normal ammonium acetateand leached free of calcium with 500 cc. of neutral normal ammoniumacetate. The excess ammonium acetate was then removed by leach-mg with neutral normal ammonium chloride followed by leachingwith neutral methyl alcohol until the leachate was free from chlorideion. The adsorbed ammonia (NH,) was distilled! in the presence ofmagnesia (MgO), into a 2-percent solution of boric acid and titratedwith standard sulfuric acid. The values reported in table 1 are themeans of washed, sodium-treated, and calcium-treated soils; the valueswere in close agreement.
PREPARATION OF SOILS
Two sets of soils were prepared for these investigations. The firstset-designated washed, Ca, and Na soils-provided material for thecomparisons of the effects of calcium and sodium on the moistureequivalent and on the wilting coefficient and ultimate wilting point.The second set-designated Ca, Mg, K, and Na soils-was used onlyfor the supplementary hydroscopicity and moisture equivalent meas-urements where the effect of potassium was of principal interest.Descriptions of the methods employed in preparation of the two sets ofsoils follow.
W A S H E D, CA L C I U M- TR E A T E D, A N D SODIUM-TREATED SO I L S, A N D M E A S U R E M E N T
O F E X C H A N G E SODIUM
Three 4-kg. portions of each of the 12 soils (table 1) were weighedinto porcelain dishpans. The washed soils were successively treatedwith distilled water in parallel with the soils treated with calciumand sodium. The Ca and Na soils were treated three successivetimes with 3-liter portions of normal calcium chloride and sodiumchloride solutions, respectively. Each suspension was stirred severaltimes during the day and allowed to settle overnight; the supernatantsolution was then decanted off and additional solution was removedwith filter candles. The soils were then successively washed with3-liter portions of distilled water until, in a final washing, the solu-tions contained less than 10 milliequivalents per liter of chloride ion.This washing required from 15 to 18 liters of water. To each of the4-kg. portions of soil, from which all possible solution had beenremoved by the filter candles, 1 liter of Hoagland’s nutrient solutionwas added. This solution contained 5, 5, 2, and 1 millnnoles, respec-
406 Journal of Agricultural Research Vol. 61, No. 6_ _ _ _ _ _
tively, of calcium nitrate (Ca(NO&), potassium nitrate (KNO,),magnesium sulfate (MgSO,), and monopotassium phosphate (KH,-PO,). The soils, still in the original pans, were then set in the sununtil they had dried. After they had been passed through a 2 mm.screen, they were wet to approximately the moisture equivalent withdistilled water and frozen at -10’ C. for 3 days and again air-driedand screened. Freezing left the soils reasonably friable. The driedaggregates of the Na soil, though easily broken, were harder than thoseof the washed or Ca soils. The s o i l s as thus treated were used for thewilting coefficient and ultimate wilting point measurements.
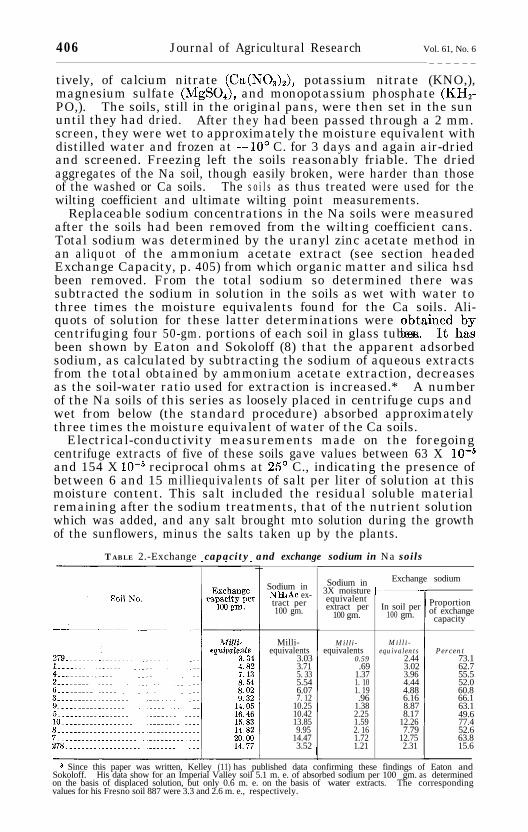
Replaceable sodium concentrations in the Na soils were measuredafter the soils had been removed from the wilting coefficient cans.Total sodium was determined by the uranyl zinc acetate method inan aliquot of the ammonium acetate extract (see section headedExchange Capacity, p. 405) from which organic matter and silica hsdbeen removed. From the total sodium so determined there wassubtracted the sodium in solution in the soils as wet with water tothree times the moisture equivalents found for the Ca soils. Ali-quots of solution for these latter determinations were obtain;tlli;centrifuging four 50-gm. portions of each soil in glass tubes.been shown by Eaton and Sokoloff (8) that the apparent adsorbedsodium, as calculated by subtracting the sodium of aqueous extractsfrom the total obtained by ammonium acetate extraction, decreasesas the soil-water ratio used for extraction is increased.* A numberof the Na soils of this series as loosely placed in centrifuge cups andwet from below (the standard procedure) absorbed approximatelythree times the moisture equivalent of water of the Ca soils.
Electrical-conductivity measurements made on the foregoingcentrifuge extracts of five of these soils gave values between 63 X 10Vsand 154 X 10ds reciprocal ohms at 25’ C., indicating the presence ofbetween 6 and 15 milliequivalents of salt per liter of solution at thismoisture content. This salt included the residual soluble materialremaining after the sodium treatments, that of the nutrient solutionwhich was added, and any salt brought mto solution during the growthof the sunflowers, minus the salts taken up by the plants.
TABLE 2.-Exchange capacity and exchange sodium in Na soils_
Sodium inNHrAc ex-tract per100 gm.
Milli-equivalents
3.033.715. 335.546.077. 12
10.2510.4213.859.95
14.473.52
Sodium in Exchange sodium3X moisture I-equivalentextract per In soil per
100 gm. 100 gm.
Milli- Milli-equivalents equivalents
0.59 2.44.69 3.02
1.37 3.961. 10 4.441. 19 4.88.96 6.16
1.38 8.872.25 8.171.59 12.262. 16 7.791.72 12.751.21 2.31
Proportionof exchange
capacity
Percent73.162.755.552.060.866.163.149.677.452.663.815.6
8 Since this paper was written, Kelley (11) has published data confirming these findings of Eaton andSokoloff. His data show for an Imperial Valley soil 5.1 m. e. of absorbed sodium per 100 gm. as determinedon the basis of displaced solution, but only 0.6 m. e. on the basis of water extracts. The correspondingvalues for his Fresno soil 887 were 3.3 and 2.6 m. e., respectively.

Sept. 15, 1940 Moisture Equivalent and Wilting Coefficient of Soils 407
As shown by table 2, the sodium chloride treatments did not satu-rate the soils with sodium and they were better suited, for this reason,to the purposes of the experiment. Neither Gedroiz (9) nor Ratner(13) was successful in growing plants in soils containing somewhathigher percentages of sodium. In all probability calcium was theprincipal base in the washed soils, since replacement proceeds in thecalcium direction when soils with calcium carbonate are repeatedlytreated with distilled water. ‘The sequence of changes accompany-ing progressive leaching with distilled water of calcareous soils con-taining sodium (8) are (1) dilution of the aqueous phase and (2) aresultant replacement of some of the adsorbed sodium by calcium.As the process is continued, sodium of the aqueous phase is removedby leaching and n e w calcium comes into solution from calcium com-pounds, followed by further exchange of calcium for adsorbed sodium.
S OILS T R E A T E D WITH CA L C I U M , MA G N E S I U M , POTASSIUM, A N D S O D I U M
The set of soils treated with calcium, magnesium, potassium, andsodium was given a uniform pretreatment with ammonium acetateand ammonium hydroxide to remove or reduce calcium carbonateand organic matter and thereby make possible a higher percentagesaturation with the Introduced bases. One-kilogram aliquots of eachof the soils were suspended twice in 4 liters of normal ammoniumacetate, then in 4 liters of N/10 ammonium hydroxide, and again in4 liters of normal ammonium acetate. Durmg each suspension thesoils were recurrently stirred during the day (in the final ammoniumacetate for 4 days), allowed to settle overnight, and then the super-natant solution was decanted and additional solution removed withfilter candles. The foregoing trcntments did not remove all calciumbut none of the final solutions contained more than 10 milliequiva-lents per liter. The soils were dried, ground to pass a 2-mm. sieve,and divided into five 200-gm. aliquots, only four of which were used.
Each 200-gm. aliquot of each soil was treated three successive timeswith 800 cc. of normal salt solution (CaC12, MgC&, KCl, or NaCl,respectively), and then washed with distilled water, by suspensionand stirring and the removal of solution with filter candles, until thechloride content of the suspendin,g solution was less than 5 milli-equivalents per liter. The potassium-trcatcd and sodium-treatedsoils became highly dispersed during the washing with water andcertain of them liberated some additional organic matter, but by theend of the washing little came into solution. The soils were finallyair-dried, ground, and thoroughly mixed by rolling.
E X P E R I M E N T A L R E S U L T S
EFFECT OF STARTING ACCELERATION ON THE MOISTURE EQUIVALENT OF CALCIUM-TREATED AND SODIUM-TREATED SOILS
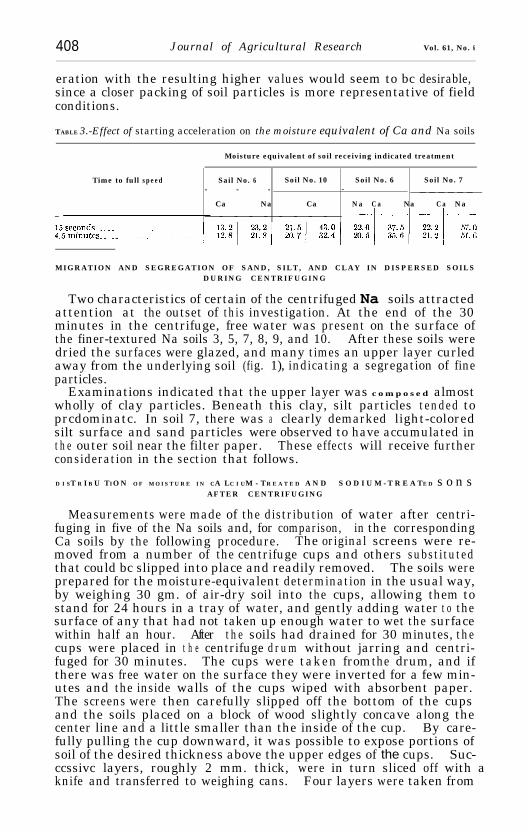
Although the effect of rate of acceleration on moisture equivalentvalues has been recognized by others as a factor (21) , cxperimentuldata bearing on it have not been found in the literature. The meas-urement’s reported in table 3 show higher moisture equivalent valueswhen the drum is brought to full speed in 15 seconds than when fullspeed is attained in 4.5 minutes. The effect is especially marked onlyin the instance of Na soils 7 and 10. Relatively slower accelerationshave been most extensively used in the past; otherwise a rapid accel-
245938-41--2
408 Journal of Agricultural Research Vol. 61, No. 6
eration with the resulting higher values would seem to bc desirable,since a closer packing of soil particles is more representative of fieldconditions.
TABLE 3.-Effect of starting acceleration on the moisture equivalent of Ca and Na soils
Moisture equivalent of soil receiving indicated treatment
Time to full speed Sail No. 6 Soil No. 10 Soil No. 6 Soil No. 7- - - - _______
Ca Na Ca Na Ca Na Ca Na_ _________-_~_____
MIGRATION AND SEGREGATION OF SAND, SILT, AND CLAY IN DISPERSED SOILSDURING CENTRIFUGING
Two characteristics of certain of the centrifuged Na soils attractedattention at the outset of this investigation. At the end of the 30minutes in the centrifuge, free water was present on the surface ofthe finer-textured Na soils 3, 5, 7, 8, 9, and 10. After these soils weredried the surfaces were glazed, and many times an upper layer curledaway from the underlying soil (fig. 1), indicating a segregation of fineparticles.
Examinations indicated that the upper layer was composed almostwholly of clay particles. Beneath this clay, silt particles tended toprcdominatc. In soil 7, there was a clearly demarked light-coloredsilt surface and sand particles were observed to have accumulated inthe outer soil near the filter paper. These effects will receive furtherconsideration in the section that follows.
D I ST R I B U TIO N O F M O I S T U R E I N CA LC I UM - TR E A T E D A N D S O D I U M - T R E A TE D s o n sAFTER CENTRIFUGING
Measurements were made of the distribution of water after centri-fuging in five of the Na soils and, for comparison, in the correspondingCa soils by the following procedure. The original screens were re-moved from a number of the centrifuge cups and others substitutedthat could bc slipped into place and readily removed. The soils wereprepared for the moisture-equivalent determination in the usual way,by weighing 30 gm. of air-dry soil into the cups, allowing them tostand for 24 hours in a tray of water, and gently adding water t o thesurface of any that had not taken up enough water to wet the surfacewithin half an hour. After the soils had drained for 30 minutes, thecups were placed in t h e centrifuge drum without jarring and centri-fuged for 30 minutes. The cups were taken from the drum, and ifthere was free water on the surface they were inverted for a few min-utes and the inside walls of the cups wiped with absorbent paper.The screens were then carefully slipped off the bottom of the cupsand the soils placed on a block of wood slightly concave along thecenter line and a little smaller than the inside of the cup. By care-fully pulling the cup downward, it was possible to expose portions ofsoil of the desired thickness above the upper edges of the cups. Suc-ccssivc layers, roughly 2 mm. thick, were in turn sliced off with aknife and transferred to weighing cans. Four layers were taken from

Sept. 15,1940 Moisture Equivalent and Wilting Coefficient of Soils 409
each of the Na soils and three from each of the Ca soils. The bottomsection of the Ca soils exceeded there mm. in thickness, but there was notsufficient for a full 2-mm. fourth layer. These methods, though notvery exact wit h r e s p e c t to the thickness of t h e soil layers, were regarded
F I G U R E 1.--Appearance of centrifuged Ca- and Na-treated soils after drying:A and B, (n) Na soil 10 and (b) Na soil 7 after centrifuging and drying; C, (n)Ca soil 10, (b) Na soil 7 with clay layer removed, exposing white calcareoussilt layer.
as nonetheless suited to the purpose. Difficulty from crumbling,such as was experienced with Ca soil 5, would have been encounteredhad the measurements been undertaken with the coarser-texturedNa soils.
In conformity with the findings of Veihmeyer, Israelsen, andConrad (22) , who worked with untreated soils, it was found (table 4)
410 Journal of Agricultural Research Vol. 61, No. 6
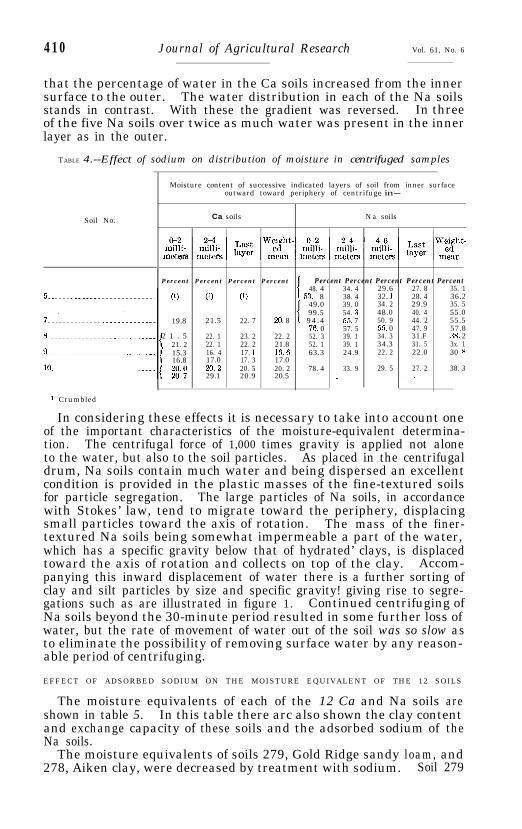
that the percentage of water in the Ca soils increased from the innersurface to the outer. The water distribution in each of the Na soilsstands in contrast. With these the gradient was reversed. In threeof the five Na soils over twice as much water was present in the innerlayer as in the outer.
TABLE 4.--Effect of sodium on distribution of moisture in centrifuged samples
Soil No.
Moisture content of successive indicated layers of soil from inner surfaceoutward toward periphery of centrifuge in--
Ca soils N a soils
Percent Percent Percent Percent Percent Percent Percent Percent Percent48. 4 34. 4 29.6 27. 8 35. 1
(‘1 (1) (1) 1 R3. 8 38. 4 32. I 28. 4 36.249.0 39. 0 34. 2 29.9 35. 599.5
i 94.454. 3 48.0 40. 4 55.0
19.8 21.5 22. 7 20. 8 ,5s. 7 50. 9 44. 2 55.576 0 57. 5 5.5. 0 47. 9 57.8
2 1 . 5 22. 1 23. 2 22. 2 52. 3 39. 1 34. 3 31.F 3x. 221. 2 22. 1 22. 2 21.8 52. 1
i39. 1 34.3 31. 5 3x. 1
15.3 16. 4 17. 1 IF.6 63.3 24.9 22. 2 22.0 30 r?16.8 17.0 17. 3 17.0 .~~~~~ ~~~~~~~ ~~~~~~~~ ~.~~~~ ~.20.0 20. 2 20. 5 20. 2 78. 4 33. 9 29. 5 27. 2 38. 320.7 20.9 .~~~~~~29.1 20.5 __~_~~ ~~~..~~ ~~._ ..~...
1 Crumbled
In considering these effects it is necessary to take into account oneof the important characteristics of the moisture-equivalent determina-tion. The centrifugal force of 1,000 times gravity is applied not aloneto the water, but also to the soil particles. As placed in the centrifugaldrum, Na soils contain much water and being dispersed an excellentcondition is provided in the plastic masses of the fine-textured soilsfor particle segregation. The large particles of Na soils, in accordancewith Stokes’ law, tend to migrate toward the periphery, displacingsmall particles toward the axis of rotation. The mass of the finer-textured Na soils being somewhat impermeable a part of the water,which has a specific gravity below that of hydrated’ clays, is displacedtoward the axis of rotation and collects on top of the clay. Accom-panying this inward displacement of water there is a further sorting ofclay and silt particles by size and specific gravity! giving rise to segre-gations such as are illustrated in figure 1. Continued centrifuging ofNa soils beyond the 30-minute period resulted in some further loss ofwater, but the rate of movement of water out of the soil was so slow asto eliminate the possibility of removing surface water by any reason-able period of centrifuging.
EFFECT OF ADSORBED SODIUM ON THE MOISTURE EQUIVALENT OF THE 12 SOILS
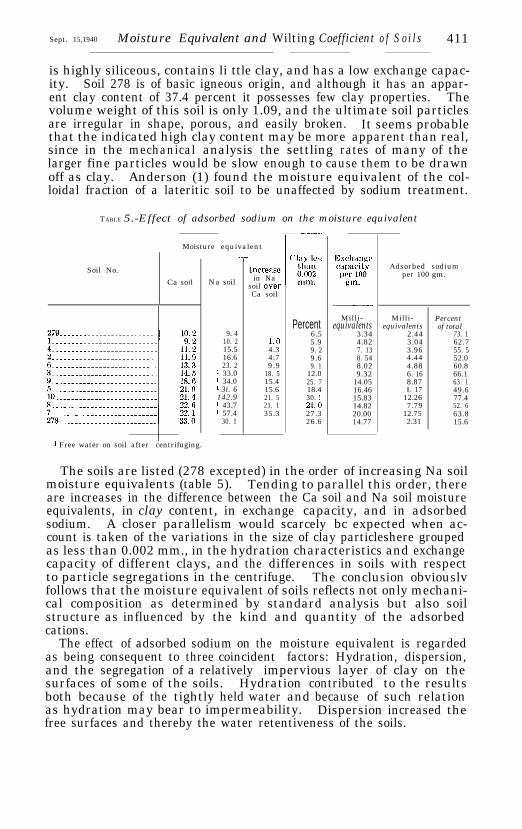
The moisture equivalents of each of the 12 Ca and Na soils areshown in table 5. In this table there arc also shown the clay contentand exchange capacity of these soils and the adsorbed sodium of theNa soils.
The moisture equivalents of soils 279, Gold Ridge sandy loam, and278, Aiken clay, were decreased by treatment with sodium. Soil 279
Sept. 15,1940 Moisture Equivalent and Wilting Coefficient o f So i l s 411
is highly siliceous, contains li ttle clay, and has a low exchange capac-ity. Soil 278 is of basic igneous origin, and although it has an appar-ent clay content of 37.4 percent it possesses few clay properties. Thevolume weight of this soil is only 1.09, and the ultimate soil particlesare irregular in shape, porous, and easily broken. It seems probablethat the indicated high clay content may be more apparent than real,since in the mechanical analysis the settling rates of many of thelarger fine particles would be slow enough to cause them to be drawnoff as clay. Anderson (1) found the moisture equivalent of the col-loidal fraction of a lateritic soil to be unaffected by sodium treatment.
TABLE 5.-Effect of adsorbed sodium on the moisture equivalent
Moisture equivalent
Soil No.
Ca soil Na soil
9. 410. 215.516.623. 2
1 33.01 34.01 3i. 6142.91 43.71 57.4
30. 1
IncreasPin Na
soil ovoi-Ca soil
1.04.34.79.9
18. 515.415.621. 521. 135.3
Percent6.55.99. 29.69. 1
12.025. 718.430. 121.027.326.6
Adsorbed sodiumper 100 gm.
Milli- Milli- Percentequivalents equivalents
3.34of total
2.44 73. 14.82 3.04 62.77. 13 3.96 55. 58. 54 4.44 52.08.02 4.88 60.89.32 6. 16 66.1
14.05 8.87 63. 116.46 8. 17 49.615.83 12.26 77.414.82 7.79 52. 620.00 12.75 63.814.77 2.31 15.6
1 Free water on soil after centrifuging.
The soils are listed (278 excepted) in the order of increasing Na soilmoisture equivalents (table 5). Tending to parallel this order, thereare increases in the difference between the Ca soil and Na soil moistureequivalents, in clay content, in exchange capacity, and in adsorbedsodium. A closer parallelism would scarcely bc expected when ac-count is taken of the variations in the size of clay particleshere groupedas less than 0.002 mm., in the hydration characteristics and exchangecapacity of different clays, and the differences in soils with respectto particle segregations in the centrifuge. The conclusion obviouslvfollows that the moisture equivalent of soils reflects not only mechani-cal composition as determined by standard analysis but also soilstructure as influenced by the kind and quantity of the adsorbedcations.
The effect of adsorbed sodium on the moisture equivalent is regardedas being consequent to three coincident factors: Hydration, dispersion,and the segregation of a relatively impervious layer of clay on thesurfaces of some of the soils. Hydration contributed to the resultsboth because of the tightly held water and because of such relationas hydration may bear to impermeability. Dispersion increased thefree surfaces and thereby the water retentiveness of the soils.
412 Journal of Agricultural Research Vol. 61, No. 6
THE MOISTURE EQUIVALENTS OF CALCIUM-TREATED SOIL AND SODIUM-TREATEDSOIL MIXTURES
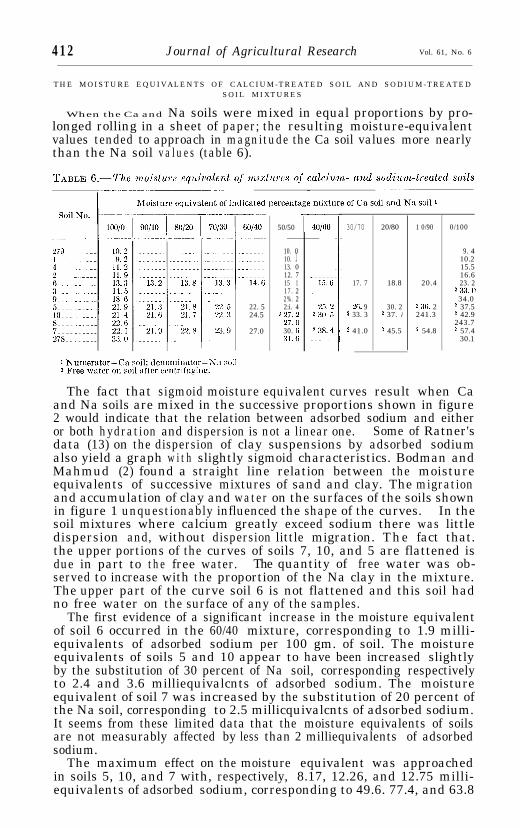
When the Ca and Na soils were mixed in equal proportions by pro-longed rolling in a sheet of paper; the resulting moisture-equivalentvalues tended to approach in magnitude the Ca soil values more nearlythan the Na soil v a l u e s (table 6).
22. 524.5
27.0
50/50
10. 010. 113. 012. 715. 117. 22%. 22:i. 4? ‘Li, 217. (I30. G:i1.ti
I 30/70 20/80 1 0/90 0/100
9. 4~~ 10.2
15.5~~ 16.6
17. 7 18.8 20.4 23. 2~~~ 233.0
~~ 34.02F. 9 30. 2 2 3F. 2 2 37.5
2 33. 3 2 37. i 241.3 2 42.9~~ 243.7
2 41.0 2 45.5 2 54.8 2 57.4~~ 30.1
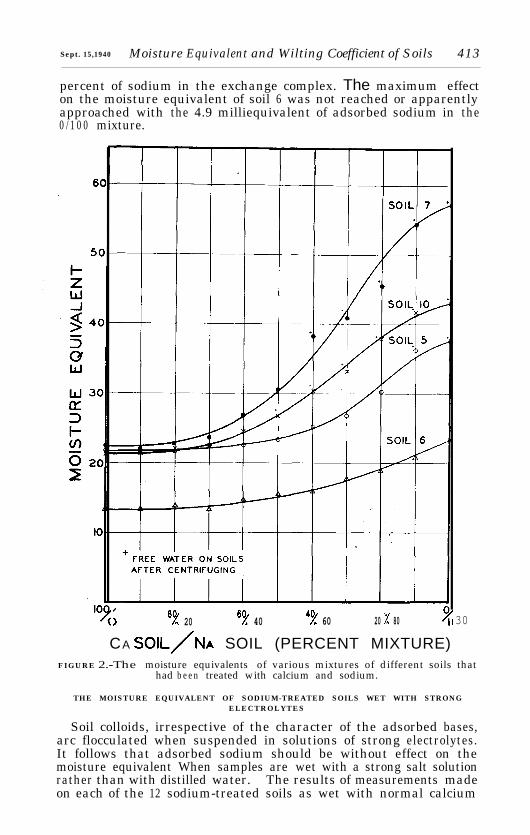
The fact that sigmoid moisture equivalent curves result when Caand Na soils are mixed in the successive proportions shown in figure2 would indicate that the relation between adsorbed sodium and eitheror both hydration and dispersion is not a linear one. Some of Ratner'sdata (13) on the dispersion of clay suspensions by adsorbed sodiumalso yield a graph w i t h slightly sigmoid characteristics. Bodman andMahmud (2) found a straight line relation between the moistureequivalents of successive mixtures of sand and clay. The migrationand accumulation of clay and water on the surfaces of the soils shownin figure 1 unquestionably influenced the shape of the curves. In thesoil mixtures where calcium greatly exceed sodium there was littledispersion and, without dispersion little migration. The fact that.the upper portions of the curves of soils 7, 10, and 5 are flattened isdue in part to the free water. The quantity of free water was ob-served to increase with the proportion of the Na clay in the mixture.The upper part of the curve soil 6 is not flattened and this soil hadno free water on the surface of any of the samples.
The first evidence of a significant increase in the moisture equivalentof soil 6 occurred in the 60/40 mixture, corresponding to 1.9 milli-equivalents of adsorbed sodium per 100 gm. of soil. The moistureequivalents of soils 5 and 10 appear to have been increased slightlyby the substitution of 30 percent of Na soil, corresponding respectivelyto 2.4 and 3.6 milliequivalcnts of adsorbed sodium. The moistureequivalent of soil 7 was increased by the substitution of 20 percent ofthe Na soil, corresponding to 2.5 millicquivalcnts of adsorbed sodium.It seems from these limited data that the moisture equivalents of soilsare not measurably affected by less than 2 milliequivalents of adsorbedsodium.
The maximum effect on the moisture equivalent was approachedin soils 5, 10, and 7 with, respectively, 8.17, 12.26, and 12.75 milli-equivalents of adsorbed sodium, corresponding to 49.6. 77.4, and 63.8
Sept. 15,1940 Moisture Equivalent and Wilting Coefficient of Soils 413
percent of sodium in the exchange complex. The maximum effecton the moisture equivalent of soil 6 was not reached or apparentlyapproached with the 4.9 milliequivalent of adsorbed sodium in the0 / 1 0 0 mixture.
; 8Y 20 8Y 40 4Y 60 20 / 80 30
CA SOIL/NA SOIL (PERCENT MIXTURE)FIGURE 2.-The moisture equivalents of various mixtures of different soils that
had b e e n treated with calcium and sodium.
THE MOISTURE EQUIVALENT OF SODIUM-TREATED SOILS WET WITH STRONGELECTROLYTES
Soil colloids, irrespective of the character of the adsorbed bases,arc flocculated when suspended in solutions of strong electrolytes.It follows that adsorbed sodium should be without effect on themoisture equivalent When samples are wet with a strong salt solutionrather than with distilled water. The results of measurements madeon each of the 12 sodium-treated soils as wet with normal calcium
414 Journal of Agricultural Research Vol. 61, No. 6
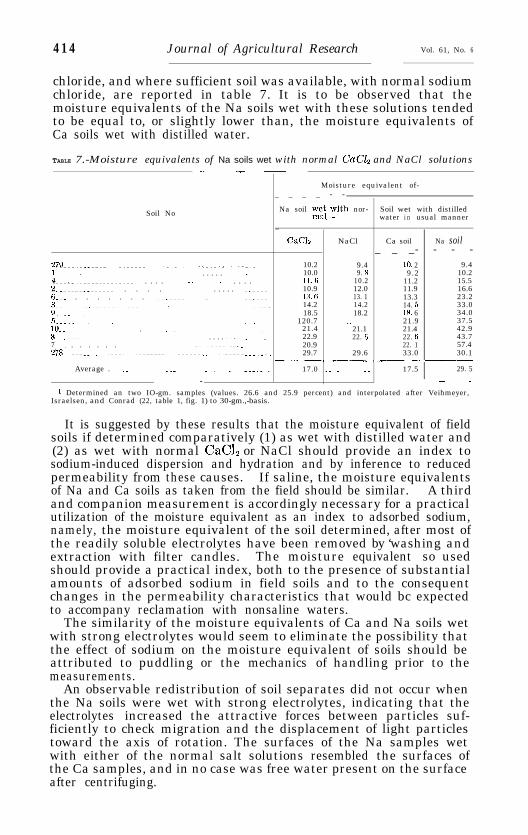
chloride, and where sufficient soil was available, with normal sodiumchloride, are reported in table 7. It is to be observed that themoisture equivalents of the Na soils wet with these solutions tendedto be equal to, or slightly lower than, the moisture equivalents ofCa soils wet with distilled water.
TABLE 7.-Moisture equivalents of Na soils wet with normal CaClz and NaCl solutions_____L._
Moisture equivalent of-_ _ _ _ - -
Soil No Na soil za;.ith nor- Soil wet with distilledwater i n usual manner
_
CaClz NaCl Ca soil Na soil.__~ _ _ _- - - -
279._-..._......~.......~~~~.......~.......___~.....~~~~ 10.2 9.4 IO. 2 9.41.._.._.__._.._.__ ...~~~~~~ . . . . . _.~ .._..... 10.0 9. 8 9.2 10.24...__._~~~.~.~~...~~ ~~ . . . . ~.~.~ ._... ~.~_~~ . . . . ~... Il.6 10.2 11.2 15.52.__.._..._~__.._ . . . . ~.~ ~..~.. . . . . . ~..__... 10.9 12.0 11.9 16.66.._ . . . . . . . ~...~~...~~~._ ~~~~ ~~~~._... IX 6 13. 1 13.3 23.23__ ~.~~~~...~.~.~ ~..~ ~.~~.~ ~.~..~~_ 14.2 14.2 14. 5 33.09.__._..____ ~~.~~~ ~.~~ _..~~.. ~.~.~~._ 18.5 18.2 1% 6 34.05.._._..~.~~.......~~~ ~.~~~ ~~.~ ~.~.._.__. 120.7 ~~~~.. 21.9 37.51o._....~~~~....~..~.. . ..~.~_~_..~.~..~~......_~~~~._.. 21.4 21.1 21.4 42.98__..-..____ ~..~~ ~.~~~. .~~~~.~ . . . . .._. _.~_.__. 22.9 22. 6 22. G 43.77 ~_ . . . . . . ~~..~.~..~~ ~.~..~ _....... ..__ ~~._.. 20.9 ~~~.~. 22. 1 57.4278~~...._..~~..~..~~.......~~~........_.~......-.._._._ 29.7 29.6 33.0 30.1
__-~_~--Average . .._.~~~.....____..........~-._..-......_ 17.0 ..~ _...... _. 17.5 29. 5
~~ .~__~ ~
1 Determined an two IO-gm. samples (values. 26.6 and 25.9 percent) and interpolated after Veihmeyer,Israelsen, and Conrad (22, table 1, fig. 1) to 30-gm.,-basis.
It is suggested by these results that the moisture equivalent of fieldsoils if determined comparatively (1) as wet with distilled water and(2) as wet with normal CaCl, or NaCl should provide an index tosodium-induced dispersion and hydration and by inference to reducedpermeability from these causes. If saline, the moisture equivalentsof Na and Ca soils as taken from the field should be similar. A thirdand companion measurement is accordingly necessary for a practicalutilization of the moisture equivalent as an index to adsorbed sodium,namely, the moisture equivalent of the soil determined, after most ofthe readily soluble electrolytes have been removed by ‘washing andextraction with filter candles. The moisture equivalent so usedshould provide a practical index, both to the presence of substantialamounts of adsorbed sodium in field soils and to the consequentchanges in the permeability characteristics that would bc expectedto accompany reclamation with nonsaline waters.
The similarity of the moisture equivalents of Ca and Na soils wetwith strong electrolytes would seem to eliminate the possibility thatthe effect of sodium on the moisture equivalent of soils should beattributed to puddling or the mechanics of handling prior to themeasurements.
An observable redistribution of soil separates did not occur whenthe Na soils were wet with strong electrolytes, indicating that theelectrolytes increased the attractive forces between particles suf-ficiently to check migration and the displacement of light particlestoward the axis of rotation. The surfaces of the Na samples wetwith either of the normal salt solutions resembled the surfaces ofthe Ca samples, and in no case was free water present on the surfaceafter centrifuging.
Sept. 15, 1940 Moisture Equivalent and Wilting Coefficient of Soils 415- ___~~
The laboratory measurement of the permeability of soils, even on arelative basis, has proved to be a difficult problem in many hands,but some promise of progress is afforded by other measurementswherein soils were leached with solutions of the same composition astheir own displaced solutions. The use of such solutions minimizesbase exchange and the associated effects on dispersion during suc-cessive leachings. By using this procedure creditable agreementshave resulted between quadruplicate samples, and the hour-to-hourchanges in rate of percolation so often characterizing other per-meability measurements have been greatly reduced.
EFFECTS OF CALCIUM, MAGNESIUM, POTASSIUM, AND SODIUM ON THE MOISTUREEQUIVALENT AND HYGROSCOPICITY
The comparative effects of Ca, Mg, K, and Na on the moistureequivalent of soils have been studied only by Anderson (1), and heconfined his work to the colloidal fraction. It seemed highly probablethat Anderson’s results might be applied to soils in general, but thesignificance of the relationships was regarded as sufficiently importantto justify independent measurements. The question involved thatties in most closely with irrigation considerations was whether therewas ample reason for regarding calcium and magnesium as alike intheir physical effects on soils and, if so, whether such potassium as isfound in irrigation waters should be classed with the calcium andmagnesium or included with sodium in the calculation of the sodium-total base ratio (percent sodium).
The treatments employed in the preparation of the soils used forthese experiments, as described earlier in th i s paper, were more drasticthan those used in preparing the Ca and Na soils. Extensive prediges-tions were made with ammonium acetate and ammonium hydroxide,which were designed to reduce all soils to a common ammonium baseand to remove calcium carbonate and humus, but these digestionswere not carried to the ultimate end points. Calcium was found in thefinal ammonium acetate extractions of all soils and humus appearedin some of the first washings of the K and Na soils. Yresumably allof these soils approached complete saturation with the respectivebases, but no measurements were made. Distilled’water washing wascontinued until the chloride concentrations of the final suspensionswere less than 5 milliequivalents per liter.
The moisture equivalents of these soils are compared in two ways,(1) when wet with distilled water and (2) when wet with 0.02 normalchloride solutions of the bases corresponding to those adsorbed. Theaverages of triplicate moisture equivalent measurements are reportedexcept in occasional instances when one of the three values was out ofline with the other two.
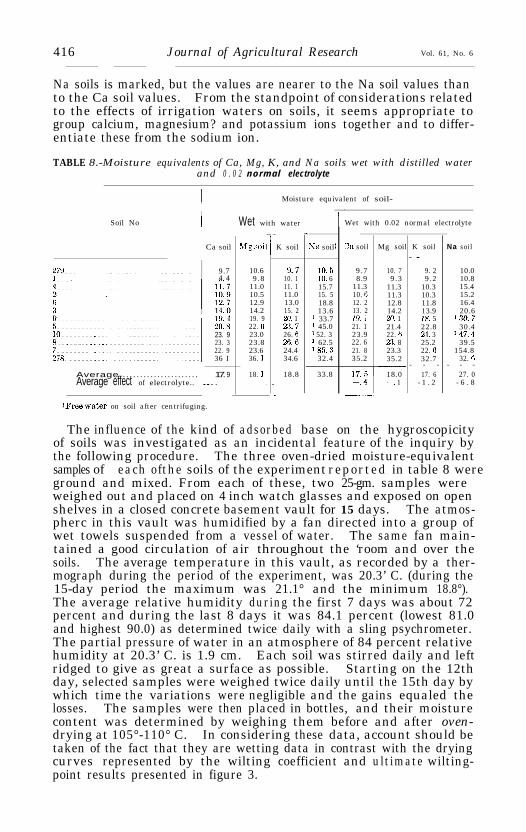
The moisture equivalents of Ca and Mg soils arc found to be similar(table 8) and nearly always less than the K soil. The effect of thesodium ion in this experiment, as in the preceding one, is outstanding,a number of the Na soils yielding moisture equivalent values twiceas great as the Ca soils. This is essentially the effect which Anderson(1) obtained, but in his series, as in this one, there was one colloid, inaddition to the latcrite, upon which sodium had little or no effect.
In the presence of 0.02 normal electrolyte, tho moisture equivalentsof the Ca and K soils were reduced a little, but a consistent effect isnot shown in the Mg series. The effect of the 0.02 electrolyte on the
416 Journal of Agricultural Research Vol. 61, No. 6
Na soils is marked, but the values are nearer to the Na soil values thanto the Ca soil values. From the standpoint of considerations relatedto the effects of irrigation waters on soils, it seems appropriate togroup calcium, magnesium? and potassium ions together and to differ-entiate these from the sodium ion.
TABLE 8.-Moisture equivalents of Ca, Mg, K, and Na soils wet with distilled waterand 0 . 0 2 normal electrolyte
I Moisture equivalent of soil-
Soil No I Wet with water
Ca soil
9.74 4
23. 923. 322. 936 I
Average....................... 17. 9Average effect of electrolyte.. .__.
Mg soi
10.6 9.7 10.5 9.79.8 10. 1 10. 6 8.9
11.0 11. 1 15.7 11.310.5 11.0 15. 5 10. F12.9 13.0 18.8 12. 214.2 15. 2 13.6 13. 219. 9 20. 1 ’ 33.7 19. I22. IJ 23.7 1 45.0 21. 123.0 26. 6 1 52. 3 23.923.8 2B. 0 ’ 62.5 22. 623.6 24.4 185.3 21. 836. 1 34.6 32.4 35.2
18. I 18.8 33.8
K soil
_Na soilI
Wet with 0.02 normal electrolyte
31 soil Mg soil K soil Na soil
10. 7 9. 29.3 9.2
11.3 10.311.3 10.312.8 11.814.2 13.920. 1 18. 521.4 22.822. 9 21. 32x. 8 25.223.3 22. 635.2 32.7
-_- - - -18.0 17. 6-_ 1 - 1 . 2
10.010.815.415.216.420.6
130.730.4
147.439.5
154.832. Ii
- - -27. 0
- 6 . 8
IFree water on soil after centrifuging.
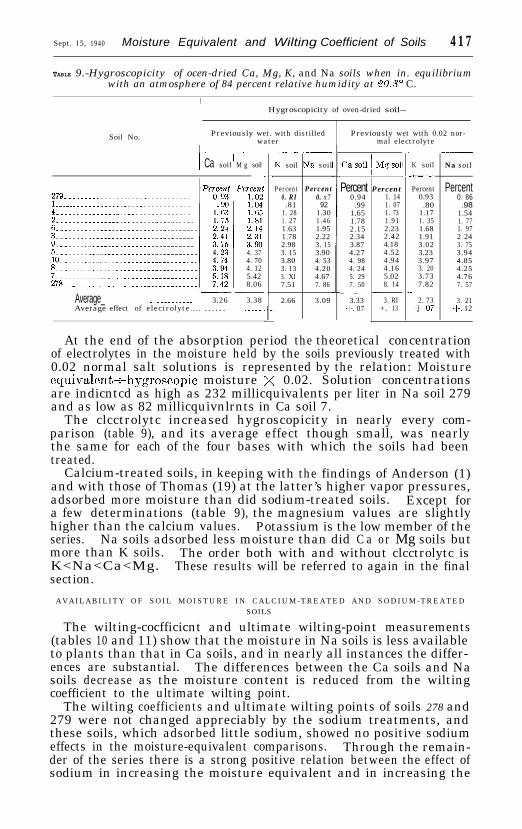
The influence of the kind of adsorbed base on the hygroscopicityof soils was investigated as an incidental feature of the inquiry bythe following procedure. The three oven-dried moisture-equivalentsamples of each of the soils of the experiment reported in table 8 wereground and mixed. From each of these, two 25-gm. samples wereweighed out and placed on 4 inch watch glasses and exposed on openshelves in a closed concrete basement vault for 15 days. The atmos-pherc in this vault was humidified by a fan directed into a group ofwet towels suspended from a vessel of water. The same fan main-tained a good circulation of air throughout the ‘room and over thesoils. The average temperature in this vault, as recorded by a ther-mograph during the period of the experiment, was 20.3’ C. (during the15-day period the maximum was 21.1° and the minimum 18.8°).The average relative humidity during the first 7 days was about 72percent and during the last 8 days it was 84.1 percent (lowest 81.0and highest 90.0) as determined twice daily with a sling psychrometer.The partial pressure of water in an atmosphere of 84 percent relativehumidity at 20.3’ C. is 1.9 cm. Each soil was stirred daily and leftridged to give as great a surface as possible. Starting on the 12thday, selected samples were weighed twice daily until the 15th day bywhich time the variations were negligible and the gains equaled thelosses. The samples were then placed in bottles, and their moisturecontent was determined by weighing them before and after oven-drying at 105°-110° C. In considering these data, account should betaken of the fact that they are wetting data in contrast with the dryingcurves represented by the wilting coefficient and ultimate wilting-point results presented in figure 3.
Sept. 15, 1940 Moisture Equivalent and Wilting Coefficient of Soils 417
TABLE 9.-Hygroscopicity of ocen-dried Ca, Mg, K, and Na soils when in. equilibriumwith an atmosphere of 84 percent relative humidity at 20.3’ C.
Hygroscopicity of oven-dried soil--
Soil No. Previously wet. with distilledwater---__I ICa soil M g soil
--
__
4. 374. 704. 125.428.06
Average_ ..~ ~~..~_._......~ I--__
3.26 3.38Average effect of electrolyte.... ...... I -----
______I< soil Ns soil
Percent Percent0. RI 0. x7.81 92
1. 28 1.301. 27 1.461.63 1.951.78 2.222.98 3. 153. 15 3.903.80 4. 533. 13 4.203. Xl 4.677.51 7. 86
2.66 3.09
Previously wet with 0.02 nor-mal electrolyte
Percent Percent0.94 1. 14
.99 1. 071.65 1. 731.78 1.912.15 2.232.34 2.423.87 4.184.27 4.524. 98 4.944. 24 4.165. 29 5.027. 50 8. 14
_ _ -__3.33 3. RI
+. 07 +. 13
-l_-
_
-K soil
___Na soil
_-_
Percent Percent0.93 0. 86.80 .98
1.17 1.541. 35 1. 771.68 1. 971.91 2 243.02 3. 753.23 3.943.97 4.853. 20 4.253.73 4.767.82 7. 57
2. 73+.07
3. 21+. 12
At the end of the absorption period the theoretical concentrationof electrolytes in the moisture held by the soils previously treated with0.02 normal salt solutions is represented by the relation: Moisturee q u i v a l e n t moisture X 0.02. Solution concentrationsare indicntcd as high as 232 millicquivalents per liter in Na soil 279and as low as 82 millicquivnlrnts in Ca soil 7.
The clcctrolytc increased hygroscopicity in nearly every com-parison (table 9), and its average effect though small, was nearlythe same for each of the four bases with which the soils had beentreated.
Calcium-treated soils, in keeping with the findings of Anderson (1)and with those of Thomas (19) at the latter’s higher vapor pressures,adsorbed more moisture than did sodium-treated soils. Except fora few determinations (table 9), the magnesium values are slightlyhigher than the calcium values. Potassium is the low member of theseries. Na soils adsorbed less moisture than did C a or Mg soils butmore than K soils.K<Na<Ca<Mg.
The order both with and without clcctrolytc is
section.These results will be referred to again in the final
AVAILABILITY OF SOIL MOISTURE IN CALCIUM-TREATED AND SODIUM-TREATEDSOILS
The wilting-cocfficicnt and ultimate wilting-point measurements(tables 10 and 11) show that the moisture in Na soils is less availableto plants than that in Ca soils, and in nearly all instances the differ-ences are substantial. The differences between the Ca soils and Nasoils decrease as the moisture content is reduced from the wiltingcoefficient to the ultimate wilting point.
The wilting coefficients and ultimate wilting points of soils 278 and279 were not changed appreciably by the sodium treatments, andthese soils, which adsorbed little sodium, showed no positive sodiumeffects in the moisture-equivalent comparisons. Through the remain-der of the series there is a strong positive relation between the effect ofsodium in increasing the moisture equivalent and in increasing the
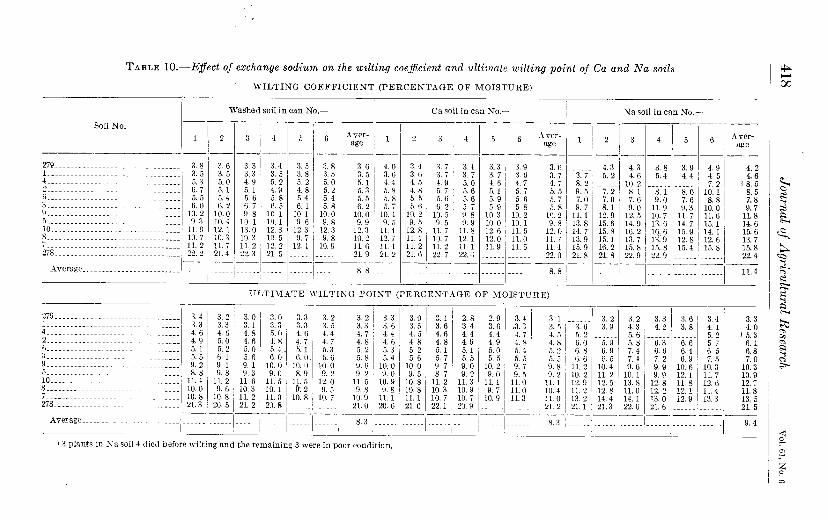
Sept. 15, 1940 Moisture Equivalent and Wilting Coefficient of Soils 419
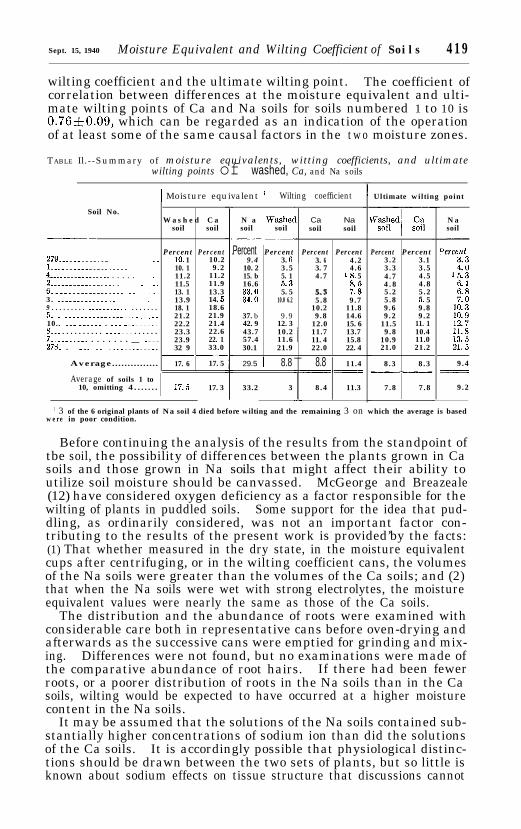
wilting coefficient and the ultimate wilting point. The coefficient ofcorrelation between differences at the moisture equivalent and ulti-mate wilting points of Ca and Na soils for soils numbered 1 to 10 is0.7650.09, which can be regarded as an indication of the operationof at least some of the same causal factors in the two moisture zones.
TABLE Il.--Summary of moisture equivalents, witting coefficients, and ultimatewilting points of washed, Ca, and Na soils
1 Moisture equivalent / Wilting coefficient
Soil No.
-__
W a s h e d C asoil soil
Percent Percent279._......__.._ ~~... 10. 1 10.21.._........_~.._._....~~~.~. 10. 1 9 . 24__________._...._ . . . . . ~.~... 11.2 11.22....._._._..._._._ _..__ 11.5 11.96._.__..~.~.~...~.......~_.~ 13. 1 13.33 . ..~.~.~...~...~ ~~~_.. 13.9 14. 69 . . . . . . . . . ~_._...~.__~ . . . . . . . 18. 1 18.65. _ _._._..~...._..__.._._.. 21.2 21.910.. .._ ._.... . .._ ___~..._~ 22.2 21.4a_.. . . . . . . . . . . _...~_~ . . . . . . 23.3 22.67~.._...___ . . . . . . . __ _.~~ 23.9 22. 1278. . .._ ~_ ~...~~._.~.._ 32 9 33.0
~~Average............... 17. 6 17. 5
Average of soils 1 to10, omitting 4 . . . . . . . 17. 3
N a ‘Washecsoil soil
---Percent Percent
9.4 3. fi10. 2 3 . 515. b 5. 116.6 6.323.2 5. 5ZE 10.0 6.2
37. b 9 .942. 9 12. 343.7 10.257.4 11.630.1 21.9
29.5 I 8.8
33.2 8 . 3
__
Ca Nasoil soil
Percent Percent3. 6 4 . 23. 7 4 . 64 .7 1 8. 55. 55 .7 ;::5 .8 9 .7
10.2 11.89 .8 14.6
12.0 15. 611.7 13.711. 4 15.822.0 22. 4
8.8 11.4BB
8.4 11.3
Ultimate wilting point
Percent Percent3 .2 3.13 .3 3 .54 .7 4 .54 . 8 4 .85 .2 5 .25 .8 5. 59 .6 9 .89 .2 9 .2
11.5 11. 19 .8 10.4
10.9 11.021.0 21.2
8 .3 8 .3_ _ _ _ ___---
7.8 7 .8
Nasoil
9 .4=z=zzzz=
9 .2
1 3 of the 6 original plants of Na soil 4 died before wilting and the remaining 3 on which the average is basedw e r e in poor condition.
Before continuing the analysis of the results from the standpoint oftbe soil, the possibility of differences between the plants grown in Casoils and those grown in Na soils that might affect their ability toutilize soil moisture should be canvassed. McGeorge and Breazeale(12) have considered oxygen deficiency as a factor responsible for thewilting of plants in puddled soils. Some support for the idea that pud-dling, as ordinarily considered, was not an important factor con-tributing to the results of the present work is provided’by the facts:(1) That whether measured in the dry state, in the moisture equivalentcups after centrifuging, or in the wilting coefficient cans, the volumesof the Na soils were greater than the volumes of the Ca soils; and (2)that when the Na soils were wet with strong electrolytes, the moistureequivalent values were nearly the same as those of the Ca soils.
The distribution and the abundance of roots were examined withconsiderable care both in representative cans before oven-drying andafterwards as the successive cans were emptied for grinding and mix-ing. Differences were not found, but no examinations were made ofthe comparative abundance of root hairs. If there had been fewerroots, or a poorer distribution of roots in the Na soils than in the Casoils, wilting would be expected to have occurred at a higher moisturecontent in the Na soils.
It may be assumed that the solutions of the Na soils contained sub-stantially higher concentrations of sodium ion than did the solutionsof the Ca soils. It is accordingly possible that physiological distinc-tions should be drawn between the two sets of plants, but so little isknown about sodium effects on tissue structure that discussions cannot
420 Journal of Agricultural Research Vol. 61, No. 6
be carried far in this direction. As distinct from the Ca roots grownon Ca soil, roots grown on Na soil may have been more highly hy-drated and water uptake by them conceivably could have been im-peded, but such an effect has never been demonstrated. In someearlier sand-culture experiments in which plants were grown on nutri-ent solutions high in calcium chloride and high in sodium chloride,respectively, the plant material from the sodium solutions when placedon a Biichner funnel, after ‘drying and grinding, took up and heldrelatively large quantities of water and could be leached only withdifficulty, whereas the calcium plant material behaved m a normal way.The question of whether sodium affects the uptake and movement ofwater in living plants must be regarded as speculative and there is nopresent basis for a conclusion.
CAPILLARY POTENTIAL
The term “availability” as phrased by Richards (14) involves twonotions, namely, (I) the ability of the plant to absorb and to use waterwith which it is in contact and (2) the readiness or velocity (6, 14)with which the soil moisture moves in to replace that which has beenused by the plant. At any given point in the soil water, the capillarypotential is numerically equal to the hydrostatic potential and belowsaturation the quantity is negative. The tension of the soil water ata given capillary potential may be expressed as the length of thesuspended water column necessary to produce that tension. Therates of water movement through a soil for a given potential differencewill not be the same in different soils, in the same soil at differentcapillary potentials, or in the same soils as here differentially treatedwith calcium and sodium. Furthermore, the moisture at the wiltingcoefficient cannot be regarded either as being uniformly distributedthroughout the soil mass or as being in static equilibrium with theplant at wilting. In the wilting range, the plant-soil system is adynamic one and water withdrawal is continuous, though at a decreas-ing rate, to the death point.
The present experiments were so conducted as to yield values foreach Ca and Na soil at each of three moisture levels,, and to each ofthese moisture levels it is possible to assign at least an approximatecapillary-potential value. Schofield and Botelho daCosta (16), fromfreezing-point-depression measurements of their own and calculationsfrom vapor pressures and seed-absorption measurements of others,have computed the pF value of soils (the logarithm of the equivalentcapillary tension expressed in centimeters of water column) at themoisture equivalent and at the wilting coefficient. These valuesranged from 2.5 to 3.3 for the moisture equivalent and from 4.02 to4.40 for the wilting coefficient. From the foregoing data, the writerselected to assume an intermediate value of 3.0 for the moisture equiva-lent and to take Schofield’s average value, 4.24, for the pF value atthe wilting coefficient. The problem remained of obtaining a suitablevalue for the ultimate wilting point By relating the average changein moisture content between the wilting coefficient and the ultimatewilting point of the writers’ calcium soils to the corresponding averagechanges in pF values for like moisture changes in the Schofield andDaCosta Botelho graphs, a pF increment of about 0.16 was indicated.If this is added to the pF value of the wilting coefficient! approximately4.40 is obtained for the pF value of the ultimate wiltmg point. For
Sept. 15,1940 Moisture Equivalent and Wilting Coefficient of Soils 421
the purposes here served it is not necessary to assume that pF 3.0represents the best moisture equivalent value for any soil or for thewriters’ soils as differentially treated with calcium and sodium. Themoisture content values of certain Na soils that have been centrifugedby standard moisture equivalent procedures are not representativeof the moisture tension conditions corresponding to a pF value of 3.If other pF values had been used for the moisture equivalent, thewilting coefficient, or the ultimate wilting point, the slopes of thecurves (fig. 3) would have been altered but not their general character-istics.
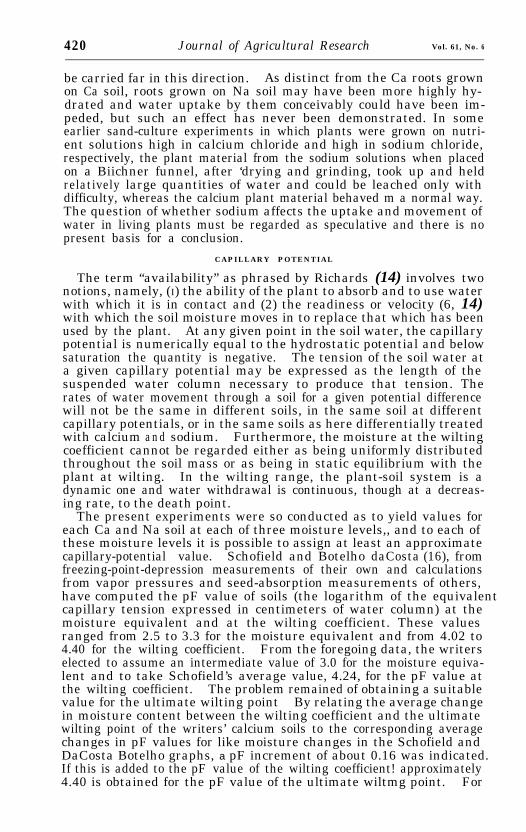
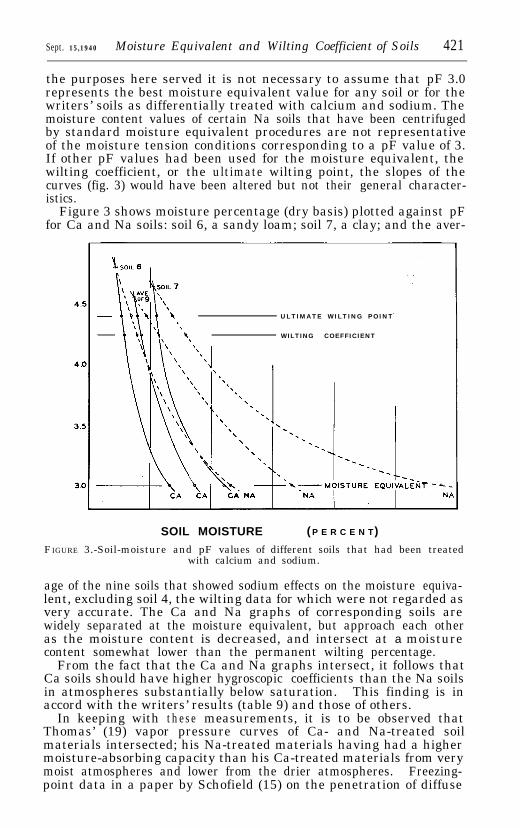
Figure 3 shows moisture percentage (dry basis) plotted against pFfor Ca and Na soils: soil 6, a sandy loam; soil 7, a clay; and the aver-
ULTIMATE WILTING POINT
‘\, WILTING COEFFICIENT
SOIL MOISTURE ( P E R C E N T)
FIGURE 3.-Soil-moisture and pF values of different soils that had been treatedwith calcium and sodium.
age of the nine soils that showed sodium effects on the moisture equiva-lent, excluding soil 4, the wilting data for which were not regarded asvery accurate. The Ca and Na graphs of corresponding soils arewidely separated at the moisture equivalent, but approach each otheras the moisture content is decreased, and intersect at a moisturecontent somewhat lower than the permanent wilting percentage.
From the fact that the Ca and Na graphs intersect, it follows thatCa soils should have higher hygroscopic coefficients than the Na soilsin atmospheres substantially below saturation. This finding is inaccord with the writers’ results (table 9) and those of others.
In keeping with these measurements, it is to be observed thatThomas’ (19) vapor pressure curves of Ca- and Na-treated soilmaterials intersected; his Na-treated materials having had a highermoisture-absorbing capacity than his Ca-treated materials from verymoist atmospheres and lower from the drier atmospheres. Freezing-point data in a paper by Schofield (15) on the penetration of diffuse
422 Journal of Agricultural Research Vol. 61. No. 6
double layers may likewise be construed as anticipating the findingsof the writers. Those data when extrapolated into the lower moisturerange beyond that over which freezing-point measurements arepossible also indicate that water is more closely held by an Na soilthan by a Ca soil. If extended yet farther the two curves wouldintersect.
MOISTURE EQUIVALENT-WILTING COEFFICIENT RATIOS
Conclusions with respect to the effect of sodium on the ratio of mois-ture equivalent to wilting coefficient are made difficult by the factthat free water on the surface of many of these soils after centrifugingcaused the observed values to exceed what might be regarded as thetrue values. For Ca soils 1, 2, and 4 these ratios are 2.5, 2.2, and 2.4,respectively, and for the same Na soils 2.2,2.0, and 1.8. This suggeststhat sodium tended to narrow the ratios by raising the wilting coeffi-cient relatively more than the moisture equivalent.
Treatment with sodium increased neither the moisture equivalentsnor the wilting coefficients of soils 279 and 278. These soils are ofinterest, however, for other reasons. The Gold Ridge sandy loam,279 untreated, has a moisture equivalent-wilting coefficient ratio of3.9, whereas the Aiken clay has a ratio of 1.6. In the opinion of thewriters much of this divergence can be accounted for on the basis ofthe properties of the ultimate soil particles. The Gold Ridge soil ishighly siliceous and the faces of most of the soil particles tend to besmooth? indicating that a large part of the water retained by the soilis exterior to the crystalline surface. A sample of Exeter sandy loamsupplied by J. C. Johnston from near Visalia, Calif., had a moistureequivalent nearly four times as great as its wilting coefficient. Thesiliceous crystalline character and smooth faces of the particles of thissoil were more outstanding than in the Gold Ridge soil. The par-ticles of the lateritic Aiken clay, on the other hand, are highly porousand much water is retained, both against gravitational force andplant uptake, as closely held interstitial water, i. e., water withincapillary pores. It is obvious that interstitial water retained by a soilboth at the moisture equivalent and wilting coefficient would reducethe proportion of moisture-equivalent water available to the plant.The interplanar water of a number of soil colloids represents a thirdtype of retention, but the question of availability of such water toplants and its relation to sodium is obviously complex. Much ofit is released to the soil atmosphere as the moisture content of the soilis reduced.
DISCUSSION
Whether the consequences of the state of aggregation or dispersionof the ultimate soil particles are more important in terms of waterretention against centrifugal forces and plant uptake than forcesinvolved in the hydration of Ca and Na clays cannot be concludedfrom these data. Both are probably involved, and the combined soil-water tensions produced are reflected in the water-retention measure-ments. Dispersion may be consequent to hydration; if so, the twogo hand in hand.
The possibility cannot be eliminated that the differences in theavailability of moisture in Na soils and Ca soils to plants represent aslower rate of movement through the former soils than through the
Sept. 15, 1940 Moisture Equivalent and Wilting Coefficient of Soils 423
latter. In such case it would presumably follow that the soil zonesaway from the roots were relatively more moist in the Na soils thanin the Ca soils, but with equally dry zones in Ca and Na soils at theroot surfaces. The distances through which moisture must move toplant roots are relatively great in terms of the thickness of the moisturefilms at the wilting coefficient. In a soil in which a root or a root hairis situated at intervals of 1 mm,, the average distance of water move-ment is eauivalent to 50 times the diameter of a 0.005-mm. siltparticle.
If water, in the wilting range, moves primarily by vapor flow, thepertinent distinction between Ca and Na soils in the present connec-tion becomes one of size of capillary pores through which diffusionmust take place rather than thickness of water films. Ca soils arecharacterized by a crumb structure with particle aggregates and voidsthat are large as compared with those of dispersed Na soils. Vapordiffusion through the Ca soils should accordingly proceed more rapidlythan through Na soils.
If moisture movement in the wilting range is primarily movementof film water, it follows likewise that such movement should be slowerat a given moisture content in the thinner films covering dispersedparticles than in those covering aggregates of closely adhering parti-cles. Water of hydration as such is probably not subject to movementexcept as it is vaporized into the soil atmosphere.
Irrespective of possible explanations, the finding of immediatesignificance is that water in dispersed Na soils is less available toplants than that in Ca soils.
SUMMARY
The moisture equivalents of soils partially saturated with sodiumwere substantially higher than those of the same soils treated withcalcium provided most of the soluble electrolyte was removed.
The average moisture equivalents of 12 well-leached Ca, Mg, K,and Na soils were Ca, 17.9; Mg, 18.1; K, 18.8; and Na, 33.8. Theaverage moisture uptake by these soils when exposed: (after ovendrying) in an atmosphere with a relative humidity of 84 percent at20.3’ C. was K, 2.66; Na, 3.09; Ca, 3.26; and Mg, 3.38 percent
A close parallelism was found for 10 soils between the effect of sodiumon the moisture equivalent and the percentage of clay, the exchangecapacity, and the quantity of adsorbed sodium.
Adsorbed sodium had negative effects on the moisture equivalent of asoil high in silica and a negative effect on an Aiken clay which islateritic; both soils had low cation exchange capacities.
The moisture in centrifuged Ca soil samples increased from theinner toward the outer surfaces. An opposite gradient was found inNa soils.
Some migration and segregation of sand, silt, and clay particlesoccurred when the finer-textured Na soils were centrifuged, a higherproportion of large particles being observed in the outer portions withwell-defined clay layers on the inner surface. In certain of the soilswater was also displaced toward the axis of rotation and remained onthe surface after centrifuging.
Rapid starting acceleration of the centrifuge gave higher moisture-equivalent values than slow acceleration.
Journal of Agricultural Research Vol. 61. No 6
Wetting Na soils with normal calcium or sodium chloride solutionsgave moisture equivalent values that were nearly the same as those ofCa soils. The moisture equivalent may therefore provide a measureof sodium-induced dispersion of field soils if comparisons are madebetween leached and unleached soils and soils wetted with a strongelectrolyte.
The moisture equivalent o f mixtures of Ca and Na soils in successiveproportions gave sigmoid graphs. The moisture equivalent was notsignificantly affected by less than 2 milliequivalents of adsorbedsodium per 100 gm. of soil and values approaching maximum werefound when there were 12 milliequivalents or more of adsorbedsodium.
Adsorbed sodium caused soil moisture to be less available to plants.The calcium and sodium averages of nine soils were, at the moistureequivalent, 17.5 and 29.5; at the wilting coefficient, 8.4 and 11.3; andat the ultimate wilting point, 7.8 and 9.2 respectively.
Plotting moisture content against a pF scale, the Ca and Na soilgraphs intersect at moisture percentages below the ultimate wiltingpoint. This result confirms earlier work showing lower hygrosco-picity of Na soils than of Ca soils in drier atmospheres.
It is suggested that interstitial water held within soil particlesagainst both centrifugal and plant-uptake forces may account for thedifferences observed in the moisture equivalent-wilting coefficientratios observed in different soils,
LITERATURE CITED(1) ANDERSON, M. S.
1929. THE INFLUENCE OF SUBSTITUTED CATIONS ON THE PROPERTIES OFSOIL COLLOIDS. Jour. Agr. Res. 38: 565-584.
(2) BODMAN,G. B.,and MAHMUD, A.J.1932. THE USE OFTHEMOISTUREEQUIVALENTINTHE TEXTURAL CLASSIFI-
CATIONOFSOILS. Soil Sci. 33:363-374, illus.(3) BRIGGS, LYMAN J.,and MCLANE,JOHN W.
1907. THE MOISTURE EQUIVALENTS OF SOILS. U. S. Dept. Agr., Bur.Soils Bul. 45, 23 pp., illus.
(4) ___ and McLANE,J. W.1911. MOISTURE EQUIVALENT DETERMINATIONS AND THEIR APPLICATION.
Amer. Soc. Agron. Proc. (1910) 2: 138-147, illus.(5) __ and SHANTZ,H.L.
1912. THE WILTING COEFFICIENT FOR DIFFERENT PLANTS AND ITS IN-DIRECT DETERMINATION. U. S. Bur. Plant Indus. Bul. 230, 83pp., illus.
(6) BUCKINGHAM, EDGAR.1907. STUDIES ON THE MOVEMENT OF SOIL MOISTURE. U. S. Dept. Agr.,
Bur. Soils Bul. 38, 61 pp., illus.(7) EA T O N, F RANK M .
1935. BORONINSOILSANDIRRIGATIONWATERSAND ITS EFFECT ONPLANTHWITH PARTICULAR REFERENCE TO THE SAN JOAQUIN VALLEY OFCALIFORNIA. U. S. Deut. Agr. Tech. Bul. 448. 132 PP. illus.
_ -(8) - and SOKOLOFF,V.P.1935. ABSORBED SODIUM IN SOILS AS AFFECTED BY THE SOIL-WATER
RATIO. Soil Sci. 40: 237-247.(9) GEDROIZ, K. K.
1931. EXCHANGEABLE CATIONS OF THE SOIL AND THE PLANT: 1. RELATIONOF PLANT TO CERTAIN CATIONS FULLY SATURATING THE SOILEXCHANGE CAPACITY. Soil Sci. 32:51-63.
(10) JO S E P H, A. F.1927. THE MOISTURE EQUIVALENT OF HEAVY SOILS. I I. Jour. Agr. Sci.
[England] 17: [12]-20.

Sept. 15,1940 Moisture Equivalent and Wilting Coefficient of Soils 425
(11) KELLEY, W. P.1939. EFFECT OF DILUTION ON THE WATER-SOLUBLE AND EXCHANGEABLE
BASES OF ALKALI SOILSANDITS BEARINGONTHE SALTTOLERANCEOF PLANTS. Soil Sci.47:367-375.
(12) MCGEORGE, W.T., and BREAZEALE,J.F.1938. STUDIES ON SOIL STRUCTURE: EFFECT OF PUDDLED SOILS ON PLANT
G R O W T H. Ariz. Agr. Expt. Sta. Tech.Bul. 72,pp.411-447,illus.(13) RATNER, E. I.
1935. THE INFLUENCE OF EXCHANGEABLE SODIUM IN THE SOIL ON ITSPROPERTIES AS A MEDIUM FOR PLANT GROWTH. Soil Sci. 40:459-471, illus.
(14) RICHARDS, L. A.1928. THE USEFULNESS OF CAPILLARY POTENTIAL TO SOIL MOISTURE AND
PLANTINVESTIGATIONS.(15) SCHOFIELD, R. K.
Jour. Agr.Res.37:719-742.
1935. THEINTERPENETRATIONOFTHEDIFFUSEDOUBLELAYERS SURROUND-ING SOIL P AR TICLES. 3d Internatl. Cong. Soil Sci., Oxford,England, 1935, Trans. v. 1, pp. 30-33, illus.
(16) -- and BOTELHODACOSTA,J.V.1935. THE DETERMINATION OF THE pF AT PERMANENT WILTING AND AT
THE MOISTURE EQUIVALENT BY THE FREEZING POINT METHOD.3d Internatl. Cong. Soil Sci., Oxford, England, 1935, Trans.v. 1, pp. 6-10, illus.
(17) SHARP, L. T., and WAYNICK, D. D.1917. THE MOISTURE EQUIVALENT DETERMINATION OF SALT-TREATED
SOILS AND THEIR RELATION TO CHANGES IN THE INTERIOR SUR-FACES. Soil Sci. 4: 463-469, illus.
(18) TAYLOR, C. A., BLANEY, H. F., and MCLAUGHLIN, W. W.1934. THE WILTING RANGE IN CERTAIN SOILS AND THE ULTIMATE WILTING
POINT. Natl. Res. Council, Amer. Geophys. Union Trans. 17(2): 434-444.
(19) THOMAS, MOYER D.1928. AQUEOUS VAPOR PRESSURE OF SOILS; IV. INFLUENCE OF REPLACE-
ABLE BASES. Soil Sci. 25: 485-493, illus.(20) VEIHMEYER, F. J., chairman.
1936. REPORT 0F THE COMMITTEE ON PHYSICS 0F SOIL MOISTURE. Natl.Res. Council, Amer. Geophys. Union Trans. 17. (2):318-326.
(21) ---and HENDRICKSON , A.H.1937. THE EFFECT OF THE REPLACEMENT OF OTHER CATIONS BY SODIUM
ON THE DISPERSION OF SOILS . Science 86: 59-60.(22) --- ISRAELSEN, 0. W.,and CONRAD,J. P.
1924. THE MOISTURE EQUIVALENT AS INFLUENCED BY THE AMOUNT OFSOIL USED IN ITS DETERMINATION. Calif. Agr. Expt. Sta. Tech.Paper 16, 64 pp., illus