effect of deposition rate on morphology evolution of metal ... · effect of deposition rate on...
TRANSCRIPT

Warrender & Aziz, Pg. 1
Effect of Deposition Rate on Morphology Evolution of Metal-on-Insulator
Films Grown by Pulsed Laser Deposition Jeffrey M. Warrender1, 2 & Michael J. Aziz1
1Harvard School of Engineering and Applied Sciences, 29 Oxford St, Cambridge MA 02138
2U.S. Army Benét Laboratories, 1 Buffington St, Watervliet NY 12180.
Electronic Mail: [email protected]
Abstract
Ag films were grown by pulsed laser deposition on insulating SiO2 and mica substrates
and exhibited a morphological progression beginning with nucleation of 3D islands and
culminating in a continuous, electrically conducting film. The rate of advancement through this
progression with increasing pulse frequency was studied with experiments and with Kinetic
Monte Carlo simulations. Experiments at 93°C and 135°C give exponents of –0.34 and –0.31,
respectively, for the scaling of the electrical percolation thickness with pulse frequency.
Simulations predicted an exponent of –0.34, in excellent agreement with the experiments. Both
of these values agree well with the previously reported analytic value of –0.33 for the scaling of
the morphology transition thickness with average flux in continuous deposition. Simulations
also predicted that data collapse for island density vs. amount deposited would be observed for
experiments run at the same value of the parameter B/f at constant amount deposited per pulse,
where B is the kinetic rate constant for coalescence and f is the pulse frequency. Measurements
of the percolation transition were consistent with this prediction. These findings indicate that the
elementary processes included in the KMC simulation —substrate terrace diffusion, irreversible
aggregation of hemispherical islands, and two-island coalescence, but neglecting the effects of

Warrender & Aziz, Pg. 2
kinetic energy — are sufficient to explain the behavior observed when the pulse rate is varied at
constant kinetic energy.
PACS: 81.15.Fg; 68.55.-a; 81.07.Bc; 82.20.Wt

Warrender & Aziz, Pg. 3
Introduction
Pulsed laser deposition (PLD) is a thin film growth technique that differs from
conventional deposition techniques, such as thermal evaporation, in at least two essential ways:
the depositing species arrive in short bursts of 10-100 μs; and the depositing species have kinetic
energy 10-100 eV, compared with <1 eV for thermally-deposited films. PLD is useful as a
research tool because it allows the instantaneous deposition flux and the average deposition flux
to be varied independently and studied separately — a capability that is not possible in
continuous flux delivery techniques. The instantaneous deposition flux is expected to govern the
initial density of islands 1, while the average deposition flux governs the growth rate of islands.
Pulsed flux delivery is also of technological interest because it provides an additional kinetic
handle on film growth that could permit improved control of film morphologies.2,3 In this work,
we explore the influence of the average deposition flux during PLD growth at constant
instantaneous flux, brought about by varying the laser pulse rate under otherwise identical laser,
substrate, thermal, and background conditions. We chose Ag films on SiO2 as a model metal-on-
insulator film growth system.
Metal-on-insulator thin films typically grow according to the Volmer-Weber growth
mode, in which atoms grow in 3D islands on the surface.4-8 As the islands grow larger they
impinge upon each other. Upon impingement, islands begin to coalesce, driven by capillary
forces toward a more equiaxed equilibrium shape,9 delaying the development of a contiguous
film. Our use of the term “coalescence” encompasses the entire process by which two or more
impinging equiaxed islands become a single, larger, equiaxed island. During this coalescence
process, we refer to the multi-island system as a “coalescing cluster”. This terminology is not

Warrender & Aziz, Pg. 4
universal in the literature. The characteristic time scale for the coalescence process increases as
the participating islands grow larger,10 according to
4R
Bτ = , (1)
where R is the initial radius of the coalescing islands and B is a temperature-dependent kinetic
rate constant, which we refer to as the “coalescence parameter” with dimensions [length4 time-1],
given by
2
0s
B
D SBk T
γ Ω≡ , (2)
with DS the surface self-diffusion coefficient of atoms on the island, γ the surface energy, Ω the
atomic volume, and S0 the number of mobile surface atoms per unit area.6,10 Given a cluster
consisting of a pair of coalescing islands, there will be an island size above which the
characteristic time scale for coalescence exceeds the average time for a third island to grow to
impinge with one of the pair. It is at this point that clusters of coalescing islands remain
elongated on the surface; they have become kinetically frozen.6 Further deposition joins these
elongated clusters, resulting in a tortuous network of bare channels that continues to fill in with
subsequent deposition.5 Representative Atomic Force Microscope (AFM) images of the
morphological progression are shown in Fig. 1.
There are at least two morphological transitions in this progression: an “elongation
transition”, after which the average object on the surface no longer has an equiaxed in-plane
shape (coalescence has been “frozen out”); and a “percolation transition”, after which the film
conducts electrically over macroscopic distances. For the experiments that will be reported, the
percolation transition is more readily monitored; for simulations, however, the elongation
transition is more readily monitored. The thickness at which each transition occurs is expected

Warrender & Aziz, Pg. 5
to have the same scaling exponent with average flux 11, and analytic models for continuous
deposition predict that the transition thickness d scales as where F is the average
flux.
( )1/ 3/d B F∝
6,11 In this work, F is varied at constant instantaneous deposition flux by holding the pulse
details (duration, amount deposited per pulse) constant and varying the delay between pulses;
this is a capability not accessible in conventional continuous deposition experiments.
Experimental Procedure
Films were prepared by PLD in a vacuum chamber with base pressure of 2 × 10⁻⁸ Torr.
The target was 99.999% pure Ag, and was irradiated with a KrF+ excimer laser beam (Lambda
Physik LPX 305), wavelength 248 nm, pulse duration 30 ns FWHM. The laser spot size was
~3mm × ~1 mm, with an energy density of ~5 J/cm2. The target was rotated during deposition,
and was irradiated for 2 minutes at 10 Hz to clean the target prior to each growth run. The
target-to-substrate distance was 10.5 cm. Films were grown on SiO2 and freshly cleaved
muscovite mica.
The onset of the electrical percolation transition was monitored with an in situ resistance
measurement. In order to make good electrical contact with the growing film, Ag contact pads,
300 nm thick, are deposited onto a clean SiO2 surface in a thermal evaporator. SiO2 was chosen
as a substrate because previous studies have shown that Ag films on SiO2 behave in accordance
with the predictions of classical nucleation theory.12 A shadow mask is used to produce two
square pads of deposited silver 0.64 cm on a side, and 0.64 mm apart. Indium drops are applied
to each of these pads, and Au-tipped contact probes are embedded in the In while it is molten.
The In drops improve the electrical contact between the contact pads and the contact probes.
Each probe is plugged into a Au-coated receptacle and is connected by a wire to an electrical

Warrender & Aziz, Pg. 6
feedthrough. The resistance measurement is performed by a Keithley 2000 digital multimeter, in
the "4 Wire Resistance" mode. The resistance is recorded once per second. Based on the work
of So et al., it is expected that when the sample becomes conducting, a precipitous drop in the
resistance will be observed.13. As we described elsewhere, this is evidenced on a logarithmic
graph of resistance vs. film thickness as a dramatic change in the slope that results in a drop in
resistance of at least an order of magnitude.14 Films were analyzed with ex situ Atomic Force
Microscopy (AFM) and Scanning Electron Microscopy (SEM) to check morphology.
The average deposition rate was measured before and after film growth by inserting a
quartz crystal rate monitor into the flux. The deposition rate measurement was calibrated using
Rutherford Backscattering Spectrometry. The deposition rate was approximately 0.006
nm/pulse.
Experimental Results
Ag films were grown on SiO2 by PLD at 40°C, 93°C, and 135°C over a range of pulse
frequencies. Plots of the thickness at which each film became electrically conducting vs. pulse
rate are presented in Fig. 2. Errors in the reported percolation thickness (not shown) are
estimated to be 8%, having a 6% contribution from error associated with the deposition rate
measurement and 5% contribution associated with run-to-run variation in the average deposition
rate. Panels (a) and (b) clearly show that a power law relationship accurately fits the “high-
temperature” data, and that the scaling exponent is -0.31±0.02 for 135°C and -0.339±0.002 for
93°C. Both are in excellent agreement with the scaling exponent of -1/3 obtained from analytical
models for continuous deposition 6,11 and with the value of -0.34 predicted by previous kinetic
Monte Carlo simulations of pulsed deposition.15 In a recent paper, we observed that films in the

Warrender & Aziz, Pg. 7
equiaxed island stage grown by PLD at 110°C exhibited an island spacing of about 100 nm
island center-to-island center.14
Panel (c) shows the behavior for much lower temperature, at 40°C. A single power law
cannot accurately describe these data. There appear to be several slopes present but the points
demarking these transitions are difficult to identify precisely. A fit to the data for f < 10 Hz gave
an exponent of -0.31. A fit to the data for 2 Hz < f < 20 Hz gave an exponent of -0.13. Finally,
the data show a high frequency regime, at 20 Hz and above, beyond which increasing the
frequency further does not appear to change the percolation thickness further; the exponent in
this region was -0.08.
Simulations
Kinetic Monte Carlo (KMC) simulations were implemented to identify the impact of
pulsed deposition on the Volmer-Weber morphological progression. The simulation algorithm is
based on code described elsewhere.16 The simulation is performed on a square lattice, 512 ×
512. Atoms are added to the system by random deposition within a pulse, ignoring effects of
kinetic energy. Atoms on the substrate may diffuse, with a diffusion constant given D by
[21 exp /4 D BD a E k Tν= − ] , with a the minimum lattice translation distance, ν the vibration
frequency, assumed equal to 1×10¹³/s, and ED the activation barrier for terrace diffusion. Atoms
that impinge, either by deposition or diffusion, upon other atoms irreversibly nucleate a new
island, and the system maintains a list that monitors each island’s size and center of mass.
Atoms that impinge upon an island are immediately and irreversibly relocated to the nearest
vacant site to the projected center of mass of the island. This has the effect of forcing the islands

Warrender & Aziz, Pg. 8
to remain hemispherical, with a contact angle of 90°, which reproduces the Volmer-Weber film
growth geometry. When two islands come into contact, the coalescence clock is started. After a
time given by equation (1) has elapsed, with R set equal to the radius of the smaller island, the
pair is replaced with a new hemispherical island. The new island contains the same number of
atoms as the sum of the atoms in the two-island system, and its center of mass is located at the
center of mass of the original two-island system.11,15 An island may be involved in multiple
coalescence processes simultaneously, which proceed independently except that the value of R is
updated after each coalescence event.
At each data-taking interval, the average number of constituent islands of a cluster, NC, is
obtained. When NC is significantly greater than unity, further deposition tends to cause other
islands to impinge with a coalescing cluster in less time than will be required for the coalescence
process to proceed significantly. NC = 2 is the point chosen to demark a transition from compact
hemispherical islands to elongated clusters. The laterally averaged film thickness at which NC =
2 is defined as the elongation transition thickness dElong. 11 To obtain better statistics, the plot of
NC vs. pulse number during a deposition simulation is fit with an exponential fit,
(3) 0/1 p pCN Ae= +
for which p is the pulse number, A and p0 are fitting parameters. Equation (3) was found to fit
the curves of NC vs. p quite well. The quantity of interest is pElong the pulse number at which NC
=2, which is given by
( )10 lnElongp p A−= . (4)
The pulse duration was fixed for all pulsing rates f, at 100 μs, chosen based on the typical
lifetime of the PLD plume (on the order of 10-100 μs). Similarly, the amount deposited during
the pulse, I, was held constant for all f, and the instantaneous deposition rate during the “on”

Warrender & Aziz, Pg. 9
portion of the pulse, Finst, was also held constant. The substrate diffusion constant is varied by
varying the ratio ED/kBT. B
Note that because of computational limitations, our simulations were performed to
thicknesses of only several monolayers (ML), whereas the experiments show percolation
thicknesses on the order of tens of nm. Even considering that the elongation transition must
occur at a lower thickness than the percolation transition, there is still a considerable difference
in the sizes of islands studied by the simulations and experiments. The length scale of the film
growth, and the resulting thickness at percolation, is controlled primarily by three parameters:
the coalescence parameter B, the average deposition flux, and the ratio of the instantaneous
deposition rate to the substrate surface diffusion constant (the D/F ratio). Changes to either of
the first two will affect the intercept of the percolation thickness vs. average deposition flux
curve, but not its slope. Changing the D/F ratio can, as shown below, cause growth to be in one
of several different growth regimes, but does not change the exponent within a given regime.
Therefore, even though the length scales of the simulations and experiments are different,
comparison of the scaling exponents that emerge from each is warranted.
Simulation Results
The rate at which the islands increase in size is influenced primarily by the average
deposition flux, whereas the rate at which the islands actually impinge is influenced also by the
typical island size, separation, and time of nucleation, parameters that are dependent on the
instantaneous deposition flux. Jensen treated the interrelationships between the pulse duration
tpulse, the pulse frequency f, and the characteristic monomer lifetime Dτ , as giving rise to three
different regimes: a “fast diffusion” regime, in which pulse Dt τ , an intermediate regime, in
which 1/pulse Dt fτ< < , and a very slow diffusion regime in which 1/D fτ . Jensen reported
Warrender & Aziz, Pg. 10
that the first and last of these effectively resembled continuous deposition; the first, because all
surface processes occur when the pulse in on, the latter because surface processes occur over
many pulses.3
The simulations demonstrate the complexity of the interaction between these effects. In
Fig. 3 (a)-(c) we show simulation results for three different values of the substrate diffusion
constant D. These panels plot the film thickness at the elongation transition vs. the pulse
frequency. Panel (a) shows simulation results for D=1.6×10⁵ a2/s, with I = 0.025 ML/pulse,
B=500 a4/s, where a is the minimum lattice translation distance. This corresponds to fast
diffusion, with Dτ comparable to . A single power law describes the transition thickness vs.
frequency behavior for the range of frequencies examined here. Because diffusion is fast, the
monomer population decreases after the pulse shuts off, and does so very rapidly relative to the
time scale of the flux pulsing and of coalescence. In this limit, the growth can be thought of as
occurring in bursts, followed by periods of variable duration in which coalescence is the only
active surface process (because there are no monomers left to diffuse). The elongation thickness
vs. pulse frequency exhibits a scaling exponent of -0.345±0.002. This is quite close to the
scaling exponent of the experimentally measured percolation thickness of -0.31 and -0.34
reported above for 135°C and 93°C. It also is close to the value -0.29 obtained from the
simulation work of Carrey and Maurice, and to the exponent of -0.33 obtained from their
analytical work and the work of Jeffers et al.
pulset
6,11 This suggests that for the fast-diffusion regime,
pulsed deposition behaves similarly to continuous deposition, with the average deposition flux
being proportional to the pulse rate.
In panel (b) we show results for D=1.7×10³ a2/s, I = 0.025 ML/pulse, B=500 a4/s,
corresponding to “intermediate” diffusion, with 1/pulse Dt fτ< < . An elbow in the data reveals

Warrender & Aziz, Pg. 11
subtleties not present for the case presented in panel (a). A low frequency regime, f <30 Hz,
exhibits a scaling exponent of -0.29±0.009; for f >30 Hz the scaling exponent is -0.44±0.017. A
plot of island density for a single pulse vs. time 17 for this value of D shows that the island
density saturates at about 0.05-0.1s. For pulse frequencies below 30 Hz, then, there is no
difference in nucleation or growth behavior, and so the only difference between frequencies is
the amount of time allowed for coalescence. This frequency range is similar to the fast diffusion
case of (a), with the difference that for the “fast” diffusion case, appreciable island nucleation
and growth is observed while deposition is still active, whereas for “intermediate” diffusion,
almost all nucleation occurs after the pulse ceases. For frequencies greater than 30 Hz,
monomers persist for the entire period between pulses, and the enhanced monomer population at
the arrival of the subsequent pulse results in more nucleation events. The higher total island
density results in an increased rate of impingement, and as a result, an earlier onset of the
elongation transition. Of course, superposed on this effect is the reduction of time allowed for
coalescence associated with decreasing time between pulses as the pulse frequency is increased.
This presence of an additional condition that hastens the onset of elongation with increasing
frequency can adequately explain why the exponent for f > 30 Hz is steeper than for f < 30 Hz.
In Fig. 3(c) we show results for D=1.0×10⁻² a2/s, I = 0.01 ML/pulse, for two different
values of B: 10 a4/s (diamonds) and 1 a4/s (crosses). The low value of D represents a case of
essentially no diffusion. If, additionally, coalescence is infinitely fast relative to deposition, this
is the regime of droplet growth, which has been treated elsewhere.18,19 When coalescence occurs
at a finite rate, differences upon varying the average deposition rate can be observed. The low
values of B used in the simulations shown in panel (c) represent very slow coalescence. At the
lowest frequencies, some coalescence can occur, and so varying the pulse frequency again

Warrender & Aziz, Pg. 12
corresponds to varying the average deposition rate; the competition between coalescence and
average deposition rate gives an exponent of -0.34±0.05 (B= 1 a4/s) and –0.35±0.01 (B= 10 a4/s)
for elongation thickness vs. pulse rate, just as was seen in Fig. 3(a), and consistent with the
experimental exponents from Fig. 2(a) and (b).
The most remarkable result of panel (c), however, is the high-frequency regime, in which
the exponent is -0.03. Much insight can be gained by considering the time-dependent quantity
( )/ 1/coal fζ τ≡ , (5)
where coalτ , calculated using Eq. (1), is the time required for coalescence of a system consisting
of two islands of the average coalescing size (obtained by finding the average size of all islands
that begin coalescing during the time step in question) and f is the pulse frequency. ζ is the ratio
of the time required for coalescence to the time allowed for coalescence between pulses; in other
words, it is the number of inter-pulse periods that a typical new coalescence event would require
to complete. The value of ζ was obtained at the pulse number p at which NC =2, and this value is
denoted ζelong and plotted in Fig. 3(d) for all three cases discussed above.
For the lowest temperature, at high frequency, the values of ζelong are very large; for
example, for B=10 a4/s, at 800 Hz, even from the beginning of the simulation, the time required
for coalescence is over 200 times the delay between pulses. For these high frequencies, then, no
appreciable amount of coalescence occurs during the simulation, and the difference between
such frequencies is negligible with respect to coalescence. This explains the flat slope at high
frequency in Fig. 3(c).
The results shown in panel (d) also corroborate the location of the elbows observed in
panels (a)-(c). The highest temperature series in Fig. 3(d) shows no elbow, just as in panel (a).
The elbows for the lowest temperature series occur at 10 and 100 Hz for B = 1 and 10 a4/s,

Warrender & Aziz, Pg. 13
respectively, and the elbow at intermediate temperature occurs around 50-200 Hz, near but
slightly above the elbow in panel (b). Nevertheless, the elbow in the intermediate-temperature
data and those in the low-temperature data in panel (d) are opposite in sense, as are the elbows in
panels (b) and (c).
The low-frequency values of ζelong are roughly the same for the greatly varied input
conditions of panels (a)-(c), and they exhibit at most a very weak dependence on pulse
frequency. This suggests an independent method to experimentally determine the quantity B in
future work. By using equations (1) and (5), varying f and measuring the average island radius R
at elongation, a fit for B could be obtained.
The high frequency regime at low temperature, Fig. 3(c), is consistent with the high-
frequency regime observed in the experimental results shown in Fig. 2(c). (The other regimes of
Fig. 2(c) may be associated with different regimes of nucleation behavior as discussed in the
interpretation of Fig. 3(b), but there is not an exact correspondence with the simulations). It is
possible to give an estimate of the coalescence parameter B that would result in the positioning
of the main elbow observed at 20 Hz in Fig. 2(c). From Fig. 3(c), the onset of the “high
frequency” regime, for slow coalescence, occurs at a value of B/f ≈ 0.1 a4. With a = 2.89×10⁻⁸
cm for Ag, the onset of the high frequency regime in the experimental data, Fig. 2(c), at 20 Hz,
would correspond to B=1.40×10⁻³⁰ cm4/s at 40°C. Bréchignac et al. reported experimental
observations of fragmentation of fractal islands composed of Ag nanoclusters on graphite. They
found that features having a branch width of 15 nm were observed to fragment in 2000s, while
features having a branch width of 25 nm did not fragment.20 These observations provide
estimates of a lower and upper limit for B, respectively. Using equation (1), with 15 nm and 25
nm supplied for 2R, B should be between 1.58 × 10⁻²⁸ cm4/s and 1.22 × 10⁻²⁷ cm4/s. These values

Warrender & Aziz, Pg. 14
are more than two orders of magnitude greater than our calculated value for B. We consider two
possible explanations. The first possibility is that Ag monomer diffusion on graphite, which is
not included in our interpretation, is contributing significantly to transport in the experiments of
Bréchignac et al. A second possibility is that the kinetic rules used in the simulations,
particularly the assumption that equations (1)-(2) accurately describe coalescence, could be
invalid for our experimental conditions at 40°C.21 Equations (1)-(2) are strictly valid only at
temperatures above the thermodynamic roughening temperature of the island surface: the
presence of facets on the islands have been shown by KMC simulations 22,23 and MD simulations
24,25 to alter the kinetics of coalescence. For example, Combe and Jensen predicted that the 4R
dependence of equation (1) should be valid only above 800K. At lower temperatures, their
simulations yield the prediction that equation (1) should be replaced by
RB
α
τ = (6)
with an increasingly larger power of α observed as the temperature is decreased; they predict a
power of 16.2 for an elongated island at 400K, which is a dramatic departure from equation (1).22
To test the implications of this prediction for the interpretation of our experimental
results, we performed additional KMC simulations under the same conditions as those of Fig.
3(c) (diamonds), but for which the coalescence time was given by equation (6). α was set equal
to 6 and 10, instead of the α = 4 dependence used in the other simulations. However, evaluating
B from the elbows in these simulations and from the observations of Bréchignac et al. using the
same values of α>4 only increases the discrepancy reported in the previous paragraph. Our

Warrender & Aziz, Pg. 15
inability to unify the results at 40 °C with the others appears to be a consequence of
insufficiently well understood kinetics of morphology evolution of faceted nanocrystals.
We performed additional simulations with α equal to 5, 6, and 10, with all other
parameters the same as in Fig. 3(a). The simulations resulted in an elongation thickness vs.
frequency behavior best fit by an exponent of -0.345±0.002 for α=4, -0.26±0.01 for α=5,
-0.223±0.006 for α = 6, and -0.13±0.01 for α = 10. Our experimental observation for PLD at
135ºC and 93ºC of an exponent of -0.31±0.02 and -0.339±0.002, respectively, is consistent with
the power α=4 in equation (1) and is inconsistent with the predicted exponents for higher values
of α. This indicates that the kinetics of equations (1)-(2) appear to continue to describe PLD at
temperatures as low as 93ºC. Kinetic roughening in PLD may play a role in extending the
validity of the classical power law below the thermodynamic roughening transition temperature,
or a mechanism resulting from the high kinetic energy of the depositing species could be
influencing the film growth. We have recently reported the influence of kinetic energy effects on
morphological evolution, which was evidenced by accelerated advancement through the
characteristic progression as kinetic energy of the depositing species is systematically increased
above 28 eV. We found that a transition in the vertical aspect ratio of the islands in the presence
of sufficient impact-induced adatom-vacancy pair creation could explain this observation.14
Data collapse for constant values of B/f
A curiosity of Fig. 3(c) is the extent to which the B=1 a4/s curve appears to be exactly the
same as the B=10 a4/s, except shifted to the left; the elbow of the former occurs at 10 Hz, and of
the latter, at 100 Hz. The ratio of these frequencies, 10, is the same as the ratio of the constants
B. This suggests that a data collapse may be possible.

Warrender & Aziz, Pg. 16
First, we show that simulations run with the same value for the ratio B/f give data
collapse. Two different series were performed; one, under “fast diffusion” conditions,
D=1.6×10⁵ a2/s, with I=0.025 ML/pulse, B/f=5 a4; the other, under “no diffusion” conditions,
with D=1.0×10⁻² a2/s and I=0.01 ML/pulse, B/f=10 a4. The results of these simulations are
shown in Fig. 4 (a) and (b), with the total (“large”) island count plotted against pulse number.
Fig. 4 plots raw data; no transformation was required. In both cases, the data collapse is
excellent, suggesting that B/f is indeed a dimensionless parameter of this system at constant
amount deposited per pulse I.
This is a potentially difficult prediction to confirm experimentally, because both B and
the substrate surface diffusion constant D are temperature-dependent. However, D influences the
initial island density more than island growth and impingement, and as we reported elsewhere 17,
the effect of island density (by way of instantaneous deposition rate, in that work) on transition
thickness scaling is weak, and is dominated by the average flux/coalescence competition that
results in the onset of the elongation transition. Thus, we assume that, as temperature is varied
over a limited range, the influence of the variation of D on percolation thickness will be weak
and indirect while the influence of B will be substantial and direct.
With this assumption, we seek to compare the morphology evolution for two films grown
at equal values of B/f, at constant amount deposited per pulse. Of course, a detailed experimental
comparison of the total island count vs. pulse number for each frequency and temperature was
impractical, but comparing the percolation thickness should give a good estimate of the quality
of the data collapse. Our approach is to compare the percolation thickness of films grown at the
same ratio B/f. Practically speaking, this entails examining films grown at two different

Warrender & Aziz, Pg. 17
temperatures, and , and pulse frequencies, 1T 2T 1f and 2f , such that the ratio of the pulse
frequencies ρ is the same as the ratio of the coalescence parameters, or
1
2 2
1B fB f
ρ = = . (7)
We examined our percolation thickness vs. frequency data at 135°C and 93°C (the data
from Fig. 2(a) and (b)), and obtained the ratio of pulse frequencies that would enable the two
plots to collapse onto each other. This is achieved by scaling the frequency axis of the 93°C data
by ρ , performing a least-squares fit of the 135°C data together with the frequency-scaled 93°C
data at varying ρ , and determining what ρ gives the highest R2 value in the least-squares fit.
The result we obtained for these series is ρ =2.29. This means that the ratio of the coalescence
parameters at these temperatures should also be 2.29. If this is true, then 1 1 2 2/ /B f B f= , and
since we already know the data collapses when 1 2f fρ= , we can claim that the KMC prediction
has been corroborated.
For two temperatures T1 and T2, the ratio of the respective coalescence parameters BB1 and
B2B is, using (2)
1 2
2 1 1 2
1 1expB
B TB T k T T
ερ⎛ ⎞⎡ ⎤
= = − −⎜ ⎟⎢ ⎥⎜ ⎟⎣ ⎦⎝ ⎠ (8)
where ε is the sum of the activation energies for formation and migration of Ag atoms on Ag
islands. Solving for ε for ρ =2.29 gives ε =0.287 eV. Pomeroy reported MD-calculated
barriers of 0.22 eV and 0.3 eV for step edge diffusion on Ag(111) along A- and B-steps,
respectively, and these are consistent with calculations by Nelson et al. and Schlößer et al. 26-28
If coalescence were instead mediated by terrace diffusion, the formation of Ag terrace adatoms
from Ag steps would be rate-limiting. Pomeroy found the barrier for formation of a terrace

Warrender & Aziz, Pg. 18
adatom (having no in-plane nearest neighbors) from a kink site (having 3 in-plane nearest
neighbors) to be 0.748 eV in Cu(111), and given the similarity of the barriers for surface
processes for Ag (111) and Cu (111), it would be quite surprising for the same process to have a
barrier much lower than this for Ag (111).26 We therefore consider ρ =2.29 to be a credible
value for the ratio 1 / 2B B for =135°C and =93°C, and to indicate that coalescence is likely
mediated by step edge diffusion rather than terrace diffusion over this temperature range. The
experiments support the prediction that data collapse is observed for a constant value of the ratio
1T 2T
/B f for constant pulse details.
Conclusion
The effects of varying the average deposition rate by varying the laser pulse rate were
discussed. Experiments at 93°C and 135°C gave exponents of –0.34 and –0.31, respectively, for
the scaling of percolation thickness with pulse frequency. Kinetic Monte Carlo simulations
capable of modeling growth of hemispherical islands with island-island coalescence gave an
exponent of -0.34 for the high-temperature, “fast diffusion” regime and for the low frequency
range in the low-temperature “no diffusion” regime. The exponents from simulation and
experiment agree well with each other, and with previously reported theoretical predictions.
This agreement indicates that the kinetics described by equations (1) and (2) are valid for PLD
deposition at temperatures as low as 93°C, which is a surprising result given previously reported
predictions that equation (1) should not accurately describe the kinetics of cluster coalescence
below the roughening transition. For the case of slow diffusion and slow coalescence, the
simulations predict a high frequency “freezing out” of coalescence leading to a “flat” region in
the percolation thickness vs. pulse frequency curve. Experiments at 40°C were qualitatively

Warrender & Aziz, Pg. 19
consistent with this result. Simulations also predict that data collapse for island density vs.
amount deposited can be achieved when the parameter B/f is maintained. Experimental results
demonstrated that films grown at the same value of B/f achieve percolation at the same film
thickness, which is consistent with the prediction.
The following picture emerges from our work. Kinetic energy effects are essential in
determining the differences in morphological evolution when kinetic energy is systematically
varied (such as in PLD vs. thermal deposition). As demonstrated by our previously reported
work, increasing kinetic energy increases the vertical aspect ratio of the islands, resulting in a
delay in the advancement through the characteristic morphological progression. However, the
changes observed in the present work as the PLD pulse rate is varied at constant kinetic energy
(and consequently, at constant vertical aspect ratio) are described adequately by the elementary
processes included in the non-energetic KMC simulation — substrate terrace diffusion,
irreversible aggregation of hemispherical islands, and two-island coalescence.
This research was supported by NSF Grant DMR-0306997. We gratefully acknowledge
helpful discussions with Julian Carrey, Craig Arnold, and Jonah Erlebacher.
References
1D. Walton, J. Chem. Phys. 37, 2182 (1962).
2M.A. Gallivan, D.G. Goodwin, and R.M. Murray, Physical Review B 70, (2004).
3P. Jensen and B. Niemeyer, Surf. Sci. 384, L823 (1997).
4D.W. Pashley, M.H. Jacobs, M.J. Stowell, and T.J. Law, Philosophical Magazine 10, 127
(1964).
5A.A. Baski and H. Fuchs, Surface Science 313, 275 (1994).

Warrender & Aziz, Pg. 20
6G. Jeffers, M.A. Dubson, and P.M. Duxbury, Journal of Applied Physics 75, 5016 (1994).
7X. Yu, P.M. Duxbury, G. Jeffers, and M.A. Dubson, Physical Review B (Condensed Matter) 44,
13163 (1991).
8P. Brault, A.-L. Thomann, and C. Andreazza-Vignolle, Surface Science 406, L597 (1998).
9Grain boundaries do not affect this picture very significantly when the boundary energy is much
less than the metal free surface energy. The dihedral angles of grain boundary grooves in
Ag vary from 160° to 175°, according to A.P. Greenough and R. King, "Grain-Boundary
Energies in Silver", J. Inst. Metals 79, 415 (1951).
10F.A. Nichols and W.W. Mullins, Journal of Applied Physics 36, 1826 (1965).
11J. Carrey and J.-L. Maurice, Physical Review B (Condensed Matter and Materials Physics) 63,
245408/1 (2001).
12A.A. Schmidt, H. Eggers, K. Herwig, and R. Anton, Surface Science 349, 301 (1996).
13S.K. So, H.H. Fong, C.F. Yeung, and N.H. Cheung, Applied Physics Letters 77, 1099 (2000).
14J.M. Warrender and M.J. Aziz, Phys. Rev. B 75, 085433 (2007).
15J.M. Warrender and M.J. Aziz, Applied Physics A 79, 713 (2004).
16J.D. Erlebacher, "Kinetic Rate Law Issues in the Morphological Relaxation of Rippled Crystal
Surfaces," in Dynamics of Crystal Surfaces and Interfaces, edited by P.M. Duxbury and
T. Pence (Plenum, New York, 1997).
17J.M. Warrender, "Morphological Evolution of Nanocrystal Metal-on-Insulator Films Grown by
Pulsed Laser Deposition", Ph.D. Thesis, Harvard University, 2004.
18J. Carrey and J.-L. Maurice, Physical Review B (Condensed Matter and Materials Physics) 65,
205401/1 (2002).
19P. Meakin, Reports on Progress in Physics 55, 157 (1992).

Warrender & Aziz, Pg. 21
20C. Brechignac, P. Cahuzac, F. Carlier, C. Colliex, J. Leroux, A. Masson, B. Yoon, and U.
Landman, Physical Review Letters 88, 196103 (2002).
21The position of the elbow could depend on the deposition flux; a higher flux could “freeze out”
coalescence at a lower frequency, which would increase the value of B/f used in our
calculation above. In our experiments, we deposited approximately 0.025 ML per pulse,
which is about twice the amount deposited per pulse in the simulations. The lower
deposition rate in the simulations was essential to be able to get adequate statistics with
which to fit the data with Eq. 3. We see no way for a factor of two in deposition flux to
resolve a two order-of-magnitude discrepancy in the inferred value of B.
22N. Combe, P. Jensen, and A. Pimpinelli, Physical Review Letters 85, 110 (2000).
23P. Jensen and N. Combe, Computational Materials Science 24, 78 (2002).
24X. Yu and P.M. Duxbury, Physical Review B (Condensed Matter) 52, 2102 (1995).
25H.B. Liu, M. Jose-Yacaman, R. Perez, and J.A. Ascencio, Appl. Phys. A 77, 63 (2003).
26J. Pomeroy, "Hyperthermal Ion Epitaxy of Thin Metal Films", Ph.D. Thesis, Cornell
University, 2002.
27R.C. Nelson, T.L. Einstein, and S.V. Khare, Surface Science 295, 462 (1993).
28D.C. Schlößer, K. Morgenstern, L. Verheij, G. Rosenfeld, F. Besenbacher, and G. Comsa,
Surface Science 465, 19 (2000).
Figure Captions
Fig. 1. AFM images of morphological progression of PLD deposited Ag on mica. Scale bars are
1 μm. Principal stages are (a) island growth and coalescence (b) percolation and (c) hole filling.

Warrender & Aziz, Pg. 22
Fig. 2. (color online) Experimental film thickness at electrical percolation transition vs. pulse
frequency for (a) 135°C, (b) 93°C, and (c) 40°C. The data are well fit by a power law with a
single exponent of about –0.33 for (a) and (b). Several power-law fits to the data are provided in
(c) as a guide to the eye. The uncertainty in measured percolation thickness is +/-8% for all
points.
Fig. 3. (color online) KMC simulations of elongation transition. (a)-(c) Film thickness at
elongation transition vs. pulse frequency for three different ratios of substrate surface diffusion
constant D: (a) D=1.6×10⁵ a2/s (fast diffusion), (b) D=1.7×10³ a2/s (slow diffusion) and (c)
D=1.0×10⁻² a2/s (essentially no diffusion). Other parameters: (a) and (b) I=0.025 ML/pulse,
B=500 a4/s. (c) I=0.01 ML/pulse, and B=10 a4/s (diamonds) and B=1 a4/s (crosses). (d) Value of
ζ (Eq. (5)) at the moment of the elongation transition, for the conditions of (a)-(c). Panels (a)
and (b) adapted from Ref. 15.
Fig. 4. (color online) Data collapse for equal values of B/f. (a) B/f=10 a4, D=1.6×10⁵ a2/s. (b)
B/f=5 a4, D=1.0×10⁻² a2/s. Scatter at low pulse number is noise associated with the operation of
the island counting algorithm in the absence of a clear minimum below which “small” sizes
could be neglected.

Fig. 1

Fig. 2
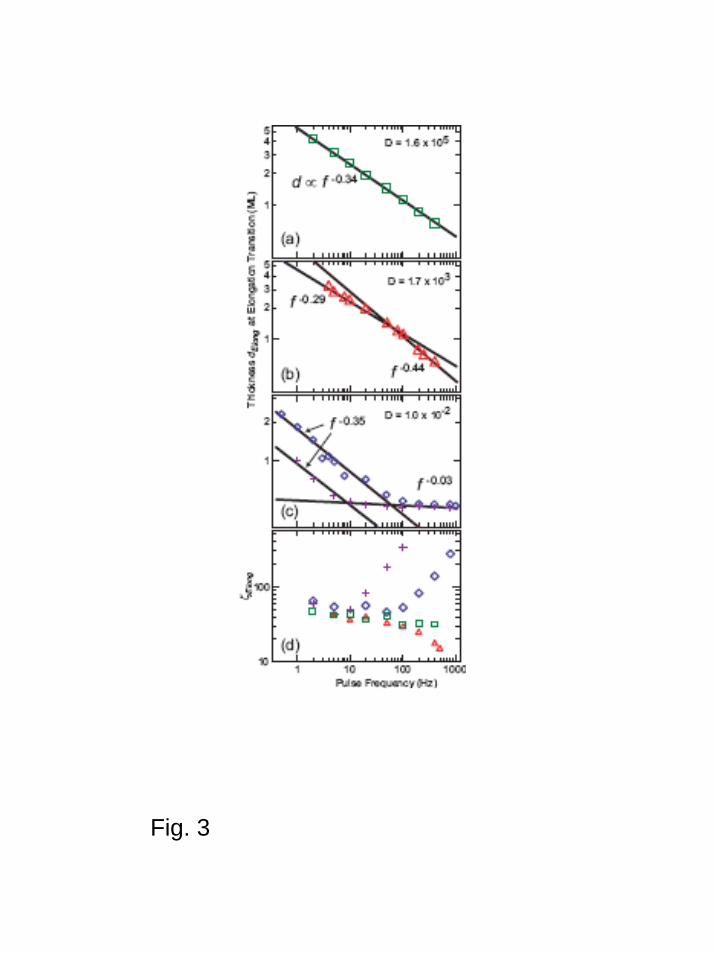
Fig. 3

Fig. 4