effect of degree of saturation on bearing capacity of...
TRANSCRIPT
Effect of Degree of Saturation on Bearing Capacity of Flexible Pavements BENGT B. BROMS
Associate Professor of Civil Engineering, Cornell University, Ithaca, N. Y.
The bearing capacity of flexible pavements is frequently governed by the bearing capacity of the subgrade soil. The bearing capacity of the subgrade is reduced considerably during the spring breakup period due to reduction in the relative density and increase in the degree of saturation. A method for the evaluation of the bearing capacity of partially saturated soils has been developed. The effects of the apparent shear strength parameters c /
and¢~ the pore pressure coefficients A and B, the coefficient X, the coefficient of lateral earth pressure at rest Ka, and the location of the initial groundwater table have been investigated. The method is based on the assumption that the rate of loading of the subgrade soil caused by moving traffic loads is rapid enough that no or very small changes in moisture content of the subgrade soil take place during loading.
•THE BEARING capacity of flexible pavements is reduced considerably during the spring breakup period. This reduction is partly a result of a decrease of the relative density of the base course and subgrade materials as caused by heave, partly a result of an increase of the degree of saturation of the soil, and partly a result of excess pore pressures in the soil caused by rapid melting of the ice lenses present in the soil. A method for the evaluation of the bearing capacity of flexible pavements subject to frost action has been presented previously ( 5). A comparison of this method with a method proposed by Linell (12) showed good agreement.
The method proposed by the author ( 5) can be used as a basis for design of flexible pavements. This method is based on the assumption that failure takes place in the subgrade and that the subgrade soil is fully saturated. However, subgrades constructed according to modern methods reach saturation only within limited areas and over a brief period during the spring months. It may, therefore, be uneconomical to use this method for the design of highway pavements under all conditions. An optimum design may be reached if the design is based on more favorable conditions, for example, 90 percent saturation of the soil; but it should be expected that a few failures will take place if such a method is used. The degree of saturation to be used in design depends on such factors as type of traffic, local soil conditions, purpose of road, initial cost, and cost of repair in the case of failure.
The purpose of this investigation is the evaluation of the effect on the bearing capacity of flexible pavements of the degree of saturation of the subgrade soil.
I c
NOMENCLATURE
pore pressure coefficient, pore pressure coefficient, cohesion (lb/ sq ft), cohesion as measured by undrained t1·iaxial or direct shear tests (Q-tests) (lb/ sq ft), cohesion with respect to effective stresses as measured by consolidatedundrained triaxial tests with pore pressure measurements (R-tests) (lb/sq ft),
Paper sponsored by Committee on Flexible Pavement Design and presented at the 43rd Annual Meeting.
1
2
d = width of loaded area (ft), (dp 1 - dp 3 ) = increase in stress difference or deviator stress, (lb/sq ft),
dp 3 = increase of ambient or hydrostatic stress (lb/ sq ft), dp = stress increase at level of subgrade (lb/sq ft),
v
dua = pore pressure increase caused by increase of stress difference by ( dp1 - dp 3 ) under undrained conditions (lb/ sq ft),
= pore pressure increase caused by increase of ambient stress by dp 3
under undrained conditions (lb/ sq ft), g = pressure in gas phase of soil (lb/ sq ft),
gf = pressure in gas phase at failure (lb/ sq ft),
K0 = coefficient of lateral earth pressure at rest,
Kc, K, Kq shape factors,
t length of loaded area (ft), Nc' Ny' Nq = bearing capacity factors,
= total overburden pressure at level of subgrade (lb/ sq ft), Po
(pl) 0 =
(p3)0
(p1)0
(p3)0
(p l) f
(p3 ) f =
(pi) f = (- ) ,p3 f
t s
r u
initial major total principal stress (lb/ sq ft),
initial minor total principal stress (lb/ sq ft),
initial major effective principal stress (lb/ sq ft),
initial minor effective principal stress (lb/ sq ft),
major total principal stress at failure (lb/ sq ft),
minor total principal stress at failure (lb/ sq ft),
major effective principal stress at failure (lb/ sq ft),
minor effective principal stress at failure (lb/ sq ft),
thickne ss of wearing and base courses (ft), degr ee of saturation (%)
pore pressure (lb/ sq ft), pore pressure at failure (lb/ sq ft),
u0
initial pore pressure (lb/ sq ft),
W applied load (lb), X parameter (Eq. 8),
¢ u angle of internal friction as measured by undrained direct shear or triaxial tests (Q-tests) (deg), and
¢' angle of internal friction with respect to effective stresses as measured by consolidated-undrained triaxiai tests with pore pressure measurements (R-tests) (deg).
BEARING CAPACITY OF FLEXIBLE PAVEMENTS
Failure of a flexible pavement caused by failure of the subgrade soil is illustrated in Figure 1. Failure takes place along an approximately cylindrical failure surface within the subgrade when the load intensity at the bottom of the base course, at the level of the subgrade, reaches the bearing capacity of the subgrade. The ultimate bearing capacity of a flexible pavement, as governed by the bearing capacity of the subgrade, depends on the load-carrying capacity of the base course, as well as on the shear strength parameters, c and¢, of the subgrade soils along the failure surface.
The load-distributing ability of the base and wearing courses can be calculated, at low load levels, by a method based on the theory of elasticity, assuming that the materials in the base and wearing courses behave as ideal elastic materials ( 6). When the applied load approaches the bearing capacity of the soil, elastic methods- are no longer

w
BASE COURSE
SUBGRADE
3
\.. d +t Figure l. Failure of flexible pavement .
Figure 2. Assumed load distribution at failure.
applicable. In the following analysis, it has been assumed that the applied load is distributed over an area which increases linearly with the distance from the point ofloading, the so-called 2: 1 method ( 11, 13). Thus, it has been assumed in the following calculations (Fig. 2) that the soifPressure increase, dpv, at the depth, t, below the point of loading as caused by the moving load, W, can be calculated from the equation:
dpv = w I ( d + t ) ( t + t ) ( 1 )
in which t d is the loaded area at the ground surface (Fig. 2). Failure will take place when the pressure increase dpv reaches the ultimate bearing capacity of the subgrade soil.
The ultimate bearing capacity of the subgrade soil depends on the bearing capacity factors Ne, Ny and Nq as expressed by the equation(:!_, 14,_!2):
(2)
in which
apparent cohesion, factors depending on the shape of the loaded area, and
overburden pressure at the level of the subgrade (Fig. 1).
The apparent angle of internal friction of the soil, ¢, and the cohesion, c, are functions of the rate of loading and the compressibility, void ratio and permeability of the subgrade soil. The most important of these factors are the rate of loading and the permeability of the subgrade soil. In the following analysis, it has been assumed that the rate of loading is high and that the change in moisture content of the soil is small as the soil is loaded to failure. The permeability of soils decreases rapidly with increasing percentage of silt and clay size particles. The change in moisture content of the soil as the soil is loaded to failure by a moving traffic load is small when the permeability of the soil is less than approximately 10- 3 cm/sec. Under these conditions, the shearing strength of a soil and the bearing capacity factors, Ne, Ny and Nq, are governed by the apparent angle of internal friction, </Ju, and the apparent cohesion, cu, of the soil, the shear strength parameters of the soil as determined by undrained triaxial or direct shear tests (Q-tests). Ne, Ny and Nq are functions of the apparent shear strength parameters, cu and </Ju. The bearing capacity factor, Nq, can be determined from the equation:
Nq = e 1T tan </Ju (1 +sin ¢u)/(1 - sin </Ju) (3)
4
C'"
z Cl z <t
)>...
z . " z
Ul 0:: 0 1-(.)
~
~ 1-(3 <t c._ <t (.)
(.!) z 0:: <t w CD
100
50
20
10
5
2
0 10 20 30 40
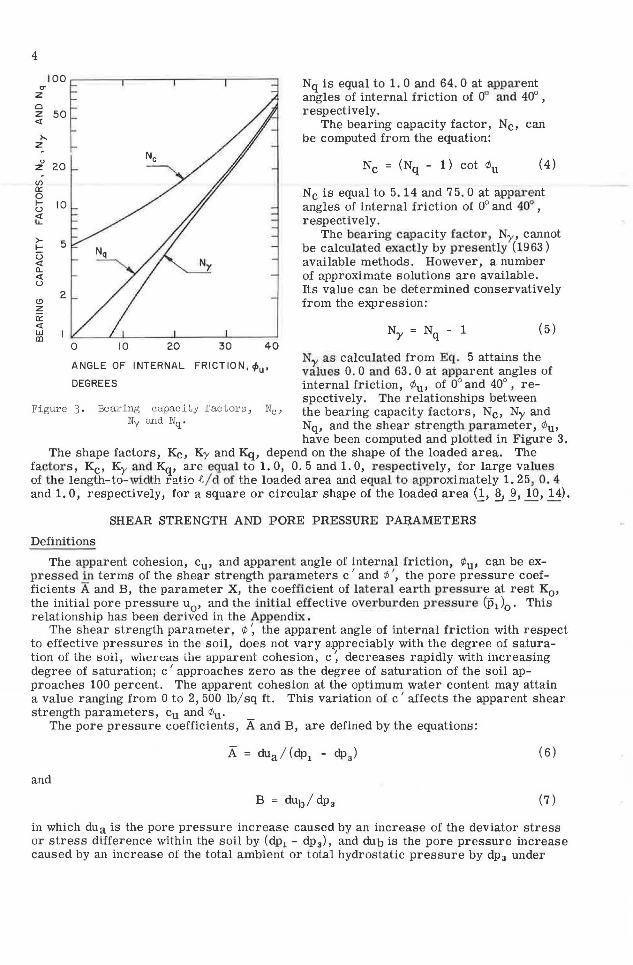
Nq is equal to 1. 0 and 64. 0 at apparent angles of internal friction of 0° and 40° , respectively.
The bearing capacity factor, Ne, can be computed from the equation:
Ne= (Nq - 1) cot ¢u (4)
Ne is equal to 5.14 and 75. 0 at apparent angles of internal friction of 0° and 40° , respectively.
The bearing capacity factor, Ny, cannot be calculated exactly by presently (1963) available methods. However, a number of approximate solutions are available. Its value can be determined conservatively from the expression:
(5)
Ny as calculated from Eq. 5 attains the ANGLE OF INTERNAL FRICTION, <l>u· values 0. 0 and 63. 0 at apparent angles of DEGREES internal friction, ¢u, of 0° and 40°, re-
spectively. The relationships between Figure 3. Bea r ing capacity factors, Ne, the bearing capacity factors, Ne, Ny and
Ny and Nq • Nq, and the shear strength parameter, ¢u, have been computed and plotted in Figure 3.
The shape factors, Kc, Ky and Kq, depend on the shape of the loaded area. The factors, Kc, Ky and Kq, are equal to 1. 0, 0. 5 and 1. O, respectively, for large values of the length-to-width ratio ·t/ d of the loaded area and equal to approximately 1. 25, 0. 4 and 1. O, respectively, for a square or circular shape of the loaded area(!, ~ _Q, 10, 14).
SHEAR STRENGTH AND PORE PRESSURE PARAMETERS
Definitions
The apparent cohesion, cu, and apparent angle of internal friction, ¢u, can be expressed in terms of the shear strength pa1·ameters c' and ¢ ', the pore pressure coefficients A and B, the parameter X, the coefficient of lateral earth pressure at rest K0 ,
the initial pore pressure u0
, and the initial effective overburden pressure (p1 )0 • This relationship has been derived in the Appendix.
The shear strength parameter, ¢ ', the apparent angle of internal friction with respect to effective pressures in the soil, does not vary appreciably with the degree of saturation of the soil, whereas the apparent cohesion, c ~ decreases rapidly with increasing degree of saturation; c' approaches zero as the degree of saturation of the soil approaches 100 percent. The apparent cohesion at the optimum water content may attain a value ranging from 0 to 2, 500 lb/sq ft. This variation of c' affects the apparent shear strength parameters, cu and ¢u.
The pore pressure coefficients, A and B, are defined by the equations:
(6)
and
(7)
in which dua is the pore pressure increase caused by an increase of the deviator stress or stress difference within the soil by (dp1 - dp 3 ), and dub is the pore pressure increase caused by an increase of the total ambient or total hydrostatic pressure by dp 3 under
5
undrained conditions. The pore pressure coefficient, B, is equal to 1. 0 for saturated soils but decreases rapidly with decreasing degree of saturation. The pore pressure coefficient, B, is approximately equal to zero when the degree of saturation is in the range of 30 to 70 percent.
The pore pressure coefficient, A, is also a function of the degree of saturation of the soil. A at a constant relative density is approximately proportional to the pore pressure coefficient, B. The relationship, A = 0. 5 B, corresponds to a soil with a low relative density, and the relationship, A= -0. 2 B, corresponds to a soil with a relatively high relative density.
The parameter X affects the effective stress distribution in a soil and, thus, the apparent shear strength parameters, Cu and ¢u. X (~, ~) is defined by the equation:
p = p - u X - g (1. 0 - X) (8)
in which pis the effective normal stress corresponding to the total normal stress p, u is the pore pressure and g is the gas pressure in the soil. X can, as a first approximation, be taken equal to the degree of saturation of the soil. It is equal to 1. 0 for a fully saturated soil and to zero when the degree of saturation approaches zero.
The initial effective and total pressures in the subgrade are affected by the coefficient of lateral earth pressure at rest, K0 . The total vertical pressure, (p1 ) 0 , as shown in Figure 1, before the application of any external loads, is equal to the total overburden pressure; the corresponding effective vertical pressure, (p1 ) 0 , can be calculated from Eq. 8 if the initial pore and gas pressures, u 0 and g0 , respectively, are known. The corresponding initial lateral confining pressure, (j53 ) 0 , can be expressed in terms of the initial effective overburden pressure by the equation:
(9)
in which K0 is the coefficient of lateral earth pressure at rest. Ka may attain a value as low as 0.4 for a normally consolidated clay (2), and as high as 2. 5 for a heavily overconsolidated clay ( 16). The coefficient of lateral earth pressure for a compacted, partially saturated soildepends mainly on the compaction procedure. A value of K0 of 1. 0 has been used in the following analysis.
Interrelationships Between Shear Strength and Pore Pressure Parameters
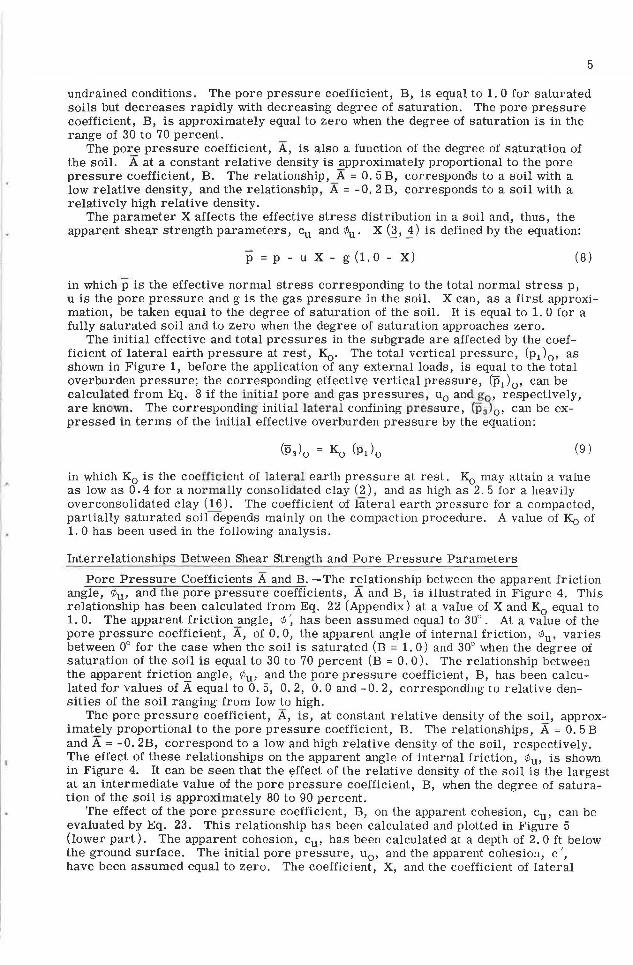
Pore Pressure Coefficients A and B. -The relationship between the apparent friction angle, ¢u, and the pore pressure coefficients, A and B, is illustrated in Figure 4. This relationship has been calculated from Eq. 22 (Appendix) at a value of X and K
0 equal to
1. 0. The apparent friction angle, ¢: has been assumed equal to 30°. At a value of the pore pressure coefficient, A, of 0. 0, the apparent angle of internal friction, ¢u, varies between 0° for the case when the soil is saturated (B = 1. 0) and 30° when the degree of saturation of the soil is equal to 30 to 70 percent (B = 0. 0). The relationship between the apparent frictio_!?: angle, ¢u, and the pore pressure coefficient, B, has been calculated for values of A equal to 0. 5, 0. 2, 0. 0 and -0. 2, corresponding to relative densities of the soil ranging from low to high.
The pore pressure coefficient, A, is, at constant relative density of the soil, approximately proportional to the pore pressure coefficient, B. The relationships, A = 0. 5 B and A= -0. 2B, correspond to a low and high relative density of the soil, respectively. The effect of these relationships on the apparent angle of internal friction, ¢u, is shown in Figure 4. It can be seen that the effect of the relative density of the soil is the largest at an intermediate value of the pore pressure coefficient, B, when the degree of saturation of the soil is approximately 80 to 90 percent.
The effect of the pore pressure coefficient, B, on the apparent cohesion, cu, can be evaluated by Eq. 23. This relationship has been calculated and plotted in Figure 5 (lower part). The apparent cohesion, cu, has been calculated at a depth of 2. 0 ft below the ground surface. The initial pore pressure, u 0 , and the apparent cohesion, c 1
,
have been assumed equal to zero. The coefficient, X, and the coefficient of lateral

6
30 (f) w ,,, [I'.
"' w 0
, -9-
z" 0
ti 20 a:: IL
_J
<l: z [I'. w t--~
IL 0 10 w _J
"' z <l:
t--z w [I'.
'it a. <l:
0 0 .2 0.4 0.6
<t>' =30°
K = 1.0
x = 1.0
0.8
PORE PRESSURE COEFFICIENT,B
1.0
earth pressure, Ko, have been taken as 1. 0. The apparent angle of internal friction, ¢ 1
, has been assumed equal to 30°. Figure 5 indicates that cu increases rapidly with increasing values of B (thus, with increasing degree of saturation) and with decreasing values of A (thus, with increasing relative density of the soil). The apparent cohesion, cu, ranges from 130 to 430 lb/ sq ft as A ranges from 0. 5 to -0. 2. It may be concluded that, at small values of c ', cu is greatly affected by the degree of saturation of the soil.
The effects of the pore pressure coefficients, A and B, on the shear strength parameter, cu, have also been calculated for a value of the apparent cohesion, c 1
,
equal to 400 lb/sq ft (Fig. 5, upper part). It can be seen that the effect of c' on cu is large. Thus, in the calculation of cu, all terms on the right-hand side of Eq. 23, except the first term (2c' cos r/J '), can be neglected when the apparent cohesive strength of the soil exceeds approximately 400 lb/ sq ft.
Coefficient X. -The coefficient X affects the apparent angle of internal friction, ¢u, of the soil. Its effect can be evaluated from Eq. 22 as a function of the pore
Figure 4. r/Ju vs po:10:_e pressure coeffi - pressure coefficient, B, and is presented cients, A and B. in Figure 6. X can, as a first approxi-
mation, be taken as the degree of saturation of the soil. The effect of X has been
calculated at a value of the coefficient of lateral earth pressure at rest, Ka, equal to 1. 0, at a value of the ~parent friction angle, ¢ 1
, of 30° and at a value of the pore pressure coefficient, A, of 0. 0. The pore pressure coefficient, B, is always less than the degree of saturation, Sr, and thus, less than X. The relationship, X = B, therefore, represents a lower limit of the pore pressure coefficient, X. It can be seen from Figure 6. that the effect of X on the apparent friction angle, ¢u, is relatively small and can be neglected. X also has an effect on the apparent cohesion, Cu. Its effect is small as compared to the effect of the apparent cohesion, c 1
, when the value of c
1 exceeds approximately 400 lb/sq ft (Fig. 5).
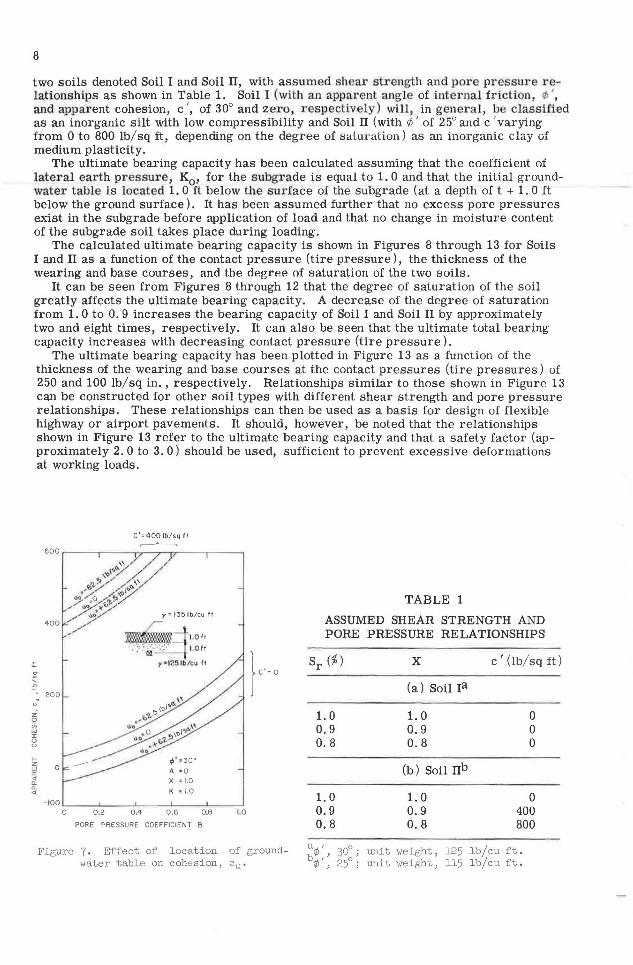
Initial Pore Pressure u0 . -The effect of the initial pore pressure, u0 , on the shear strength parameters, r/Ju and cu, can also be evaluated by Eqs. 22 and 23. The apparent friction angle, r/Ju, is unaffected by the initial pore pressure, u0 • Its effect on the apparent cohesion, cu, has been evaluated and presented in Figure 7. A variation of the initial location of the groundwater table by 2. 0 ft affects Cu by 70 lb/ sq ft at low values of the pore pressure coefficient, B, and by 120 lb/ sq ft for a value of B equal to 1. 0. This effect is small and can be neglected in comparison with the effect of the apparent cohesion, c ' , when c ' exceeds approximately 400 lb/ sq ft.
NUMERICAL EXAMPLES
The ultimate bearing capacity of a flexible pavement as governed by the ultimate strength of the subgrade can be calculated from Eqs. 1 and 2. It has been assumed that the load applied to the surface of the pavement is distributed to the subgrade over an area which increases in proportion to the thickness of the base and wearing courses (the 2:1 method). It has been further assumed that failure of the subgrade takes place

600
.:: CT
"' ......
== ~
0
-z 400 Q Cf) w I 0 0
f-z w 0:: <[ a.. a..
200 <[
A=O.O
y =135 lb/cu ft
------11.011 •. '·:·~ :1;,i· i. ··:-:: I.O ft
y• 12.5 lb/cu ft
A=0.2
C' = 400 I b/sq ft
¢' = 30°
K0 = 1.0
x = 1.0
C'=O
7
PORE PRESSURE COEFFICIENT, B
Figure 5. cu vs pore pressure coefficients, A and B.
when the pressure increase, dpv, at the level of the subgrade is equal to the ultimate bearing capacity, qult. as determined by Eq. 2. The ultimate bearing capacity can be expressed in terms of the bearing capacity factors, Ne, Ny and Nq. These bearing capacity factors are functions of the apparent angle of internal friction of the soil, ¢u, in the case when the rate of loading is sufficiently high that no or very small changes of the water content of the soil take place when the soil is loaded to failure. The relationship between the apparent friction angle, ¢uL and the pore pressure coefficients, A and B, have been presented in Figure 4.
The ultimate bearing capacity depends also on the apparent cohesion, cu, which can be evaluated directly from Figure 5 as a function of the pore pressure coefficients, A and B.
The ultimate bearing capacity of a flexible pavement has been calculated for
30°
en w w a:: (!) w 0
~ -9-
z 0
2.0
j:: S2 a:: lL
_J <( z a:: w f-~ 10 lL 0
w _J (!)
z <(
f-z w a:: <( a.. a.. 0 <(
Figure 6.
"''=30° A=O
K = 1.0
0 .2 0.4 0.6 0 :8 1.0
PORE PRESSURE COEFFICIENT, B
Effect of parameter X on fric tion angle, ¢u ·
8
two soils denoted Soil I and Soil II, with assumed shear strength and por e pressure relationships as shown in Table 1. Soil I (wi th an apparent angle of internal friction, </J ', and apparent cohesion, c ' , of 30° and zero, respectively) will, in gener a l, be clas sified as an inorganic silt with low compressibility and Soil II (with ¢' of 25° and c 'varying from 0 to 800 lb/ sq ft, depending on the degree of saturation) as an inorganic clay of medium plasticity.
The ultimate bearing capacity has been calculated assuming that the coefficient of lateral earth pressure , K0 , for the subgr ade is equal to 1. 0 and that the initial groundwater table is located 1. 0 ft below the sur face of the subgrade (at a depth oft + 1. 0 ft below the ground surface). It has been assumed further that no excess pore pressures exist in the subgrade before application of load and that no change in moisture content of the subgrade soil takes place during loading.
The calculated ultimate bearing capacity is shown in Figures 8 through 13 for Soils I and II as a function of the contact pressure (tire pressure), the thickness of the wearing and base courses, and the degrP.e of saturation of the two soils.
It can be seen from Figures 8 through 12 that the degree of saturation of the soil greatly affects the ultimate bearing capacity. A decrease of the degree of saturation from 1. 0 to 0. 9 increases the bearing capacity of Soil I and Soil II by approximately two and eight times, respectively. It can also be seen that the ultimate total bearing capacity increases with decreasing contact pressure (tire pressure).
The ultimate bearing capacity has been plotted in Figure 13 as a function of the thickness of the wearing and base courses at the contact pressures (tire pressures) of 250 and 100 lb/sq in., respectively. Relationships similar to those shown in Figure 13 can be constructed for other soil types with different shear strength and pore pressure relationships. These relationships can then be used as a basis for design of flexible highway or airport pavements. It should, however, be noted that the relationships shown in Figure 13 refer to the ultimate bearing capacity and that a safety factor (approximately 2. 0 to 3. 0) should be used, sufficient to prevent excessive deformations at working loads.
.:: ~
' .0
u'
z Q VI w :I: 0 u
200
0
C' =400 1b/sq fl ,----->-----.
y = 135 lb/cu ft • : :~::
K • 1.0
-100 '-----'---~-___..--~-~ 0 0 .2 0.4 0.6 0.8 10
PORE PRESSURE COEFFICIENT B
Figure 7, Effect of location of groundwater t abl e on cohesion, cu•
TABLE 1
ASSUMED SHEAR STRENGTH AND PORE PRESSURE RELATIONSHIPS
1. 0 0.9 0.8
1. 0 0.9 0.8
x
(a) Soil ra
1. 0 0.9 0.8
(b) Soil IIb
1. 0 0.9 0.8
c' (lb/sq ft)
0 0 0
0 400 800
~¢;, 30°; unit weight, l25 lb/cu ft . ¢ , 25°; unit weight, ll5 lb/cu ft .

9
300 250
.= 200 O" .,
150 ' ;!:! \ w ' a:: 100 '\ ::::>
en 80 en w ' a::
' ' SOIL I (l_ 60
'" '""' - . SOIL II
w a::
40 , =O.~ ~~58 ;:::
30 ........... ....., 25
s, =1.0 ............. ':---...,
I 1.5 2 3 4 5 7 10 15 20 30 40 50 70 100
W,IOOOlb
Figure 8. Ultimate bearing capacity, W, of flexible pavement, 6.o in. total thickness .
300
250
-= 200
O' 150 .,
' ~ u.i
100 a:: ::::> en 80 en w a::
60 (l_
w a:: 40 ;:::
30 25
I 1.5 2 3 4 5 7 10 15 20 30 40 50 70 100 W,IOOOlb
Figure 9 . Ultimate bearing capacity , w, of flexible pavement , l2 in. total thickness .
300,.--~...---.-~~..-.--..---,---,----,--..-.-...-~-...~....-..-----,-~...--r--r-.,-,.....,...., 250
200
c 150
O"
~ 100
w 80 a:: ill 60 CJ)
w a:: (l_ 40
30
SOIL I
SOIL II
s, =0.8
w a:: ;::: 25 ~~-'---'~~'--.......L.--L--L.......L.-'-J.....1..~--L--"""'-~.......L.~.L.--'--'-.J....J'-'-1
I 1.5 2 3 4 5 7 10 15 20 30 40 50 70 100 W, IOOOlb
Figure lO. Ultimate bearing capacity, W, of flexible pavement, l8 in. total thickness .

10
300 300 250 \
\ Sr=0.9~Sr =0.8 250 \
\
200 \ \ " 200 \ ~
c: \ c: 150 ' \ Sr =0.9', ·- 150 Sr=l.O\ c:r c:r ~, ' '5, =1.0 "' ~ ' ', .0 100 ',~ .0
100 ' w 80 "-....
w 80 0:. 0:: :::> ........ :::> Cf) 60
......... Cf) 60 Cf) .... (f)
w w 0:: S,=1.0 0:: a_ a_
40 40 -- --SOIL I w w 0::
0:: --SOIL II i==
30 t-- 30 25 25
10 15 20 30 40 50 70 100 10 15 20 30 50 70 100
W, IOOOlb W,IOOOlb
Figure 11. Ultimate bearing capac i ty, w, Figure 12. Ultimate bearing capacity, w, of flexible pavement, 24 in. total of flexible pavement, 30 in. total
thickness. thickness.
30 25
20
15
(f) 10 w I
8 u z
6 (f)
1.5 2 .0 (f) 3 4 5 7 w 10 15 20 30 40 50 70 100 z :.:
(a) !,:! I 30 I-
25 I-z 20 w :::;: w 15 ~ Cl.
10
8
1.5 2.0 3 4 5 7 10 15 20 30 4050 70 100
w ,1000 lb (b) -----SOIL I
SOIL II
Figure 13 . Ultimate bearing capacity, W, of flexible pavement: (a) tire pressure, 250 lb/s~ in., and (b) tire pressure, 100 lb/s~ in.

'
I
11
SUMMARY
Failure of flexible pavements may occur by failure of the subgrade soil when the load at the level of the subgrade reaches the bearing capacity of the subgrade. The ultimate bearing capacity of the subgrade can be evaluated by the bearing capacity factors, Ne, Ny and Nq. The bearing capacity factors and the ultimate bearing capacity of the subgrade are functions of the apparent angle of internal friction, ~"' ru1d the apparent cohesion, cu, as evaluated by undrained triaxial or direct shear tests ( Q-tests). These shear strength parameters can be expressed in terms of the apparent shear strength parameters ¢'and c ' , the pore pressure coefficients A and B, the empirical factor X, and the coeifficient of lateral earth pressure at rest K0 .
The apparent friction angle, ¢u, was found to decrease rapidly with increasing value of the pore pressure coefficient, B, and thus, with the degree of saturation of the soil. On the other hand, the apparent cohesion, cu, increased rapidly wi.th increasing degree of saturation of the soil and with increasing value of the pore pressure coefficient, B. The effects of overburden pressure, the coefficient of lateral earth pressure at rest K0 , the empirical coefficient K, and the location of the groundwater table were found to be small when the apparent cohesion of the soil, c ', exceeded approximately 400 lb/sq ft.
The ultimate bearing capacity of flexible pavements has been calculated for two subgrade soils (a silt of low compressibility and a clay of medium plasticity) as a function of the thickness of the wearing and base courses, the contact pressure (tire pressure) and of the degree of saturation of tl1e subgrade soils. It was found that the degree of saturation affected greatly the bearing capacity of flexible pavements.
Appendix
The apparent angle of internal friction, ¢u, and apparent cohesion, cu, depend on the degree of saturation of the soil, the pore pressure coefficients A and B, lhe coefficient X, the coefficie~t of l~teral ear.th_ ~ressure at rest K0 , the effective shear strength parameters c and ¢ and the initial pore pressure u0 • The relationship between the apparent cohesion, cu, the apparent angle of internal friction, ¢u, and these coefficients are derived in the following.
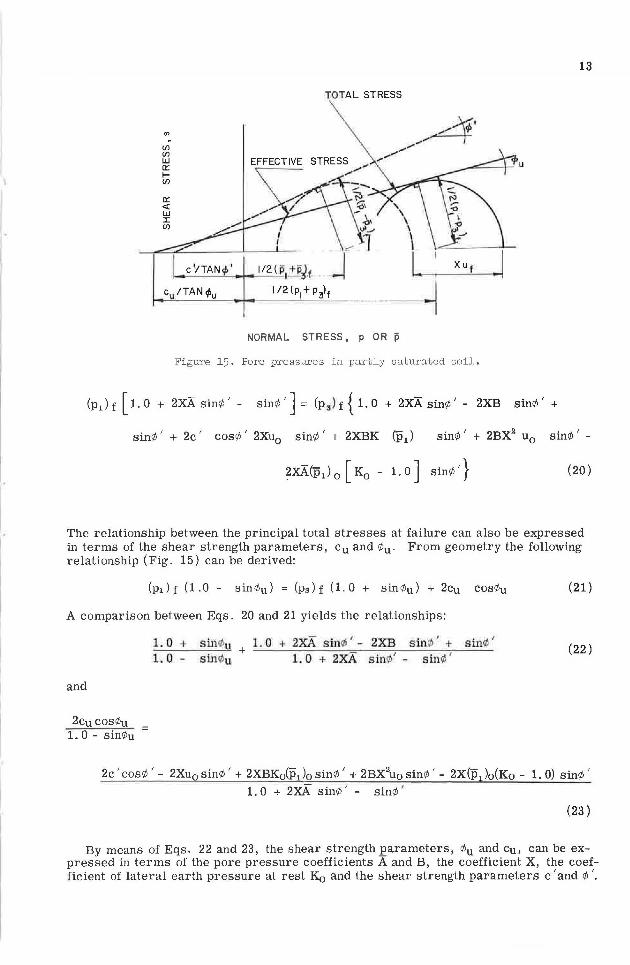
Failure of the soil takes place when the Mohr's stress circle with respect to effective stresses is tangent to the envelope curve corresponding to the shear strength parameters, ¢ ' and c ' , as shown in Figure 13. F1·om geometry the following relationship can be derived:
(10)
This equation can be rewritten in terms of total stresses, (p 1 )f and (p 3 )f, if it is observed that:
X) (11)
and (12)

12
PORE PRESSURE -
"o
INITIAL CONDITIONS AMBIENT STRESS DEVIATOR STRESS FAILURE CONDITIONS
Figure l4. Pore pressures in partly saturated soil.
The gas pressure, gf, at failure is, in general, low. If the gas phase is continuous, then gf is equal to the atmospheric pressure and can be neglected. In the following analysis, gf has been assumed equal to zero.
The pore pressure, Uf, at failure (Eqs. 11, 12) can be determined from the equation:
(13)
in which u 0 is the initial pore pressure in the soil, dub is the pore pressure increase caused by an increase of the ambient or hydrostatic pressure by dp 3, and dua is the pore pressure increase caused by an increase of the deviator stress or stress difference by (dp1 - dp3). The pore pressure increases, dub and dua, can be determined from the relationships (Fig. 14):
dub = B dp 3
dua = A (dp1 - dp 3)
(14)
(15)
in which A and B are pore pressure coefficients. B depends on the degree of saturation of the soil and is equal to 1. 0 when the degree of saturation of the soil approaches 100 percent and equal to zero when the degree of saturation of the soil is 30 to 70 percent. The pore pressure coefficient A depends on the degree of saturation, as well as on the relative density of the soil.
The ambient and deviator stress increases, dp 3 and (dp1 - dp 3), respectively, depend on the initial principal total stresses in the ~1oil, (pi)0 and (p3) 0 , as well as on the stress conditions at failure, (p1) f and (p 3) f. The initial total stresses depend on the coefficient of lateral earth pressure at rest, K 0 , and can be determined from the equations:
and
The ambient pressure increase dp3 can then be calculated from Eq. 17 as:
dp3 = (p3)f - [Ko (pl)O + x Uo J and the deviator stress (dp1 - dp 3) from Eq. 16 as:
(dp1 - dp3) = (p1)f - (p3)f + (p1) 0 [ K0 -1.0 J
(16)
(17)
(18)
(19)
By substituting Eqs. 18 and 19 into Eqs . 14 and 15, the pore pressure at failure cau be determined from Eq. 13. The relationship between total pressures at failure (p1) f and (p3) f can be determined by substituting Eqs. 11, 12, and 13 into Eq. 10:
"' (f) (f) LJ.J a:: 1-(f)
a:: <i LJ.J I (f)
TOTAL STRESS
EFFECTIVE STRESS ,.. ,,,. ....
NORMAL STRESS, p OR p
Figure l5. Pore pressures in partly saturated soil.
(p 1 )f [i.o + 2xAsin¢1
- sin¢1
] = (p 3) f{ 1.0 + 2xAsin¢' - 2XB sin¢'+
13
sin¢ / + 2c / cos¢ / 2Xu0 sin¢ / + 2XBK (p1 ) sin¢ / + 2BX2 u0 sin¢ / -
(20)
The relationship between the principal total stresses at failure can also be expressed in terms of the shear strength parameters, Cu and ¢u. From geometry the following relationship (Fig. 15) can be derived:
(pi) f (1.0 - sin¢u) = (p3) f (1. 0 + sin¢u) + 2cu cos¢u
A comparison between Eqs. 20 and 21 yields the relationships:
and
2cu cos¢u 1. 0 - sin¢u
1. 0 + si.neu + 1. O + 2xA sine' - 2XB sinl,6 ' + sin¢' 1.. 0 - sin0u 1. 0 + 2XA sinih' - sine '
(21)
(22)
2c / cos¢
/ - 2Xu0 sin¢ / + 2XBK0 (p1 )0 sin¢ / + 2BX2u0 sin¢ / - 2X(p1 )0 (K0 - 1. 0) sin¢ /
1. 0 + 2XA sin¢ / - sin¢ '
(23)
By means of Eqs. 22 and 23, the shear strength Earameters, ¢u and cu, can be expressed in terms of the pore pressure coefficients A and B, the coefficient X, the coefficient of lateral earth pressure at rest Ko and the shear strength parameters c
/ and ¢
1
•
14
REFERENCES
1. deBeer, E. E., and Ladanyi, B. Etude Experimentale de la Capacite Portante du Sable Sous des Foundations Circulaires Stablies en Surface. Proc. 5th Int. Conf. on Soil Mech. and Found. Eng., Vol. 1, pp. 577-585, 1961.
2. Bishop, A. W. Test Requirements for Measuring the Coefficient of Earth Pressure at Rest. Brussels Conf. 58 on Earth Press. Prob., Vol. 1, pp. 2-14, 1958.
3. Bishop, A. W., Alpan, I., Blight, G. E., and Donald, I. B. Factors Controlling the Strength of Partly Saturated Cohesive Soils. Proc. ASCE Conf. on Shear Strength of Cohesive Soils, Boulder, pp. 503-532, 1960.
4. Bishop, A. W. Discussion. Proc. Conf. on Pore Pressure and Suction in Soils, pp. 38-46, 1961.
5. Broms, B. B. Bearing Capacity of Flexible Pavements Subject to Frost Action. Highway Research Record No. 39, pp. 66-180, 1963.
6. Burmister, D. M. The Theory of Stresses and Displacements in Layered Systems and Applications to Design of Airport Runways. Highway Research Board Proc., pp. 126-148, 1943.
7. Caquot, A., and Kerisel, J. Tables for the Calculation of Passive Earth Pressure, Active Earth Pressure and Bearing Capacity of Foundations. Paris, GauthierVillars, 1948.
8. Feda, J. Research on the Bearing Capacity of Loose Soil. Proc. 5th Int. Conf. on Soil Mech. and Found. Eng., Vol. 1, pp. 635-642, 1961.
9. Hansen, B. The Bearing Capacity of Sand Tested by Loading Circular Plates. Proc. 5th Int. Conf. on Soil Mech. and Found. Eng., Vol. 1, pp. 659-664, 1961.
10. l'Herminier, R., Habib, P., Tcheng, Y., and Bernede, J. Foundations Superficielles. Proc. 5th Int. Conf. on Soil Mech. and Found. Eng., Vol. 1, pp. 713-717' 1961.
11. Hough, B. K. Basic Soils Engineering. New York, Ronald Press Co., 1957. 12. Linell, K. A. Frost Design Criteria for Pavement. Highway Research Board
Bull. 71, pp. 18-32, 1953. 13. Lundgren, H., and Brinch-Hansen, J. Geoteknik. Copenhagen, Teknisk Forlag,
1958. 14. Meyerhof, G. G. The Ultimate Bearing Capacity of Foundations. Geotechnique,
Vol. 2, pp. 301-332, 1951. 15. Skempton, A. W. The Pore-Pressure Coefficients A and B. Geotechnique, Vol. 4,
pp. 143-147, 1954. 16. Skempton, A. W. Horizontal Stresses in an Over-Consolidated Eocene Clay. Proc.
5th Int. Conf. on Soil Mech. and Found. Eng., Vol. 1, pp. 351-357, 1961. 17. Terzaghi, K. Theoretical Soil Mechanics. New York, John Wiley and Sons, 1943.