effect of competitive strategies on the relationship
TRANSCRIPT
EFFECT OF COMPETITIVE STRATEGIES ON THE RELATIONSHIP BETWEEN
STRATEGIC HUMAN RESOURCE MANAGEMENT AND FIRM PERFORMANCE
OF KENYA’S CORPORATE ORGANIZATIONS
ESTHER WANGITHI WAIGANJO
DOCTOR OF PHILOSOPHY
(Human Resource Management)
JOMO KENYATTA UNIVERSITY OF
AGRICULTURE AND TECHNOLOGY
2013

Effect of Competitive Strategies on the Relationship between Strategic Human Resource
Management and Firm Performance of Kenya’s Corporate Organizations
Esther Wangithi Waiganjo
A Thesis Submitted in Partial Fulfillment for the Degree of Doctor of Philosophy in Human
Resource Management in the Jomo Kenyatta University of Agriculture and Technology
2013

i

ii
DECLARATION
This thesis is my original work and has not been presented for a degree in any other
University.
Signature:……………………………………. Date: …………………………………
Esther Wangithi Waiganjo
This thesis has been submitted for examination with our approval as University
Supervisors:
Signature:…………………………………….. Date: ………………………
Prof. Elegwa Mukulu
JKUAT, Kenya
Signature:…………………………………… Date: ………………………………
Dr. James Kahiri
KU, Kenya

iii
DEDICATION
This thesis is dedicated to my beloved daughter, Jessica Njeri.

iv
ACKNOWLEDGEMENTS
Realization of this thesis would not have been successful had I not received professional,
financial and moral support from many individuals, and I do extend my appreciation to
them all. My sincere gratitude goes to Jomo Kenyatta university of Agriculture &
Technology for sponsoring my PhD studies and granting me study leave to pursue the
course.
I would particularly like to thank my supervisors, Prof. Elegwa Mukulu and Dr. James
Kahiri, for their support, patience, guidance and constructive criticism throughout the
whole research period.
I am quite grateful to the chairman of Entrepreneurship and Procurement department, Dr.
Mike Iravo for his immense support. My special thanks also go to Prof. G. Namusonge,
Dr.Kabare Karanja, Dr. Hazel Gachunga, Dr.John Kihoro and the entire staff of the
School of Human Resource Development for their contribution, cooperation and
encouragement.
I am very thankful to all the respondents who participated to make this research possible.
Sincere thanks also go to my supportive colleagues, friends and family.

v
TABLE OF CONTENTS
DECLARATION............................................................................................................................. ii
DEDICATION................................................................................................................................iii
ACKNOWLEDGEMENT ............................................................................................................. iv
TABLE OF CONTENTS ............................................................................................................... v
LIST OF TABLES ......................................................................................................................... ix
LIST OF FIGURES ....................................................................................................................... xi
LIST OF APPENDICES .............................................................................................................. xii
ABBREVIATIONS ...................................................................................................................... xiv
DEFINITION OF TERMS........................................................................................................... xv
ABSTRACT ................................................................................................................................. xvii
CHAPTER ONE ............................................................................................................................. 1
1.0 INTRODUCTION..................................................................................................................... 1
1.1 Background of the study ............................................................................................................. 1
1.2 Statement of the problem ............................................................................................................ 4
1.3 Objectives of the study................................................................................................................ 7

vi
1.4 Research questions ...................................................................................................................... 8
1.5 Hypotheses .................................................................................................................................. 9
1.6 Significance of the study ........................................................................................................... 10
1.7 Scope of the study ..................................................................................................................... 12
1.8 Limitation of the study .............................................................................................................. 12
CHAPTER TWO .......................................................................................................................... 14
2.0 LITERATURE REVIEW ...................................................................................................... 14
2.1 Introduction ............................................................................................................................... 14
2.2 Theoretical framework .............................................................................................................. 14
2.3 Conceptual framework .............................................................................................................. 25
2.4 Review of related theoretical literature ..................................................................................... 27
2.5 Empirical review ....................................................................................................................... 37
2.6 Critique of the existing literature .............................................................................................. 39
2.7 Research gaps............................................................................................................................ 42
2.8 Summary ................................................................................................................................... 44

vii
CHAPTER THREE ...................................................................................................................... 46
3.0 RESEARCH METHODOLOGY .......................................................................................... 46
3.1 Introduction ............................................................................................................................... 46
3.2 Research design ........................................................................................................................ 46
3.3 Population ................................................................................................................................. 48
3.4 Sampling frame ......................................................................................................................... 49
3.5 Sample and sampling technique................................................................................................ 50
3.6 Data collection instruments....................................................................................................... 52
3.7 Data collection procedure ......................................................................................................... 54
3.8 Pilot test .................................................................................................................................... 54
3.9 Data processing and analysis .................................................................................................... 56
3.10 Measurment of variables ......................................................................................................... 58
CHAPTER FOUR ......................................................................................................................... 60
4.0 RESEARCH FINDINGS AND DISCUSSION ..................................................................... 60
4.1 Introduction ............................................................................................................................... 60
4.2 General Characteristics of the study sample ............................................................................. 60

viii
4.3 Descriptive statistics ................................................................................................................. 65
4.4 Measurement models for the variables .................................................................................... 80
4.5 Correlation analysis between SHRM and firm performance .................................................... 88
4.6 Multiple regression analysis ..................................................................................................... 94
CHAPTER FIVE ....................................................................................................................... 142
5.0 SUMMARY,CONCLUSIONS AND RECOMMENDATIONS ....................................... 142
5.1 Introduction ............................................................................................................................. 142
5.2 Summary ................................................................................................................................. 142
5.3 Conclusions ............................................................................................................................. 151
5.4 Recommendations ................................................................................................................... 155
REFERENCES ............................................................................................................................ 159
APPENDICES ............................................................................................................................. 165
ix
LIST OF TABLES
Table 3.1 Number selected for a random sample .................................................................. 52
Table 4.2 Response rate ........................................................................................................ 62
Table 4.3 Size of the study sample ........................................................................................ 65
Table 4.4 Selective resourcing and firm performance .......................................................... 66
Table 4.5 Use of teams and decentralization and firm performance ..................................... 68
Table 4.6 Extensive training and firm performance .............................................................. 70
Table 4.7 Sharing information and firm performance........................................................... 72
Table 4.8 Incentives and firm performance ....................................................................... 73
Table 4.9 Competitive HR strategies .................................................................................... 75
Table 4.10 Perceived profitability .......................................................................................... 76
Table 4.11 Summary of means and std deviations of SHRM practices ................................. 78
Table 4.12 First order model for SHRM ................................................................................ 82
Table 4.13 Confirmatory model for SHRM .......................................................................... 84
Table 4.14 Measurement model for competitive strategies ................................................... 86
Table 4.15 Measurement model for firm performance .......................................................... 87

x
Table 4.16 Correlation analysis results for SHRM and sales growth .................................... 90
Table 4.17 Regression analysis results for SHRM and profitability ratio ............................. 92
Table 4.18 Regression analysis results for SHRM and perceived profitability ..................... 93
Table 4.19 Regression analysis results for SHRM and firm performance ............................. 96
Table 4.20 Regression analysis results for the moderating effect of CHRS ........................ 122
Table 4.21 Regression analysis results for the moderating effect of QHRS ........................ 128
Table 4.22 Regression analysis results for the moderating effect of IHRS ......................... 135

xi
LIST OF FIGURES
Figure 2.1 Conceptual framework ...................................................................................... 26
Figure 4.2 Ownership status of the study sample ............................................................... 63
Figure 4.3 Age of the study sample ..................................................................................... 64

xii
LIST OF APPENDICES
Appendix 1 Survey questionnaire ................................................................................. 165
Appendix 2 Interview guide ......................................................................................... 172
Appendix 3 Letter of introduction ................................................................................ 173
Appendix 4 Model 1-SHRM and sales growth ............................................................. 174
Appendix 5 Model 2-SHRM and perceived profitability ............................................. 176
Appendix 6 Model 3-SHRM and profitability ratio ..................................................... 178
Appendix 7 Model 4-moderated multiple regression model for CHRS ...................... 180
Appendix 8 Model 5-MMR for SHRM, CHRS and sales growth ................................ 181
Appendix 9 Model 6- MMR for SHRM, CHRS and PP ............................................... 183
Appendix 10 Model 7- MMR for SHRM, CHRS and PR .............................................. 185
Appendix 11 Model 8- moderated multiple regression model for QHRS ...................... 187
Appendix 12 Model 9-MMR for SHRM, QHRS and sales growth ................................ 188
Appendix 13 Model 10- MMR for SHRM, QHRS and PP ............................................ 190
Appendix 14 Model 11- MMR for SHRM, QHRS and PR ............................................ 192

xiii
Appendix 15 Model 12- moderated multiple regression model for IHRS .................... 195
Appendix 16 Model 13-MMR for SHRM, IHRS and sales growth ............................. 196
Appendix 17 Model 14-MMR for SHRM, IHRS and PP ............................................. 198
Appendix 18 Model 15-MMR for SHRM, IHRS and PR ............................................ 200
Appendix 19 Sub dimensions of SHRM practices ..................................................... 203
Appendix 20 Items of competitive strategies ................................................................ 206
Appendix 21 Sample size determination .................................................................... 207

xiv
LIST OF ABBREVIATIONS
CHRS Cost led Human Resource Strategy
HR Human Resource
HRM Human Resource Management
IHRS Innovation led Human Resource Management
KAM Kenya Association of Manufacturers
MMR Moderated Multiple Regression
QHRS Quality led Human Resource Management
SHRM Strategic Human Resource Management
SPSS Statistical Package for Social Sciences
UNIDO United Nations Industrial Development organizations

xv
DEFINITION OF TERMS
Human resource: Sum total of all inherent abilities, knowledge and skills
represented by attitudes, amplitudes and talents of an
organizations workforce (Armstrong, 2009).
Human resource
management:
Is a strategic and coherent approach to the management of an
organization’s most valued assets or the employees who
individually and collectively contribute to the achievement of
its goals and objectives (Armstrong, 2009).
Strategic human
resource
management:
An approach to making decisions on the intentions and plans of
the organization in the shape of policies,programmes and
practicesconcerningtheemploymentrelationship,resourcing,learn
ing and development, performance management, reward and
employee relations(Cole,2004).
Strategy: Overall direction an organization wishes to pursue in order to
achieve its objectives through HR .It is the determination of the
basic long-term goals and objectives of an enterprise and the
adoption of courses of action and the allocation of resources for
carrying out these goals (Beardwell, 2004).

xvi
Competitive
advantage:
A set of capabilities or resources that allow an organization to
differentiate its product or service from those of its competitors
to increase market share (Wiggins & Ruefli, 2002).

xvii
ABSTRACT
Rapid environmental changes, competition to provide innovative products and services,
changing customer and investor demands and globalization have become the standard
backdrop for firms. To compete effectively, organizations must constantly improve their
performance by reducing costs, enhancing quality, and differentiating their products and
services. Sustained competitive advantage could be generated from a firm’s human
capital by designing strategic human resource management (SHRM) to diagnose a firm’s
strategic needs which is required to implement a competitive strategy and achieve
operational goals.
This study sought to determine the moderating effect of competitive strategies on SHRM-
performance in Kenya as firms must increase their accesses to markets and knowledge by
reading correctly changes in external market. Specifically, it sought to determine whether
SHRM influences organizational performance, and the moderating effect of cost led,
quality led and innovation led HR strategies on the relationship between SHRM and firm
performance of corporate organizations in Kenya.
The study adopted survey research design and the target population were the corporate
organizations in Kenya in the manufacturing sector. Data was collected using
questionnaires and interviews and analyzed using SPSS and Microsoft Excel. Inferential
data analysis was carried out by the use of factor analysis and correlation analysis.
Regression models were fitted and hypothesis testing carried using multiple regression
analysis and standard F and t tests.

xviii
The findings of this study from the multiple regression analysis indicated that firm
performance was positively influenced by selective resourcing, extensive training,
sharing information and incentives. Correlation analysis results indicated that the use of
teams and decentralization had a strong and positive association with firm performance.
The results of this research also revealed that a cost led HR strategy had no significant
moderating effect on the relationship between SHRM and firm performance of the
manufacturing organizations in Kenya. However, the findings showed that a quality led
HR strategy moderated the relationship between SHRM and firm performance.
Based on the results of this study, it could, therefore, be concluded that SHRM influenced
firm performance of corporate organizations in Kenya, and that this relationship was
moderated by quality led and innovation led HR strategies. The findings of this research
indicating the lack of an interaction term between a cost led HR strategy and SHRM
could be concluded that majority of the manufacturing organizations in Kenya laid more
emphasis on other aspects of their products but not the price and that irrespective of
whether a cost led HR strategy was being pursued or not, the HRM practices remained
significant in influencing firm performance. The study recommends that organizations
should focus on the use of SHRM as its involvement is necessary to ensure that HR
supports its mission. The research also recommends that organizations should diagnose
their strategic needs and develop practical solutions for achieving business goals by
effectively fitting their competitive strategies to the HRM practices present.
1
CHAPTER ONE
1.0 INTRODUCTION
1.1 Background of the Study
Firm performance is positively impacted by the presence of Strategic Human Resource
Management(SHRM) practices which tend to create a significant contribution on
organizational competencies, and this in turn becomes a great boost for further enhancing
innovativeness (Noe et al.2003 ; Youndt et al. 2004). According to Horngren (2000) and
Anantharaman (2003), organizations link the maximization of performance with SHRM
practices. As a result of intensive competition, shorter product life cycles, volatile
product and market environments, firms constantly search for newer sources of
competitive advantage, one of the most important being SHRM,that has the potential to
improve and determine an organization’s fate ( Kelliher & Perrett,2001).
Organizations today have increasingly become aware of the importance of SHRM. This
awareness in a system is a critical dimension in the performance of organizations (Rees,
2006). The real life experiences substantiate the assumption that no matter how
sophisticated and modern the business activities of the organization may become, it will
be extremely difficult to sustain its growth and effectiveness unless there are strategies
that complement its operations.
Business competitiveness is a recurring theme examined by academicians, consultants
and practitioners. The frequent and uncertain changes, greater competition between firms,

2
the need for continuous innovations, quality enhancement and cost reduction force
companies to face the challenge of improving their competitiveness and consequently
their performance. This realization has propelled SHRM as a major field of study and
Wright (2005) asserts that the renewed interest has facilitated the development of newer
approaches in managing organizations and Human Resource (HR).
According to Armstrong (2009), strategic Human Resource Management (HRM)
emphasizes the need for the HR plans and strategies to be formulated within the context
of overall organizational strategies and objectives and to be responsive to the changing
nature of the organization’s external environment. It is an approach which requires
interpretation and adaptation by practitioners to ensure the most suitable fit between HR
business strategies and plans. Thus, the overall themes of SHRM are the integration of all
HRM functions, adherence to broad organization goals and responsiveness to the external
environment (Armstrong, 2009).
There are a number of studies (Appelbaum, 2000; Huselid, 2005; Wright, 2005; Schuler
and Jackson, 2001) focusing on the main competitive factors of business organizations
because of their contribution in the global economy. The quest for competitive advantage
has long been a central tenet of the field of strategic management (Armstrong, 2009).
Within this field, the configurational theory has emerged as a promising new framework
for analyzing the sources and sustainability of competitive advantage. In SHRM, internal
fit and external fit are the two main research streams. Scholars (Iravo et al. 2011;
Njuguna 2008; Purcell, 2002; Storey, 2005) have held that in addition to internal

3
organization characteristics, environmental characteristics also significantly influence
firm performance. External environmental characteristics represent customer demands
and nature of market competition which are important determinants of firm performance.
Corporate organizations in the manufacturing sector in Kenya contribute about 10% of
GDP. In addition, the sector contributes 14% to wage employment in food processing,
beverages, textile, garments, wood processing, furniture and fabricated metal. According
to the Productivity Policy report (2010), the sector’s contribution has stagnated at 10-
12% for the last decade. This stagnation partly stems from concentration on a few
commodities, namely the processing of food commodities and refining of petroleum
products. Further, there’s lack of industrial transformation from these traditional
commodities to machinery and technology products. As highlighted in vision 2030, the
sector faces costly raw materials, rising labour costs and unreliable and expensive energy
and poor infrastructure. UNIDO’s Competitive Industrial Performance Index rankings for
Kenya indicate that the country still lags behind in the ability to produce manufactured
goods competitively. They are also faced with major challenges of constantly improving
their performance by reducing costs, enhancing quality and differentiating their products
and services.
According to Kenya Economic Development report (2004), corporate organizations in
Kenya the sector is among the largest employers in Kenya in addition to the tax
opportunities it presents. According to this report, the economies of most successful
countries in the world originated from their successful business organizations which drive

4
the economy of the country. These organizations need to respond to greater global
imperatives and challenges to compete effectively in local and global markets.
This study focused on the fitness of SHRM and the cost reduction, quality enhancement
and innovation led HR strategies of Kenya’s corporate organizations. To better present
the idea of environmental characteristics, this study adopted competitive strategies as the
research variable since it reflects customer needs and market nature, organizations
generally develop their competitive strategies( cost reduction, quality enhancement and
innovation led HR strategies) based on their understanding of the external market.
The strategic fit between an organization’s HR practices and its choice of competitive
strategy is argued to influence organizational outcomes. Schuler (2001) argued that
SHRM is a better approach for modern business and that the traditional concerns and
orientations of the HR function do not respond adequately to fundamental environmental
challenges particularly in product market conditions under different product market
strategy and thus firms should adjust their HRM approach to facilitate the reaching of
specific goals.
1.2 Statement of the Problem
According to Armstrong and Baron (2004), the practices of SHRM are concerned with
how people are employed and managed in organizations so as to achieve competitive
advantage through the strategic deployment of a highly committed and capable
workforce. Effective HRM strategy systematically organizes all individual HRM
measures to directly influence employee attitude and behavior in a way that leads

5
business to achieve its competitive strategy (Huang, 2001). In view of the fact that the
goals and the necessities of each of the competitive strategy types are different, the
management of HR of the firm should be aligned with the overall corporate strategy. The
firm can thus obtain a competitive advantage and thus achieve superior performance
(Kelliher & Perret, 2001). In most firms today, it is the employees’ skills and
commitment that create competitive advantage for an organization. It is, therefore,
important that organizations truly leverage on the workforce as a competitive weapon to
develop a competitive advantage.
There has been a debate by numerous researchers whether SHRM should always be
positively related to firm performance Although most of the studies speak of SHRM
practices leading to performance, such a one-way line of causation is unsatisfied
(Edwards & Wright, 2001).The usual key critique of SHRM and organizational
performance is that sound theoretical development that explains how such HR practices
operate is absent ((Becker & Gerhart, 1996). In an effort to address such theoretical
developments in this area, researchers have proposed further studies to consider
intermediate linkages between SHRM and organizational performance (Ferris et al.
1998). Accordingly, a better understanding of the role of SHRM in creating and
sustaining organizational performance and competitive advantage should be achieved
through further theoretical development and empirical evidence.
Most studies examining the relationship between SHRM practices and organization’s
performance have been conducted mostly in developed countries like United States and

6
United Kingdom, (Katou and Budhwar, 2006), and that only a few researchers have
measured the mediators and addressed their importance. In addition, the majority of this
work in SHRM according to Paauwe and Boselie (2002) adopts the resource-based view
perspective which tends to ignore contextual variables, particularly competitive
strategies, which influence organizational performance.
According to the Productivity Policy report (2010), the market environment in the
country has been extremely turbulent during the past decade, and to maintain continuous
success in the face of global competition, organizations must identify and analyze
environmental characteristics and develop strategies to meet changing market needs.
Firms should, therefore, increase their accesses to markets and knowledge by reading
correctly changes in external market. Reviews of past studies conducted in Kenya on
organizational performance indicate that the researchers examined other contextual issues
that influenced performance but not competitive HR strategies. Iravo et al. (2011)
investigated the role of conflict management in organizational performance in Kenya.
Njuguna (2008) carried out a study that examined the interactive relationship between
organizational learning, competitive advantage and firm performance in Kenya’s
manufacturing sector. Dimba and K’Obonyo (2009) investigated the moderating role of
employee cultural orientations on the relationship between SHRM practices and firm
performance of manufacturing multinational companies in Kenya. It is against this
background that this study was undertaken to address the research gap, and also provide a
better understanding through empirical evidence of the role of HRM practices and the
7
effect of competitive strategies on SHRM-performance link from a Kenyan context. This
study may, therefore, be valuable to researchers and academicians in providing more
knowledge on contributions of competitive strategies to organization’s performance. The
corporate organizations have a great potential for improvement of quality, profits,
innovation and competitiveness.
1.3 Objectives of the Study
1.3.1 General Objective
This study sought to investigate the effect of competitive strategies on the relationship
between strategic human resource management and firm performance of corporate
organizations in Kenya.
1.3.2 Specific Objectives
1. To determine the influence of strategic human resource management on firm
performance of corporate organizations in Kenya.
2. To establish the moderating effect of a cost led human resource strategy on the
relationship between strategic human resource management and firm performance of
corporate organizations in Kenya.
3. To determine the moderating effect of a quality led human resource strategy on the
relationship between strategic human resource management and firm performance of
corporate organizations in Kenya.

8
4. To establish the moderating effect of an innovation led human resource strategy on
the relationship between strategic human resource management and firm performance
of corporate organizations in Kenya.
1.4 Research Questions
1. How much does strategic human resource management influence firm performance of
corporate organizations in Kenya?
2. Does a cost led human resource strategy moderate the relationship between strategic
human resource management and firm performance of corporate organizations in
Kenya?
3. Does a quality led human resource strategy moderate the relationship between strategic
human resource management and firm performance of corporate organizations in
Kenya?
4. Does an innovation led human resource strategy moderate the relationship between
strategic human resource management and firm performance of corporate organizations
in Kenya?

9
1.5 Hypotheses
A hypothesis is a logical conjectured relationship between two or more variables
expressed in the form of testable statements. The researcher came up with four
hypotheses for this study:
Hypothesis 1:
H01: Strategic human resource management has no significant influence on firm
performance of corporate organizations in Kenya.
Ha1: Strategic human resource management has significant influence on firm
performance of corporate organizations in Kenya.
Hypothesis 2:
H02: A cost led human resource strategy has no significant moderating effect on the
relationship between strategic human resource management and firm performance of
corporate organizations in Kenya.
Ha2: A cost led human resource strategy has significant moderating effect on the
relationship between strategic human resource management and firm performance of
corporate organizations in Kenya.

10
Hypothesis 3:
H03: A quality led human resource strategy has no significant moderating effect on the
relationship between strategic human resource management and firm performance of
corporate organizations in Kenya.
Ha3: A quality led human resource strategy has significant moderating effect on the
relationship between strategic human resource management and firm performance of
corporate organizations in Kenya.
Hypothesis 4:
H04: An innovation led human resource strategy has no significant moderating effect on
the relationship between strategic human resource management and firm performance of
corporate organizations in Kenya.
Ha4: An innovation led human resource strategy has significant moderating effect on the
relationship between strategic human resource management and firm performance of
corporate organizations in Kenya.
1.6 Significance of the Study
The findings of this study that both a quality led and an innovation led HR strategies
influenced firm performance would assist organizations to evaluate the role of
competitive strategies in enhancing organizational performance. Not all corporate
organizations have high growth potential; therefore, research and policy makers seek
potential sources of growth with notions of competitive advantage, competitiveness,
productivity and structural changes. It would also open up new opportunities for

11
increasing the performance of other organizations which have not embraced SHRM. The
study aims at giving an insight into the role of SHRM in enhancing performance of
organizations.
The growth in competition, liberalization of the economy and the environmental changes
put additional challenges to organizations. As such, they need to respond to greater
market imperatives and challenges. There is lack of a theoretically grounded
understanding of the strategies underlying organization’s success or failure in general
(Coplin, 2002). The question posited is how a model can be created to the established
organizations or those entering the market to perform well, succeed or produce a
sustainable competitive advantage.
The findings of this study may be valuable to researchers and academicians in providing
more knowledge on contributions of competitive strategies to organization’s
performance. Theories of SHRM were generated relying on western organizations but not
in all parts of the world (Grant, 2008), and many writings on SHRM describe the
application of competitive strategies mostly in theoretical context in western developed
countries. It is, therefore, important to extend research to different parts of the world.
This study would provide an opportunity for empirically testing the theories in
developing countries, especially in Africa.

12
1.7 Scope of the Study
The study was conducted in 210 corporate organizations registered with the KAM 2011
directory, and distributed across the 12 key industrial subsectors of the manufacturing
sector in Kenya as indicated in the KAM directory.
1.8 Limitations of the Study
Firstly, this study relied on self reported measures of firm performance from the
respondents owing to the difficulty in obtaining public financial data and there were no
formal mechanisms to verify the financial data given as it is held in confidence by the
organizations. It has been demonstrated and reported by researchers (Bamberger and
Meshoulam, 2000; Powell,1992; Dess and Robinson,1984) that self-reporting measures
constitute an acceptable substitute and are equally reliable. Research has also
demonstrated that self-reported firm performance measures are positively related to
objective firm performance measures.
Secondly, this research adopted cross sectional survey design, and research of this nature
would give clearer understanding of the relationship between SHRM, competitive
strategies and firm performance if longitudinal analysis were applied. The findings of this
study indicated that significant interaction existed between the competitive strategies
(quality and innovation led HR strategies) but as Wright et al.(2001) argue, without
conducting a longitudinal study, the performance contribution cannot be ruled out as a
result of causal ambiguity. However, based on numerous empirical supports of previous
studies ( Hartog and Verburg,2004 ; Wan et al.2002; Gratton and Hope,1999; Delery and

13
Doty,1996 ; Schuler and Jackson,1995: Baird and Meshoulam,1988; Schuler and
MacMillan,1984),SHRM positively impacts firm performance, and therefore any
causality that may be argued to arise in this study should be more accepted.

14
CHAPTER TWO
2.0 LITERATURE REVIEW
2.1 Introduction
Firms must compete in a complex and challenging context in the twenty-first century
business landscape that is being transformed by many factors ranging from globalization,
technological advancement, changes in customer tastes and preferences, to rapid
environmental changes. This new landscape requires firms to search for better
competitive approach for modern business as the traditional concerns and orientations of
the HR function do not respond adequately to fundamental environmental changes
particularly in product market conditions. This chapter attempted to integrate SHRM,
competitive strategies and the configurational theory in order to provide a theoretical and
conceptual framework that can be a source of sustainable competitive advantage in the
twenty-first century. It provides an overview of related literature and also looks at related
past studies in this area and the gaps inherent in organizations in terms of SHRM
implementation and their performance.
2.2 Theoretical Framework
In an attempt to explain the relationship between SHRM and firm performance, the
researcher focused on four competing normative theories as debated by numerous
researchers: universalistic, contingency, resource based value and configurational
theories. Universalistic scholars argue that there is a set of superior HRM practices which

15
if adopted by a firm, would lead to enhanced organizational performance. A different
point of view is held by the contingency scholars who argue that there is no universal
prescription of HRM practices; it is all contingent on an organization’s context, culture
and business strategy. Resource based value theory focuses on satisfying the human
capital requirements of the organization. The configurational theory emphasizes on the
importance of achieving both internal and external fit in the organization.
a) Universalistic theory
It is also referred to as the best practice model, which is based on the assumption that
there is a set of superior/best HRM practices, and that adopting them will inevitably lead
to superior organizational performance (Luthans & Summer, 2005). The notion of best
practice was identified initially in the early US models of HRM, many of which mooted
the idea that the adoption of certain ‘best’ human resource practices would result in
enhanced organizational performance, manifested in improved employee attitudes and
behaviors, lower levels of absenteeism and turnover, higher levels of skills and therefore
higher productivity, enhanced quality and efficiency and of course increased profitability
(Marchington & Wilkinson, 2008). Hence, it is argued that all organizations will benefit
and see improvements in organizational performance if they can identify, gain
commitment to and implement a set of best HRM practices. Thus, universalistic
perspective maintains that firms will see performance gains by identifying and
implementing best practice irrespective of the product market situation, industry or
location of the firm (Pfeffer, 2001).

16
There is growing empirical evidence suggesting that people are the pre-eminent
organizational resource and the key to achieving outstanding performance. Progressive
HRM practices’ including selectivity in staffing, training and incentive compensation are
positively related to perceptual measures of organizational performance and has
contributed to performance of firm (Scholes & Johnson, 2007; Stavron & Braster,
2005).The universalistic scholars consider SHRM to positively influence firm
performance and assume that SHRM can help firms improve their HR cost benefits,
promote operating efficiency, increase innovation and revolution ability, and increase
organizational performance benefits (Dyer, 2003). Support for universalistic theory
comes from several other studies. For example, Huselid (2005) notes that all else being
equal, the use of high performance work practices and good internal fit should lead to
positive outcomes for all types of firms. Delery and Doty (2000) find relatively strong
support for the universalistic argument and suggest that some HR practices like profit-
sharing, results-oriented appraisals and employment security always have a positive
effect on performances.
Human resource activities are frequently acknowledged to play a central role in linking
employee capabilities with the performance requirements of a firm. Huselid (2005) in his
research observed that investment in human resource activities such as incentive
compensation, selective staffing techniques and employee participation result in lower
turnover, greater productivity and increased organizational performance through their
impact on employee skill development and motivation. Pfeffer (2001) from his study has
made a case that organizations wishing to succeed in today’s global environment must

17
make appropriate HR investments to acquire and build employees who possess better
skills and capabilities than their competitors. Therefore, one key aspect of the best
practice HRM literature is that the approach is capable of being used in any organization,
irrespective of product market situation, industry and workforce.
However, the notion of a single set of best HRM practices has been overstated. There are
examples in every industry of firms that have very distinctive management practices,
distinctive human resources practices which shape the core competences that determine
how firms compete. What works well in one organization will not necessary work well in
another because it may not fit its strategy, technology or working practices. According to
Becker et al. (2001), organizational high performance work systems are highly
idiosyncratic and must be tailored carefully to each firm’s individual situation and
specific context in order to provide maximum performance. These high performance
work practices will only have a strategic impact therefore, if they are aligned and
integrated with each other and if the total HRM system supports key business priorities.
This approach therefore ignores potentially significant differences between organizations,
industries, sectors and countries.
The idea of best practice might be more appropriate for identifying the choices of
practices as opposed to the practices themselves. The good practices that do well in one
successful environment should not be ignored altogether. Benchmarking is a valuable
way of identifying areas of innovation and development that are practiced to good effect
elsewhere by leading companies. But it is up to the firm to decide what may be relevant

18
in general terms and what lessons can be learnt that can be adopted to fit its particular
strategic and operational requirements.
Lists of best practices vary intensely in their constitution and in their relationship to
organizational performance. This results in confusion about which particular HR
practices constitute high-commitment, and a lack of empirical evidence and theoretical
rigour (Guest, 2001) to support their universal application. Capelli and Crocker-Hefter
(2000) argue that it is distinctive HR practices that help create unique competencies that
differentiate products and in turn drive competencies.
b) Contingency theory
For the contingency theory, otherwise known as best fit HRM, there are no universal
prescription of HR policies and practices. It is all contingent on the organization’s
context, culture and its business strategy (Wright & Snell, 2005). Contingency scholars
have argued that HR strategy would be more effective only when appropriately integrated
with a specific organizational and environmental context. The best fit theory emphasizes
the importance of ensuring that HR strategies are appropriate to the circumstances of the
organization, including the culture, operational processes and external environment. HR
strategies have to take account of the particular needs of both the organization and its
people. It explores the close link between strategic management and HRM by assessing
the extent to which there is vertical integration between an organization’s business
strategy and its HRM policies and practices (Schuler & Jackson, 1987; Dyer, 2005;
Mahoney & Decktop, 2006).
19
Wright, McMahan and McWilliams (2004) state that vertical integration between
business strategies or the objective of the business and individual behavior and ultimately
individual, team and organizational performance is at the fore of core models of SHRM.
Inherent in most treatments of fit is the premise that organizations are more efficient
and/or effective when they achieve fit relative to when a lack of fit exists (Legge, 2005).
This vertical integration or ‘fit’ where ‘leverage’ is gained through procedures, policies
and processes is widely acknowledged to be a crucial part of any strategic approach to the
management of people (Dyer, 2005).The best fit therefore ensures an explicit link or
relationship between internal people processes and policies and the external market in
business strategy, and thereby ensures that competences are created which have a
potential to be a key source of competitive advantage (Wright, Gardner & Allen, 2005).
According to the contingency approach, SHRM is not the ultimate factor that contributes
to improved firm performance; it has to be integrated with other factors and the impact of
HR practices in firm performance is conditioned by an organization’s strategic posture. A
firm’s approach to competition depends on, or makes use of the talents and capabilities of
employees, then HR practices would be more likely to have an impact on performance;
otherwise the connection between HR and performance might be minimal.
One criticism often leveled at the contingency model is that it tends to over-simplify
organizational reality. In attempting to relate one dominant variable to the organization
(for example, compete on innovation, quality or cost) to another internal variable, they
tend to assume a linear, non-problematic relationship.

20
According to Purcell (2001), this theory is limited by the impossibility of modeling all
the contingent variables, the difficult of showing their interconnection, and the way in
which changes in one variable have an impact on others. Boxall and Purcell (2003)
further emphasize the complexity of matching HR and business strategy by stating the
need to keep up with ongoing environmental change. They bring attention to a model by
Wright (2005) asserting that SHRM should simultaneously promote fit and flexibility to
cope with the future. However, responding to those external demands may undermine the
possibility of achieving internal fit (Legge, 2005). Models of external fit fail to recognize
the needs of employees. More evident in highly competitive markets, businesses cannot
survive without balancing the pressures from social norms, labour laws and critical
employee interests. Conclusively, an alignment of business and employee needs is
needed. The best fit school also lacks emphasis on the internal context of individual
businesses within the same sector and the unique characteristics and practices that may
provide its main source of sustainable competitive advantage.
c) Resource based value theory
This theory suggests that HR practices can directly influence firm performance. It
stresses that the basis of competitive advantage is on the valuable resources and
competencies the firm possesses. To sustain a competitive advantage, an organization
uses its own resources and capabilities, incapable of being rapidly developed elsewhere
and firmly attached to the organization that deploys or uses them. In today’s competitive
environment, to sustain a competitive advantage, firms need to provide value to

21
customers. This value can either be cost advantage, services or differentiated strategies.
Resource based value theory focuses on the relationship between a firm’s internal
resource stability and the ability to stay competitive through its strategy formulation
(Delery & Doty, 2000).
Proponents of the resource-based view of the firm (Penrose, 1959; Wernerfelt, 1984;
Amit and Shoemaker, 1993) argue that it is the range and manipulation of an
organization’s resources, including HR, that give an organization its uniqueness and
source of sustainable advantage. People posses skills, knowledge and abilities that
provide economic value to firms-since firm investments to increase employee skills,
knowledge and abilities carry both out-of-pocket and opportunity costs, they are only
justified if they produce future returns via increased productivity. The higher the potential
for employee contribution in a firm, the more likely it is that the firm will invest in
human capital via HRM activities, and that these investments will lead to higher
individual productivity and firm performance (Becker et al. 2001).
According to Hamel and Prahad (1998), the firm is an administrative organ and a
collection of product resources. Competitive advantage is obtained if a firm can develop
HR that enables it to learn faster and apply its learning more effectively than its rivals.
Sustained competitive advantage stems from the acquisition and effective use of bundles
of distinctive resources that competitors cannot imitate. The value and the HR policies of
an organization constitute an important non-imitable resource (Purcell, 2003) which is
achieved by ensuring that the firm has high skilled people than its competitors.

22
The aim of a resource-based approach is to improve resource capability by achieving
strategic fit between resources and opportunities and obtaining added value from
effective development of resources. In line with human capital theory, this theory
emphasizes that investment in people adds value to the firm. It can develop strategic
capability and produce human resource advantage (Boxall & Purcell, 2003). According to
the resource-based view, the firm could develop sustained competitive advantage through
creating value in a manner that is rare and difficult for competitors to imitate. Traditional
sources of competitive advantage such as natural resources, technology and economics of
scale have become increasingly easy to imitate (Barney, 2001). HR is an invisible asset
that creates value when it is embedded in the operational system in a manner that
enhances firm ability to deal with a turbulent environment.
Recent theoretical works in business strategy have indicated that a firm’s competitive
advantage could be generated from a firms HR. According to Boxall and Purcell (2003),
the work of the proponents of the resource based value theory has resulted in interest in
this perspective, particularly in seeking ways to build and develop unique bundles of HR
and technical resources that will lead to enhanced organizational performance and
sustainable competitive advantage. However, this theory focuses on the internal resources
of the organization rather than analyzing performance in terms of the external context.
d) Configurational theory
A strategy’s success turns on combining external fit and internal fit. A firm with bundles
of HR practices should have a high level of performance, provided it also achieves high

23
levels of fit with its competitive strategy (Richard & Thompson, 1999). Emphasis is
given to the importance of bundling SHRM practices and competitive strategy so that
they are interrelated and therefore complement and reinforce each other. Implicit in is the
idea that practices within bundles are interrelated and internally consistent, and has an
impact on performance because of multiple practices. Employee performance is a
function of both ability and motivation. Thus; there are several ways in which employees
can acquire needed skills (such as careful selection and training) and multiple incentives
to enhance motivation (different forms of financial and non-financial rewards.)
A key theme that emerges in relation to best-practice HRM is that individual practices
cannot be implemented effectively in isolation (Storey, 2007) but rather combining them
into integrated and complementary bundles is crucial. MacDuffie (2005) argues that a
‘bundle’ creates the multiple, reinforcing conditions that support employee motivation,
given that employees have the necessary knowledge and skills to perform their work
effectively (Stavrou & Brewster, 2005). In the configuration school, cohesion is thought
likely to create synergistic benefits which in turn enable the organization’s strategic goals
to be met.
The aim of bundling is to achieve coherence which exists when a mutually reinforcing set
of HR practices have been developed that jointly contribute to the attainment of the
organization’s strategies for matching resources to organization needs, improving
performance and quality and achieving competitive advantage in commercial enterprises.
The approach of bundling is holistic as it is concerned with the organization as a total

24
entity and addresses what needs to be done as a whole in order to enable it to achieve its
corporate strategic objectives.
The notion of a link between business strategy and the performance of every individual in
the organization is central to ‘fit’ or vertical integration. Internal fit advocates bundles of
practice, to ensure that organizations gain benefits from implementing a number of
complementary practices rather than only a single practice (MacDuffie, 2005).Most
models of best fit focus on ways to achieve external fit. The most influential model of
external fit is that from Schuler and Jackson (1987) which argues that business
performance will improve if their HR practices support their choice of competitive
strategy: cost leadership, quality enhancement and innovation. Under this model,
organizations need to work out the required employee behaviors to implement a chosen
competitive strategy and devise supporting HR practices to enable those behaviors to be
encouraged in the workforce. Vertical integration can be explicitly demonstrated through
the linking of a business goal to individual objective setting, to the measurement and
rewarding of attainment of that business goal.
Schuler and Jackson (1987) defined the appropriate HR policies and practices to ‘fit’ the
generic strategies of cost reduction, quality enhancement and innovation. The significant
difference between the contingency and configurational approach is that these
configurations represent non-linear synergistic effects and high-order interactions that
can result in maximum performance (Delery & Doty, 2000).

25
Wilkinson (2002) note that the key point about configurational perspective is that it seeks
to derive an internally consistent set of HR practices that maximize horizontal integration
and then link these to alternative strategic configurations in order to maximize vertical
integration and therefore organizational performance. Thus put simply, SHRM according
to configuration theorists requires an organization to develop a HR system that achieves
both horizontal and vertical integration. The configuration approach contributes to the
SHRM debate in recognizing the need for organizations to achieve both vertical and
horizontal fit through their HR practices, so as to contribute to an organization’s
competitive advantage and therefore be deemed strategic. The use of performance
management practices and competency frameworks are typically adopted to provide for
coherence across a range of HR activities.
2.3 Conceptual framework
A conceptual framework is the diagrammatic presentation of variables, showing the
relationship between the independent variable, moderating variables and the dependent
variables. The configurational theory guided the development of the conceptual
framework of this study that that was diagrammatically presented. Strategic HRM was
the independent variable in this study, whereas firm performance was the dependent
variable. A moderating variable has a strong contingent effect on the independent-
dependent variable relationship. The competitive strategies of cost led HR strategy,
quality led HR strategy and innovation led HR strategies were expected to moderate the
relationship between SHRM and firm performance in this study (see Figure 2.1).

26
Independent variable Dependent variable
Moderating variables
Figure 2.1: Conceptual Framework on SHRM, Competitive Strategies and Firm
Performance
(Adopted from Ahmad and Schroeder, 2003; Schuler and Jackson, 1987)
Strategic HRM
.selective resourcing
.teams and
decentralization
.extensive training
.sharing information
.incentives
.
‘’’’’
Firm performance
.profitability
.sales growth
Competitive strategies
.Cost led HR strategy
.Quality led HR strategy
.Innovation led HR strategy
27
2.4 Review of Related Theoretical Literature
2.4.1 Strategic HRM
According to Werbel and DeMarie (2005), HRM practices create procedures that
constitute the building of employees’ knowledge and skills throughout the organization to
promote valued and unique organizational competencies which support competitive
advantage. SHRM is a new paradigm in managing HR in the modern organization which
is hinged on the understanding that the most critical resource that any organization must
provide itself of is HR, since it is the HR that is responsible for coordinating other factors
of production to spur corporate performance. Schuler et al.(2001) described the evolution
of SHRM from personnel management in terms of a two-phased transformation, first
from personnel management to traditional HRM (THRM), and then from THRM to
SHRM. To improve firm performance and create competitive advantage, a firm’s HR
must focus on a new set of priorities which are more business and strategic oriented and
less oriented to traditional HR functions such as staffing, training, appraisal and
compensation. Strategic priorities include team-based job designs, flexible workforces,
quality improvement practices, employee empowerment and incentive compensation.
Strategic HRM aims to achieve strategic fit. It produces HR strategies that are integrated
vertically with the business strategy and are ideally an integral part of that strategy.
Vertical integration is necessary to provide congruence between business and HR
strategy so that the latter supports the accomplishment of the business strategy and helps
to define it. SHRM is also about horizontal integration which aims to ensure that the

28
different elements of the HR strategy fit together and are mutually supportive
(Armstrong, 2008). It enables strategic decisions to be made that have a major and long-
term impact on the behavior and success of the organization by ensuring that the
organization has the skilled, committed and well-motivated employees it needs to achieve
competitive advantage.
Cooke et al. (2005) asserted that SHRM is an efficient function that copes with
environmental changes. It directly and indirectly benefits companies because it changes
passivity into initiative, transmits organizational goals clearly and encourages the
involvement of line managers. Marchington (2008) argue that SHRM positively
influences firm performance because it generates structural cohesion, an employee-
generated synergy that propels a company forward, enabling the firm to respond to its
environment while still moving forward. Cooke et al. (2005) investigated the HRM
practices of firms in declining industries. They found that most high performance firms
adopted SHRM measures. Conversely, low performance firms tended to employ
conventional methods. Various researchers (Appelbaum et al. 2000; Guest et al. 2000;
West et al. 2002; Purcell et al. 2007) have found a positive relation between HRM
practices and firm financial performance. They found that the strategic orientation of HR
in high productivity firms differed obviously from that in low productivity firms.
Developments in SHRM thinking are thus explored through the best-fit, best-practice and
configurational approaches which have a profound impact in the understanding of the
contribution SHRM can enhance organizational performance, through increased

29
competitive advantage and added value. Indeed, it becomes clear that whether the focus
of SHRM is on alignment with the external context or on the internal context of the firm,
the meaning of SHRM can only be really understood in the context of organizational
performance, whether that be in terms of economic value added and increased
shareholder value; customer value added and increased market share or people added
value through increased employee commitment and reservoirs of employee skills,
knowledge and talent. According to Guest (2001), theoretical research shows that SHRM
practices are not standardized and as such researchers tend to select a set of SHRM
practices depending on the theoretical perspective used. Regarding which HR practices
are relevant, the literature often focuses on bundles of HR practices as determinants of
firm performance (Lepak et al. 2005). The distinctive HRM practices for this study was
adopted from the study by Ahmad and Schroeder (2003) and included: selective
resourcing, extensive training, use of teams and decentralization, sharing information and
incentives on performance.
2.4.2 Competitive strategies
Competitive advantage model argues that employers have three basic strategic options in
order to gain competitive advantages: cost reduction, quality enhancement, innovation
(Schuler & Jackson, 1987). Among the key business issues that may impact on HR
strategies include proposals on increasing competitive advantage through innovation
leading to product/service differentiation, productivity gains, improved quality and cost
reduction (Armstrong, 2009). Business strategies may be influenced by HR strategies
which are concerned with making business strategies work. Wright and Snell (2005)

30
suggest that seeking fit requires knowledge of the HRM practices necessary to elicit those
skills and behavior, and the ability to quickly implement the desired system of HRM
practices.
The competitive strategies tend to apply Porter’s (1985) ideas on strategic choice. Porter
identified three key basis of competitive advantage: cost leadership, differentiation
through quality and service and focus on ‘niche’ markets. Schuler and Jackson (1987)
used this as their model of SHRM where they defined the appropriate HR practices and
policies to fit the generic strategies of cost reduction, quality enhancement and
innovation. They argued that business performance will improve when HR practices
mutually reinforce the organization’s choice of competitive strategy. Thus, in Schuler and
Jackson’s model, the organization’s mission and values are expressed through their
desired competitive strategy. This in turn leads to a set of required employee behaviors,
which would be reinforced by an appropriate set of HR practices. The outcome of this
would be desired employee behavior that is aligned with the corporate goals, thus
demonstrating the achievement of vertical integration.
Recent conceptual work has argued that complementaries or synergies, both among a
firm’s SHRM practices and between a firm’s SHRM practices and its competitive
strategy, can have an additional and positive effect in a firm’s performance (Marchington
& Wilkinson, 2008). Thus a firm’s performance may not be directly linked to SHRM.
The study used the strategic typology by Schuler and Jackson (1987) which they derived
from Porter’s (1985) model. The typology has three types of strategy: cost-reduction led

31
HR strategy, quality-enhancement led HR strategy and innovation led HR strategy. All
these three strategies can be deemed ‘strategic’ in linking HR policies and practices to the
goals of the business and the external context of the firm.
a) Cost led HR strategy
Business success built on cost reduction led HR strategy requires the business to be able
to provide its product or service at a cost below what its competitors can achieve. And it
must be sustainable cost advantage (Robinson et al. 2008). The cost reduction employer
seeks to produce goods and services cheaper than the competition, with no frills and an
emphasis on minimizing costs at all stages in the process -including people management.
The firm thus sets to become low cost producer in its industry. The firm has a broad
scope and serves many industry segments, and may even operate on many industries. The
sources of cost advantage are varied and depend on the structure of the industry. If a firm
can achieve and sustain overall cost leadership, then it will be an above-average
performer in its industry provided it can command prices at or near the industry average.
At equivalent or lower prices than its rivals, a cost leader’s low-cost position translates to
higher returns (Marchington et al. 2005).
Low cost producers usually excel at cost reductions and efficiencies. They maximize
economies of scale, implement cost-cutting technologies, stress reductions in overhead
and in administrative expenses, and use volume sales techniques to propel themselves up
in the earning curve (Storey et al. 2000). A low cost leader is therefore able to use its cost
advantage to charge lower prices, or to enjoy higher profit margins. By so doing, the firm

32
effectively can defend itself in price wars, attack competitors on price to gain market
share, or if already dominant in the industry, simply benefit from exceptional returns.
The essence of an organization’s competitive strategy to be a low cost leader will use
various HR strategies to support its low cost strategy. Therefore, the HR implications for
the cost reduction led HR strategy, according to Storey and Sisson (2000); Kelliher and
Perrett (2001) are: recruitment and selection is likely to be ad hoc, especially for low-
grade tasks, and the employer may well use agencies or subcontractors to perform much
of the work. Training is likely to be poor or non-existent, with no recognition that
employees should be provided with opportunities for learning and development. Pay
levels are unlikely to be much above the minimum wage, and could be less if the
employer can get away with it, and this may be typical of firms who use migrant labour
and provide very basic conditions all around. There are likely to be minimum health and
safety standards, tight performance monitoring, limited employee involvement and
communications, and little empathy with staff experiencing problems. It is evident that
the cost reduction led HR strategy is likely to focus in the delivery of efficiency through
mainly hard HR techniques. The cost reduction led HR strategy therefore stresses
efficient scales, minimizing expenses and supplying a standard for reducing costs to
support the organization’s low cost strategy.
b) Quality led HR strategy
The quality enhancement led HR strategy refers to the production or delivery of the
highest possible quality of goods and services. Quality is a significant aspect of the total

33
process (Miller et al. 2001). Continuous quality improvement is a philosophy and attitude
for analyzing capabilities and processes and improving them repeatedly to achieve the
objective of customer satisfaction. It is an ongoing improvement of products, services or
processes through incremental and breakthrough improvements (Schuler, 2001). Quality
enhancement strategy is a model for reducing defects in a system that affects an output of
quality.
According to Marchington and Wilkinson (2008), a firm adopting the quality
enhancement led HR strategy operates with a set of HR practices that are the exact
opposite of the cost reducer because the goal is to produce goods and services of the
highest quality possible to differentiate itself from the competition. HRM in this situation
is likely to resonate with the best practice model. This includes: systematic recruitment,
selection and induction, empowerment and high discretion jobs, extensive and continuous
training and development, work-life balance, highly competitive pay and benefits
packages and a key role for performance appraisal. The HR function is likely to be well
staffed and be highly proactive in helping to shape organizational cultures and change
programmes. Close cooperation between HR and line managers is likely to improve the
chances that intended HR policies and are implemented in accordance with expectations.
Many large organizations are likely to aspire to this strategy, and offer this sort of
employment package, if only to attract and retain key staff at times of labour market
shortage. Some organizations are able to maintain a quality enhancement approach for
the staff they employ through a process of differentiation and tightly specified business
34
contracts on suppliers that gives the latter little option but to impose inferior terms and
conditions on their workers (Marchington et al. 2005). Thus, quality strategy focus on
continually improving a firm’s processes to increase product reliability and customer
satisfaction. In such a strategic context, output is more sensitive to variations in human
skills, knowledge and attitudes and to mental effort rather than physical effort. Skill
acquisition and development lie at the heart of a successful quality strategy.
c) Innovation led HR strategy
Innovation is a grand strategy that seeks to reap the premium margins associated with
creation and customer acceptance of a new product or service. It is the initial
commercialization of invention by producing and selling a new product, service, or
process. Innovation is turning ideas into profits (Robinson et al. 2008). Miller et al.
(2001) refers to innovation strategy as the design and production of complex and rapidly
changing products or services that differ from those of competitors.
The innovation led HR strategy category of the Schuler framework is likely to be the
least widespread of the three strategies. Under this strategy, it is assumed that groups of
highly trained specialists work closely together to design and produce complex and
rapidly changing/adaptable products and services. The consequences for HR policy are
similar in many respects to the quality enhancement strategy but there is much greater
emphasis on informality, problem-solving groups, a commitment to broadly defined
goals, and flexibility. In innovative organizations, people are typically the major source

35
of value creation, and knowing how to manage HRM in these situations is a complex
issue (Frenkel, 2006).
Introducing a significant technological innovation can allow a firm to lower cost and
enhance differentiation at the same time, and perhaps achieve both strategies. In many
industries, it has become increasingly risky not to innovate. Both consumer and industrial
markets have come to expect periodic changes and improvements in the products offered.
As a result, some firms find it profitable to make innovation their grand strategy. They
seek to reap the initially high profits associated with customer acceptance of a new or
greatly improved product. Then, rather than face stiffening competition as the basis of
profitability shifts from innovation to production or marketing competence, they search
for other original or novel ideas (Robinson et al. 2008). Examples are: use cutting edge
production technology and product features to maintain a distinct image and actual
product, develop programs to ensure technical competence of sales staff and a marketing
orientation of service personnel and develop comprehensive, personalized database to
build knowledge of groups of customers and individual buyers to be used in
‘customizing’ how products are sold, serviced and replaced. When the firm’s strengths
are in creative product design or unique production technologies, sales can be stimulated
by accelerating perceived obsolescence. It therefore requires that the business has
sustainable advantages that allow it to provide buyers with something uniquely valuable
to them. The underlying rationale of innovation strategy is to create a new product life
cycle thereby make similar existing products obsolete.

36
2.4.3 Firm Performance
The measurement of organizational performance is not easy for business organizations
with multiple objectives of profitability, employee satisfaction, productivity, growth,
social responsibility and ability to adapt to the ever changing environment among other
objectives. Although performance has been traditionally conceptualized in terms of
financial measures, some scholars have proposed a broader performance construct that
incorporates non-financial measures including among others market share, product
quality, and company image.
Extant research findings have shown that perceived measures of performance can be a
reasonable substitute of objective measures of performance (Wan-Jing and Tung, 2005)
and have a significant correlation with objective measures of financial performance.
Additionally, cross-industry organizational performance is influenced by external
economic factors (Bamberger and Meshoulam, 2000), hence subjective evaluations may
be even more appropriate than objective measures in this study. Studies by Youndt et al.
(1996) recognize the difficulty in obtaining objective measures of performance and
suggest asking managers to assess their own firm’s performance relative to others in the
same industry or sector. To minimize the effects of random errors, researchers have
suggested the use of multiple items to assess performance. Given this scenario, the
researcher in this study opted to use multiple items in order to assess the performance of
the organizations that were studied. These items related to profitability and sales growth.

37
2.5 Empirical Review
Guest et al. (2000) analyzed data on links between SHRM/employment relations and
performance. The broad theoretical framework guiding the analysis constituted a path
model linking together business and HR strategies on one hand and performance
outcomes on the other. The latter included measures like financial performance, quality
and productivity. The overall framework was glued together by a number of HR practices
such as recruitment and selection, training and development, pay and rewards and HR
function. A key finding was that a large proportion of organizations used a wide range of
the HR practices outlined, and thus had an influence on the performance.
Some research undertaken on Spanish firms by Sanz-valle et al. (2000) provides support
for the link between cost reductions, quality enhancement and innovation led HR
strategies and the HR practices that were used. For example, cost reducers tended to
provide lower levels of training, team working and pay than the other categories, whereas
the innovators were more inclined to invest in teamwork, make more use of internal labor
markets and pay higher rates (Sanz-Valle et al. 2000).
Research by West et al. (2002) investigating the links between specific HR business
strategies and performance found that particular HR strategies had a very strong influence
on performance. One of the measures of performance in that study included financial
outcomes. The analysis revealed a strong relationship between HRM practices and
performance. Roche (1999) in his study on Irish organizations noted that organizations

38
with a relatively high degree of integration of HR strategy into business strategy are
much more likely to adopt commitment-oriented bundles of HRM practices.
Results from a research conducted on Taiwanese firms by Wan-Jing and Tung (2005)
failed to support the universalistic perspective. Only the interaction between an
innovative led HR strategy and SHRM exerted a significant effect on firm performance,
supporting the argument of the moderating effect of competitive strategies.
Wright et al. (2005) carried out a study and found that organizations exhibited higher
performance when they recruited and acquired employees possessing competencies
consistent with the organization’s current strategies. They also found that organizations
exhibited higher performance when they sought out a strategy that matched their current
employees’ competencies, meaning that besides SHRM, other strategies have to be
embraced with it to enhance firm performance. This study confirmed a relationship
between SHRM and performance but supported the view that this is iterative because HR
strategies and practices tend to be fairly unchanging over time and could therefore be
linked both to past and future performance.
A study done by Ernest (2003) using objective and subjective performance measures and
cross-sectional and longitudinal data confirmed an association between SHRM and
performance. This implies then that unless SHRM works in association with other
strategies, then a firm may not register enhanced performance for embracing SHRM.
A study by Dyer and Reeves (1995) of various models listing HR practices which create
a link between HRM and business performance found that the activities appearing in

39
most of the models were involvement, careful selection, extensive training and contingent
pay. These were bundled with the business strategy adopted by the firm.
2.6 Critique of the Existing Literature Relevant to the Study
A review of the literature linking HR practices to business strategy shows conflicting
perspectives in SHRM. The universalistic perspective suggests that there is a universal
set of best practices that any business can adopt to improve organizational performance.
Conversely, the contingency perspective suggests that business performance improves
when there is fit between business strategy and HR policies. Redman (2006) identifies
both methodological and theoretical problems with the universalistic approach.
Methodologically, the degree and direction of causation can be questioned. Adopting best
practice may just be of one the several factors that improve business performance.
Furthermore, it may only be successful firms who can afford to adopt these practices thus
reversing the perceived direction of causation.
Research suggests that best practices models are only seen in higher value added sectors.
A lot of businesses have proven to be successful without using best practices, as
confirmed by Wood and DeMenezes (2005).From a theoretical position, the wide range
of models and lists of best practices creates a problem. It is the unique context of each
business that matters when developing a HR strategy. In addition, the intention of best
practice should benefit both shareholders and workers. But as with most models of best
practice, there is little reference to the role of unions or the differing and objectives each
group has in the workforce. For example, Marchington and Grugulis (2000) suggest that

40
Pfeffer (2001) takes a unitary view and doesn’t take into account the complexities of
managing a diverse and differentiated workforce. The best practice approaches are also
not culturally sensitive. Models that tend to reflect the individualist values of the USA
will not be suitable for more collectivist cultures such as Germany or Japan. National
context and the differing labour laws of each country play a fundamental role in SHRM.
This severely implicates the usefulness of best practice model.
Boxall and Purcell (2003) make a valid point about the notion of internal fit. It tends to be
discussed in such a way that over-simplifies the paradoxical elements in managing
people. This can also apply to external fit because business strategies are rarely straight
forward; the reality of business is complicated and often unpredictable. The simplistic
models of matching HRM and strategies imply a top down deterministic strategy
planning process. But in reality, many strategies tend to evolve from the input of
numerous stakeholders as a multi-level, multi-stage, incremental and political process
(Legge, 2005). Moreover, many businesses take/avoid a unified strategy as they operate
in many different business or geographic markets with a different strategy for each
market. This makes it difficult to match HRM with one particular competitive strategy.
This criticism is partly answered by the configurational theory, which recognizes the
prevalence of hybrid strategies and the need for HR to respond accordingly.
Purcell (2003) points out the inconsistency between a belief in best practice and the
resource based view which focuses on the intangible assets, including HR, which allows
the firms to do better than its competitors. He questions how the universalism of best

41
practices can be squared with the view that only some resources and routines are
important and valuable by being rare and perfectly imitable. The danger is that of
mechanistically matching strategy with HRM policies and practices.
Taking the changing external environment into consideration, Redman (2006) questions
whether firms can actually keep changing their HR policies to match the market situation.
The bounded rationality of managers clearly limits the number of contingencies they can
identify when assessing the market situation. This can often lead to an inappropriate
selection of HR policies which would be disadvantageous to the business. Another issue
is what happens to HRM when two quite different types of firms merge or is acquired
through a hostile takeover (Edwards & Rees, 2006). Applying the best fit models is
difficult in such circumstances without a consideration of other factors, and in the period
following the change of ownership, there is often so much turbulence in the system that it
is hard to identify a dominant HR style.
Criticisms such as the above indicate that it is not sufficient to focus on one particular
factor -say, competitive strategy and ignore the effect of others in shaping HR practice.
This is not to say that contingency and universalistic approaches are unimportant, but that
the principal factors may vary in importance over time. Additionally, it is the mix of
factors that is important. On the other hand, these models are useful if they are used as a
tool for guidance rather than a prescriptive technique. First, each model attempts to
predict appropriate HR strategies from an analysis of business strategies. At the polar
extremes, this may fit quite well. It is easy to see how the HR activities of new firms can

42
be aligned with start up or innovation business strategies. In short, it causes us to question
the assertion that all employers should adopt ‘best practice’ HRM policies irrespective of
their business strategies. Secondly, these kinds of analysis should encourage HR
practitioners to think more carefully about how HRM relates to organizational
characteristics and how they can contribute to business goals. The case for a new HR
initiative might have a better chance of success if it is seen to ‘fit’ with wider
organizational strategy and can be justified through a business case, albeit one that also
takes into account employee needs (Boxall & Purcell, 2008).
2.7 Research Gaps
Studies by universalistic scholars have argued a direct linkage between SHRM and firm
performance. Contingency scholars argue that SHRM does not lead directly to firm
performance but is influenced by contingencies among them competitive strategies,
which ultimately influence performance. Hence, the focus has mainly been limited to the
linkage between SHRM and organizational performance. In this regard, the universalistic
perspective posits the best practice bundle of HR practices. This is a concern because it
seems unlikely that one set of SHRM practices will work equally well no matter what
context and strategy. Consequently, there is need for additional robust and quantitative
evidence to support the SHRM performance link and investigations from different
contexts with different strategies.
Literature reviewed has revealed that most studies examining the relationship between
SHRM and organization’s performance have been conducted mostly in a few developed

43
countries like US and UK, and that only a few researchers have measured the mediators
and addressed their importance. The question still left unanswered is the influence of
competitive strategies on SHRM and consequently organizational performance. To fill
this gap and to further examine the existence of such a relationship, it is important to
conduct research in developing countries specifically in Kenya.
Majority of work in SHRM adopts the resource based view perspective which
emphasizes the gaining of competitive advantage by means of utilization of the resources
of the organization through the employees. However, HRM studies based on resource
based value theory tend to ignore contextual and strategic variables which moderate
SHRM-firm performance relationship. Central to this study is an attempt to determine if
competitive strategies moderate the relationship between SHRM and performance of
Kenya’s corporate organizations, and consequently to their success.
There is also a need to question the veracity of the link between HRM and performance.
Analysis of data relating to the question of a link between SHRM and performance
reveals there is uncertainty as to the direction of the link. Guest et al. (2003) study
confirms an association between SHRM and performance but fails to show a causal
relationship between SHRM and performance. Purcell et al. (2003) have noted that while
some of the studies have been able to show an association between SHRM, competitive
strategies and firm performance, they have not clearly explained when, why and how this
association existed and to identify the inter-connections.

44
Much of the research on SHRM and performance places an emphasis or assumes that
each organization is pursuing an integrated set of business objectives and HR practices.
This is in contrast with recent developments as firstly; it is seemingly at odds with the
move towards more flexible internal structures and strategies, such as strategic alliances,
business networks, joint ventures and linkages. Secondly, the approach does not also
consider the trend towards outsourcing and inter-organizational contracting and the
influence of multi employers and customers in the shaping of performance. The
researchers’ discussion about organizational performance is conducted as though
organizations are homogeneous entities with clearly defined boundaries and similar
contexts and characteristics. Hence the need to extend research in Kenya’s organizations
given the increasing importance of SHRM in creating firm competitive advantage.
Addressing these research gaps can help more researchers beyond overly simplistic
models of SHRM towards a much fuller understanding of the role of SHRM in
organizations.
2.8 Summary
This chapter reviewed the relevant literature and the considerable discussion and
deconstruction of SHRM, various elements of competitive strategies and the links
between these elements. The researcher examined the way in which HR policies and
practices may be used to provide coherent and comprehensive HR bundles. This led to
suggestions that there is a way in which HRM should be delivered and moreover that this
has a positive impact on organizational performance. Review examining how HR
strategies can be aligned with wider organizational goals was also been examined. Best
45
fit HRM is the idea that HR practice should and does vary between organizations
depending on business strategy or product market circumstances. This approach is useful
not only for countering the more simplistic versions to reflect organizational reality-at
least at a broad level. The approaches view HR as having an important role in supporting
organizational strategy and still play an important role in developing SHRM. Generic HR
processes can benefit from best practice theories while best fit should be applied when
context matters to align management and employee interests. Competitive strategies are
deemed strategic in linking HR policies and practices to the goals of the business and the
external context of the firm, and are therefore contributing in different ways to
performance. Increasingly, many firms are pursuing competitive strategies aimed at cost
reduction, quality improvement and innovation with the goal of gaining competitive
advantage through HR. Conclusively, the contribution that SHRM may make to an
organization’s performance and effectiveness is closely linked to the changes in different
business environment including macro and micro contexts, thus the bundling of these
practices with the competitive strategy of the firm.

46
CHAPTER THREE
3.0 RESEARCH METHODOLOGY
3.1 Introduction
This chapter presents a systematic description of the methodology used to conduct the
research. It comprises sections on research design, population, sampling frame, sample
and sampling technique,instruments,data collection procedure, pilot test, data processing
and measurement variables.
3.2 Research Design
A research design is a framework that guides the collection and analysis of the data and is
a detailed plan for how research study is conducted according to the data required in
order to investigate the research questions in an economical manner. It is a presentation
of the plan, the structure and strategy of investigation, which seeks to obtain or answer
various questions.
The study adopted survey research design using both quantitative and qualitative
approaches. Quantitative approach emphasizes measurement and data is analyzed in a
numerical form to give precise description. According to Mugenda and Mugenda (2003),
quantitative approach also known as the scientific method has traditionally been
considered as the traditional mode of inquiry in both research and evaluation. That this
mode of inquiry follows several logical and distinct steps from identifying and stating
research problem to making appropriate conclusions and inferences to the population.

47
Quantitative approach places emphasis on methodology, procedure and statistical
measures to test hypothesis and make predictions. According to Berg (2001), qualitative
research helps in analyzing information in a systematic way in order to come to some
useful conclusions and recommendations on the social settings and the individuals who
portray those characteristics.
The research adopted quantitative approach because the data collected through
questionnaires from respondents was analyzable using the standard statistical tools.
Quantitative research approach includes designs, techniques and measures that produce
numerical or quantifiable data. It relies on the principles of verifiability, that is,
confirmation, prove, or substantiation, using appropriate measurement of study variables.
Qualitative approach was also o adopted by the in this study because qualitative data is
more in depth and provides detailed answers. It provides information about the
phenomenon being studied, and established patterns, trends and relationships from the
information gathered. The qualitative research provides greater depth to response and
understanding which forms a link with the respondents. Qualitative research is typically
rich with detail and insights into participants ‘experiences of the world and thus more
meaningful .It helps in gaining new perspectives on things about which much is already
known (Hoepfl,1997).
Corbetta (2003) describes survey research design as a technique of gathering information
by questioning those individuals who are the object of the research and belonging to a
representative sample, through a standardized questioning procedure with the aim of

48
studying the relationship among the variables. A survey is a scientific investigation which
entails the study of a sample drawn from the population of interest through probability
sampling procedures. According to Mugenda and Mugenda (2003), a survey has the
strength of measurements being taken at a point in time and of creating room for
exploratory and descriptive data which will be essential in understanding the moderating
effects of competitive strategies on performance.
Surveys are an efficient way of obtaining information about peoples’ thoughts, opinions
and feelings. According to Kothari (2007), surveys are conducted in case of descriptive
research and are concerned with describing, recording, analyzing and interpreting
conditions that either exist or existed. Surveys are also concerned with opinions that are
held, processes that are going on, effects that are evident or trends that are developing.
This research design also reduces systematic error through careful planning of the
questions, and a questionnaire is the main data collection tool in surveys.
3.3 Target Population
Target population refers to the larger population to which the researcher ultimately would
like to generalize the results of the study (Berg, 2001). It is thus the entire group of
individuals, events or objects having a common observable characteristic. The target
population for this study were all the 590 corporate organizations in Kenya’s
manufacturing sector classified into 12 key industrial sub sectors and by the type of raw
materials companies import or the products they manufacture, in addition to service
sector and affiliate associations (KAM, 2011). According to the Economic Recovery

49
Strategy for Employment and Wealth Creation report, (2011), aggregately, the value
contribution of the corporate organizations in the manufacturing sector in Kenyan income
has steadily increased from 13 % in 2002 to 15.7 % in 2007 and has attracted a large
number of investors who now thrive in these subsectors and the sector is a major source
of growth, has a greater potential for investment and improvement of quality, profits,
innovation and competitiveness. The sector is a good indicator of economic activity.
3.4 Sampling Frame
A sampling frame is a list of all items where a representative sample is drawn for the
purpose of research. In this study, the sampling frame was a list of all the corporate
organizations in the 12 key industrial subsectors of the manufacturing sector in Kenya.
These subsectors are: Building, Construction and Mining; Chemical and Allied; Energy,
Electrical and Electronics; Food and Beverage; Leather and Footwear; Metal and Allied;
Motor Vehicle and Accessories; Paper and Board; Pharmaceutical and Medical
Equipment; Plastic and Rubber; Textiles and Apparels; Timber, Wood and Furniture. The
sampling frame was obtained from the directory of Kenya Association of Manufacturers
(KAM, 2011) which is a premier representative organization for manufacturing value-
added industries. It has the mandate of promoting competitive local manufacturing in
liberalized markets, representing a cross section of the entire corporate organizations in
the manufacturing sector in Kenya. KAM provides demand-driven-value-added services
to facilitate firm-level interventions and continuous improvements aimed at enhancing

50
industry’s performance and profitability, with the intention to deepen Kenya’s industrial
sectors and improve competitiveness.
3.5 Sample and Sampling Technique
A sample is a portion or part of the population of interest. The purpose of sampling is to
gain an understanding about some features or attributes of the whole population based on
the characteristics of the sample. The study used stratified random sampling where the
subjects are selected in such a way that the existing subgroups in the population are more
or less reproduced in the sample (Mugenda & Mugenda, 2003). Using the sampling
frame, it was established that there were 12 key industrial subsectors of the 590 corporate
organizations in the manufacturing sector, in addition to service sector and affiliate
associations. The organizations were divided into 12 groups/ strata (see Table 3.1), each
key subsector forming a stratum. Stratified random sampling technique guarantees that
each stratum is represented in the sample and is more accurate in reflecting the
characteristics of the population. According to Kothari (2004), a population is stratified
based on different features of the population and a random sample is picked from each
stratum. In this sampling method, sampling error is considerably reduced. The sample
size determination formula by Mugenda and Mugenda (2003) was adopted to determine
the sample size and calculated according to the following formula:
n=z2 pq
d2
Where: n= Sample size

51
z=Confidence level at 95% (standard value of 1.96)
p=Proportion in the target population estimated to have the characteristics being
measured
q=1-p
d=level of statistical significance (=0.05)
The study estimated that around 70% of the corporate organizations in the manufacturing
sector had embraced HRM practices. The sample size determination formula was used to
select 210 firms for intensive study, representing 36% of the corporate organizations in
the manufacturing sector. The calculations of the sample size determination are shown in
Appendix 21. This sample size represented more than the 10 % of the accessible
population that is generally recommended by social researchers who generally
recommend that 10 % of the accessible population is enough, and at least 30 cases are
required for statistical data analysis (Mugenda & Mugenda, 2003; Alreck, 2004). Orodho
(2005) states that most social researchers recommend at least 100 cases.
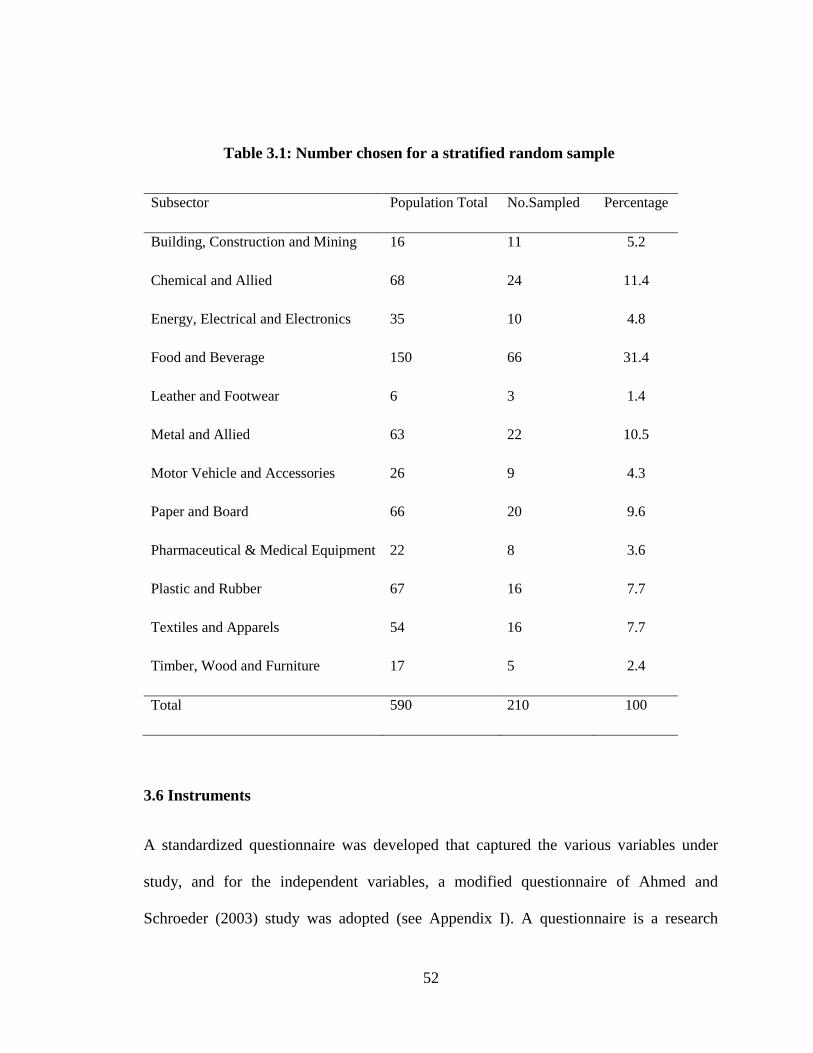
52
Table 3.1: Number chosen for a stratified random sample
Subsector Population Total No.Sampled Percentage
Building, Construction and Mining 16 11 5.2
Chemical and Allied 68 24 11.4
Energy, Electrical and Electronics 35 10 4.8
Food and Beverage 150 66 31.4
Leather and Footwear 6 3 1.4
Metal and Allied 63 22 10.5
Motor Vehicle and Accessories 26 9 4.3
Paper and Board 66 20 9.6
Pharmaceutical & Medical Equipment 22 8 3.6
Plastic and Rubber 67 16 7.7
Textiles and Apparels 54 16 7.7
Timber, Wood and Furniture 17 5 2.4
Total 590 210 100
3.6 Instruments
A standardized questionnaire was developed that captured the various variables under
study, and for the independent variables, a modified questionnaire of Ahmed and
Schroeder (2003) study was adopted (see Appendix I). A questionnaire is a research

53
instrument that gathers data over a large sample and its objective is to translate the
research objectives into specific questions, and answers for each question provide the
data for hypothesis testing. The advantages of a questionnaire over other instruments
include: information can be collected from large samples, no opportunity for bias since it
is presented in paper form and confidentiality is upheld. The questionnaire is divided into
two sections. Part A was the identification section where the respondents identified
themselves; job title and the number of years they had worked for the company. Part B
asked the respondents to provide information concerning the major areas of this study
and also classification information such as age, size. The questionnaire contained both
closed and open ended questions. The closed ended questions were aimed at giving
precise information which minimized information bias and facilitated data analysis, while
the open ended questions gave respondents freedom to express themselves.
Interviews were also conducted using a structured interview guide (appendix II) which
helped achieve personal in-depth information which was appropriate to generate more
and higher quality ideas on a personal response basis and enabled the study to probe
deeper the issues that arose. Interviews give the opportunity for eliciting information and
to observe both the subject and the total situation to which he/she is responding to
(Mugenda & Mugenda, 2003). Secondary data was collected through evaluation of
reports, organizational journals, publications and review of information from the websites
of the various corporate organizations in as far as they provided relevant and up-to-date
information.

54
3.7 Data Collection Procedure
Questionnaires were self-administered and three research assistants were recruited and
trained so that they were able to get quality results. The target participants were the HR
managers who filled in the questionnaires. These target participants were easy to identify,
have adequate knowledge about the firm’s strategic situation and relevant insights into
the business, considering their crucial role in top management involvement.
Organizations were first contacted and the intention to drop the questionnaires and the
request to do so explained to the HR managers. The questionnaires were then delivered to
the respondents and were waited for to fill them. Respondents who were not in a position
to fill that day were given a week after which the research assistants went back to collect
the questionnaires. The number of questionnaires that were utilized to collect data for this
study was 210, since the firm was the unit of analysis and the sample size was 210
corporate organizations. Interviews were also conducted at the workplace/offices of the
respondents and detailed notes were taken during the interviews. The informants of this
study during the interviews were also the HR managers. One informant was interviewed
per day to make it easier to transcribe the information obtained immediately after each
interview session to verify accuracy and completeness of the notes taken.
3.8 Pilot Test
The questionnaire was pretested to ensure clarity and content validity prior to them being
administered. Reliability analysis for testing reliability and the internal consistency of the
data items was conducted using the Cronbach’s alpha. The questionnaire and interview

55
guide were pilot tested on 20 corporate organizations that were part of the target
population but not in the sample, and HR managers filled in the questionnaire. This
represented 10 % of the accessible population (sample size) that is generally
recommended by social researchers, according to Mugenda and Mugenda (2003).In
choosing the 20 organizations for pilot testing, the researcher used simple random
sampling. According to Orodho (2005), simple random sampling ensures that each unit
has an equal probability of being chosen, and the random sample is the most
representative of the entire population and least likely to result in bias. It has statistical
properties that allow the researcher to make inferences about the population, based on the
results obtained from the sample. After pilot testing, the questionnaire and interview
guide were revised to incorporate the feedback that was provided.
Data reliability which is a measure of internal consistency and average correlation was
measured using Cronbach’s alpha coefficient which ranges between 0 and 1 (Kipkebut,
2010). Higher alpha coefficient values means that scales are more reliable. As a rule of
thumb, acceptable alpha should be at least 0.70 or above. Cronbach’s alpha is a general
form of the Kunder- Richardson (K – R) 20 formula.
The formula is as follows:
KR20 = (K) (S2
- ∑ S2 )
(S2) (K – 1)
KR20 = Reliability coefficient of internal consistency
K = Number of items used to measure the concept
56
S2 = Variance of all scores
S2 = Variance of individual items
3.9 Data Processing and Analysis
According to Sekaran (2003) as cited by Njuguna (2008), there are three objectives in
data analysis: getting a feel for the data, testing the goodness of the data and testing
hypothesis developed for the research. A feel for the data gives the researcher a good idea
of how well the respondent have reacted to the items in the questionnaire and how good
the items and measures are. This includes descriptive statistics such as the response rate,
mean and standard deviations of the observed variables. Establishing the goodness of the
data lends credibility to all subsequent analysis and findings because it measures the
reliability and validity of the measures used in the study. Once the data is ready for
analysis, the researcher is ready to test the hypothesis already developed using
appropriate statistical tests.
In this study, the quantitative data collected was analyzed by calculating response rate
with descriptive statistics such as mean, median, standard deviation and proportions using
Statistical Package for Social Sciences (SPSS) version 17 and Microsoft Excel.
Inferential data analysis was carried out by the use of factor analysis and correlation
analysis to determine the strength and the direction of the relationship between the
dependent variable and the independent variables. Regression models were fitted and
hypothesis testing carried using multiple regression analysis and standard F tests and t
tests.
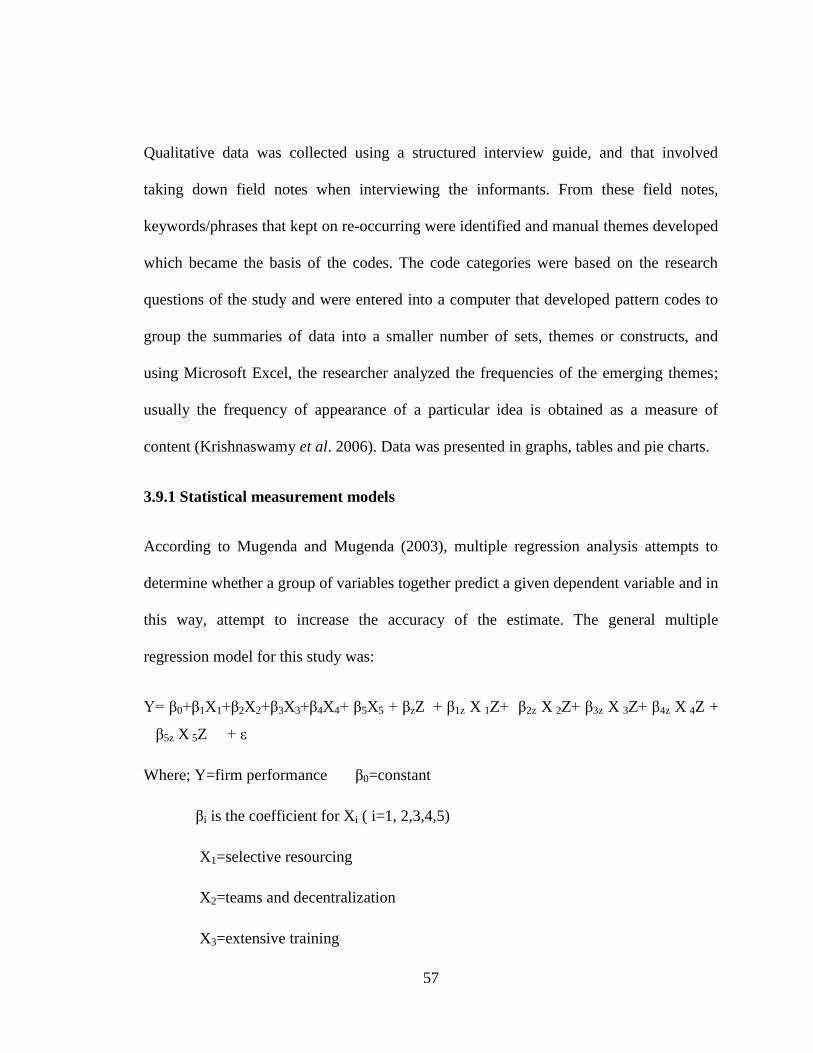
57
Qualitative data was collected using a structured interview guide, and that involved
taking down field notes when interviewing the informants. From these field notes,
keywords/phrases that kept on re-occurring were identified and manual themes developed
which became the basis of the codes. The code categories were based on the research
questions of the study and were entered into a computer that developed pattern codes to
group the summaries of data into a smaller number of sets, themes or constructs, and
using Microsoft Excel, the researcher analyzed the frequencies of the emerging themes;
usually the frequency of appearance of a particular idea is obtained as a measure of
content (Krishnaswamy et al. 2006). Data was presented in graphs, tables and pie charts.
3.9.1 Statistical measurement models
According to Mugenda and Mugenda (2003), multiple regression analysis attempts to
determine whether a group of variables together predict a given dependent variable and in
this way, attempt to increase the accuracy of the estimate. The general multiple
regression model for this study was:
Y= β0+β1X1+β2X2+β3X3+β4X4+ β5X5 + βzZ + β1z X 1Z+ β2z X 2Z+ β3z X 3Z+ β4z X 4Z +
β5z X 5Z + ε
Where; Y=firm performance β0=constant
βi is the coefficient for Xi ( i=1, 2,3,4,5)
X1=selective resourcing
X2=teams and decentralization
X3=extensive training

58
X4=sharing information
X5=incentives
Z= Competitive strategies (moderator)
ε = error term
XiZ= Product term / interaction term of the competitive strategies with each of the
independent variables(x1,x2x3,x4,x5)
3.10 Measurement of Variables
Strategic HRM: Successful firms create a bundle of employee practices to reinforce the
organizations strategic position. The bundle of HRM practices for this study was adopted
from the study by Ahmad and Schroeder (2003) and included: selective resourcing,
extensive training, use of teams and decentralization, sharing information and incentives
on performance. A five-point likert scale (5 = strongly agree, to 1= strongly disagree)
was used for each of the statements corresponding to the various parameters of SHRM
practices.
Competitive strategies: Based on the typology of competitive HR strategy of Schuler
and Jackson (1987), the respondents were asked to choose the significant competitive
strategy pursued by their organization. A five-point likert scale (5 = very important, to 1=
very unimportant) was also used for each of the statements corresponding to the various
dimensions under competitive strategies.
Firm performance: In this study, firm performance was measured by objective and
subjective measures of perceived profitability, sales growth, and profitability ratio.

59
Perceived Profitability was measured as the degree of satisfaction with the firms’
profitability, sales growth was measured as the annual percentage growth in total sales,
while profitability ratio was measured as (Profit ratio = Profit/Capital x 100) during the
past three years (2009, 2010, and 2011) to control for any fluctuations. Similar indirect
measure of firm performance (perceived profitability) have been used in prior research
when financial statement data are unavailable or when they do not allow for accurate
comparisons among firms (Dess, 2000; Powell, 2002). Profits were assessed over a 3 year
period, 31st December being considered end of financial year, and 2009 as the base year.
The researcher used a five point response scale (with 5 =very satisfying, to 1= very
dissatisfying).
Control variables: The main control variables in this study were firm size and firm age
to prevent potential bias in profit forecasting .Older firms may have an experience and
knowledge advantage on their understanding of the external market and may have
penetrated and stabilized in the market, while younger firms are likely to focus on a new
set of priorities which are more business and strategic oriented .The size of the firm on
the other hand influences SHRM implementation and relationship outcomes where larger
ventures may have more resources to devote to any competitive model. Firm size was
measured as number of full time employees and age was measured in terms of the
number of years of operation of the company in Kenya.

60
CHAPTER FOUR
4.0 RESEARCH FINDINGS AND DISCUSSION
4.1 Introduction
The general objective of this research was to determine the effect of competitive
strategies on the relationship between strategic human resource management and firm
performance of corporate organizations in Kenya. The specific objectives were to
determine the influence of SHRM on firm performance and establish the moderating
effect of a cost led /quality led and innovation led HR strategies on the relationship
between SHRM and firm performance of corporate organizations in Kenya. The
hypotheses of this study were stated as: SHRM had no significant effect on firm
performance, and a cost led /quality led /innovation led HR strategies had no significant
moderating effect on the relationship between SHRM and firm performance of corporate
organizations in Kenya. In an attempt to address the specific objectives of the study, this
chapter provides a detailed description of descriptive and inferential statistics and the
research findings and discussions, clearly outlining how each of the hypothesis as stated
in chapter one was tested.
4.2 General Characteristics of the Study Sample
4.2.1 Subsectors’ response rate
Data for this study was collected from 210 organizations distributed across the 12 key
industrial subsectors in the manufacturing sector (see Table 4.2). These were: Building,
Construction and Mining; Chemical and Allied; Energy, Electrical and Electronics; Food

61
and Beverage; Leather and Footwear; Metal and Allied; Motor Vehicle and Accessories;
Paper and Board; Pharmaceutical and Medical Equipment; Plastic and Rubber; Textiles
and Apparels; Timber, Wood and Furniture. Food and Beverage subsector had the
majority of the organizations (31.4 %) participating in the study. Metal and Allied
subsector had 10.5 %, Chemical and Allied subsector 11.4 %, Paper and Board subsector,
9.6 % while Building and Construction subsector had 5.2 %. Leather and Footwear
subsector only had a response rate of 1.4 %, while Plastic and Rubber and Textile and
Apparels subsectors both had a response rate of 7.7 %. Table 4.2 provides an illustration
of the response rate by subsector.

62
Table 4.2: Subsectors’ response rate
Subsector Number Sampled Percentage
Building, Construction and Mining 11 5.2
Chemical and Allied 24 11.4
Energy, Electrical and Electronics 10 4.8
Food and Beverage 66 31.4
Leather and Footwear 3 1.4
Metal and Allied 22 10.5
Motor Vehicle and Accessories 9 4.3
Paper and Board 20 9.6
Pharmaceutical and Medical Equipment 8 3.6
Plastic and Rubber 16 7.7
Textiles and Apparels 16 7.7
Timber, Wood and Furniture 5 2.4
Total 210 100
4.2.2 Ownership status of the study sample
The majority of these organizations (122) representing a valid percentage of 29.6% and
29.5% of the total sampled were owned locally and by partnership respectively. Foreign
owned organizations were 47 representing a valid percentage of 22.7% of the
organizations sampled in this study, and 2.4% were locally owned by religious

63
organizations and other groups. The valid percentage of the ownership status of the others
was: Family owned 1.9 %, Government owned 5.3 %, and Private Limited companies 9.1
% .Their frequencies were: 4, 11, and 19 respectively of the total sampled as indicated in
Figure 4.2.
Key: F-family owned; RO-religious organizations and other groups
Govt-Government
Figure 4.2: Ownership status of the study sample
4.2.3 Age of the study sample
The age of the organizations that participated in this study was measured as the number
of years an organization has been operating in the country. The majority of the
organizations that participated in this study as indicated in Figure 4.3 were over 17 years

64
old representing 47.5% of the sampled firms, 9.3% were between 13 to 17 years old,
16.2% were between 9 to 12 years old, 20.6% had been in operation for between 4 to 8
years with only 6.4 % of the sampled organizations being less than 4 years old.
Figure 4.3: Age of the sampled organizations
4.2.4 Size of the study sample
The size of the participating organizations was measured as the number of full time
employees working in the organizations. The findings of this study (see Table 4.3)
indicated that the majority of the organizations (55.8%) employed over 100 full time
employees, with 10.7 % employing between 71-100 employees. Only 5.3% representing
11 of the organizations sampled had less than 20 full time employees.

65
Table 4.3: Size of the study sample
Number of full time employees frequency Percentage %
Less than 20 11 5.3
20-50 37 18.0
51-70 21 10.2
71-100 22 10.7
Over 100 115 55.8
4.3 Descriptive Statistics
The purpose of this study was to investigate the effect of competitive strategies on the
relationship between SHRM and firm performance of Kenya’s corporate organizations.
The researcher analyzed descriptive statistics for the following observed variables:
selective resourcing, use of teams and decentralization, extensive training, sharing
information, incentives on performance, cost led HR strategy, quality led HR strategy,
innovation led HR strategy, sales growth, and perceived profitability.
4.3.1 Selective resourcing and firm Performance
The majority of the respondents (70.8%) agreed that attitude or desire to work was
always used as a criterion in employee selection, and 66.5% also agreed that problem
solving aptitude was always used as a criterion in employee selection. Only a small
percentage of 25.7 % of the respondents disagreed that their organizations usually

66
considered those who could provide ideas to improve the manufacturing process. An
overwhelming majority of 90.7% agreed that work values and behavior attitude were
often used as criteria in employee selection as indicated on Table 4.4.
Table 4.4: Selective resourcing and firm Performance
SD =strongly disagree: D = disagree: N= neutral: A =agree: SA =strongly agree
Opinion statements SD D N A SA Total
% % % % % %
Attitude/desire to work always used
as a criteria in employee selection
11.2 12.6 5.3 45.6 25.2 100.0
Problem solving aptitude always
used as a criteria in employee
selection
10.2 15.5 7.8 45.1 21.4 100.0
In selection of employees, you
usually consider those who can
provide ideas to improve the
manufacturing process
0.5 3.4 8.9 63.7 26.5 100.0
Work values and behavior attitude
often used as criteria in employee
selection
0 5.4 3.9 61.6 29.1 100.0

67
The HR managers interviewed indicated that they usually considered work values and
behavior attitude as a criterion during selection of new employees as well as those who
can provide innovative ideas to improve the products of their organizations.
4.3.2 Use of Teams and decentralization and firm Performance
The majority of the respondents (70 %) agreed that their organizations usually select
employees who are able to work in small groups, with 87.7% agreeing that they always
make an effort to get all team members opinions and ideas before making a decision.
Many of the respondents (78.7%) agreed that in the past three years, many problems had
been solved using small group sessions.
However, only 11.8% of the respondents agreed that problem solving teams have not
always helped to improve performance, and 87.7 % and 88.2% agreed that the
supervisors often encouraged persons to work as a team and frequently hold group
meetings where people discuss things together, respectively (see Table 4.5). A large
number of the informants in the interviews indicated that their organizations embrace use
of team activities and team work and that the members’ opinions counts before reaching a
decision during problem solving sessions. As HR managers, the interviewees agreed that
they encourage their employees to work as a team and they frequently hold staff meetings
weekly to brief the employees and also give them a chance to voice their opinions.

68
Table 4.5: Use of Teams and decentralization and Firm Performance
Opinion statements SD D N A SD Total
% % % % % %
Usually select employees who are
able to work in small groups
1.5 12.1 16.2 50.0 20.2 100.0
During problem solving sessions,
you always make an effort to get all
team members opinions and ideas
before making a decision
0 5.4 6.9 48.3 39.4 100.0
In the past 3 years, many problems
have been solved using small group
sessions
2.5 7.4 11.4 52.5 26.2 100.0
Problem solving teams have not
always helped to improve
performance
49.5 31.4 7.4 10.8 1.0 100.0
Supervisors often encourage
persons to work as a team
.5 4.4 7.4 47.8 39.9 100.0
Supervisors frequently hold group
meetings where people discuss
things together
1.0 6.9 3.9 46.8 41.4 100.0
SD =strongly disagree: D = disagree: N= neutral: A =agree: SA =strongly agree

69
4.3.3 Extensive training and Firm performance
A high percentage of the respondents (87.1%) disagreed that their organizations had a
low skill level compared to the industry, with 85.3% also disagreeing that their
employees usually lack important skills (See Table 4.6). However, 82.8% of the
respondents agreed that the employees always have skills that are above average in the
industry, with 93.1% agreeing that management usually believes that continual training
and upgrading of employees skills is important. Also, the majority of the respondents
who were 88.8 % agreed that employees receive training and development in workplace
skills on a regular basis and only 5.4 % disagreed with that statement.
This was corroborated by the themes that emerged from the interviews with all the
informants interviewed indicating that extensive training is provided for by their
organizations. The interviews revealed that many of the manufacturing organizations in
Kenya conducted regular in house and external trainings. Many of the sampled
organizations offered training on job skills and on multiple functions to all cadres of staff
as the interviews established.

70
Table 4.6: Extensive training and Firm performance
Opinion statements SD D N A SA Total
% % % % % %
Company always has a low skill level
compared to the industry
46.3 40.8 4.5 5.5 3.0 100
Employees usually lack important
Skills
46.6 38.7 7.4 4.4 2.9 100
Employees always have skills that are
above average in the industry
1.0 6.3 9.9 68.1 14.7 100
Management usually believes that
continual training and upgrading of
employees skills is important
0 3.4 3.4 59.0 34.1 100
Employees receive training and
development in workplace skills on a
regular basis
0 5.4 5.9 57.6 31.2 100
SD =strongly disagree: D = disagree: N= neutral: A =agree: SA =strongly agree

71
4.3.4 Sharing information and Firm Performance
The research observed that 90.3% of the respondents in this study agreed that goals,
objectives and strategies were usually communicated to them, with only 9.3%
disagreeing that they always understood the long run competitive strategy of their
organizations (See Table 4.7). Many of the respondents in this study (84.3%) agreed that
strategies and goals are usually communicated primarily to managers. In addition, 82.6%
of the respondents agreed that information on productivity is readily available to
employees and 87.2 % disagreed that their manager never comments about the quality of
their work.

72
Table 4.7: Sharing information and Firm Performance
SD =strongly disagree: D = disagree: N= neutral: A =agree: SA =strongly agree
This information was corroborated by the responses from the interviews where on average; the
informants indicated that they have an open communication policy where all the information on the
goals and strategies of the organizations and in providing performance feedback is shared with the
employees.
4.3.5 Incentives and Firm Performance
The results of the study indicated that 84.4% of the respondents agreed that incentive system of their
organizations encourages them to vigorously pursue its objectives, with 83.4% agreeing that
Opinion statements SD D N A SA Total
% % % % % %
Goals, objectives and strategies are a
usually communicated to you
0 4.4 5.4 57.6 32.7 100.0
You always understand the long run
competitive strategy
0 5.4 3.9 54.6 36.1 100.0
Strategies and goals are usually
communicated primarily to managers
1.5 4.9 9.4 49.8 34.5 100.0
Information on productivity is readily
available to employees
0.5 6.5 10.4 49.3 33.3 100.0
Your manager never comments about
the quality of your work
52.7 34.5 6.4 4.9 1.5 100.0

73
incentive system was always fair at rewarding employees who accomplished company objectives
(See Table 4.8) Moreover, the majority of the respondents at 82.4% agreed that the reward system
usually recognized the employees who contributed the most to the company. Many of the
respondents interviewed stated that a wide range of incentives were offered to employees to enhance
achievement of the company’s objectives and to earn their commitment to remain loyal to the
organizations.
Table 4.8: Incentives and Firm Performance
Opinion statements SD D N A SA Total
% % % % % %
Incentive system of your company
encourages you to vigorously pursue
its objectives
1.5 4.9 9.3 57.1 27.3 100.0
Incentive system is always fair at
rewarding employees who accomplish
company objectives
1.0 3.4 12.3 56.4 27.0 100.0
Reward system usually recognizes the
employees who contribute the most to
the company
1.5 6.9 9.3 53.9 28.4 100.0
SD =strongly disagree: D = disagree: N= neutral: A =agree: SA =strongly agree

74
4.3.6 Competitive HR strategies and Firm Performance
The study specifically sought to determine the effect of competitive HR strategies on the
relationship between SHRM and firm performance. The strategies that were considered for this
study were: cost led HR strategy, quality led HR strategy and innovation led HR strategy. The
majority of the organizations (74.9 %) indicated that they pursued a quality led HR strategy,
representing 155 organizations out of the 210 total organizations sampled. Organizations adopting a
quality led HR strategy also indicated that they continuously improved the quality of their products,
produced goods of the highest quality possible to differentiate from their competitors and placed an
emphasis on skill acquisition and development of employees. Only 10.1 % representing 21 of
organizations indicated that they pursued a cost led HR strategy by producing products at a cost
below what the competitors could achieve with no frills and placed an emphasis on minimizing
costs at all stages in the manufacturing process including management of employees. The rest of the
33 organizations (15.9 %) indicated that they produced and sold rapidly changing products that
differed from those of competitors designed by highly trained specialists, a characteristic of an
innovation led HR strategy (see Table 4.9).
Informants were interviewed on the significant competitive strategies pursued by their organizations
by asking them on the importance of cost, quality and innovation of their products in the target
market. An overwhelming majority of the informants ranked quality as the most important aspect,
and emphasized that it is the employees who deliver this quality through their knowledge, skills,
attitudes and abilities and the organization plays the role of facilitating training to extend the
employees knowledge and skills and provision of updated technology in the manufacturing process.

75
Majority of the organizations were also ISO certified and they continuously sought to improve the
quality of their products. This corroborated with the information provided in the questionnaires.
Table 4.9: Competitive HR strategies
Freq. No Yes Total %
Provide products at a cost below what your competitors can
achieve, with no frills and placing an emphasis on
minimizing costs at all stages in the process including
management of employees.
21 89.9 10.1 100.0
Continuously improve the quality of your products, produce
goods of the highest quality possible to differentiate
yourself from the competition, placing an emphasis on skill
acquisition and development of employees.
155 25.1 74.9 100.0
Produce and sell rapidly changing products that differ from
those of competitors designed by Highly trained specialists.
33 84.1 15.9 100.0
Freq.=frequency
4.3.7 Perceived Profitability and Firm Performance
The majority of the respondents who participated in this study (84.9 %) indicated that
they felt that they were slightly satisfied with their company’s profitability in 2009, with

76
90.7% indicating that they were also satisfied in 2010 while 93.9% were also satisfied
with the profitability of their companies in 2011 (see Table 4.10).
Table 4.10: Perceived Profitability and Firm Performance
YEAR VD
%
D
%
N
%
SS
%
VS
%
Total
%
2009 2.1 5.2 7.8 66.8 18.1 100.0
2010 1.5 5.2 2.6 69.6 21.1 100.0
2011 1.5 2.0 2.6 40.8 53.1 100.0
VD=very dissatisfying: D= dissatisfying: N= neutral: SS =slightly satisfying:
VS= very satisfying
According to the results of the interviews, the majority of the HR managers interviewed
were of the opinion that they were satisfied with their organizations’ performance in the
last three years but still felt that there was room for growth to enhance on that
performance. Only a few of the informants indicated that they were dissatisfied with the
performance of their organizations in the past three years.
With regard to firm performance, the researcher interviewed the informants participating
in the interview on the indicators that they use to measure performance. The dimension of
profitability was reflected as the highest one, with the majority of the respondents
indicating that they use it to measure performance. Similarly, a large number of the

77
informants also revealed that they use sales growth as a parameter of firm performance,
with only a small number responding that they use production level and market share as
aspects of their organizational performance.
4.3.8 Aggregate of the Independent variables
Five HRM practices (selective resourcing, teams and decentralization, extensive training,
sharing information and incentives on performance) were considered as the
dimensions/components of the independent variable of this study which was SHRM.
With regard to selective resourcing, the majority of the HR managers who were the
respondents of the study indicated that they agreed that this aspect was considered by
their organizations, with some of them strongly agreeing. However, none of the
respondents strongly disagreed that behavior and attitude as well as manufacturing and
HR fit which are sub dimensions of selective resourcing are considered in their
organizations during recruitment and selection as indicated in Table 4.11, since the
minimum of the scale was 2; disagreed.

78
Table 4.11: Summary of Means and Standard deviations of SHRM Practices
HRM practice Mean Std. dev Min Max
Selective resourcing
Teams & decentralization
Extensive training
Sharing information
Incentives on performance
3.8418
4.0699
4.1430
4.1806
4.0325
.77111
.68645
.59044
.58698
.73210
2.00
1.00
2.00
2.00
1.00
5.00
5.00
5.00
5.00
5.00
Ranked on a scale: 1 - 1.8 (strongly disagree): 1.8 - 2.6 (disagree):
2.6 - 3.4 (neutral) : 3.4 - 4.2 (agree): 4.2 - 5.0 (strongly agree)
On average, the respondents agreed that their organizations facilitated the use of teams
and decentralization, and these were also the majority of the sampled organizations.
However, a few of the respondents strongly disagreed that their organizations provided
for the use of teams and decentralization by allowing employees to work in teams and
with supervisors frequently holding group meetings to discuss and solve organizational
problems.
With regard to extensive training, both training on multiple functions and training on
skills were captured as sub components of this dimension. On average, the respondents in
the sample agreed that extensive training was provided with employees having skills that

79
are above the average in the industry and receiving training and development skills in
work place on a regular basis with majority strongly agreeing. Only a few of the
organizations agreed that their employees lack important skills and have a low skill level
compared to the industry.
The study considered sharing company information as a dimension of SHRM with two
sub components; communication of company strategy and feedback on performance. On
average, the respondents of the organizations agreed that the goals, objectives, strategies
of the organizations were communicated to the employees who always understood the
long run competitive strategy. The majority of the HR managers also agreed that
information on productivity was readily available to employees with the managers
commenting about the quality of their work. Only 22% of the sampled organizations
disagreed that they provided for sharing the company information.
Incentives are provided for by organizations to employees with the aim of enhancing
their performance. On average, the respondents agreed that their incentive system
encouraged employees to vigorously pursue its objectives, which was also fair at
rewarding employees who accomplish company objectives. Many of these organizations
also agreed that their reward system usually recognized the employees who contributed
the most to the company, with some of the respondents strongly disagreeing that their
organizations provided for incentives to meet company’s objectives.
Sharing information was rated highest on average with a mean of 4.1806, with responses
deviating from the mean by a standard margin of 0.58698. On average, all the

80
respondents agreed that the five HRM practices were used in their organizations to a
great extent.
4.4 Measurement Models for the Independent, Moderating and Dependent
Variables
4.4.1 Measurement model for the independent variables
a) First-order model for SHRM
Strategic human resource management was the independent variable in this study and
five HRM practices were considered as the dimensions of SHRM in this study. The five
HRM practices were: selective resourcing, use of teams and decentralization, extensive
training, sharing information and incentives on performance. Selective resourcing was
measured using two subcomponents; behavior and attitude (BA) as well as manufacturing
and HR fit (MHRF), with each sub component having two items. BA1, BA2: MHRF1,
MHRF2 (See Appendix 19). Use of teams and decentralization was measured using four
items for team activities sub dimension (TA1, TA2, TA3 ,TA4) and two items for
interaction facilitation sub dimension (IF1, IF2). The dimension of extensive training had
two subcomponents; training on multiple functions (TMF) with three items: TMF1, TMF2,
TMF3 and training on job skills (TOS) with two items; TOS1 TOS2 .Each of the two sub
dimensions of sharing information; communication of strategy (CS) and Feedback on
performance (FP) was measured using three and two items respectively: CS1, CS2, CS3,
FP1, FP2. The last component of SHRM which was incentives on performance (IP) was
measured using three items: IP1, IP2, IP3. . (See Appendix 19). The research used

81
extraction method of the principal components for the factor analysis for all the above
items to assess the SHRM scale and the findings are indicated on Table 4.12.

82
Table 4.12: First-order model for Strategic human resource management
Dimension Sub dimension Item Factor loadings Reliability
Selective resourcing
Behavior and Attitude
BA1 0.874 0.717
BA2 0.701
Manufacturing and
HR fit
MHRF1 0.891
MHRF2 0.503
Teams and
Decentralization
Team activities
TA1 0.580 0.819
TA2 0.835
TA3 0.618
TA4 0.539
Interaction facilitation
IF1 0.651
IF2 0.761
Extensive training
Training on multiple
functions
TMF1 0.735 0.752
TMF2 0.816
TMF3 0.638
Training on job skills
TOS1 0.696
TOS2 0.664
Information sharing
Communication of
Strategy
CS1 0.722 0.767
CS2 0.663
CS3 0.572
Feedback on
performance
FP1 0.651
FP2 0.511
Incentives on
Performance
Incentives to meet
objectives
IP1 0.692 0.849
IP2 0.694
IP3 0.687
P<0.05
83
The results of the factor analysis on Table 4.12 indicated that the model fits the data since
all the factor loadings were above 0.5 for the existence of selective resourcing, use of
teams and decentralization, extensive training, sharing information and incentives on
performance as the five dimensions of SHRM in this study. The findings revealed factor
structures with the HRM practices falling into those five distinct dimensions in this study.
Reliability analysis for testing the internal consistency of all the items in each of the
dimension of SHRM was conducted in this research. All the items achieved Cronbach
alpha of 0.7 or higher (0.717 to 0.849) suggesting that the questionnaire had high
reliability (see Table 4.12). The researcher also tested the validity of the questionnaire.
According to Anderson and Gerbing (1988) as cited by Njuguna (2008), convergent
validity refers to the degree to which a measure converges on the same model with the
remaining measure forming part of the concept. Convergent validity was analyzed in this
study in order to verify the validity of SHRM scale. Positive coefficients which were
significant (p<0.05) between the items and factors indicated that there was a strong
condition of convergent validity. The factor loadings of the items in the model for SHRM
were all positive and significant. This meant that although these items were developed
using literature focusing on the contexts of developed countries, the items converged very
well to their respective dimensions and were applicable in the Kenyan context.
(b) Confirmatory model for Strategic human resource management
A confirmatory factor analysis was performed for all the sub dimensions of the
independent variable. The results of this analysis are illustrated in Table 4.13, and all the

84
coefficients were above 0.5, positive and significant at the level of p<0.05. These
findings confirmed that SHRM in this study had five dimensions (selective resourcing,
use of teams and decentralization, extensive training, sharing information and incentives
on performance and they underlay a single main factor which was SHRM, the
independent variable of this study.
Table 4.13: Confirmatory model for Strategic human resource management
Independent
Variable
Dimension Items Factor
Loadings
Reliability
Strategic Human
Resource Management
Selective
Resourcing
BA 0.927 0.717
MHRF
Teams and
decentralization
TA 0.897 0.819
IF
Extensive
training
TMF 0.816 0.752
TOS
Information
sharing
CS 0.863 0.767
FP
Incentives on
performance
IP 0.878 0.849
P<0.05

85
4.4.2 Measurement model for Competitive strategies
The competitive strategies were the moderating variables in this study, and this variable
had three dimensions (See Appendix 20): Cost led HR strategy (CHRS), quality led HR
strategy (QHRS) and innovation led HR strategy (IHRS). A confirmatory factor analysis
by extraction method of the principle components was conducted for all items and the
factor loadings were above 0.5 and significant at p<0.05, as indicated on Table 4.14. This
meant that competitive strategies could be measured using the three dimensions.
The Cronbach alpha reached the threshold of 0.7 (0.808, 0.868, 0.855) indicating strong
consistency hence verifying reliability. As indicated on Table 4.14, the coefficients
between the items and factors were positive and significant at p<0.05 indicating
convergent validity. Therefore, cost led HR strategy, quality led HR strategy and
innovation led HR strategy converged to the hypothesized model and could be used to
measure competitive strategies of Kenya’s manufacturing organizations. Each of the
three dimensions of competitive strategies was measured using two items (see Table
4.14).

86
Table 4.14: Measurement Model for Competitive strategies
Dimension Item Factor Loadings Reliability
Cost led HR strategy CHRS1 0.887 0.808
CHRS2 0.813
Quality led HR strategy QHRS1 0.958 0.868
QHRS2 0.715
Innovative led HR
strategy
IHRS1 0.904 0.855
IHRS2 0.727
P<0.05
4.4.3 Measurement model for Firm Performance
The overall firm performance of Kenya’s corporate organizations was measured using
three items; sales growth, perceived profitability and profitability ratio. Sales growth
(SG) was calculated as the annual sales growth for the past three years (2009, 2010,
2011) while perceived profitability (PP) was measured as the degree of satisfaction with
the firms profitability in the same period of three years. Profitability ratio (PR) was
calculated as the average of (profit/capital x 100) for the three years prior to this study.
For both the objectives and subjective measures of firm performance (sales growth,
profitability ratio, and perceived profitability) the study adopted a self-evaluation
approach owing to the difficulties in obtaining organizational financial data. According to

87
Dess and Robinson (1984), in the absence of objective data, self reporting measures
constitute on acceptable substitute and are equally reliable. Research has also
demonstrated that self-reported firm performance measures are positively related to
effective firm performance measures with a correlation of 0.4 (Powell, 1992).
Additionally, Bamberger and Meshoulam (2000) state that the comparison of cross
industry organizational performance is influenced by external economic factors,
subjective evaluations, therefore, could even be more appropriate than objective measures
in this study.
Table 4.15 Measurement Model for Firm Performance
Dimension Item Factor Loadings Reliability
Sales growth SG 0.698 0.928
Perceived profitability PP 0.616 0.724
Profitability ratio PR 0.835 0.974
P<0.05
All the coefficients were above 0.5 and positive implying that the three items could
measure firm performance in this study and thus confirmed convergent validity of the
firm performance scale. The three items also reached the threshold value; Cronbach alpha
of 0.7 (0.928, 0.724, 0.974) and thus verified reliability of the questionnaire that was used
in this study.

88
4.5 Correlation Analysis for the linear relationship between SHRM and Firm
Performance
The researcher used correlation technique to analyze the degree of relationship between
two variables with the Pearson correlation coefficient (r), which yields a statistic that
ranges from -1 to 1. According to Mugenda and Mugenda (2003), the correlation
coefficient tells the magnitude of the relationship between two variables. The bigger the r
(absolute zero), the stronger the association between the two variables. If the correlation
coefficient is positive (+), it means that there is a positive relationship between the two
variables. A negative relationship (-) means that as one variable decreases, then the other
variable increases and this is termed as an inverse relationship. A zero value of r indicates
that there is no association between the two variables. The coefficient assumes that there
is a linear relationship or correlation between two variables, and that the two variables are
causally related; one of the variables is the independent and the other the dependent
variable; and a large number of independent causes are operating in both variables so as
to produce a normal distribution. Orodho (2005) states that Pearson’s coefficient
correlation is the most widely used method for measuring the degree of relationship
between variables.
The independent variables of this study: selective resourcing, use of teams and
decentralization, extensive training, sharing information and incentives on performance
were each correlated with perceived profitability, profitability ratio and sales growth; the
dimensions of firm performance which was the dependent variable in this study. The
researcher used correlation technique to determine if there was any relationship,

89
association or correlation between the variables, and also establish the magnitude and
direction (negative or positive).The results of the correlation analysis are illustrated in
Table 4.16: Table 4.17:Table 4.18.
The findings of the correlation analysis indicated that there was a significant and positive
relationship between the use of teams and decentralization and selective resourcing, with
a Pearson correlation coefficient r=0.319, p-value<0.001 which was significant at 0.000
level of significance. This implies that considering behavior and attitude and
manufacturing and human resource fit when sourcing for employees increase the use of
team activities and interaction facilitation (an increase in selective resourcing increase the
use of teams and decentralization).
Extensive training was positively associated with the use of teams and decentralization,
r=0.531, p-value<0.001 significant at 0.000 level of significance as the correlation matrix
indicates. As extensive training increases, use of teams and decentralization also
increases. Training on multiple functions and on skills increases with an increase on the
use of team activities and interaction facilitation.
The results of the correlation analysis revealed that sharing information was positively
and significantly associated with selective resourcing, r =0.165, p-value=0.018,
significant at 0.05 level of significance, and with the use of teams and decentralization
and extensive training (r=0.581, r=0.641) respectively, with corresponding p-values
<0.001, significant at 0.000 level of significance in both cases. This meant that these
variables could be selected for statistical analysis like regression analysis.

90
Table 4.16: Correlation Analysis Results between SHRM and Sales Growth
***. Correlation is significant at the 0.000 level (2-tailed).
**. Correlation is significant at the 0.01 level (2-tailed).
*. Correlation is significant at the 0.05 level (2-tailed).
Only statistically correlation coefficients that were significant were highlighted
Incentives on performance was found to be significantly and positively related with
selective resourcing; r=0.227, p-value=0.001, with the use of teams and decentralization;
r=0.555, p<0.001, with extensive training; r=0.414, p-value<0.001, and with information
sharing: r=0.597, p-value<0.001, all very significant at 0.000 level of significance.
HRM Practices X1 X2 X3 X4 X5 SG
Selective
Resourcing (X1)
1
Teams and
decentralization
(X2)
.319***
1
.000
Extensive training
(X3)
.131 .531***
1
.062 .000
Sharing
information
(X4)
.165* .581
*** .641
*** 1
.018 .000 .000
Incentives
(X5)
.227**
.555***
.414***
.597***
1
.001 .000 .000 .000
Sales Growth
(SG)
.293**
.005 -.174 -.101 -.148 1
.002 .957 .064 .285 .115

91
However, sales growth was found to be significantly and positively correlated with only
selective resourcing r=0.293, p=0.002, significant at 0.01 level of significant. This
implies that increase of the use of selective resourcing increases sales growth.
All the independent variables of this study: selective resourcing, use of teams and
decentralization, extensive training, sharing information and incentives on performance
were found to be positively and significantly correlated with profitability ratio, all very
significant at 0.000 level of significance. Their correlations coefficients as indicated on
Table 4.17 were; r=0.248, p-value<0.001; r=0.549, p-value<0.001; r=0.450, p-
value<0.001; r=0.575, p-value<0.001; r=0.951, p-value<0.001 respectively. The
correlation between incentives on performance and profitability ratio was very strong,
r=0.951 at p<0.001.
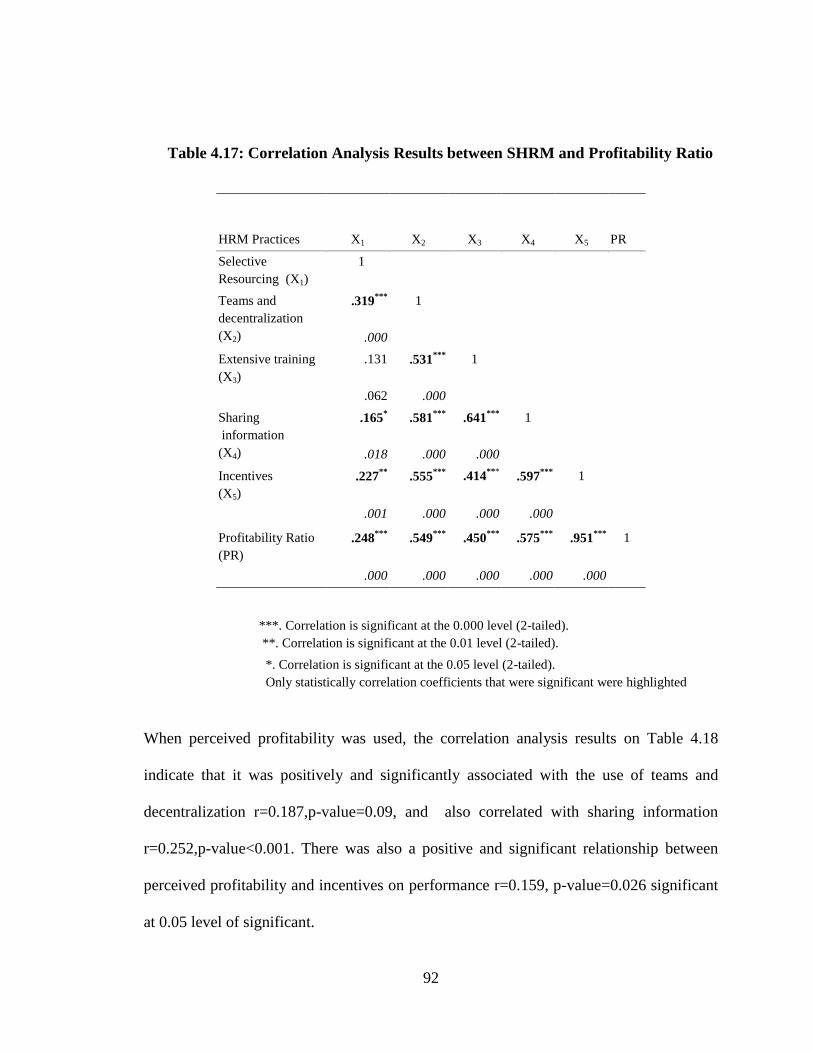
92
Table 4.17: Correlation Analysis Results between SHRM and Profitability Ratio
***. Correlation is significant at the 0.000 level (2-tailed).
**. Correlation is significant at the 0.01 level (2-tailed).
*. Correlation is significant at the 0.05 level (2-tailed).
Only statistically correlation coefficients that were significant were highlighted
When perceived profitability was used, the correlation analysis results on Table 4.18
indicate that it was positively and significantly associated with the use of teams and
decentralization r=0.187,p-value=0.09, and also correlated with sharing information
r=0.252,p-value<0.001. There was also a positive and significant relationship between
perceived profitability and incentives on performance r=0.159, p-value=0.026 significant
at 0.05 level of significant.
HRM Practices X1 X2 X3 X4 X5
PR
Selective
Resourcing (X1)
1
Teams and
decentralization
(X2)
.319***
1
.000
Extensive training
(X3)
.131 .531***
1
.062 .000
Sharing
information
(X4)
.165* .581
*** .641
*** 1
.018 .000 .000
Incentives
(X5)
.227**
.555***
.414***
.597***
1
.001 .000 .000 .000
Profitability Ratio
(PR)
.248***
.549***
.450***
.575***
.951***
1
.000 .000 .000 .000 .000

93
Table 4.18: Correlation Analysis Results between SHRM and Perceived
Profitability
HRM Practices X1 X2 X3 X4 X5 PP
Selective
Resourcing (X1)
1
Teams and
decentralization
(X2)
.319***
1
.000
Extensive training
(X3)
.131 .531***
1
.062 .000
Sharing
information
(X4)
.165* .581
*** .641
*** 1
.018 .000 .000
Incentives
(X5)
.227**
.555***
.414***
.597***
1
.001 .000 .000 .000
Perceived
Profitability
(PP)
.085 .187**
.120 .252***
.159* 1
.234 .009 .094 .000 .026
***. Correlation is significant at the 0.000 level (2-tailed).
**.Correlation is significant at the 0.01 level (2-tailed).
* .Correlation is significant at the 0.05 level (2-tailed).

94
4.6 Multiple Regression Analysis for Independent, Moderating and Dependent
variables
The research used multiple regression analysis to determine the linear statistical
relationship between the independent, moderating and dependent variables of this study.
All the four null hypothesis as stated in chapter one of this study were tested using
stepwise regression models, where the order in which the variables are entered is based
on a statistical decision not a theory.
4.6.1 Test of hypothesis 1
H01: Strategic human resource management has no significant influence on firm
performance of corporate organizations in Kenya.
Using stepwise regression analysis, all the five independent variables of this study were
entered with each of the measures of firm performance into the regression model.
The general multiple regression model for this hypothesis was:
Y= β0+β1X1+β2X2+β3X3+β4X4+ β5X5 + ε
Where; Y=firm performance
β0=constant
βi is the coefficient for Xi ( i=1, 2,3,4,5)
X1=selective resourcing
X2=teams and decentralization

95
X3=extensive training
X4=sharing information
X5=incentives
ε = error term
Regression equations were first obtained using the standard beta coefficients on the line of
best fit, and then fitted parsimonious regression models for testing hypothesis 1. The
resulting regression equations summarized on Table 4.17 were:
i. Ysg =0.333X1 - 0.231X4 where Ysg is sales growth
ii. Ypp =0.252X4 where Ypp is perceived profitability
iii. Ypr =0.923X5 + 0.068X3 where Ypr is profitability ratio
Before the above multiple regression equations were made use of, it was necessary to
validate them with a test of significance of the overall regression. The F test was used for
this purpose and the regression models were found to be valid and significant as a whole:
i. (F (2,111) =8.861, p<0.001) when firm performance was measured as sales growth (see
Model 1, Appendix 4).
ii. (F (1,194) =13.210, p<0.001) when firm performance was measured as perceived
profitability (see Model 2, Appendix 5).

96
iii. (F (2,201) =1005.846, p<0.001) when firm performance was measured as profitability
ratio (see Model 3, Appendix 6).
Table 4.19: Regression Analysis results on the Relationship between SHRM and
Firm Performance
Dependent variable Predictor
Variable
Standardized
Coefficients Beta
R2 F Sig.
Sales growth X1
X4
.333
-.231
.138 8.861 .000b
Perceived
profitability
X4 .252 .064 13.210 . 000b
Profitability ratio X5
X3
.923
.068
.909 1005.846 . 000b
P<0.05
X1=selective resourcing
X3=extensive training
X4 =sharing information
X5=incentives on performance

97
Therefore, the decision rule is reject H0: β i =0 (i=1, 2, 3, 4, 5) if the regression coefficient
is significantly different from zero, and consequently accept the alternate hypothesis Ha: β i
≠0 (i=1, 2, 3, 4, 5).
The null hypothesis 1 (H01) was rejected since the standardized regression coefficients were
significant and statistically different from zero as indicated on Table 4.19.This implies that
SHRM (selective resourcing, extensive training, sharing information and incentives)
influence firm performance. However, no linear relationship was found to exist between
the use of teams and decentralization and firm performance. Use of teams and
decentralization was not statistically significant and thus not included as a predictor of firm
performance as the results of the regression analysis in this study indicates.
1. Discussion of Findings on the relationship between SHRM and Firm performance
The stated null hypothesis 1 in this study was; H01: Strategic human resource management
has no significant influence on firm performance of corporate organizations in Kenya. The
dimensions of SHRM that were considered by the research were: selective resourcing,
teams and decentralization, extensive training, sharing information and incentives on
performance. Firm performance was measured in terms of annual sales growth, perceived
profitability and profitability ratio for the past three years prior to this study. The multiple
regression analysis on Table 4.19 confirms a positive and significant linear relationship
between firm performance of Kenya’s corporate organizations and selective resourcing,
extensive training, sharing information and incentives. It is evident from Table 4.19 that the
best predictors of firm performance were the incentives and extensive training (beta value

98
of 0.923 and 0.068 respectively), and these two variables alone could explain up to 90.9%
of variation in firm performance (R2=0.909) when using profitability ratio as a measure of
performance. The research also applied t-test to each beta coefficients in the fitted
regression models in order to test whether selective resourcing, extensive training, sharing
information and incentives significantly contributed to the overall variance accounted by
regression. It was noted that incentives significantly contributed to variation in firm
performance, t=39.505 (see Model 3, Appendix VI). The findings after testing hypothesis 1
are as discussed below.
a) Selective resourcing and Firm Performance
The findings on Table 4.19 indicated that selective resourcing positively and significantly
influenced firm performance of corporate organizations in Kenya in the manufacturing
sector when measured as sales growth (β=0.333, p<0.001). For every unit increase in the
use of selective resourcing, there was a corresponding increase in firm performance (sales
growth) by 0.333.
The Pearson product moment correlation coefficient revealed a moderate, positive and
significant correlation between firm performance of corporate organizations in Kenya in
the manufacturing sector and selective resourcing (r=0.239, p-value=0.002) significant at
0.01 level of significance, when using sales growth as a measure of performance. Similarly,
the correlation analysis also indicated that there existed a positive and significant
relationship between profitability ratio and selective resourcing (r=0.248, p-value <0.001)
at 0.000 level of significance. The use of selective resourcing was positively and

99
significantly associated with other HRM practices (use of teams and decentralization,
information sharing and incentives on performance) as revealed by the results of the
correlation matrix on Table 4.16.
The empirical findings of this study indicated that selective resourcing influenced firm
performance of corporate organizations in Kenya in the manufacturing sector positively.
When a manufacturing organization in Kenya considered behavior and attitude during
selection of new employees as well as the alignment between these employees and the
manufacturing activities, firm performance increased. These results are consistent with
previous studies investigating the influence of HRM practices on overall firm performance.
The findings of a study conducted by Oya and Ayse (2006) to investigate the direct effect
between HRM practices and firm performance indicated that selective resourcing had
positive and significant effects on firm performance in their regression analysis. On a
bivariate level, firm performance was also positively related to the use of selective hiring in
their study.
The findings of this study indicated that selection criterion played a critical role in
implementing firm strategy in Kenya’s corporate organizations, and was designed to employ
people with desired skills and behaviors needed to match work with context and improve
performance. For instance, organizations like Metal Crowns Limited, Essential Limited and
Infusion Medicare Limited reported high mean scores of 4.4, 4.6 and 4.7 respectively for
selective resourcing and this showed that behavior and attitude as well as manufacturing and
human resource fit were considered by the manufacturing organizations in Kenya. These

100
empirical results identified that resourcing strategy played a significant role in enhancing
organizational performance of the manufacturing sector in Kenya and were consistent with
results from prior researches by Ahmad and Schroeder (2003) and Werber and DeMarie
(2005).
The findings of a positive and significant relationship between selective resourcing and firm
performance of Kenya’s corporate organizations in the manufacturing sector was an
indication that a firm requires talented and skilled workers to sustain high level of
performance as the organizations’ productivity and high performance depends on the
selection of the right candidates, which is also a pathway to reduced turnover. These results
are supported by Michie and Sheehan-Quinn (2001) who have identified a positive link
between hiring a manager and employees, and creation of the right culture for organizational
growth. During selection, the right person chosen for the requisite qualifications and
knowledge is placed in the appropriate job position to decrease the cost and maximize the
profits by means of their talent and merit. Cho.et al. ((2006) have identified that there is a
positive and significant relationship among HRM practices and selection is one of the
practices for improving financial or profit performance.
Manufacturing organizations in Kenya for instance, Highchem Limited and Paperbags
Limited reported a mean score of 4.8 and 4.9 respectively for selective resourcing confirming
positive impact of selection on firm performance in Kenya as these organizations strongly
agreed on this aspect. Similar results were reported by Wright, Snell and Dyer (2005) who
asserted that firm competitiveness can be enhanced by a high performance work system

101
(which incorporates selection) and that it has a positive relationship with organizational
effectiveness. A study by Huselid (1995) identified a link between HRM practices and firm
performance and he found that selective recruitment and selection of employee’s skills has a
positive impact on firm performance. In this study, selective resourcing was reported to have
had a significant association with firm performance and in agreement with this finding is
Huselid and Delery (1996) who contended HRM practices particularly selection, is
associated with perceived firm performance.
The majority of the respondents in this study agreed that the most important thing a
manufacturing organization in Kenya can do to improve individual performance is to learn to
recruit and retain more effectively. This meant taking steps to assess future people
requirements and to develop recruitment strategies and selection methods which would
ensure that the right quality of people joined and remained in the organization. Effective
recruitment and selection (selective resourcing) has a contribution to enhanced business
performance as illustrated in the foregoing findings of empirical studies. Patterson et al.
(1997) found that the acquisition and development of employees through selective resourcing
had a positive impact on a company’s productivity and profitability.
Storey and Sisson (2000) note that selective resourcing functions at different organization
stages, whereby an organization in its decline stage conducts little recruitment and selection.
There is less emphasis on resourcing for organizations in maturity stage as they encourage
sufficient turnover to minimize lay-offs and provide new openings. This implies that

102
organizations have life cycles and recruitment and selection vary according to an
organization’s perceived stage in the cycle.
Selective hiring is one of the most influential practices in Pfeffers best practice set. There is
growing empirical evidence suggesting people are the pre-eminent organizational resource
and the key to achieving outstanding performance. Pfeffer (2001) has made a case that firms
wishing to succeed in today’s global environment must make appropriate HR investments to
acquire and build employees who possess better skills and capabilities than their competitors.
The importance of ensuring the selection of the right people to join the workforce has
become increasingly apparent as the emphasis on people as the prime source of competitive
advantage has grown. Selective hiring is frequently included in the bundle of best HR
practices as it makes a contribution to enhanced business performance as illustrated by the
findings of empirical studies.
The results of this study revealed that recruitment and selection process was concerned with
identifying, attracting and choosing suitable people to meet an organization’s HR
requirements. The basis of recruitment and selection are the human resource requirements
that the organization strategies require. It matches available HR to jobs. The contribution of
effective recruitment and selection to enhanced organizational performance has been
illustrated by the findings of this empirical study which found out that the acquisition and
development of employee skills through use of sophisticated selection, induction, training
and appraisals have a positive impact on organization’s productivity and profitability in
Kenya’s corporate organizations in the manufacturing sector.

103
According to the findings of this study, the principal purpose of recruitment was to attract a
pool of suitable potential employees to apply for vacancies in the organization and then
identify the most suitable applicants through selection and persuade them to accept a position
in the organization. The selection process ideally involved mutual decision as reported by the
informants interviewed, and the organization decided whether to make a job offer and how
attractive the offer should be and the job candidate decides whether the organization and the
job offer fit his or her needs and goals. There was a desire for a multi-skilled, flexible
workforce and an increased emphasis on team working as illustrated by the correlation
analysis on Table 4.16 and this meant that selection decisions were concerned also with
behavior and attitudes.
The link between corporate strategy and HRM has led to the notion of strategic selection: a
system that links selection to the overall organizational strategy, and which aims to match the
flow of HR to emerging business strategies. If the manufacturing organizations in the country
were able to find and employ staffs who consistently fulfils their roles and are capable of
taking on increased responsibilities, they were immeasurably better placed to deal with the
opportunities and threats arising from their operating environment than competitors who are
always struggling to build and maintain their workforce.
b) Use of teams and decentralization and Firm Performance
The multiple regression analysis results of this research indicated that the use of team
activities to solve an organization’s problem and interaction facilitation did not influence

104
firm performance of corporate organizations in Kenya when measured as sales growth,
profitability ratio and perceived profitability. Use of teams and decentralization was not
statistically significant hence excluded as a predictor variable in the regression model as
indicated on Table 4.19, meaning that it had no significant relationship.
This finding is consistent to some extent with Oya and Ayse (2006) study where the use of
teams had no significant relationship with firm performance in the regression analysis results.
Interaction facilitation was found to have negative effects in performance in their study, and
the overall findings of their study was that the use of teams and decentralization is
significantly but negatively related to performance.
However, correlation analysis results on Table 4.16 indicated that the use of teams and
decentralization influenced firm performance of corporate organizations in Kenya. There was
a strong, positive and significant relationship between the use of teams and decentralization
and profitability ratio (r=0.549,p <0.001) and a weak but positive relationship
r=0.187,p=0.009) between use of teams and decentralization and perceived profitability, all
significant at 0.01 level of significance. These results were consistent with the correlation
analysis findings of Oya and Ayse (2006) study where firm performance was positively
related to use of teams and decentralization on a bivariate level. The correlation results
indicated that the use of teams and decentralization had a strong, positive and significant
relationship with extensive training, sharing information and incentives, but it had a
moderate, positive relationship with selective resourcing in Kenya’s manufacturing
organizations. For instance, BOC Kenya Limited and Kenya Pipeline Company Limited both

105
reported a mean score of 4.1 indicating that they agreed that use of team activities and
interaction facilitation influenced their performance positively.
Afrochem Products Limited and Holman Brothers Limited reported a relatively low mean
score of 2.0 and 1.5 respectively showing that many problems had not been solved using
small group sessions for the past three years. This is supported by the multiple regression
analysis findings of this study that use of teams and decentralization does not influence
performance of the manufacturing organizations in Kenya and is consistent with a key
finding of a study by Guest et al. (2000) who found out that one of the least extensive HR
practice was the use of problem solving teams in organizations. Moreover, a study by Hyde
et al. (2005) found little consistency in results, and the use of team working had non-
significant associations with performance.
For the relationship between interaction facilitation and firm performance of Kenya’s
manufacturing organizations, Brush Manufacturers Limited and Belfast Millers Limited both
reported a relatively high mean score of 4.5 and 4.6 respectively and this was consistent with
the correlation analysis results that found out that the use of teams was significantly
associated with performance. This finding is supported by one of the propositions made by
Purcell et al. (2003) as a result of their longitudinal research that commitment, motivation
and job satisfaction either together or separately, will be higher when people positively
experience the application of HR policies concerned with providing opportunities to
participate. The work of Purcell et al. (2003) indicates that having an opportunity to
participate enhances workers discretion and effort but team working may be undermined by
106
the use of individual performance related pay. Cordey (2003) quotes a number of studies in
which team working took place against a background of increased layoffs and reduced levels
of pay.
According to Armstrong (2009), a team is a small number of people with complementary
skills who are committed to a common purpose, performance goals and approach for which
they hold themselves mutually accountable. However, the finding of this study from the
interviews indicated that the use of teams in the manufacturing organizations in Kenya failed
to function effectively if: the atmosphere was strained or over formalized, the team
determined its own standards and norms which may not be in accord with the standards and
norms of the organization, there was little flexibility in which team members operate, people
tended to use a limited range of skills on specific skills or there is little evidence of multi-
skilling. The informants in this study, therefore, suggested that jobs should be defined and
roles described in ways that facilitate and underlie the importance of teamwork. The
organization should be designed and operated in such a way as to facilitate cooperation
across departmental or functional boundaries.
A study conducted by Crown and Rosse (1995) found that when group members received
individual goals, the group performed less well and were less motivated than when
employees received group goals. Group oriented goals were associated with more
cooperative strategies and better performance. Individual goals were associated with more
competitive strategies that interfered with the group’s ability to perform and reduced levels of
motivation.
107
According to Mueller and Proctor (2000), the concept of team working is very much linked
and is now seen as a central feature of HRM. Team working can mean different things in
different organizations and Geary (2003) argues that whilst research has found that a large
percentage of organizations were reporting the use of team working, only a small percent of
organizations seems to be allowing teams real autonomy, so the use of teams is fairly low,
with instances of semi-autonomous and self managing teams less apparent.
The findings of this study showed that the use of autonomous work teams and work groups in
the manufacturing organizations in Kenya had a positive impact on both levels of employee
motivation and performance but research by Condly et al. (1991) reveal work groups report
more favourable attitudes and that there were higher levels of turnover and absenteeism for
semi autonomous teams. So, while it is concluded that employees in groups were motivated,
caution is placed that the turnover and absence data may have illustrated some of the
pressures associated with autonomous work groups and which may ultimately become
demotivating.
The results of this study indicated that problem solving groups are generally designed for the
purpose of capturing ideas and solving production problems in Kenya’s manufacturing
organizations. They are more substantive in nature as they are integral to the job and part of
everyday working and the purpose of such groups is to solve quality or work related
problems and produce a solution to be the problem.

108
Direct participation is generally geared towards capturing the creativity of employees so that
organizational performance improves. One of the alternative work practices that was
identified by Godard (2004) is alternative job design practices including work teams
(autonomous or non-autonomous) and also formal participating practices including quality
circles in problem solving groups, meetings, team briefings and steering committees. Of
those practices, work teams and quality circles can be considered as the most central to high
performance.
The findings of this study demonstrated that the use of teams and decentralization as one of
the high performance work systems was highly idiosyncratic in corporate organizations in
Kenya and hence was tailored carefully to each firm’s individual situations to achieve
optimum results. However, there was not normally a direct financial reward for the solutions
and ideas generated by problem solving groups and teams as indicated by the respondents in
this study. Again, evidence from the sampled manufacturing organizations in Kenya showed
that these initiatives can be welcomed, but problems could emerge if groups felt that their
ideas were not listened to, or failed to be facilitated.
c) Extensive training and Firm Performance
According to the regression analysis findings of this study, a positive linear relationship
existed between extensive training and firm performance of Kenya’s manufacturing
organizations when measured as profitability ratio (see Table 4.19). Extensive training of
employees on multiple functions and on job skills increased an organization’s performance.
However, a unit increase in extensive training decreased a firm’s sales growth by 0.231.

109
Correlation analysis results on Table 4.16 revealed that there was a strong, positive and
significant relationship between extensive training and profitability ratio when used as a
measure of firm performance as r=0.0549,p<0.001 significant at level 0.000 of significance.
Similarly, extensive training had a positive, significant and strong relationship with the use of
teams and decentralization, sharing information and provision of incentives on performance
as the correlation analysis results illustrates.
Autosprings Manufacturers Limited reported a very high mean score of 4.9, indicating that
this organization strongly agreed that employees had skills that were above average, and
were regularly trained on job skills. These results provide empirical evidence that extensive
training was related with firm performance and is consistent with the findings of a study by
Oya and Ayse (2006) which found that training in multiple functions had positive and
significant effect on the performance of organizations and on a bivariate level, extensive
training was correlated with firm performance. Findings of previous studies by Lau and Ngo
(2004): Wimbush (2005) also indicate that there is a strong link between training and
organizational performance. These studies identified training efforts as one of the primary
factors to improve performance. The aim of training and development in the manufacturing
organizations in Kenya was to provide information and support that enabled employees to
overcome job related difficulties and achieve job performance.
The findings of this study revealed that training was one of the elements of HRM most
positively associated with performance of the manufacturing organizations in Kenya.
Similarly, the positive association between extensive training and profitability (financial
110
performance) of the manufacturing organizations in Kenya are in agreement with the results
of a study by Hyde et al. (2005). However, Godard (2004) suggests that cost considerations
can play a significant part as costs can reflect higher wages and more trainings, thus training
comes with a cost. Sung and Ashton (2004) argue that organizations that demonstrate a high
commitment to extensive training enables them achieve superior performance through their
people. In some of the manufacturing organizations in Kenya, for instance, in Complast
Limited, this is no small undertaking and they have created their own ‘universities’ where
training and learning, and ultimately being a learning organization are considered part of the
company’s competitive strategy. However, this level of expenditure is reserved for very large
organizations.
The results of this study that there existed a positive link between training and firm
performance of the manufacturing organizations in Kenya are consistent with the human
capital perspective. Human capital theory suggests that HR practices (among them extensive
training) can directly influence firm performance. People possess skills, knowledge and
abilities that provide economic value to firms. A firm’s investment to increase employee’s
skills, knowledge and abilities through extensive training carry both out-of-pocket and
opportunity costs, and they are only justified if they produce future returns via increased
productivity.
Provision of extensive training in Kenya’s manufacturing organizations helped employees to
acquire skills for work and different skills were required by employees who had to be
developed quickly to meet new demands and could not be acquired by relying on experience.

111
Employees were therefore trained on job skills by offering training that was relevant and
realistic as possible so that the skills learnt could be transferred. A study by West et al.
(2003) to establish the link between HR practices and business performance found that HR
practices explained significant variations in profitability and productivity. The acquisition
and development of employee skills was significant. Wright, Snell and Dyer (2005) asserted
that firm competitiveness can be enhanced by extensive training among other practices, and
that it has a positive relationship with organizational effectiveness. Training is the use of
systematic and planned instructional activities to promote learning, and is one of the several
approaches an organization can undertake to promote learning as it has a complementary role
to play in accelerating learning.
Training should be systematic in that it is specifically designed, planned and implemented to
meet defined needs. It should be provided by people who know how to train and the impact
of training should be carefully evaluated. Transfer of training is more likely if just in time
approach is used. According to Armstrong (2009), just in time training is closely linked to the
pressing and relevant needs of people by its association with immediate or imminent work
activities. It is delivered as close as possible to the time when the activity is taking place. The
training will be based on a identification of the latest required priorities and plans of the
participants who will be briefed in the live situations in which their learning has to be
applied. The training programme takes account of any transfer issues and aim to ensure that
what is taught is seen to be applicable in the current work situation.

112
A report by the Chartered Institute of Personnel Development (2006) indicates that the role
of formal training in organizations today appear to have declined significantly and on the job
training is the most effective way for people to learn in their organizations. This has been
occasioned by the fact that the speed with which skill requirements change in some sectors
means that formal, time consuming, class based learning fails to deliver efficiently as
required. Moreover, the growing recognition of human resource development as tool to
achieve competitive advantage has raised awareness of the need to embrace learning as a
central strategic concern and be part of the culture of the organization of which formal
training just one, often small component.
d) Sharing information and Firm performance
The regression analysis results of this study revealed that information sharing had an
influence on firm performance of Kenya’s manufacturing organizations when measured as
sales growth and profitability ratio. However, sharing company information influenced sales
growth negatively (see Table 4.19) but it positively influenced perceived profitability. Only
information sharing influenced firm performance when measured as perceived profitability.
For every unit increase in information sharing, there was a corresponding increase by 0.252
in perceived profitability when used as a measure of firm performance and a decrease of
sales growth by 0.231 when used as a measure of firm performance.
Correlation analysis on Table 4.16 indicated that a significant, positive and strong
association existed between sharing information and firm performance when using
profitability ratio as a measure of performance (r=0.575, p<0.001 at 0.000 level of
significant). Moreover, sharing information was positively and moderately related to

113
perceived profitability (r= 0.252, p<0.001 at 0.000 level of significant) when used as a
measure of firm performance. Further information from the correlation results revealed that
sharing information was strongly associated with incentives on performance but there
existed a weak relationship between sharing information and selective resourcing.
The findings of this study indicating that sharing information was positively correlated with
firm performance as well as the regression results that sharing information positively
influenced firm performance of the manufacturing organizations in Kenya are consistent
with the Hewitt Associates Best Employers study that indicates that leaders in best
Employer organizations take more time to communicate their goals and strategy, current
performance and progress to plan. They also found that such leaders created more
opportunities to talk informally with their people and to be personally accessible.
Organizations in their survey reported that their performance was significantly better than it
was three years ago by among other HR practices placing greater emphasis on propagation
of information among all staff about the organization’s goals, strategies, plans and
performance. One of principal uses of sharing information is to indicate training needs in
areas of performance where improvements would occur if appropriate training could be
given. An integrated and effective communication process about an employee’s
performance can lead to increased organizational performance and employee motivation. It
provides recognition for successful performance and provides guidance on what skills,
competences and behavior are required to meet expectations and this explains the positive
and significant relationship between sharing information and selective resourcing, use of

114
teams and decentralization and extensive training as indicated in the correlation analysis
matrix on Table 4.16.
The results of this study are in agreement with a study by West (2002) investigating the
links between specific HR practices and performance indicated that communication of
performance results had a very strong impact on performance and had the strongest
influence of all the HR practices. This confirms the findings of this study that
communication of company strategy to employees as well as providing performance
feedback positively influenced firm performance. This is because in order for people to
perform better, they must receive performance appraisal and performance review so that
they are motivated to work well.
For instance, Ken Aluminum Products Limited reported a mean score of 4.1 showing that
the organization agreed that it usually used sharing information .The findings indicated that
successful manufacturing companies in Kenya had a clear vision and a set of integrated
values which were embedded, measured and managed. They were concerned with
sustaining performance and flexibility. Majority of the respondents in this study agreed that
they always understood the long run competitive strategy, strategies and goals were
primarily communicated to them and information on productivity was readily available to
employees and all this played a crucial role in enhancing performance of their
organizations.
Performance goals can be achieved with the help of a high performance work system which
take into account the factors affecting individual performance and promote flexibility.

115
Boxall and Purcell (2003) argue that people perform well when their work environment
provides the necessary support and avenues for expression like the opportunity to be heard
when problems occur. This is achieved through sharing information which is concerned
with creating and transmitting information of interest and concern to employees.
These findings that sharing information had a positive linear relationship with performance
of manufacturing organizations in Kenya are supported by Stone (2002) who asserted that
in the competitive environment, organizations need to keep improving performance to
survive by providing feedback on individual performance. In addition, in the rapidly
changing environment and pressure for greater employee accountability the emphasis has
been to communicate to the employees on the goals, objectives, and strategy of the
organization as well as feedback on performance of their jobs and this has been confirmed
by the findings of this study. The respondents interviewed in this study argued that how
well employees were performing their jobs was done by being given feedback, and
suggestion of the employee past performance was due to how well a suitable HRM related
decisions was made.
Sharing corporate information is one of the beneficial HR practices as the results of this
study revealed. It is a signal that people are trusted with high level information about
strategy and performance and with such information; people are better informed to enable
them to make better decisions. The responses from the interviews conducted in this
research further revealed that there is an increase in the extent to which information is
shared with all employees, and top managers and senior managers are becoming active in

116
the communication process. Work forces in corporate organizations in Kenya that were
better informed with strategic information were hence more likely to be engaged and in
turn more likely to deliver superior performance. It is important to communicate
information to all members about the organization’s purpose, aspirations, strategy and
performance.
However, many systems in the corporate organizations in Kenya do not systematically
provide for line managers to communicate feedback on performance to those employees for
which they have responsibility and this may perhaps explain why sharing information
negatively influences sales growth in the regression results. This may be for many reasons
such as leadership style, protection of power bases or the information system not providing
data for management functions. Often, employees are provided with feedback typically
when performance has fallen below a certain acceptable level and managers are themselves
under pressure to improve performance. It is crucial that managers maintain a careful
balance in providing feedback as too frequent feedback can be perceived as indicative of
the lack of trust or respect. To promote a performance culture in the corporate
organizations in Kenya, management needs to define and communicate what it requires in
the shape of performance improvements, set goals for success and monitor performance to
ensure that goals are achieved. An organization should have a clear line of sight existing
between strategic aims of the organization, and those of its departments and its staff by
communicating its goals, objectives and strategies. Providing feedback on performance
leads to marked improvement in communication processes within the organization.

117
e) Incentives and Firm performance
Provision of incentives to employees to meet an organization’s objectives increased firm
performance of the manufacturing organizations in Kenya when measured as profitability
ratio as indicated by the regression analysis (see Table 4.19).For every unit increase in
incentives, there was a corresponding increase by 0.923 in profitability ratio when used as a
measure of firm performance of corporate organizations in Kenya.
The regression analysis results are consistent with the correlation analysis findings of this
study which indicated that there existed a very strong, significant and positive association
between incentives and profitability ratio (r= 0.951, p<0.001 significant at 0.000 level of
significant) in Kenya’s manufacturing organizations. However, a weak but positive
relationship (r=0.159, p=0.026 significant at 0.05 level of significance) existed between
incentives and perceived profitability when used as a measure of performance. Further
correlation analysis results revealed that incentives was strongly and positively correlated
with information sharing(r=0.597, p< 0.001), use of teams and decentralization (r=0.555,
p<0.001), extensive training (r=0.414, p<0.001), but moderately related with selective
resourcing (r=0.227, p<0.001),all at 0.000 level of significance. Therefore, these empirical
findings indicated that incentives to accomplish organization’s objectives positively
influenced firm performance of the manufacturing organizations in Kenya.
The informants of this study argued that in order for people to perform better, they must be
motivated to work and want to do it well. This is influenced by such factors as
communication of performance review and appraisal results and high compensation related

118
to performance. These findings are consistent with the results from a study by Boxall and
Purcell (2003) who found that people perform well when they have the motivation to do so
because they are adequately incentivized as performance goals are achieved with the help
of a performance contingent incentive compensation system.
BOC Kenya Limited and Kenya Industrial Plastics Limited reported a very high mean
score of 4.9 showing that they strongly agreed on the use of incentives to meet the
company’s objectives and suggested that performance related rewards target those who
meet the performance requirements. Indeed, incentive pay is one of Pfeffer’s best HR
practices set. Performance contingent incentive compensation is widely believed to
improve the performance of organizations. A Meta-analytic review by Condly et al. (2003)
on the use of incentives to motivate performance reported that the overall average effect of
all incentive programmes in all work settings and all work tasks was a gain in performance.
Team directed incentives had a markedly superior effect on performance compared to
individually directed incentives.
The majority of the informants interviewed revealed that the aim of valuing employees was
to enhance motivation and commitment by introducing policies and processes that ensure
people are recognized, valued and rewarded for what they do and achieve and for the levels
of skill and competence they reach. This confirmed the correlation analysis results that
incentives were positively associated with all other HRM practices in this study. Reward
system of the manufacturing organizations in Kenya affected work motivation that initiated
119
work related behavior while reward management ensured there was a contingent pay by
relating financial rewards to results, competence contribution, skill and effort.
Incentive pays systems aimed to impact on a firm’s performance of corporate organizations
in Kenya through its people. Incentives are an extrinsic motivator that can have an
immediate and powerful effect but will not necessary last long. Reward management
develops motivation and job-engagement by valuing people in accordance with their
contribution.
4.6.2 Test of Hypothesis 2
H02: A cost led human resource strategy has no significant moderating effect on the
relationship between strategic human resource management and firm performance of
corporate organizations in Kenya. A moderated multiple regression (MMR) model was
used to test the moderating effect of cost led HR strategy on the relationship between
SHRM and firm performance. A variable Z is a moderator of the relationship between
variables X and Y when this relationship depends on the value of Z. According to Aguins
and Pierce (1999) as cited by Njuguna (2008),using a moderated multiple regression to
estimate the effect of a moderator variable Z on the X-Y relationship involves a regression
equation that involves Y as a criterion, and X and Z as predictors. In addition, the
moderated multiple regression equation includes a third predictor consisting of the Z*X
product. This product term carries information regarding the X by Z interaction which is
the moderating effect of Z. Rejecting the null hypothesis (the coefficient of the product
term) that β iz=0 indicates the presence of a moderating or interaction effect.

120
The moderated multiple regression model (see Model 4, Appendix 7) for hypothesis 2 was:
Y= β0+β1X1+β2X2+β3X3+β4X4+ β5X5 + βzZ + β1z X 1Z+ β2z X 2Z+ β3z X 3Z+ β4z X 4Z + β5z
X 5Z + ε
Where Z= cost led HR strategy (moderator)
XiZ= interaction term of cost led HR strategy with the independent variables
Parsimonious regression models were fitted for testing hypothesis 2 using the beta
coefficients on Table 4.20, and the resulting regression equations for prediction purposes
were:
i. Ysg =0.331X1-0.234X3 where Ysg is sales growth
ii. Ypp =0.250X4 where Ypp is perceived profitability
iii. Ypr =0.919X5+0.071X3 where Ypr is profitability ratio
An F test was used to check the significance of these overall fitted general moderated
multiple regression models for testing hypothesis 2. The regression equations were found to
be valid and significant as a whole and the results were:
i. (F (2,109) =8.694, p<0.001) when firm performance was measured as sales growth (see
Model 5, Appendix 8).
ii. (F (1,192) =12.825, p<0.001) when firm performance was measured as perceived

121
profitability (see Model 6, Appendix 9).
iii. (F (2,199) =957.312, p<0.001) when firm performance was measured as profitability
ratio (see Model 7, Appendix 10).
Therefore, the decision rule is reject H0: β iz =0 (i=1, 2, 3, 4, 5) if the regression coefficient
of the interaction term is significantly different from zero, and consequently accept the
alternate hypothesis Ha: β iz ≠0 (i=1, 2, 3, 4, 5).

122
Table 4.20: Regression Analysis Results for the Moderating Effect of a Cost led
HR strategy
Dependent variable Predictor
variable(s)
Standardized
Coefficients Beta
R2 F Sig.
Sales growth X1
X3
.331
-.234
.138 8.694 .000b
Perceived
profitability
X4 0.250 .063 12.825 . 000b
Profitability ratio X5
X3
.919
.071
.906 957.312 . 000b
P<0.05
X1=selective resourcing
X3=extensive training
X4 =sharing information
X5 =incentives

123
2. Discussion of Findings for the Moderating Effect of a Cost led HR Strategy
The findings of this study indicated that there was no interaction effect of a cost led HR
strategy with any of the predictors (selective resourcing, teams and decentralization,
extensive training, sharing information and incentives on performance) that were fitted into
the regression model when using any of the measures of firm performance in this study.
The fitted regression models remained the same even after introducing the moderator into
the regression analysis as the fitted regression models illustrate. Consequently, the null
hypothesis that a cost led human resource strategy had no significant moderating effect on
the relationship between strategic human resource management and firm performance of
corporate organizations in Kenya was accepted.
The empirical results of this study indicate that a cost led HR strategy has no moderating
effect, but the non-zero beta coefficients for SHRM (see Table 4.20) indicate that selective
resourcing, extensive training, sharing information and incentives are significant in the
regression model. The value of R square (R²) when the moderator (cost led HR strategy)
was introduced in the regression model was not significantly different, suggesting that the
moderator does not have any influence on the relationship between SHRM and firm
performance of corporate organizations in Kenya in the manufacturing sector (see Table
4.19 : Table 4.20).
The findings of this study that a cost led HR strategy did not have any moderating effect in
corporate organizations in Kenya are consistent with prior researches. Budhar and Sparrow
(2002) found that a cost reduction HR strategy reduces personnel costs associated with

124
recruitment and selection; training and competitive pay to be lowest possible level and this
explains why there was no interaction of the moderator with the independent variables in
the regression model. Firms adopting a cost reduction HR strategy will require a utilization
HRM philosophy that will emphasize short term relationships, minimize training and
development and higher external pay comparability. The findings of this study from the
interviews indicated that the HR implications of adopting a cost led HR strategy in the
manufacturing organizations in Kenya was that there was minimum training, low employee
interaction, less attractive reward and the emphasis was on efficiency at the expense of
human resource.
According to Boxall and Purcell (2003) ,a firm adopting a cost led HR strategy design jobs
that are fairly repetitive, train workers as little as is practical, cut staff numbers to the
minimum, reward high output and predictable behavior. This confirms the failure of a cost
led HR strategy to interact with selective resourcing, use of teams and decentralization,
extensive training, sharing information and incentives on performance in Kenya’s
manufacturing organizations. Descriptive statistics of this study indicate that majority of
the organizations that were sampled agreed that these dimensions are present in their
organizations, with means ranging from 3.84-4.18 as indicated on Table 4.11. However,
these findings are in contrast with the results of a study by Chang and Huang (2005) who
found that a cost led HR strategy was significantly and negatively related to firm
performance as profitability declined when a firm focused on being the lowest price leader.

125
Corporate organizations in Kenya pursuing a cost led HR strategy placed an emphasis on
minimizing costs at all stages in the process, including people management. There were no
systems for independent worker voice or any evidence of high commitment HRM, no
recognition that employees should be provided with opportunities for learning and
development, pay levels were unlikely to be much above the minimum and there was likely
to be limited employee involvement and communications. These practices maximized
efficiency by providing means for management to monitor and control closely the activities
of employees. Sisson and Storey (2000) state that the key HR practice choices include: use
of ad hoc methods in resourcing, poor or non-existent training in specific immediate skills,
little or no communications and low pay levels and team working.
Schuler and Jackson (1987) outline a profile of expected employee role behaviors in a firm
adopting a cost led HR strategy. There is relatively repetitive and predictable behavior, a
rather short term focus, primarily autonomous or individual activity, moderate concern for
quality, high concern for results: low risk taking activity: relatively high desire of comfort
with stability. Therefore, such a firm is likely to have the following characteristics:
relatively fixed and explicit job descriptions that allow little room for ambiguity, narrowly
designed jobs and narrowly defined career paths that encourage specialization expertise and
efficiency, short term results oriented performance appraisals, close monitoring of market
pay levels for use in making compensation decisions and minimal levels of training and
development.
It is, therefore, evident from the foregoing discussion that there were tight controls,
overhead minimization and pursuit of economies of scales in Kenya’s manufacturing

126
organizations pursuing a cost led HR strategy, for instance, at Njimia Pharmaceuticals
Limited. This is because the primary focus is to increase productivity or output per person.
This can mean reduction in wage levels and number of employees.
4.6.3 Test of Hypothesis 3
H03: A quality led human resource strategy has no significant moderating effect on the
relationship between strategic human resource management and firm performance of
corporate organizations in Kenya.
The general moderated multiple regression equation (see Model 8, Appendix 11) for
hypothesis 3 was:
Y= β0+β1X1+β2X2+β3X3+β4X4+ β5X5 + βzZ + β1z X 1Z+ β2z X 2Z+ β3z X 3Z+ β4z X 4Z + β5z
X 5Z + ε
Where Z= Quality led HR strategy
XiZ= interaction term between quality led HR strategy with the independent
variables
The regression equations were obtained by fitting parsimonious regression models using
the standard beta coefficients on the line of best fit (see Table 4.21). The resulting
regression equations were:
i. Ysg =0.894X1q -0.635X4q where Ysg is sales growth
ii. Ypp =0.250X4 where Ypp is perceived profitability

127
iii. Ypr =0.915X5 + 0.0 67X3 + 0.059X1q where Ypr is profitability ratio
An F test was then made for checking the significance of the above overall regression
equations. They were found to be valid and significant as a whole, and the F tests results
were:
i. (F (2,109) =10.077, p<0.001) when firm performance was measured as sales growth
(see Model 9, Appendix 12).
ii.(F (1,192) =12.825, p<0.001) when firm performance was measured as perceived
profitability (see Model 10, Appendix 13).
iii. (F (3,198) =661.326, p<0.001) when firm performance was measured as profitability
ratio (see Model 11, Appendix 14).

128
Table 4.21: Regression Analysis Results for the Moderating Effect of a Quality led
HR strategy
Dependent variable Predictor
variable(s)
Standardized
Coefficients Beta
R2 F Sig.
Sales growth X1q
X4q
.894
-.635
.156 10.077 .000b
Perceived
profitability
X4 .250 .063 12.825 . 000b
Profitability ratio X5
X3
X1q
.915
.067
.059
.909 661.326 . 000b
P<0.05
X1q=interaction term between selective resourcing and a quality led HR strategy
X4q = interaction term between sharing information and a quality led HR strategy
X 3=extensive training
X4 =sharing information
X5 =incentives on performance

129
Therefore, the decision rule is reject H0: β iz =0 (i=1, 2, 3, 4, 5) if the regression coefficient
of the interaction term is significantly different from zero, and consequently accept the
alternate hypothesis Ha: β iz ≠0 (i=1, 2, 3, 4, 5).
The null hypothesis that a quality led human resource strategy had no significant
moderating effect on the relationship between strategic human resource management and
firm performance of corporate organizations in Kenya was rejected. This is because the
standardized regression coefficients for the product term which carried information about
the interaction between SHRM and firm performance were significantly and statistically
different from zero (Ha:Biz ≠0) as evident on Table 4.21.
3. Discussion of Findings for the Moderating Effect of a Quality led HR Strategy
The results of the regression analysis on Table 4.21 revealed that a quality led HR strategy
had a significant moderating effect on the relationship between strategic human resource
management and firm performance of the manufacturing organizations in Kenya. The was
an interaction term between a quality led HR strategy with selective resourcing (X1q), and
also an interaction effect between a quality led HR strategy with sharing information (X4q),
when sales growth was used as a measure of firm performance in this study. And when
profitability ratio was used as a measure of firm performance in this research, the
moderator (quality led HR strategy) also interacted with selective resourcing (X1q). The
coefficient of multiple determination (the R2 value), when a quality led HR strategy was
introduced in the regression model when using sales growth as a measure of firm
130
performance was statistically, significantly different (from 13.8% to15.6%) suggesting that
a quality led HR strategy moderated the relationship between SHRM and firm performance
(see Table 4.19 : Table 4.21). T-tests results on the models with the interaction terms
between quality led HR strategy and selective resourcing and sharing information show
both contributed significantly to the variation in firm performance (see Model 9,Appendix
12:Model 11,Appendix 14).Further, the results on Table 4.21 indicated that extensive
training and incentives on performance were significant in the regression models as they
had non-zero beta coefficients, but the influence of extensive training was very weak with a
beta coefficient of 0.067.
The empirical findings of this study that a quality led HR strategy moderated the
relationship between SHRM and firm performance of Kenya’s manufacturing organizations
are consistent with the results of Huang and Chang (2005) study that reported that a quality
enhancement HR strategy was significantly and positively related to firm performance. The
findings of their study indicated that profitability grew when a firm focused on producing
the best quality product or service.
The interaction between a quality led HR strategy and selective resourcing is consistent
with the results of firms such as Galaxy Paints and Coating Limited and East Africa
Spectre Limited who reported a mean score of 4.2 that they agreed they used selective
resourcing and also indicated that they pursued a quality led HR strategy. The findings
from the interviews on these manufacturing organizations in Kenya established that
organizations that had adopted quality enhancement HR strategy used sophisticated

131
methods of recruitment and selection and comprehensive induction and socialization. The
HR system in such was well staffed through the use of systematic recruitment, selection
and induction.
From the study findings, a unit increases in the interaction between sharing information and
quality decreases sales growth by 0.635 (see Table 4.21) may be attributed to the fact that
there was a high concern for quality in organizations pursuit a quality led HR strategy, as
opposed to the moderate concern for quantity. The goal was to produce goods of the
highest quality possible.
The study findings of this study were in agreement with Schuler and Jackson (1987) who
stated the expected employee role behavior for a firm adopting a quality led HR strategy:
relatively repetitive predictable behaviors, a more long term or immediate focus, a
moderate amount of cooperative interdependent behaviors, a high concern for quality, a
modest concern for quantity of output and a high concern of how goods are made and
delivered, low risk taking activity and commitment to the goods of the organization.
Organizations pursuing quality led HR strategy are likely to have the following
characteristics: a relatively fixed and explicit job descriptions, high levels of employee
participation in decisions relative to immediate work conditions and job itself, a mix of
individual and group criteria for performance appraisal that is mostly short term and results
oriented, relatively egalitarian treatment of employees and some guarantees of job security.
The results on Table 4.21 indicate that extensive training and incentives on performance
are significant in the regression model as they have non-zero beta coefficients. This can be

132
explained by literature that suggests that there is extensive and continuous training and
development and highly competitive pays benefits package as some of the HRM
implications for a quality led HR strategy. Output was more sensitive to variations in
human skills, knowledge and attitudes and skill acquisition and development were critical
to a successful quality HR strategy in the manufacturing organizations in Kenya.
Firms pursuing a quality led HR strategy for instance, Ritz Enterprises Limited, Androdovi
Chemicals Agencies Limited and Pembe Flour Mills Limited indicated that they considered
careful selection of good candidates based on personality rather than technical fit and the
ability of employees to work together in collaborative situations in order to acquire,
maintain and retain core competencies. Because a quality led HR strategy involves greater
employee commitment and utilization, fewer employees were needed to produce the same
level of output. As quality rises, so did demand, yet this demand could be met with
proportionate fewer employees than previous.
Pursuing a quality led HR strategy in Kenya’s manufacturing organizations involved
getting employees to be committed to quality and continuous improvement according to the
informants interviewed in this study. While the policy statements emphasized the total
quality approach were valuable, they were also followed up with specific HR practice:
feedback systems were in place, teamwork was permitted and facilitated, decision making
and responsibility were part of each employee’s job description, and job classifications
were flexible. These practices facilitated quality enhancement by helping to ensure highly
reliable behavior from individuals who could identify with the goals of the organization

133
and when necessary, be flexible and adaptable to new job assignments and technological
change. Sisson and Storey (2000) argue that an organization adopting a quality led HR
strategy has an extensive and long term focus on learning and career development and well
developed systems for employee voice and partnership arrangement.
The study established through the interviews that quality improvement in the
manufacturing sector in Kenya means changing the processes of production in ways that
require workers to be more involved and more flexible so that there is greater flexibility in
the use of production processes and employees. Employees gain greater opportunities to
learn new skills, they become more committed to the firm and hence are willing to give
more. The level of quality is likely to improve under these conditions.
4.6.4 Test of Hypothesis 4
The null hypothesis 4 of this study was H04: An innovation led human resource strategy has
no significant moderating effect on the relationship between strategic human resource
management and firm performance of corporate organizations in Kenya.
The general moderated regression model that was used to test hypothesis 4 (see Model 12,
Appendix 15) was:
Y= β0+β1X1+β2X2+β3X3+β4X4+ β5X5 + βzZ + β1z X 1Z+ β2z X 2Z+ β3z X 3Z+ β4z X 4Z + β5z
X 5Z + ε
Where Z= Innovation led HR strategy
XiZ= interaction term between innovation led HR strategy with the independent variables

134
Multiple regression equations were obtained by fitting parsimonious regression models
using the standardized beta coefficients on the line of best fit (see Table 4.22). The resulting
regression models for testing hypothesis 4 from this procedure were:
i. Ysg =0.3X1 -0.252i where Ysg is sales growth
ii. Ypp =0.250X4 where Ypp is perceived profitability
iii. Ypr =0.925X5 + 0.080X3 - 0.047X3i where Ypr is profitability ratio
An F test was then made for checking the significance and validity of the overall multiple
regression models before they were made use of. All the three above regression equations
were found to be valid and significant as a whole, and the F tests results were:
i. (F (2,109) =9.448, p<0.001) when firm performance was measured as sales growth
(see Model 13, Appendix 16).
ii.(F (1,192) =12.825, p<0.001) when firm performance was measured as perceived
profitability (see Model 14, Appendix 17).
iii. (F (3,198) =650.846, p<0.001) when firm performance was measured as profitability
ratio (see Model 15, Appendix 18).

135
Table 4.22: Regression Analysis Results for the Moderating Effect of an Innovation
led HR strategy
Dependent variable Predictor
variable(s)
Standardized
Coefficients Beta
R2 F Sig.
Sales growth X1
I
.300
-.252
.148 9.448 .000b
Perceived
profitability
X4 .250 .063 12.825 . 000b
Profitability ratio X5
X3
X3i
.925
.080
-.047
.908 650.846 . 000b
P<0.05
i =innovation led HR strategy
X3i = interaction term between extensive training and an innovation led HR strategy
X 1=selective resourcing
X 3=extensive training
X4 =sharing information
X5 =incentives on performance

136
Therefore, the decision rule is reject H0: β iz =0 (i=1, 2, 3, 4, 5) if the regression coefficient
of the interaction term is significantly different from zero, and consequently accept the
alternate hypothesis Ha: β iz ≠0 (i=1, 2, 3, 4, 5).
The null hypothesis that an innovation led human resource strategy had no significant
moderating effect on the relationship between strategic human resource management and
firm performance of corporate organizations in Kenya in the manufacturing sector was
rejected since there was an interaction term (X3i, i) in the regression models and the
coefficients of the moderator (i) and the product term (X3i) were significant and statistically
different from zero.
5. Discussion of Findings for the Moderating Effect of an Innovation led HR
Strategy
The findings of this study indicated that there was an interaction effect of an innovation led
HR strategy with extensive training, and also an innovation led HR strategy had a
moderating effect as a variable influencing firm performance negatively. The R2 value
when an innovation led HR strategy was introduced into the regression model when using
sales growth as a measure of firm performance was significantly different (from 13.8% to
14.8%) suggesting that an innovation led HR strategy moderated the relationship between
SHRM and firm performance (See Table 4.19 :Table 4.22). t tests results indicated that an
innovation led HR strategy and the interaction between an innovation led HR strategy and
with extensive training both contributed significantly to this variation in firm performance
(see Model 13,Appendix 16: Model 15:Appendix 18) Further regression analysis results
137
revealed that a unit increase of an innovation led HR strategy decreased sales growth by
0.252, and an interaction between an innovation led HR strategy with extensive training
also decreased profitability ratio by 0.047.
Prior research by Lau and Ngo (2004) found that the use of teams and decentralization is
not significantly related to innovation outcome and this is consistent with the finding of this
study since use of teams and decentralization was excluded as a predictor variable in Table
4.20. However, the finding that an innovation led HR strategy had a negative significant
influence on firm performance is inconsistent with the result of the study by Chang and
Huang (2005) who found an interactive effect between innovation strategy and SHRM. In
their study, a positive relationship existed along with significant variance in firm
performance. This contrast can be explained by the descriptive statistics on Table 4.9 as
well as information from the interviews which revealed that the majority of the
organizations indicated that they pursued a quality led HR strategy. The market
environment in the Kenya is quality oriented and not innovation oriented. Given a lack of
innovation in the market environment, an innovation led HR strategy has little or negative
impact on firm performance.
The focus of an innovation led the strategy of Kenya’s manufacturing organizations was
on core competencies and transferable skills and this required a realization of HRM
philosophy so as to bring out the best of existing staff with organizations selecting highly
skilled employees. The careful selection is meant to ensure appropriate skills, aptitude and
attitudes and recruit for innovative talent (specialists), ending up with a high percentage of

138
skilled employees displaying appropriate behaviors. This explains why selective resourcing
was significant in the regression model. It is imperative for an organization pursuing an
innovative led HR strategy to be the most unique producer, allow employees time to do
their own projects and encourage them to offer suggestions of doing their own jobs or
manufacturing products. This is supported by Schuler and Jackson (1987), who outlined the
expected role behavior for organizations pursuing an innovation led HR strategy: a high
degree of creative behavior, longer term focus, a moderate concern for quality, a relatively
high level of cooperative interdependent behavior, a moderate concern for quantity with an
equal degree of concern for process and results, a greater degree of risk taking and a higher
tolerance of ambiguity and unpredictability. These practices facilitate cooperative intended
behavior that is oriented towards the longer term and foster exchange of ideas and risk
taking. It therefore requires people to work differently which is the necessary ingredient.
The findings that the interaction between an innovation led HR strategy with extensive
training influenced firm performance of Kenya’s manufacturing organizations negatively
are in agreement with Delery and Doty (1996) who suggested that innovative organizations
provide only a small amount of informal training, and Sonnenfield and Peiperl (1998)
argue that due to the portability of skills, very little training and limited training programs
usually on the job should be provided by an organization. This could help explain why
profitability ratio in the manufacturing organizations decreased when an innovation led HR
strategy interacted with extensive training which comes along with cost when an
organization invests in training. This was supported by Schuler and Jackson (1987) argued
that extensive, multi skilling and cross functional training may prove to be economically

139
disastrous in innovative organizations as the organizations well trained employees leave to
join organizations which offer employment security and clear career paths. Morris and
Jones (1993) found that while training and development programmes in innovative
organizations were continuous or ongoing, they were also systematic and planned. The
emphasis on external competitiveness in pay might help retain employees but the costs of
doing so combined with extensive training is likely to provide a cost advantage to
competitors who have avoided these combinations.
According to this study, Kenya’s innovative organizations like Zedco Radiators and
Cooling Systems Limited, training is provided if necessary and it is the personal
responsibility to learn. The organization uses highly trained specialists but there is no
emphasis on extensive training hence the negative influence on firm performance when
innovation led HR strategy interacts with extensive training. Indeed, Schuler and Jackson
(1987) advocate for the acquisition of human resource with the needed skills rather than
internal development of employees by an organization. The study established that
manufacturing organizations in Kenya pursuing an innovative led HR strategy selected
highly skilled individuals, gave employees more discretion, used minimal controls, made a
greater investment in HR, provided more resources for experimentation allowing and even
rewarding occasional failure and appraised performance for its long run implications.
This research revealed that sharing information and incentives on performance were also
significant in the regression models in this study but there was no interaction effect. These
results are consistent with a study by Perk (1994) that found no significant association

140
between compensation systems and a strategy of innovation. From the study findings,
Kenya’s corporate organizations in the manufacturing sector pursuing an innovative led HR
strategy gave preference for informal communication system, advice and support for
employees. There were agreed performances outcomes with performance oriented demand
towards incentive. The emphasis was on both external equity, flexible and long term
incentives and internal equity with low pay rates but employees had greater say in deciding
the makeup of their pay packages. However, a focus on internal equity and low pay rates is
likely to neutralize the effects of sophisticated selection whether at the entry level or above,
as firms struggle to attract and retain the high quality employees they identify through the
hiring process. The feedback provided is evaluated and there are more sophisticated
programs, flexible rewards, skill based with gain sharing and flexible benefits.
Manufacturing organizations in Kenya pursuing a strategy of innovation indicated that they
placed less emphasis on results based bonuses or incentives which would penalize
employees for engaging in risk taking behaviors and adopted a behavior perspective The
logic is that since different firm strategies require different behaviors from employees, the
HR system must not only ensure that employees have the necessary skills but also motivate
the appropriate behavior.
It is imperative for an organization pursing an innovative led HR strategy to be the most
unique producer, allow employees time to do their own projects and encourage them to
offer suggestions of doing their own job or manufacturing projects. According to Schuler
and Jackson (1987), the expected role behavior for organizations pursuing an innovation
led HR strategy is: a high degree of creative behavior, longer term focus moderate concern

141
for quality, a relatively high level of cooperative interdependent behavior, a moderate
concern for quantity with an equal degree of concern for process and results, a greater
degree of risk-taking and a higher tolerance of ambiguity and unpredictability. These
practices facilitate cooperative intended of ambiguity and unpredictability. These practices
facilitate cooperative intended behavior that is oriented towards the longer term and foster
exchange of ideas and risk taking. It, therefore, requires people to work differently which is
the necessary ingredient.

142
CHAPTER FIVE
5.0 SUMMARY, CONCLUSIONS AND RECOMMENDATIONS
5.1 Introduction
This chapter provides a summary of the major findings of this study and also sets to draw
conclusions and make recommendations for practice and suggestions for further research
based on the results of this study.
5.2 Summary
The overall objective of this study was to determine the effect of competitive strategies on
the relationship between strategic human resource management and firm performance of
Kenya’s corporate organizations. In particular, the study sought to determine the influence
of SHRM on firm performance as well as to establish the moderating effect of a cost led
HR strategy, a quality led HR strategy and an innovation led HR strategy on the
relationship between SHRM and firm performance of Kenya’s corporate organizations in
the manufacturing sector.
Specific Objective 1: Determine the influence of SHRM on firm performance of corporate
organizations in Kenya.
The study established that strategic HRM was concerned in the organization’s decision
regarding resourcing, training and development ,reward and compensation, employee
relations, plans and procedures covering core functions and ensuring that they are designed
to enable the firm achieve and sustain competitive advantage. Regarding which HR

143
practices are relevant, literature often focuses on bundles of HR practices as determinants
of firm performances. The research attempted to establish whether five groups of HRM
practices adopted from Ahmad and Schroeder (2003) study influenced firm performance of
Kenya’s manufacturing organizations. The practices were: selective resourcing, use of
teams and decentralization, extensive training, sharing information and incentives on
performance. This study sought to determine if these HRM practices influenced firm
performance of corporate organizations in Kenya in the manufacturing sector.
Based on the findings of this study, firm performance of corporate organizations in Kenya
in the manufacturing sector, when measured in terms of sales growth, was positively
influenced by selective resourcing. The results indicated that success of any organization
depends on the quality of human resource and talents in that organization, and that is why it
is important to recruit and select the right staff. Selective resourcing is fundamentally about
matching human resource to the strategic and operational needs of the organization and
ensuring full utilization of those resources. It is concerned with not only obtaining and
keeping the number and quality of employees required, but also with selecting and
promoting people who fit the culture and the strategic requirements of the organization.
These resources must then be employed efficiently to drive optimum results. Selective
resourcing places more emphasis on finding people whose attitudes and behaviors are
appropriate and congruent with the aspirations of management and organization.
Manufacturing organizations in Kenya are today concentrating more on the attitudes and
behavioral characteristics of employees than on skills and knowledge per se.

144
Based on the correlation analysis results of this study, the use of teams and decentralization
had a strong, positive and significant association with firm performance of corporate
organizations in Kenya when measured in terms of profitability ratio, but had a weak
positive correlation with perceived profitability when used as a measure of firm
performance. However, no linear relationship was found to exist between the use of teams
and decentralization and firm performance of the manufacturing organizations in Kenya, as
it was not statistically significant in the regression model. Use of teams and
decentralization is one of the high performance work systems that is highly idiosyncratic
and must be tailored carefully to each firm’s individual situation to achieve optimum result.
The use of team activities like problem solving groups and interaction facilitation has
positive influence on organizational performance. On the other hand, the teams can fail to
function effectively in a strained atmosphere and some authors have argued that the use of
teams and decentralization is argued to be one of the least extensive HRM practice in
organizations. The non-existence of a linear relationship in the regression model between
the use of teams and decentralization and firm performance in the manufacturing
organizations in Kenya may be attributed to this aspect.
According to the results of this research, firm performance of the manufacturing
organizations in Kenya when measured in terms of perceived profitability, was positively
influenced by sharing information. However, this linear relationship was found to be weak
as the R square was 6.4%. Furthermore; a negative linear relationship existed between
sharing information and firm performance when measured in terms of sales growth.
Sharing information by communicating on organization’s strategic goals, vision, mission

145
and aspirations to the employees has been linked to performances. One of the beneficial
HRM practice is extensive sharing of corporate information. It facilitates understanding of
the long run competitive strategy, goals and objectives and provides feedback on
performance of employees.
Based on the findings of this study, incentives and extensive training had a strong influence
on firm performance when measured in terms of profitability ratio in corporate
organizations in Kenya. These two variables had significant and positive linear
relationships with profitability ratio, explaining 90.9% variation in firm performance
(R2=0.909). Incentives had a very stronger influence on firm performance than extensive
training as revealed by the results of the t test. This reveals that the incentive system of the
manufacturing organizations in Kenya was perceived to be fair and encouraged employees
to vigorously pursue its objectives, with a reward system recognizing the employees who
contribute the most to the company. The provision of incentives on performance has long
been the focus of researchers and practitioners dedicated to maximizing human
performance. Incentives can significantly increase work performance when they are
carefully implemented and the longer they are in place, the greater the performance gain
realized. Incentives should match rewards/ compensation with efforts in an equitable and
just manner, rewarding short as well as long term achievements, bearing in mind that
business must perform in the present to succeed in the future.
Additionally, extensive training of employees on multiple functions and on job skills was
required to sustain high levels of performance, by ensuring that everyone in the

146
manufacturing organizations in Kenya had the knowledge, skills and competencies required
to carry out their work effectively, and that people were developed in a way which
maximizes their potential for grown and promotion. Training is any learning activity which
is directed towards the acquisition of specific knowledge and skills for the purpose of an
occupation and task and it matches skills and competences with situational demands and
changes. Training effort has been identified as one of the primary factors to improve
organizational performance, with the aim being to provide information and support that
enable employees to overcome job related difficulties and achieve job performance.
Specific Objective 2: Establish the moderating effect of a cost led HR strategy on the
relationship between SHRM and firm performance of corporate organizations in Kenya.
One of the basic strategic options that an organization has in order to gain competitive
advantage is the use of a cost led HR strategy. An organization pursuing a cost led HR
strategy seeks to produce goods and services cheaper than the competition, with no frills
and places an emphasis on minimizing cost at all stages in the process including people
management. The HR implications for the cost led HR strategy are that recruitment and
selection is likely to be poor, low pay levels and limited employee involvement and
communications. These practices maximize efficiency by providing the means for
management to monitor and control closely the activities of employees. This research
sought to establish if this assertion held true.
Based on the findings of this study, a cost led HR strategy had no significant moderating
effect on the relationship between SHRM and firm performance of corporate organizations

147
in Kenya in the manufacturing sector. There was no interaction term between a cost led HR
strategy with selective resourcing, use of teams and decentralization, extensive training,
sharing information and incentives when using all the measures of firm performance in this
study (sales growth, perceived profitability and profitability ratio). The predicting power of
R square when cost led HR strategy was introduced in the regression model was not
statistically different. This implied that a cost led HR strategy did not have any moderating
effect on the relationship between SHRM and firm performance and therefore, the null
hypothesis (H0₂) was accepted. These results were in agreement with the HR implications
for the cost reduction HR strategy since all the sampled manufacturing organizations in
Kenya reported that on average, they agreed that they considered selective resourcing, use
of teams and decentralization, extensively trained their employees, shared information and
provided incentives on performance. Therefore, taking into consideration that these HRM
practices were provided for to some extent by all the manufacturing organizations in
Kenya that were sampled in this study, it was then unlikely that these practices would
interact with the moderator (cost led HR strategy)as they are the exact opposite of an
organization pursuing a cost led HR strategy. In fact, the study indicates that selective
resourcing, extensive training, sharing information and incentives were significant in the
regression model but did not interact with the cost led HR strategy.

148
Specific Objective 3: Determine the moderating effect of a quality led HR strategy on the
relationship between SHRM and firm performance of corporate organizations in Kenya.
The goal of an organization pursuing quality led HR strategy is to produce goods and
services of the highest quality possible to differentiate itself from competition. The HR
implications for a quality led HR strategy includes: systematic recruitment and selection,
empowerment and high discretion jobs, extensive and continuous training, key rule for
performance appraisal and close cooperation between HR and line managers and a
competitive pay and benefits package. A quality led HR strategy is likely to focus on the
delivery of added value through softer HR techniques and policies. This study sought to
determine if these HR implications held true for organizations pursuing a quality led HR
strategy.
Based on the results of this research, a quality led HR strategy moderated the relationship
between SHRM and firm performance of corporate organizations in Kenya in the
manufacturing sector. As evident in the regression models, there was an interaction term
between a quality led HR strategy with selective resourcing and also with sharing
information. The findings of this study indicated that firm performance of the
manufacturing organizations in Kenya increased when a quality led HR strategy interacted
with selective resourcing, and there was also a significant change in firm performance
when a quality led HR strategy interacted with sharing information. The value of R square
was significantly different following the interaction when a quality led HR strategy was
introduced into the regression model, and the regression coefficients of the product terms

149
were significantly different from zero. This led to the rejection of the null hypothesis that a
quality led HR strategy had no significant moderating effect on the relationship between
SHRM and firm performance of corporate organizations in Kenya.
The results of this study were in agreement that there is selective resourcing, extensive
training, sharing information and incentives on performance in accordance with the HR
implications for a quality led HR strategy. This is because although a quality led HR
strategy interacted with only selective resourcing and sharing information, extensive
training and incentives were still significant in the regression model and they had non-zero
beta coefficients. It was evident that majority of the manufacturing organizations in Kenya
pursued a quality led HR strategy and embraced selective resourcing, sharing information,
extensive training and the provision of incentives to maintain a quality enhancement
approach.
Specific Objective 4: Establish the moderating effect of an innovation led HR strategy on
the relationship between SHRM and firm performance of corporate organizations in Kenya.
The focus of an innovation led HR strategy is to produce and sell rapidly changing products
that differ from those of competitors designed by highly trained specialists. Organizations
adopting an innovation led HR strategy seek to reap the initially high profits associated
with customer acceptance of a new or greatly improved product. A firm pursuing an
innovation led HR strategy is likely to focus on core competencies and transferable skills,
agreed performance outcomes, provide training, give preference for informal
communication systems and give pay rates that tend to be low with a compensation system

150
that emphasizes internal equity. This research sought to determine if this assertion held
true.
Based on the findings of this study, an innovation led HR strategy had a moderating effect
as a variable and influenced firm performance of the manufacturing organizations in Kenya
negatively. The results of this research also revealed that there was an interaction effect
between an innovation led HR strategy and extensive training, which also had a negative
effect on Kenya’s manufacturing organizations’ firm performance. This could imply that an
innovation led HR strategy influenced performance of manufacturing organizations in
Kenya negatively and hence the null hypothesis that an innovation led the strategy had no
significant moderating effect on the relationship between SHRM and firm performance was
rejected. As evident from the fitted regression models, selective resourcing, sharing
information and incentives on performance were significant. Manufacturing organizations
in Kenya pursuing an innovation led HR strategy selected highly skilled employees,
emphasized on informal communication system, provided advice and support to employees
with performance oriented demand towards incentive.
An innovation led HR strategy negatively moderated the relationship between SHRM and
firm performance in this study. The implication was that performance declined for those
manufacturing organizations in Kenya pursuing an innovation led HR strategy, given that
the market environment in the country is not innovation oriented but quality focused.

151
5.3 Conclusions
Specific Objective 1: Determine the influence of SHRM on firm performance of corporate
organizations in Kenya.
Based on the results of this study, the adoption of strategic human resource management
practices by the majority of the manufacturing organizations in Kenya could be concluded
that these practices influence firm performance. Selective resourcing, extensive training,
sharing information and incentives had a positive and significant linear relationship on the
various measures of firm performance that were used in this study (sales growth,
profitability ratio and perceived profitability). Use of teams and decentralization correlated
with profitability ratio and perceived profitability. The multiple regression results of this
study indicated that there lacked a linear relationship between use of teams and
decentralization and firm performance. Use of teams’ activities and interaction facilitation
is a HRM practice that is expected to enhance organizational performance. However, use of
teams and decentralization is one of the high performance work system that is highly
idiosyncratic; it has been argued that all high performance work practices may be more
effective when they are grouped together in bundles, as opposed to this study when the
variable was treated in isolation because it is not as effective as when the practice is
supported by wider employee involvement and empowerment practice.
It could, therefore, be concluded that SHRM practices are important to ensure effective
strategy implementation, and they significantly influence firm performance of corporate
organizations in Kenya in the manufacturing sector. Intensive competition, shorter product
152
life cycle and volatile product and market environments have contributed to the complexity
faced by business. As a result, manufacturing organizations in Kenya constantly search for
new sources of competitive advantage, one of the most important being HRM that has the
potential to improve and sustain organizational performance and determine its fate. Human
resource management practices create procedures that constitute the building of employees’
knowledge and skills throughout the organization to promote valued and unique
organizations competencies which support competitive advantage.
Specific Objective 2: Establish the moderating effect of a cost led HR strategy on the
relationship between SHRM and firm performance of corporate organizations in Kenya.
The results of this research indicating the lack of an interaction term between a cost led HR
strategy with either selective resourcing, use of teams and decentralization, extensive
training, sharing information and incentives in Kenya’s manufacturing organizations is a
reflection that these HRM practices are in contrast with the implications of a cost led HR
strategy. Based on the findings of this study, it can, therefore, be concluded that majority of
the manufacturing organizations in Kenya sampled in this study lay more emphasis on
other aspects of their products but not the price and that irrespective of whether a cost led
HR strategy was being pursued or not, the HRM practices remained significant in
influencing firm performance. Selective resourcing, extensive training, sharing information
and incentives had a linear relationship with sales growth, profitability ratio and perceived
profitability. This could imply that they played a major role in influencing overall firm
performance. It is widely accepted that a company’s HRM practices should be matching to

153
the strategy of the whole company. This would help the organization achieve congruence
between the HRM practices and the competitive strategy chosen.
Specific Objective 3: Determine the moderating effect of a quality led HR strategy on the
relationship between SHRM and firm performance of corporate organizations in Kenya.
The existence of an interaction term between quality led HR strategy with the independent
variables in this study could imply this competitive strategy moderated the relationship
between SHRM and firm performance of the manufacturing organizations in Kenya.
Manufacturing organizations in Kenya pursuing a quality led HR strategy placed emphasis
on quality of their products, and employee played a major role in delivering this quality.
Based on the findings of this study, it can, therefore, be concluded that the relationship
between SHRM and firm performance of the manufacturing organizations in Kenya was
moderated by the interaction effect of a quality led HR strategy with selective resourcing
and sharing information; with extensive training and incentives remaining significant in
that relationship. These results are consistent with the HRM implication of a quality led HR
strategy. HRM implies that if people are considered and managed as valuable strategic
resources, an organization can achieve competitive advantage and as a consequence
demonstrate superior performance. The management of human resources should be
corresponding to the firm strategy as the goals and prerequisites of each of the strategy
profiles are different.

154
Specific Objective 4: Establish the moderating effect of an innovation led HR strategy on
the relationship between SHRM and firm performance of corporate organizations in Kenya.
An innovation led HR strategy moderated the relationship between SHRM and firm
performance of Kenya’s corporate organizations in the manufacturing sector, both as a
predictor variable and when it interacted with extensive training. The study results
indicated that this relationship was negative. In addition, selective resourcing, sharing
information and incentives were still significant in that relationship. This could imply that
manufacturing organizations in Kenya that implemented SHRM could perform better in an
innovation, oriented market environment. This may occur because SHRM promotes team-
based job designs, employee empowerment and incentive compensation which are essential
for facilitating innovation in organizations. Human resource management practices are
believed to facilitate innovative behaviors. It can, therefore, be concluded that an
innovation led HR strategy influenced firm performance of Kenya’s corporate
organizations in the manufacturing sector.
In conclusion, these diverse findings demonstrate that an organization’s mission and values
are expressed through its desired competitive strategy. This in turn leads to a set of required
employee behaviors, which would be reinforced by an appropriate set of HR practices. The
outcome of this would be desired employee behaviors that are aligned with the corporate
goals, thus demonstrating the achievement of a fit between HR strategies and business
strategies. It is assumed that business performance will improve when HR practices
mutually reinforce the choice of competitive strategy. The assumption of a close link

155
between business strategy and HRM practices underlines that HRM methods are selected in
accordance with the competitive strategy adopted and it is assumed that organizations that
coordinate their business strategy and HRM practices achieve better performance.
5.4 Recommendations
5.4.1 Recommendations for managerial
Strategic human resource management practices: selective resourcing, use of teams and
decentralization, extensive training, sharing information and incentives influence
organizational performance. The consideration of behavior and attitude and alignment of
HR with manufacturing activities of an organization, training on multiple skills and on job
skills, communication of strategy and feedback on performance as well as provision of
incentives contribute to sales growth, profitability ratio and perceived profitability of a
firm. This is considered as a significant practical insight for managers and the results of this
study have demonstrated that strategic HRM is crucial to the success of every organization
and part of an organization effort is to ensure efficiency and effective performance.
Strategic HRM must be involved in designing and implementing a set of internally
consistent HR practices that ensure that firm human capital contribute to achieving firm
business goals. The results of this study have helped to determine the crucial role of SHRM
and, therefore, recommend that organizations should focus on the use of SHRM as its
involvement is necessary to ensure that HR supports its mission. In addition, this study
recommends that organizations should increasingly recognize the role of HRM practices

156
and in particular, the HR as a legitimate business unit highly strategic in nature and critical
in achieving its objectives.
According to the results of this research, competitive strategies moderate the relationship
between SHRM and firm performance. Of interest are the different HRM implications
associated with each of the competitive strategies. The research then recommends that
organizations should diagnose their strategic needs and develop practical solutions for
achieving business goals by effectively fitting their competitive strategies to the HRM
practices present. With regard to this is the role that HR practitioners play in organizations
as the HRM practices are concerned. Thus, the study recommends organizations should
promote the HR practitioners to the strategic level, making them to be directly involved in
critical decision making and business strategy formulation from the beginning stage.
5.4.2 Recommendations for policy
The underlying assumption of SHRM is that firm performance is influenced by a set of
HRM practices, and for firm to compete effectively; they must constantly improve their
performance by reducing cost, enhancing quality and differentiating their product and
services. From the findings of this result, a quality led and innovation led HR strategies
influence the relationship between SHRM and firm performance. These competitive
strategies interact with the HRM practices differently as evident in the regression models.
These findings recommend that organizations should carefully consider the alignment
among HRM practices, as well as between the HRM practices and the competitive strategy
adopted so that they support and supplement one another. In addition, it is proposed that in

157
light of these findings, policy makers in organizations evaluate the HRM programs and
activities and the competitive strategy by the degree to which they contribute directly to the
accomplishment of an organization’s strategic goals and objectives.
5.4.3 Study’s contribution to theory
The findings of this research confirmed that SHRM in this study had five dimensions
(selective resourcing, use of teams and decentralization, extensive training, sharing
information and incentives on performance and they underlay a single main factor which
was SHRM, the independent variable of this study. The moderating variables of this study:
cost led HR strategy, quality led HR strategy and innovation led HR strategy converged to
the hypothesized model and,therefore,Schuler and Jackson’s (1987) strategic typology
could be used to measure competitive strategies of manufacturing organizations in Kenya.
This meant that although these HRM practices and competitive strategies were developed
using literature and theoretical context from the western developed countries, their items
converged very well to their respective dimensions and, therefore, the configurational
theory was applicable in the Kenyan context.
5.4.4 Suggestions for further research
The findings of this study provide empirical evidence that HRM practices and competitive
strategies influence firm performance. The bundle of HRM practices adopted for this study
included selective resourcing, use of teams and decentralization, extensive training, sharing
information and incentive. HRM practices are diverse and there is no standard way of
choosing a particular bundle. Successful firms create a bundle of employee practices to

158
reinforce the organizations strategic position. A study should be carried out to explore other
HRM practices which would provide a rich base for researchers to compare the results of
this study to determine if they will result to different effects on organizational performance.
Future studies could also shift the emphasis to single HR practices to derive more precise
evidence regarding the influence of SHRM and competitive strategies on firm performance.
This study attempted to clarify linkages between HRM practices and organizational
performance. Empirical review of past studies indicates that the importance of
systematically aligning HR practices and organizational success and strategy hasn’t been
well established empirically. The findings of this study have contributed to addressing this
gap and adding to the existing stock of knowledge in the literature of SHRM in developing
countries specifically in Kenya. Ideally, future studies should focus an addressing the
questions regarding which HRM practices diffuse more readily and why.
This research examined the moderating effect of three competitive strategies.Other studies
could be undertaken with researchers extending the scope of other moderating factors such
other strategic orientations, marketing characteristics and other contextual issues, as
theoretical models that incorporate contextual constructs could contribute further to an
understanding of how organizations employ SHRM effectively. Further research is,
therefore, recommended on the influence of other unexplored factors to further clarify the
determinants of firm performance that have not been addressed in this study. Such
clarification would provide additional valuable guidance to HR professionals and the
organizations as well.

159
REFERENCES
Ahmad, S., & Schroeder,G. (2003). The Impact of HRM Practices on Operational
Performance; Recognizing country and industry differences. Journal of Operations
Management. 21(1), 19-43.
Appelbaum, E., Bailey, T., Berg, P., & Kalleberg, A. (2000). Manufacturing Competitive
Advantage: The Effects of high performance work systems on plant performance and
company outcomes: New York: Cornell UN Press.
Armstrong, M.A. (2009).A Handbook of Human Resources Management. (11th
ed.).London: Kogan Page.
Bamberger,P.,& Meshoulam,H.(2000).Human Resource Strategy:
Formulation,Implementation and Impact. Sage: Beverly Hills.
Barney,J.(1995). Looking Inside for Competitive Advantage. Academy of Management
Executive. 9(4),49-61.
Barney, J. (2001).Is resource-based view a useful perspective for strategic management
research? Yes. Academy of Management Review. 26(1), 41-56.
Beardwell,J., & Claydon,T.(2007). Human resource Management. A Contemporary
Approach.(5th
ed.).Harlow:Pearson.
Becker, B.E., Huselid, M.A., & Urich, D. (2001). The Human Resource Scorecard: linking
People, Strategy and Performance. Boston: Harvard Business School Press.
Berg, B. (2001). Qualitative Research Methods for the Social Science (4th
ed.). Boston:
Pearson Education.
Boxall, P.,& Purcell, J. (2003). Strategy and Human Resource Management. London:
Macmillan.
Boxall, P.,& Purcell, J.(2008).Strategy and Human Resources Management. Basingstoke:
Palgrave Macmillan.
Colvin,A.(2001). How high performance HR practices and Workforce Utilization affect
Managerial Pay. Personnel Psychology.54, 908-934.
Cooke, F.,L., Shen, J., & McBride, A. (2005). Outsourcing Human Resource as a
Competitive Strategy. Human Resource Management Journal. 44(4), 413-432.
Corbetta, P. (2003). Social Research: Theory, Methods and Techniques. New Delhi: Sage
Publication.

160
Delery, J., & Doty, H. (1996). Modes of theorizing in Strategic Human Resource
Management:Tests of universalistic, contingency and configurationally performance
predictions. Academy of Management Journal. 39(4), 802-835.
Dess,G. & Robinson.(1984).Measuring Organizational Performance in the Privately held
Firms and Conglomerate Business Units. Strategic Management Journal.(15),119-34.
Dimba,B.,& K’obonyo,P. (2009). The Effect of SHRM practices on performance of
manufacturing MNCs in Kenya: A Moderating role of employee cultural
Orientations. Proceedings of the 10th
Annual Conference. IAABD.
Dyer, L. & Reeves, T. (2003). Human resource strategies and firm performance. The
International Journal of Human Resource Management. 6(3), 650-670.
Dyer,J.(2005).Human Resource Management: Evolving Roles and Responsibilities.
Washington DC:Bureau of National Affairs.
Edwards, T., & Rees, C. (2006). International Human Resource Management:
Globalization, National Systems and Multinational Companies. Harlow: Prentice
Hall.
Enz,C.,& Signaw,J.(2000). Best Practice in Human Resources. Cornell Hotel and
Restaurant. Administration Quartely.February, 48-61.
Finegold, D., & Frenkel, S. (2006). Managing people where people really matter. The
management of human resource in biotech companies. International Journal of
Human Resource Management. 17(1), 1-24.
Gathenya,J.(2012).Entrepreneurial Strategic Planning Practices and Firm Performance
Among Women Led Small and Medium Enterprises in Kenya. Jomo Kenyatta
University of Agriculture and Technology.Unpublished PhD Thesis.
Grant, R. (2008). Contemporary Strategy Analysis. (6th
ed.) Oxford : Blackwell.
Guest, D., Michie, J., Sheehan, M., & Conway, N. (2000). Employment Relations, Human
Resource Management and Business Performance. London: CIPD.
Guest ,D.(2001).Human Resource Management :When research confronts theory.
International Journal of Human Resources Management. 12(7), 1092-1106.
Guest, D. Michie, J., Conway, N., & Sheehan, M. (2003). Human resource management
and performance. British Journal of Industrial Relations, 4(2), 291-314.
Hoepful,M. (1997). Choosing Qualitative Research: A Primer for Technology Education
Researchers. Retrieved August 20,2011,from http: // www.qualitativeresearch.org/
161
Horngren, C. T., Foster, G., & Datar, S. M. (2000). Cost Accounting: Managerial
emphasis.New Delhi: Prentice-Hall.
Huang,G.,Roy,M.,Ahmed,Z.,Heng,J.,& Lim,J.(2002).Benchmarking the Human Capital
Strategies of MNCs in Singapore. Benchmarking. 9 (4), 357-373.
Huselid, M. (2005). The impact of human resource management practices on turnover,
productivity and corporate financial performance. Academy of Management Journal.
38(3), 635-672.
Iravo,M.,Namusonge,G., & Karanja,K.(2011). Role of Conflict management In
organizational Performance: A Survey of Educational Institutions in Machakos
County, Kenya. Journal of Human Resource and Entrepreneurship
Development.3(1) , 15-27.
Kelliher, C., & Perret, G. (2001). Business Strategies and approaches to HRM: A Case
Study of new developments in the UK restaurant industry. Personal Review, 30(4),
421-437.
Kenya Association of Manufacturers.(2011). Kenya Association of Manufacturers
Directory 2011. Nairobi: Kenya Association of Manufacturers.
Krishnaswamy, K., Sivakumar, A., Mathirajan, M. (2006).Management Research
Methodology. Integration of Principles,Methods and Techniques.New Delhi:Dorling
Kindersley.
Kothari, C.R. (2004) Research Methodology. Methods and Techniques. (2nd
ed.) New
Delhi: New Age International.
Lau,C.,& Ngo,H.(2004).The HR System,Organizational Culture and Product Innovation.
International Business Review.13, 685-703.
Legge, K. (2005). Human Resource Management Rhetoric and Realities. London: Palgrave
Macmillan.
Leung, A. (2003). Different ties for different recruitment practices of entrepreneurial firms
at different development phases. Human Resources Management Journal.42(4),
303-320.
Luoma,M.(2000). Investigating the Link between Strategy and HRD. Personnel Review.
29(6), 769-790.
MacDuffie, J. P. (2005). Human Resource bundles And Manufacturing Performance.
Industrial Relations Review. 48(2), 199-221.

162
Marchington, M., & Grugulis, I. (2000). Best Practice Human Resource Management:
perfect opportunity or dangerous illusions? International Journal of Human
Resource Management. 41(6),1029-1056.
Marchington, M., & Zagelmeyer, S. (2005). Foreword: Linking HRM and performance –a
never ending search? Human Resource Management Journal. 15(4), 3-8.
Marchington, M., & Wilkinson, A.(2008). Human Resource Management at Work: People
Management and Development. (4th
ed.). Harlow: Pearson Education.
Miller, L., Rankin. N., & Neathey ,F.(2001). Competency Framework in UK
Organizations. London : Thompson Learning.
Mugenda.O., & Mugenda. A. (2003). Research Methods: Qualitative and Qualitative
Approaches. Nairobi: Acts Press.
Mullins ,L. (2005). Management and Organizational Behaviuor. (7th
ed.).Edinburgh:
Prentice Hall.
Njuguna,J.(2008). Organizational Learning,Competitive Advantage and Firm
Performance. An Empirical Study of Kenyan Small and Medium sized Enterprises in
the Manufacturing Sector. Jomo Kenyatta University of Agriculture and
Technology.Unpublished PhD Thesis.
Noe,R.,Hollenbeck,J.,Gehart,B.,&Wright,P.(2003).HumanResourceManagement.Gaining a
Competitive advantage.(4th
ed.).Boston: McGraw-Hill.
Orodho,J. (2005). Elements of Education and Social Research. Research Methods. (1st
ed.).Nairobi: Masola.
Oya,E.,& Ayse,G.(2006). Relationships Between Huamn Resource Management
Practices,Business Strategy Fit and Firm Performance. Gebze Institute of
Technology.Turkey.
Pfeffer, J. (2001). Fighting the war for Talent is Hazardous for your Organization.
Stanford: Pearson Education.
Pfeffer,J.(1998). Seven Practices of Successful. Organizations.California Management
Review, 40(2), 96-124.
Porter,M.(1985). Competitive Advantage: Creating and Sustaining Superior Performance.
New York: Free Press.
Powell,T.(1992). Organizational Alignment as Competitive Advantage. Strategic
Management Journal. 13, 119-34.

163
Purcell,J.(2001). The Meaning of Strategy in Human Resource Management :A Critical
Text.(2nd
ed.). London: Thompson Learning.
Purcell, J., Hutchinson, S., Kinnie, S. (2003).Understanding the Role and Performance
Link: Unlocking the Black Box. London: CIPD.
Purcell, J., Hutchinson, S. (2007). Frontline managers as agents in the HRM-performance
causal chain: theory analysis and evidence. Human Resource Management Journal.
17(1), 3-20.
Redman, T., &Wilkinson, A. (2006). Contemporary Human Resource Management: Texts
and Cases. (eds.) Harlow: Pearson Education.
Robinson,R.,Pearce,J.,& Mital, A.(2008). Strategic Management: Formulation,
Implementation and Control. New Delhi; McGraw Hill Education.
Rutherfold,M., Buller P., & McMillan, P.(2003). Human resource management over the
life cycle of small to medium-sized firms. Human Resource Management Journal.
23 (8), 769-780.
Sanz-Valle, R., Sabater-Sanchez,R., & Aragon–Sanchez, A. (2000). A human resource
management and business strategy links: an empirical study. International Journal
of Human Resource Management. 10(4), 655-671.
Scholes, K., & Johnson, G. (2007). Explaining Corporate Strategy. Hempstead: Prentice
Hall.
Schuler, R., & Jackson S. (1987). Linking competitive strategies with human resources
management practices. Academy of Management Executive . 9(3), 207-219.
Schuler,S.,Dolan,S.,& Jackson,S.(2001).Introduction. International Journal of
Manpower.22,195-197.
Schuler, R., Jackson, S., & Storey, J. (2001).HRM and Link with Strategic Management.
(2nd
ed.). London: Thomas Learning.
Sekaran, U. (2003). Research Methods for Business. A Skills Building Approach New
York: John Wiley & Sons.
Selvaragm,T.(2007). The role of Human Capital in Promoting firm Iinnovativeness and
Performance.Test of a causal model. International Journal of Human Resource
Management. 18(8), 1456-1470.
Storey, J., & Sisson, K. (2000). The Realities of Human Resources Management. Milton
Keynes: Open University Press.

164
Storey, J. (2007). Human Resource Management: A Critical Text. (3rd
ed.). London:
Thomson.
Ulrich , D., & Brockbank, W.(2005).The Human Resources Value Proposition. Boston:
Harvard Business School Press.
Wan- Jing, C., & Tung, H. (2005). Relationship between strategic HRM and firm
performance: A contingency perspective. International Journal of Manpower. 26
(5).
Werber,J.,& DeMarie,S.(2005).Aligning Strategic HRM and Person-Environment
Fit.Human Resource Review,15,242-262.
Witteloostuijn,A., & Heijltjesa,M.(2003). Configuration of Market
Environments,Competition Strategies,Manufacturing Technologies and Human
Resource Management policies. Journal of Management.19, 31-62.
West, M., Borrill, C., Dawson, J., Scully, J., Carter, M., Patterson, M., & Waring, J. (2002).
The link between the management of employees and patient mortality in acute
hospitals. International Journal of Human Resource Management, 13(8). 1299-1310.
Wright, P., Gardner, T., Moynihan, L., & Allen, M.(2005). The relationship between HR
practices and firm performance: examining causal order. Personnel Psychology
Journal. 58(2), 409-446.
Youndt,M.,Subramaniam,M.,& Snell,S.(2004).Intellectual Capital Profiles. An
Examination of Investments and Returns. Journal of Management Studies.41 (2),
335-361.

165
APPENDICES
APPENDIX 1: SURVEY QUESTIONNAIRE
Please answer all questions by writing a tick (√) in the box that closely matches your view or
alternatively; please write in the space provided. Thank you for participating in this academic
research.
Part A: Personal Details
1. Job Title: HR Manager
Others…………………………………… (Specify)
2. The number of years you have worked for the company………………………………
3. Would you like to get a copy of the research findings? Yes
No
Part B: Organizational Data
1. Kindly tick the ownership status of your company:
Locally owned by an individual
Partnership
Locally owned by religious organizations and other groups
Foreign owned
Others…………………………………………………..(Specify)
2. What is the number of full time employees in your company?.......................................
3. The number of years your company has been operating in Kenya? ………………………

166
4. Please tick the subsector your company belongs to.
Building, Construction and Mining
Chemical and Allied
Energy, Electrical and Electronics
Food and Beverage
Leather and Footwear
Metal and Allied
Motor Vehicle and Accessories
Paper and Board
Pharmaceutical and Medical Equipment
Plastic and Rubber
Textiles and Apparels
Timber, Wood and Furniture
5. (a) What was your company sales growth in percentage (%) in the following years?
2009…………….. 2010………………… 2011…………………
(b) Please indicate the numbers in the following aspects of your company for the past
three years:
Aspect 2009 2010 2011
No. of employees
No. of branches

167
No. of products
Market share
Annual running expenditure
6. (a) What was the position of your company’s profitability in the past three years?
(Profit =Income – Expenses)
2009…………………………………………….
2010…………………………………………….
2011……………………………………………..
(b) How satisfying was your company’s overall profitability in the following years?
Year Very
dissatisfying
Dissatisfying Neutral Slightly
satisfying
Very
satisfying
2009
2010
2011
(c) What was your company’s Profit ratio for the past three years?
(Profitability ratio = Profit x 100)
Capital
2009……………….. 2010…………………………. 2011………………..

168
7. Please tick the statement that best describes the significant competitive strategy usually
pursued by your company:
You provide products at a cost below what your competitors can achieve, with no
frills and placing an emphasis on minimizing costs at all stages in the process including
management of employees.
You continuously improve the quality of your products, produce goods of the highest
quality possible to differentiate yourself from the competition, placing an emphasis on
skill acquisition and development of employees.
You produce and sell rapidly changing products that differ from those of competitors
designed by highly trained specialists.
8. What is the position of your company in linking its competitive strategy (chosen above
in question 7) to the following HRM practices?
HRM Practice Very
unimportant
Unimportant Neutral Important Very
important
Selective resourcing
Training extensively
Use of teams activities
Sharing information
Incentives on performance
9. How effective are the following when integrated with your company’s competitive
strategy (chosen above in question 7)?
HRM Practice Very
ineffective
Ineffective Neutral Effective Very
Effective
Selective resourcing

169
Training extensively
Use of teams activities
Sharing information
Incentives on
performance
10. How important are the following in your target market?
Aspect Very
unimportant
Unimportant Neutral Important Very
Important
Price of your products
Quality of your products
Innovation in your products
11. (a) Please give your opinion on how the following are provided by your company?
Opinion Statement Strongly
disagree
Dis
Agree
Neutral Agree Strongly
agree
Attitude/desire to work always used as a criteria in
employee selection
Problem solving aptitude always used as a criteria in
employee selection
In selection of employees, you usually consider those who
can provide ideas to improve the manufacturing process
Work values and behavior attitude oftenly used as criteria
in employee selection

170
Usually select employees who are able to work in small
groups
During problem solving sessions, you always make an
effort to get all team members opinions and ideas before
making a decision
In the past 3 years, many problems have been solved using
small group sessions
Problem solving teams have not always helped to
improve performance
Supervisors oftenly encourage persons to work as a team
Supervisors frequently hold group meetings where people
discuss things together
(b)Please give your opinion on the following statements as relates to your company.
Opinion Statement Strongly
disagree
Dis
agree
Neutral Agree Strongly
agree
Company always has a low skill level compared to the industry
Employees usually lack important skills
Employees always have skills that are above average in the
industry
Management usually believes that continual training and
upgrading of employees skills is important

171
Give any other unique practice(s) that is provided by your company besides the ones
mentioned above………………………………………………………………...............
………………………………………………………………………………………………
……………………………………………………………………………………………
12. Suggest ways of enhancing the performance of your company………………………….
………………………………………………………………………………………………
………………………………………………………………………………………………
……………………………………………………………………………………………….
THANK YOU!
Employees receive training and development in workplace skills
on a regular basis
Goals, objectives and strategies are a usually communicated to
you
You always understand the long run competitive strategy
Strategies and goals are usually communicated primarily to
managers
Information on productivity is readily available to employees
Your manager never comments about the quality of your work
Incentive system of your company encourages you to vigorously
pursue its objectives
Incentive system is always fair at rewarding employees who
accomplish company objectives
Reward system usually recognizes the employees who
contribute the most to the company

172
APPENDIX 2: INTERVIEW GUIDE
1. Which HRM practices are present in your organization?
2. Would you attribute performance of your organization to only Strategic HRM
Implementation ?
3. From which stage is the HR manager involved in business strategy planning?
4. How important is the cost/quality/innovation of your products in the target market?
5. To what extent does your organization link its competitive strategy to the
HRM practices present in the organization?
6. Is your organization in pursuit of more than one competitive strategy?
7. Which indicators are mostly used to measure performance of your organization?
8. Overall, to what extent are you satisfied with your organization’s performance in the
past three years?
9. Suggest ways of enhancing the performance of your organization.
173
APPENDIX 3: LETTER OF INTRODUCTION
I am PhD student at Jomo Kenyatta University of Agriculture and Technology, Department
of Entrepreneurship and Procurement. The title of my study is: Effect of Competitive
Strategies on the Relationship between Strategic Human Resource Management and Firm
Performance of Kenya’s Corporate organizations. The study seeks to investigate the effect
of: a cost led HR strategy, a quality led HR strategy and an innovation led HR strategy on
the relationship between Strategic HRM and firm performance.
As part of the PhD program requirement, I am supposed to collect data and would be
grateful if you could consent to participate in this survey, through filling the questionnaire
provided. The information provided will only be used for academic purposes only and will
be treated with uttermost confidentiality.
Thank you for consenting to participate in this study.
Yours Sincerely,
Esther Wangithi Waiganjo
HD412-1050/2009
Jomo Kenyatta University of Agriculture & Technology,
School of Human Resource Development,
Entrepreneurship & Procurement Department.

174
APPENDIX 4: MODEL 1- MULTIPLE REGRESSION MODEL FOR SHRM AND
FIRM PERFORMANCE (SALES GROWTH)
Model Summary for SHRM and Sales Growth
Model R R Square
Adjusted R
Square
Std. Error of the
Estimate
1 .293a .086 .078 1.31224
2 .371b .138 .122 1.28036
a. Predictors: (Constant), Selective resourcing
b. Predictors: (Constant), Selective resourcing ,Sharing information
ANOVAc
Model
Sum of
Squares Df Mean Square F Sig.
1 Regression 18.156 1 18.156 10.544 .002a
Residual 192.862 112 1.722
Total 211.018 113
2 Regression 29.053 2 14.527 8.861 .000b
Residual 181.964 111 1.639
Total 211.018 113
a. Predictors: (Constant), Selective resourcing
b. Predictors: (Constant), Selective resourcing ,Sharing information
c. Dependent Variable: Sales Growth

175
Coefficients
Model
Unstandardized
Coefficients
Standardized
Coefficients
T Sig. B Std. Error Beta
1 (Constant) .299 .623 .480 .632
X1 .517 .159 .293 3.247 .002
2 (Constant) 2.245 .969 2.317 .022
X1 .587 .158 .333 3.719 .000
X3 -.533 .207 -.231 -2.578 .011
a. Dependent Variable: Sales Growth

176
APPENDIX 5: MODEL 2- MULTIPLE REGRESSION MODEL FOR SHRM AND
FIRM PERFORMANCE (PERCEIVED PROFITABILITY)
Model Summary for SHRM and Perceived Profitability
Model R R Square Adjusted R Square
Std. Error of the
Estimate
1 .252a .064 .059 .60966
a. Predictors: (Constant), Sharing information
ANOVAb
Model
Sum of
Squares Df Mean Square F Sig.
1 Regression 4.910 1 4.910 13.210 .000a
Residual 72.108 194 .372
Total 77.018 195
a. Predictors: (Constant), Sharing information
b. Dependent Variable: Perceived Profitability

177
Coefficientsa
Model
Unstandardized
Coefficients
Standardized
Coefficients
T Sig. B Std. Error Beta
1 (Constant) 2.986 .319 9.361 .000
X4 .273 .075 .252 3.635 .000
a. Dependent Variable: Perceived Profitability
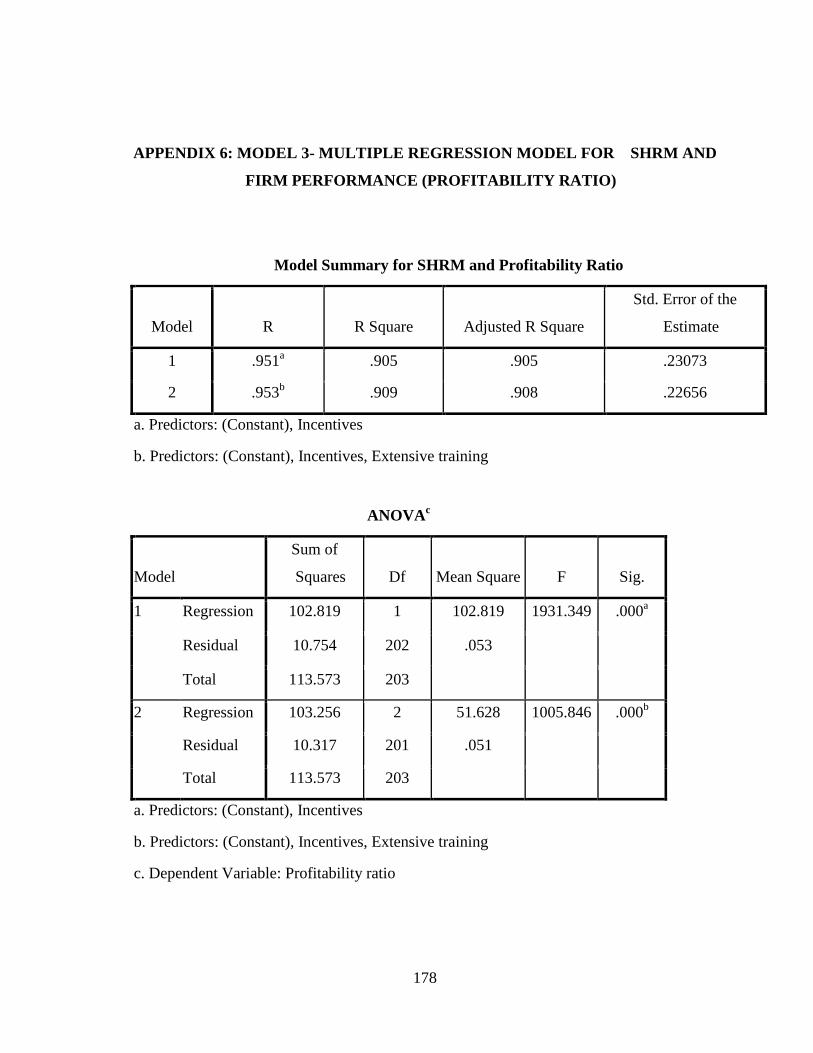
178
APPENDIX 6: MODEL 3- MULTIPLE REGRESSION MODEL FOR SHRM AND
FIRM PERFORMANCE (PROFITABILITY RATIO)
Model Summary for SHRM and Profitability Ratio
Model R R Square Adjusted R Square
Std. Error of the
Estimate
1 .951a .905 .905 .23073
2 .953b .909 .908 .22656
a. Predictors: (Constant), Incentives
b. Predictors: (Constant), Incentives, Extensive training
ANOVAc
Model
Sum of
Squares Df Mean Square F Sig.
1 Regression 102.819 1 102.819 1931.349 .000a
Residual 10.754 202 .053
Total 113.573 203
2 Regression 103.256 2 51.628 1005.846 .000b
Residual 10.317 201 .051
Total 113.573 203
a. Predictors: (Constant), Incentives
b. Predictors: (Constant), Incentives, Extensive training
c. Dependent Variable: Profitability ratio

179
Coefficientsa
Model
Unstandardized
Coefficients
Standardized
Coefficients
T Sig. B Std. Error Beta
1 (Constant) .135 .090 1.494 .137
X5 .970 .022 .951 43.947 .000
2 (Constant) -.106 .121 -.875 .383
X5 .941 .024 .923 39.505 .000
X3 .086 .030 .068 2.918 .004

180
APPENDIX 7: MODEL 4- MODERATED MULTIPLE REGRESSION MODEL
FOR SHRM, COST LED HR STRATEGY AND FIRM PERFORMANCE
Y= β0+β1X1+β2X2+β3X3+β4X4+ β5X5 + βzZ + β1z X 1Z+ β2z X 2Z+ β3z X 3Z+ β4z X 4Z + β5z
X 5Z + ε
Where; Y=firm performance (Sales Growth, Perceived Profitability, Profitability Ratio)
β0=constant
βi is the coefficient for Xi ( i=1, 2,3,4,5)
X1=selective resourcing
X2=teams and decentralization
X3=extensive training
X4=sharing information
X5=incentives
Z= cost led HR strategy (moderator)
ε = error term
XiZ= Product term / interaction term of a cost led HR strategy with each of the
independent variables(x1,x2x3,x4,x5)

181
APPENDIX 8: MODEL 5-MODERATED MULTIPLE REGRESSION MODEL
FOR SHRM, COST LED HR STRATEGY AND FIRM PERFORMANCE
(SALES GROWTH)
Model Summary for SHRM, Cost led HR strategy and Sales Growth
Model R R Square
Adjusted R
Square
Std. Error of the
Estimate
1 .291a .084 .076 1.27709
2 .371b .138 .122 1.24519
a. Predictors: (Constant), Selective resourcing
b. Predictors: (Constant), Selective resourcing, Extensive training
ANOVAc
Model
Sum of
Squares Df Mean Square F Sig.
1 Regression 16.558 1 16.558 10.153 .002a
Residual 179.406 110 1.631
Total 195.964 111
2 Regression 26.961 2 13.480 8.694 .000b
Residual 169.004 109 1.550
Total 195.964 111
a. Predictors: (Constant), Selective resourcing
b. Predictors: (Constant), Selective resourcing, Extensive training
c.Dependent Variable: Sales Growth

182
Coefficientsa
Model
Unstandardized
Coefficients
Standardized
Coefficients
T Sig. B Std. Error Beta
1 (Constant) .339 .606 .560 .577
X1 .495 .155 .291 3.186 .002
2 (Constant) 2.241 .943 2.378 .019
X1 .563 .154 .331 3.663 .000
X3 -.521 .201 -.234 -2.590 .011
a. Dependent Variable: Sales Growth

183
APPENDIX 9: MODEL 6-MODERATED MULTIPLE REGRESSION MODEL
FOR SHRM, COST LED HR STRATEGY AND FIRM PERFORMANCE
(PERCEIVED PROFITABILITY)
Model Summary for SHRM, Cost led HR strategy and Perceived Profitability
Model R R Square Adjusted R Square
Std. Error of the
Estimate
1 .250a .063 .058 .60764
a. Predictors: (Constant), Sharing information
ANOVAb
Model
Sum of
Squares Df Mean Square F Sig.
1 Regression 4.735 1 4.735 12.825 .000a
Residual 70.891 192 .369
Total 75.627 193
a. Predictors: (Constant), Sharing information
b. Dependent Variable: Perceived Profitability

184
Coefficientsa
Model
Unstandardized
Coefficients
Standardized
Coefficients
T Sig. B Std. Error Beta
1 (Constant) 3.005 .318 9.447 .000
X4 .269 .075 .250 3.581 .000
a. Dependent Variable: Perceived Profitability
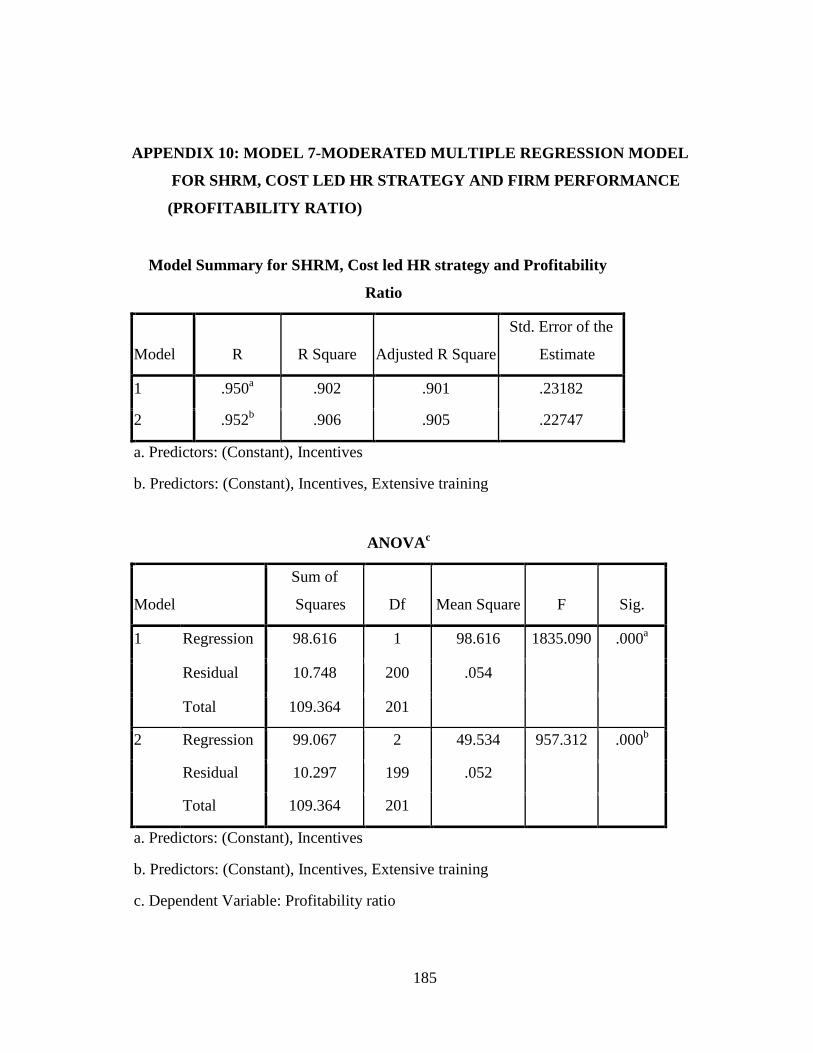
185
APPENDIX 10: MODEL 7-MODERATED MULTIPLE REGRESSION MODEL
FOR SHRM, COST LED HR STRATEGY AND FIRM PERFORMANCE
(PROFITABILITY RATIO)
Model Summary for SHRM, Cost led HR strategy and Profitability
Ratio
Model R R Square Adjusted R Square
Std. Error of the
Estimate
1 .950a .902 .901 .23182
2 .952b .906 .905 .22747
a. Predictors: (Constant), Incentives
b. Predictors: (Constant), Incentives, Extensive training
ANOVAc
Model
Sum of
Squares Df Mean Square F Sig.
1 Regression 98.616 1 98.616 1835.090 .000a
Residual 10.748 200 .054
Total 109.364 201
2 Regression 99.067 2 49.534 957.312 .000b
Residual 10.297 199 .052
Total 109.364 201
a. Predictors: (Constant), Incentives
b. Predictors: (Constant), Incentives, Extensive training
c. Dependent Variable: Profitability ratio
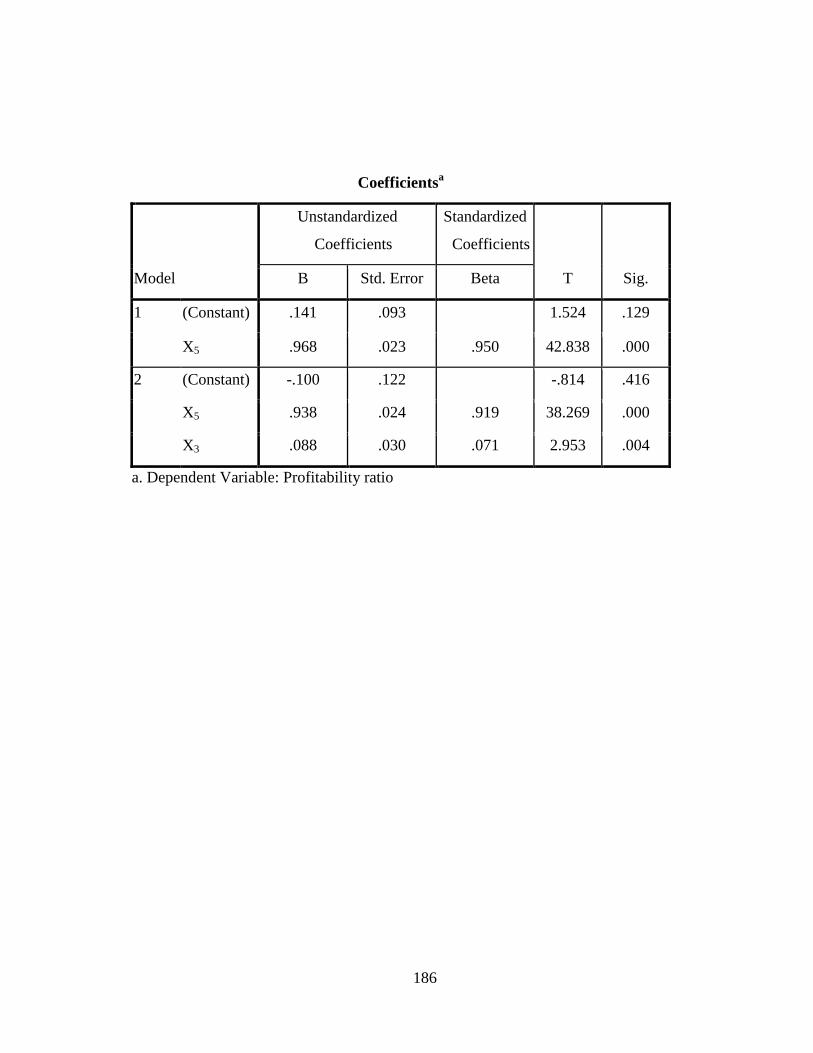
186
Coefficientsa
Model
Unstandardized
Coefficients
Standardized
Coefficients
T Sig. B Std. Error Beta
1 (Constant) .141 .093 1.524 .129
X5 .968 .023 .950 42.838 .000
2 (Constant) -.100 .122 -.814 .416
X5 .938 .024 .919 38.269 .000
X3 .088 .030 .071 2.953 .004
a. Dependent Variable: Profitability ratio

187
APPENDIX 11: MODEL 8- MODERATED MULTIPLE REGRESSION MODEL
FOR SHRM, QUALITY LED HR STRATEGY AND FIRM PERFORMANCE
Y= β0+β1X1+β2X2+β3X3+β4X4+ β5X5 + βzZ + β1z X 1Z+ β2z X 2Z+ β3z X 3Z+ β4z X 4Z + β5z
X 5Z + ε
Where; Y=firm performance (Sales Growth, Perceived Profitability, Profitability Ratio)
β0=constant
βi is the coefficient for Xi ( i=1, 2,3,4,5)
X1=selective resourcing
X2=teams and decentralization
X3=extensive training
X4=sharing information
X5=incentives
Z= Quality led HR strategy (moderator)
ε = error term
XiZ= Product term / interaction term of a Quality led HR strategy with each of the
independent variables(x1,x2x3,x4,x5)

188
APPENDIX 12: MODEL 9-MODERATED MULTIPLE REGRESSION MODEL
FOR SHRM, QUALITY LED HR STRATEGY AND FIRM PERFORMANCE
(SALES GROWTH)
Model Summary for SHRM,Quality led HR Strategy and Sales Growth
Model R R Square Adjusted R Square
Std. Error of the
Estimate
1 .309a .095 .087 1.26940
2 .395b .156 .141 1.23179
a.Predictors: (Constant), interaction term between quality led HR strategy and selective resourcing
b.Predictors: (Constant), interaction term between quality led HR strategy and selective
resourcing, interaction term between quality led HR strategy and sharing information
ANOVAc
Model Sum of Squares df Mean Square F Sig.
1 Regression 18.712 1 18.712 11.612 .001a
Residual 177.253 110 1.611
Total 195.964 111
2 Regression 30.578 2 15.289 10.077 .000b
Residual 165.386 109 1.517
Total 195.964 111

189
Coefficientsa
Model
Unstandardized
Coefficients
Standardized
Coefficients
T Sig. B Std. Error Beta
1 (Constant) 1.647 .210 7.859 .000
x1q .214 .063 .309 3.408 .001
2 (Constant) 1.787 .209 8.533 .000
x1q .618 .157 .894 3.939 .000
x4q -.421 .150 -.635 -2.797 .006
a. Dependent Variable: Sales Growth
a.Predictors: (Constant), interaction term between quality led HR strategy and selective
resourcing
b. Predictors: (Constant), interaction term between quality led HR strategy and selective
resourcing,interaction term between quality led HR strategy and sharing information
c. Dependent Variable: Sales Growth

190
APPENDIX 13: MODEL 10-MODERATED MULTIPLE REGRESSION MODEL
FOR SHRM, QUALITY LED HR STRATEGY AND FIRM PERFORMANCE
(PERCEIVED PROFITABILITY)
Model Summary for SHRM, Quality Led HR strategy and Perceived Profitability
Model R R Square Adjusted R Square
Std. Error of the
Estimate
1 .250a .063 .058 .60764
a. Predictors: (Constant), Sharing information
ANOVAb
Model
Sum of
Squares Df Mean Square F Sig.
1 Regression 4.735 1 4.735 12.825 .000a
Residual 70.891 192 .369
Total 75.627 193
a. Predictors: (Constant), Sharing information
b.Dependent Variable: Perceived Profitability

191
Coefficientsa
Model
Unstandardized
Coefficients
Standardized
Coefficients
T Sig. B Std. Error Beta
1 (Constant) 3.005 .318 9.447 .000
X4 .269 .075 .250 3.581 .000
a. Dependent Variable: Perceived Profitability

192
APPENDIX 14: MODEL 11-MODERATED MULTIPLE REGRESSION MODEL
FOR SHRM, QUALITY LED HR STRATEGY AND FIRM PERFORMANCE
(PROFITABILITY RATIO)
Model Summary for a Quality led HR strategy and Profitability Ratio
Model R R Square Adjusted R Square
Std. Error of the
Estimate
1 .950a .902 .901 .23182
2 .952b .906 .905 .22747
3 .954c .909 .908 .22388
a. Predictors: (Constant), Incentives
b. Predictors: (Constant), Incentives, Extensive training
c.Predictors: (Constant), Incentives, Extensive training, Interaction term between a quality led HR
strategy and selective resourcing

193
ANOVAd
Model
Sum of
Squares Df Mean Square F Sig.
1 Regression 98.616 1 98.616 1835.090 .000a
Residual 10.748 200 .054
Total 109.364 201
2 Regression 99.067 2 49.534 957.312 .000b
Residual 10.297 199 .052
Total 109.364 201
3 Regression 99.440 3 33.147 661.326 .000c
Residual 9.924 198 .050
Total 109.364 201
a. Predictors: (Constant), Incentives
b. Predictors: (Constant), Incentives, Extensive training
c.Predictors: (Constant), Incentives, Extensive training, Interaction term between a
quality led HR strategy and selective resourcing

194
Coefficientsa
Model
Unstandardized
Coefficients
Standardized
Coefficients
T Sig. B Std. Error Beta
1 (Constant) .141 .093 1.524 .129
X5 .968 .023 .950 42.838 .000
2 (Constant) -.100 .122 -.814 .416
X5 .938 .024 .919 38.269 .000
X3 .088 .030 .071 2.953 .004
3 (Constant) -.127 .121 -1.053 .294
X5 .933 .024 .915 38.566 .000
X3 .083 .029 .067 2.823 .005
X1q .024 .009 .059 2.727 .007
a. Dependent Variable: Profitability ratio

195
APPENDIX 15: MODEL 12-MODERATED MULTIPLE REGRESSION MODE
FOR SHRM, INNOVATION LED HR STRATEGY AND FIRM PERFORMANCE
Y= β0+β1X1+β2X2+β3X3+β4X4+ β5X5 + βzZ + β1z X 1Z+ β2z X 2Z+ β3z X 3Z+ β4z X 4Z + β5z
X 5Z + ε
Where; Y=firm performance (Sales Growth, Perceived Profitability, Profitability Ratio)
β0=constant
βi = the coefficient for Xi ( i=1, 2,3,4,5)
X1=selective resourcing
X2=teams and decentralization
X3=extensive training
X4=sharing information
X5=incentives
Z= Innovation led HR strategy (moderator)
ε = error term
XiZ= Product term / interaction term of an innovation led HR strategy with each of
the independent variables(X1,X2,X3,X4,X5)

196
APPENDIX 16: MODEL 13-MODERATED MULTIPLE REGRESSION MODEL
FOR SHRM, INNOVATION LED HR STRATEGY AND FIRM
PERFORMANCE (SALES GROWTH)
Model Summary for SHRM,Innovation led HR Strategy and Sales Growth
Model R R Square Adjusted R Square
Std. Error of the
Estimate
1 .291a .084 .076 1.27709
2 .384b .148 .132 1.23782
a. Predictors: (Constant), Selective resourcing
b. Predictors: (Constant), Selective resourcing, Innovation led HR strategy
ANOVAc
Model
Sum of
Squares Df Mean Square F Sig.
1 Regression 16.558 1 16.558 10.153 .002a
Residual 179.406 110 1.631
Total 195.964 111
2 Regression 28.953 2 14.477 9.448 .000b
Residual 167.011 109 1.532
Total 195.964 111
a. Predictors: (Constant), Selective resourcing
b. Predictors: (Constant), Selective resourcing, Innovation led HR strategy
c. Dependent Variable: Sales Growth

197
Model
Unstandardized
Coefficients
Standardized
Coefficients
t Sig. B Std. Error Beta
1 (Constant) .339 .606 .560 .577
X1 .495 .155 .291 3.186 .002
2 (Constant) .433 .588 .736 .463
X1 .511 .151 .300 3.391 .001
I -.869 .306 -.252 -2.844 .005
a. Dependent Variable: Sales Growth

198
APPENDIX 17: MODEL 14-MODERATED MULTIPLE REGRESSION
MODEL FOR INNOVATION LED HR STRATEGY AND FIRM
PERFORMANCE (PERCEIVED PROFITABILITY)
Model Summary for SHRM, Innovation led HR strategy and Perceived Profitability
Model R R Square Adjusted R Square
Std. Error of the
Estimate
1 .250a .063 .058 .60764
a. Predictors: (Constant), Sharing information
ANOVAb
Model
Sum of
Squares Df Mean Square F Sig.
1 Regression 4.735 1 4.735 12.825 .000a
Residual 70.891 192 .369
Total 75.627 193
a. Predictors: (Constant), Sharing information
b. Dependent Variable: Perceived Profitability

199
Coefficientsa
Model
Unstandardized
Coefficients
Standardized
Coefficients
t Sig. B Std. Error Beta
1 (Constant) 3.005 .318 9.447 .000
X4 .269 .075 .250 3.581 .000
a. Dependent Variable: Perceived Profitability

200
APPENDIX 18: MODEL 15-MODERATED MULTIPLE REGRESSION MODEL
FOR SHRM, INNOVATION LED HR STRATEGY AND FIRM
PERFORMANCE (PROFITABILITY RATIO)
Model Summary for SHRM, Innovation led HR strategy and Profitability Ratio
Model R R Square Adjusted R Square
Std. Error of the
Estimate
1 .950a .902 .901 .23182
2 .952b .906 .905 .22747
3 .953c .908 .907 .22551
a. Predictors: (Constant), Incentives
b. Predictors: (Constant), Incentives, Extensive training
c. Predictors: (Constant), Incentives, Extensive training, Interaction term between innovation led
HR strategy and extensive training
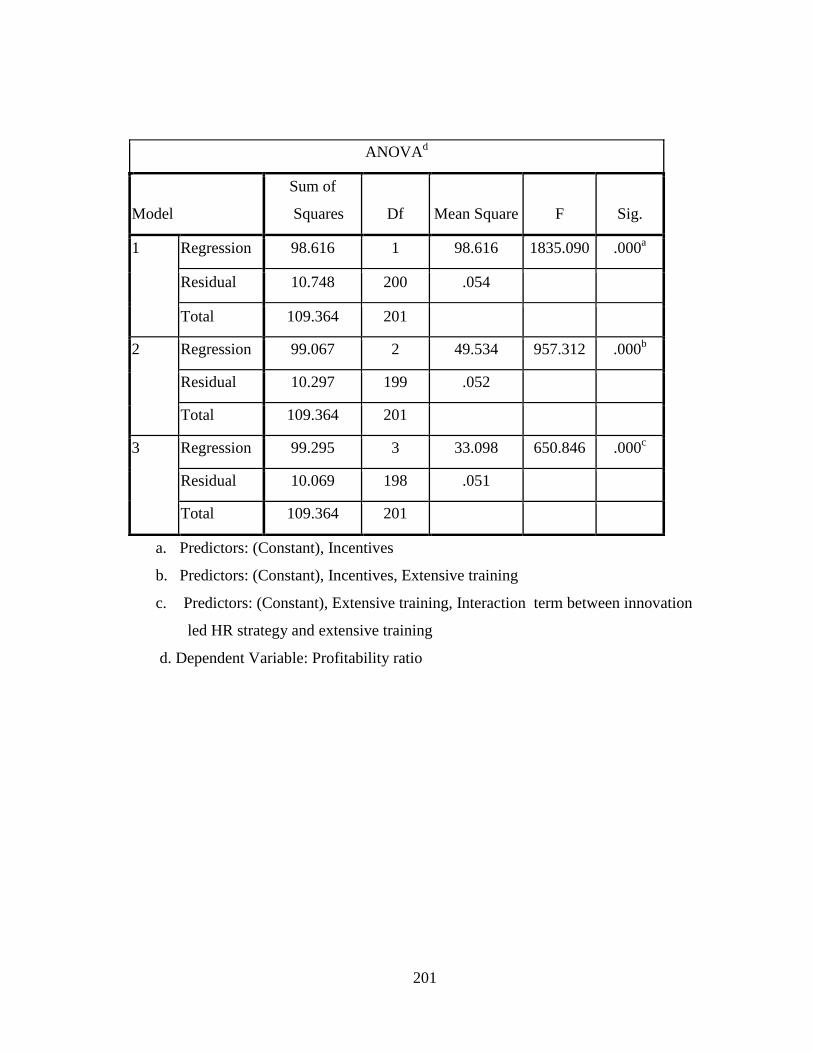
201
a. Predictors: (Constant), Incentives
b. Predictors: (Constant), Incentives, Extensive training
c. Predictors: (Constant), Extensive training, Interaction term between innovation
led HR strategy and extensive training
d. Dependent Variable: Profitability ratio
ANOVAd
Model
Sum of
Squares Df Mean Square F Sig.
1 Regression 98.616 1 98.616 1835.090 .000a
Residual 10.748 200 .054
Total 109.364 201
2 Regression 99.067 2 49.534 957.312 .000b
Residual 10.297 199 .052
Total 109.364 201
3 Regression 99.295 3 33.098 650.846 .000c
Residual 10.069 198 .051
Total 109.364 201
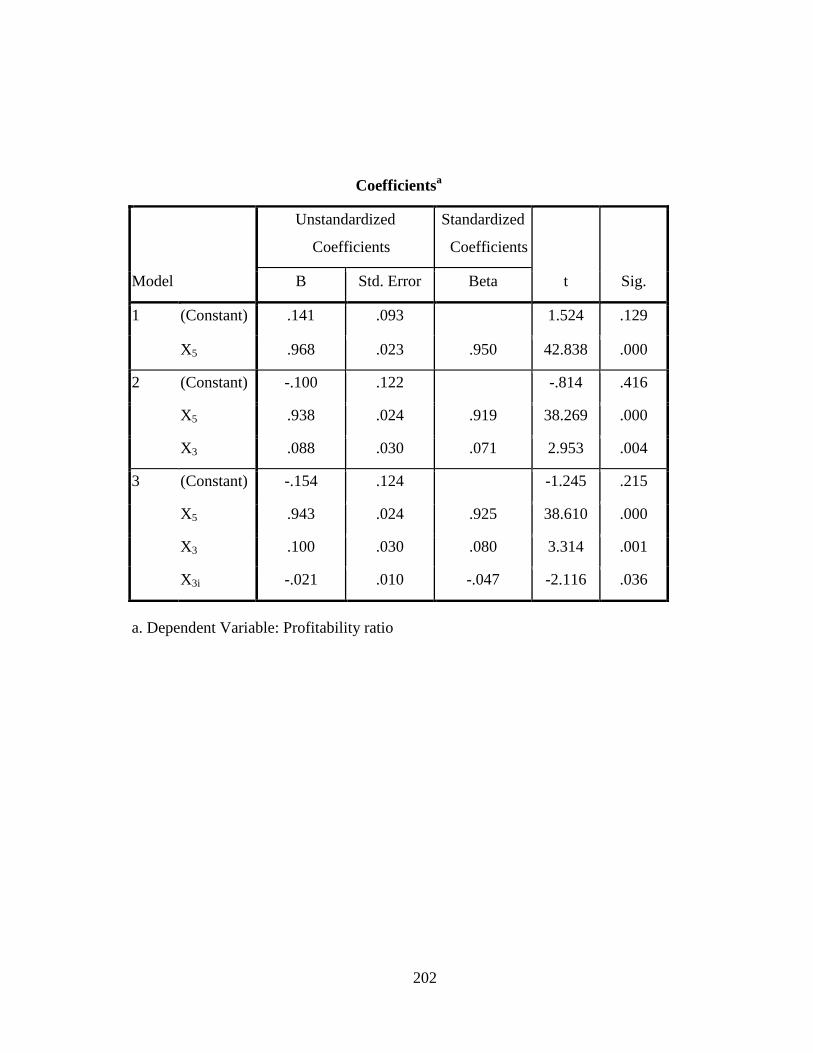
202
a. Dependent Variable: Profitability ratio
Coefficientsa
Model
Unstandardized
Coefficients
Standardized
Coefficients
t Sig. B Std. Error Beta
1 (Constant) .141 .093 1.524 .129
X5 .968 .023 .950 42.838 .000
2 (Constant) -.100 .122 -.814 .416
X5 .938 .024 .919 38.269 .000
X3 .088 .030 .071 2.953 .004
3 (Constant) -.154 .124 -1.245 .215
X5 .943 .024 .925 38.610 .000
X3 .100 .030 .080 3.314 .001
X3i -.021 .010 -.047 -2.116 .036

203
APPENDIX 19: SUB DIMENSIONS / ITEMS OF SHRM PRACTICES
Opinion Statement Dimension Sub dimension / Item
Attitude/desire to work always used as a criteria in
employee selection
Selective
resourcing
Behavior and Attitude
(BA1)
Problem solving aptitude always used as a criteria in
employee selection
Selective
resourcing
Manufacturing and Human
Resource Fit ( MHRF1)
In selection of employees, you usually consider those who
can provide ideas to improve the manufacturing process
Selective
resourcing
Manufacturing and Human
Resource Fit ( MHRF2)
Work values and behavior attitude oftenly used as criteria
in employee selection
Selective
resourcing
Behavior and Attitude
( BA2)
Usually select employees who are able to work in small
Groups
Teams and
decentralization
Team Activities ( TA1)
During problem solving sessions, you always make an
effort to get all team members opinions and ideas before
making a decision
Teams and
decentralization
Team Activities (TA2)
In the past 3 years, many problems have been solved using
small group sessions
Teams and
decentralization
Team Activities( TA3)
Problem solving teams have not always helped to improve
Performance
Teams and
Decentralization
Team Activities( TA4)
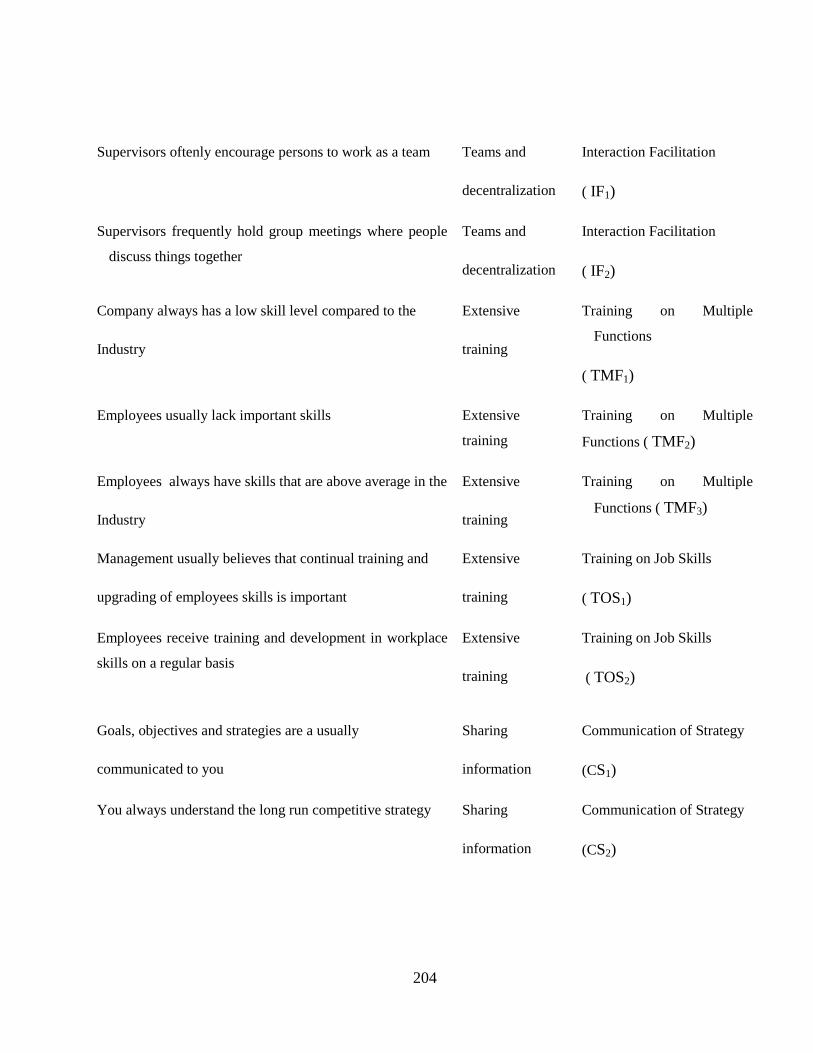
204
Supervisors oftenly encourage persons to work as a team Teams and
decentralization
Interaction Facilitation
( IF1)
Supervisors frequently hold group meetings where people
discuss things together
Teams and
decentralization
Interaction Facilitation
( IF2)
Company always has a low skill level compared to the
Industry
Extensive
training
Training on Multiple
Functions
( TMF1)
Employees usually lack important skills Extensive
training
Training on Multiple
Functions ( TMF2)
Employees always have skills that are above average in the
Industry
Extensive
training
Training on Multiple
Functions ( TMF3)
Management usually believes that continual training and
upgrading of employees skills is important
Extensive
training
Training on Job Skills
( TOS1)
Employees receive training and development in workplace
skills on a regular basis
Extensive
training
Training on Job Skills
( TOS2)
Goals, objectives and strategies are a usually
communicated to you
Sharing
information
Communication of Strategy
(CS1)
You always understand the long run competitive strategy Sharing
information
Communication of Strategy
(CS2)

205
Strategies and goals are usually communicated primarily to
Managers
Sharing
information
Communication of Strategy
(CS3)
Information on productivity is readily available to
Employees
Sharing
information
Feedback on Performance
(FP1)
Your manager never comments about the quality of your
Work
Sharing
information
Feedback on Performance
(FP2)
Incentive system of your company encourages you to
vigorously pursue its objectives
Incentives Incentives to meet objectives
(IP1)
Incentive system is always fair at rewarding employees
who accomplish company objectives
Incentives Incentives to meet objectives
(IP2)
Reward system usually recognizes the employees who
contribute the most to the company
Incentives Incentives to meet objectives
(IP3)
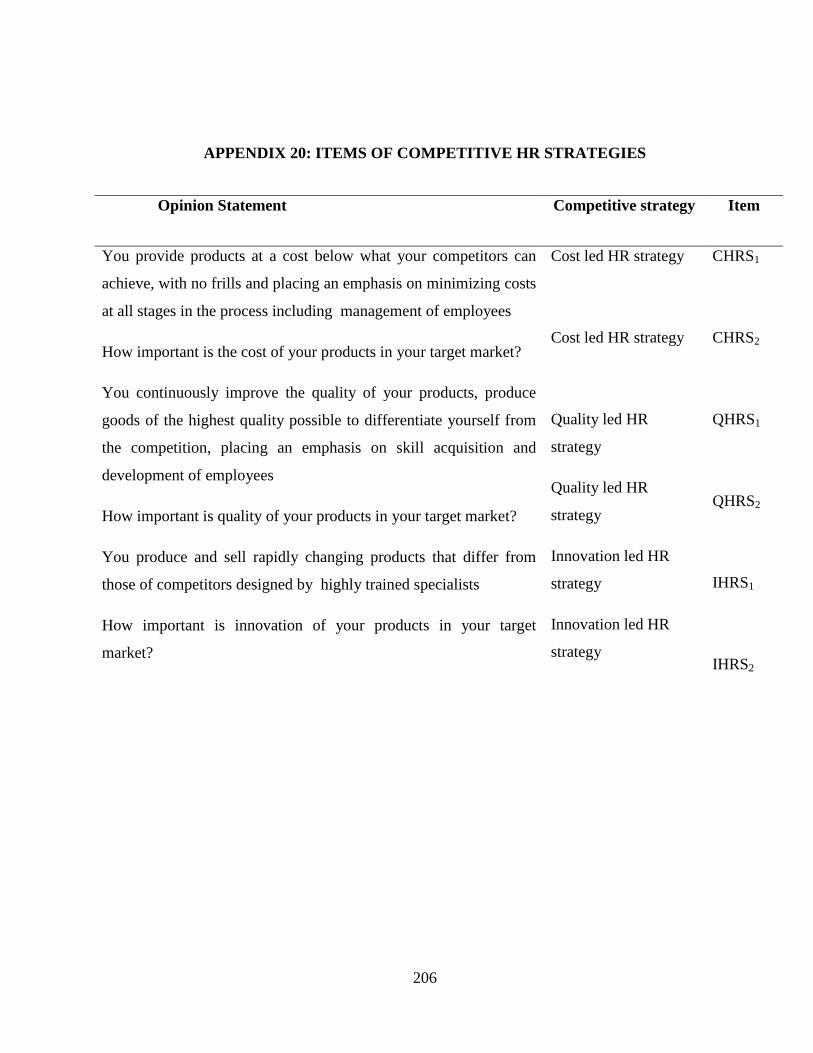
206
APPENDIX 20: ITEMS OF COMPETITIVE HR STRATEGIES
Opinion Statement Competitive strategy Item
You provide products at a cost below what your competitors can
achieve, with no frills and placing an emphasis on minimizing costs
at all stages in the process including management of employees
How important is the cost of your products in your target market?
You continuously improve the quality of your products, produce
goods of the highest quality possible to differentiate yourself from
the competition, placing an emphasis on skill acquisition and
development of employees
How important is quality of your products in your target market?
You produce and sell rapidly changing products that differ from
those of competitors designed by highly trained specialists
How important is innovation of your products in your target
market?
Cost led HR strategy
Cost led HR strategy
Quality led HR
strategy
Quality led HR
strategy
Innovation led HR
strategy
Innovation led HR
strategy
CHRS1
CHRS2
QHRS1
QHRS2
IHRS1
IHRS2

207
APPENDIX 21: SAMPLE SIZE DETERMINATION
The sample size was calculated as follows:
n=1.962 x 0.7x 0.3
0.052
n=323 corporate organizations (when the population size is more than 10,000)
However, since the target population was less than 10,000, the final sample size (nf)
according to Mugenda and Mugenda (2003) was calculated as follows:
nf= n
1 + n/N
= 323
(1 + 323 / 590)
nf= 208.7295 which was rounded off to the nearest tenth
nf= 210 Corporate organizations
(where : nf is the desired sample size when the population is less than 10,000
n is the desired sample size when the population is more than 10,000
N is the population size, which was 590 in this study)