effect of citric acid on slump, compressive strength, and
TRANSCRIPT

University of Arkansas, Fayetteville University of Arkansas, Fayetteville
ScholarWorks@UARK ScholarWorks@UARK
Theses and Dissertations
12-2020
Effect of Citric Acid on Slump, Compressive Strength, and Setting Effect of Citric Acid on Slump, Compressive Strength, and Setting
Time of Belitic Calcium Sulfoaluminate Concrete Time of Belitic Calcium Sulfoaluminate Concrete
Israel Aguilar Rosero University of Arkansas, Fayetteville
Follow this and additional works at: https://scholarworks.uark.edu/etd
Part of the Civil Engineering Commons, Geotechnical Engineering Commons, Structural Materials
Commons, Sustainability Commons, and the Transportation Engineering Commons
Citation Citation Aguilar Rosero, I. (2020). Effect of Citric Acid on Slump, Compressive Strength, and Setting Time of Belitic Calcium Sulfoaluminate Concrete. Theses and Dissertations Retrieved from https://scholarworks.uark.edu/etd/3898
This Thesis is brought to you for free and open access by ScholarWorks@UARK. It has been accepted for inclusion in Theses and Dissertations by an authorized administrator of ScholarWorks@UARK. For more information, please contact [email protected].

Effect of Citric Acid on Slump, Compressive Strength, and Setting Time of Belitic Calcium Sulfoaluminate Concrete
A thesis submitted in partial fulfillment of the requirements for the degree of
Master of Science in Civil Engineering
by
Israel Aguilar Rosero Escuela Politécnica Nacional
Bachelor of Science in Civil Engineering, 2014
December 2020 University of Arkansas
This thesis is approved for recommendation to the Graduate Council.
___________________________________ Cameron D. Murray, Ph.D. Thesis Director
___________________________________ ___________________________________ Ernie Heymsfield, Ph.D. R. Panneer Selvam, Ph.D. Committee Member Committee Member

ABSTRACT
Belitic calcium sulfoaluminate (BCSA) cement has well established advantages related to
fast setting time, fast strength gain, long-term strengths, shrinkage, and sustainability. Due to its
fast setting and hardening, this type of cement has historically been used to repair concrete
structures, highways, and runways. This work provides much needed guidance on establishing
mix design criteria for BCSA cement. Guidance is also given on the effects of set retarders on
strength, slump, and setting times. Citric acid and a phosphonic acid-based admixture were tested
as retarders for different concrete mixtures. Three studies were performed. In the slump study
five different water contents (ranging from 275lb to 375lb per 1yd3) along with three citric acid
dosages were tested (0%, 0.35% and 0.70% of cement weight). These same citric acid dosages
were used in the other two studies to have consistency in the results. This study showed that the
use of a retarder increases the slump, especially at low water contents. The compressive strength
study was carried out testing three water/cement (w/c) ratios and four citric acid dosages (a citric
acid dosage of 2% by cement weight was included). The behavior for the same citric acid dosage
indicates that a lower w/c is associated with a greater compressive strength. An isothermal
calorimeter was used to compare the heat released when citric acid or phosphonic acid admixture
were used as retarders. Three citric acid dosages were compared to several phosphonic acid-
based admixture dosages to find an equivalent dose between both retarders. The equivalence
between those dosages was verified through setting time tests performed with a penetrometer.

ACKNOWLEDGEMENTS
Firstly, I thank God for giving me the wisdom to perform well during my academic
program and for putting the right people in my way to help me through this journey.
I also thank my parents Yolanda and Gerardo, and my brothers Paúl and Daniel for
cheering me up, and for their long-distance support and encouragement to go until the end.
I am very grateful to my academic Advisor, Dr. Cameron D. Murray, for his amazing
support, guidance, teaching, understanding, flexibility, and help throughout all my academic
program. It has always been important to me his encouragement, all the resources to grow
academically, and his concern about us, his students and research group.
I give a special thanks to my friends and lab mates Caleb W. Chesnut, Antonio Ortega,
and Wesley Keys for their valuable help in my research. Thank you also to Casey Jones and the
rest of our lab mates and staff at ENRC for their support and making the lab a safe, friendly, and
nice environment to work.
Thank you to all my professors for sharing their knowledge with me. Especially, thank
you to Dr. Ernie Heymsfield and his family for treating me as part of them and making my first
Thanksgiving Day and Christmas in the United States memorable. A special thanks also to Dr.
Panneer Selvam for always dedicating time to clarify the students’ doubts and making the class
participative.
Thanks to my friends Regina Cabrera, Osnar Mondragón, Mustafeez Ul Hassan, and
Naveed for their true friendship, the moments shared together, and making me feel like home.

I am also grateful to my Ecuadorian friends Jenifer Idrovo, Jannis Pilco, and Marisol
Paltán for accompanying me and encouraging me through my studies here. Their support means
a lot to me.
Finally, but not least, thanks to the Fulbright Program and the University of Arkansas for
giving me the unique opportunity to study in the United States, accomplish a big goal and know
the American culture and people from all over the world.

TABLE OF CONTENTS
INTRODUCTION.................................................................................................................... 1
RESEARCH SIGNIFICANCE ............................................................................................... 3
EXPERIMENTAL PROCEDURE......................................................................................... 3
Materials and Proportions ............................................................................................................... 4
Batching, Mixing, and Testing ....................................................................................................... 9
Calorimetry and Setting Time Study ........................................................................................... 10
EXPERIMENTAL RESULTS .............................................................................................. 12
Slump of BCSA Mixtures ............................................................................................................. 12
Compressive Strengths .................................................................................................................. 16
Calorimetry and Setting Time Results ........................................................................................ 21
CONCLUSIONS .................................................................................................................... 24
REFERENCES ....................................................................................................................... 25
LIST OF TABLES
Table 1-Typical composition of BCSA and PC (% mass)13…………………..……………..…… 4
Table 2–Gradation and properties of aggregates……………………………………….…..….…. 5
Table 3–Proportions of materials per 1 yd3 of concrete for slump study……………….……..…. 8
Table 4–Proportions of materials per 1 yd3 of concrete for compressive strength study….……... 8
Table 5–Average temperatures …...…………………………………………………………..… 13
Table 6–Average slump………………………………………………………………………..... 15
Table 7–Setting times by mortar penetrometer for citric acid and phosphonic acid admixture …………………………………………………………………………………………………... 24

LIST OF FIGURES
Figure 1-Gradation curves for coarse and fine aggregates (25.4 mm = 1 in.) ...…………….…... 6
Figure 2-Tarantula curve and the combined gradation of coarse and fine aggregates………….... 7
Figure 3-Cement, water, and phosphonic acid admixture before the test (left). Set cement paste at the end of the test (right)…………………………………………………………………….…... 12
Figure 4-Reduction in mixture temperature…………………………………………………..… 14
Figure 5- Slump vs total water for BCSA and PC (PC curve from ACI 21122)……………….... 16
Figure 6–Mix H4 tested at 3 hours (left) and mix F2 tested at 7 days (right)………………..…. 16
Figure 7-Mix F1 first try (left) and mix F1 second try (right)…………………………………… 17
Figure 8-Mixes with w/c 0.4. Mix F1, 0% citric dosage (left) and mix F2, 0.35% citric dosage (right)…………………………………………………………………………………………..... 17
Figure 9-BCSA mixes: 3-hour compressive strengths……………………………………..…… 18
Figure 10-Isolated effects of citric acid on compressive strength for a w/c of 0.4 (a), 0.5 (b), and 0.6 (c)……………………………………………………………………………………….…… 19
Figure 11- Isolated effects of w/c in compressive strength for citric acid dosages of 0% (a), 0.35% (b), 0.70% (c), and 2% (d)……………………………………………….….….……………..… 20
Figure 12-BCSA mixes: thermal power vs time……………………………………………...…. 22

1
INTRODUCTION
Concrete is one of the most widely used materials worldwide and is primarily made using
portland cement (PC). New alternative cements or enhancements to PC have been used but PC
remains the standard binder for cementitious materials. In recent years, interest has grown in
more environmentally friendly alternative cements which often have very different
microstructures or properties. Among these alternatives are calcium sulfoaluminate (CSA)
cements.
Environmental considerations are one reason CSA cements are garnering more widespread
interest. Less CO2 is emitted in the production of CSA clinker, which makes it an attractive
alternative to PC from an ecological point of view1 considering that 1,819 short tons (1,650
million metric tons) of CO2 are emitted from cement production annually2. According to Burris
and Kurtis3, production of CSA cement emits 50-85% less CO2 compared to PC because of the
lower production temperatures and the lower calcium content. The maximum temperature to
reach sintering in CSA cement is 2,250 ºF (1,232 °C), which is 450 ºF (232 °C) less than that for
PC. Emissions are also reduced due to the requirement of less lime during the sintering process4.
Invented by Alexander Klein at UCLA in the 60s5,6, CSA cement has been used on an industrial
scale in China since 19607, and has been used continually on a small scale in the United States
since its invention2,7. CSA cements can be thought of as a special variety of cements with
differing compositions that can be used for different purposes. For example, Type K expansive
additive is a CSA cement that is added to PC as a shrinkage compensating admixture. Most CSA
cements share certain properties, such as high early strength and fast setting times because of the
quick formation of ettringite7. Thomas et al.7, mention that ultimate compressive strengths of at
2
least 10,000 psi (69 MPa) can be obtained and strengths exceeding 4,000 psi (27.5 MPa) are
feasible in as little as 2 hours.
CSA cements comprise different types of cement that can be the sole binder itself or an additive
in function of the proportions of its main compounds. This study uses a variety of CSA cement
known as belitic CSA, or BCSA cement, or type-B CSA cement. In BCSA cement, a large
amount of belite (C2S) is present in the cement which results in a less expansive (or neutrally
expansive) cement that can be used on its own (i.e., with no PC), and maintains many of the
benefits of CSA cements (rapid setting, rapid strength gain).
Other reported advantages of BCSA concretes are their very good later age strengths8 and very
low or no shrinkage due to their shrinkage-compensating properties and their potential to exhibit
autogenous shrinkage2,7,9. Early age cracking should be prevented by due to this lower shrinkage,
which would result in durability benefits. More information is needed about long-term durability
of BCSA concretes exposed to hostile environments10.
Nonetheless, BCSA cement has some disadvantages compared to PC. One of those
disadvantages is its higher cost. BCSA cement may also present potential issues with carbonation
and corrosion11,12. For inexperienced users, the extremely fast setting time (20 minutes with no
retarder) can be difficult to account for. BCSA cement has not been very well studied yet,
therefore, the mentioned advantages and disadvantages still need to be tested more deeply.
BCSA cements have primarily been used for repairs on a smaller scale in the United States3,9 and
for rehabilitation of runways in airports (i.e. Seattle-Tacoma airport)2. Further study is needed to
make it more commercially accepted and widely used in the industry. BCSA cement has been

3
used to make prestressed concrete and reinforced concrete in research13. Studies have shown that
this kind of cement consumes more water while hydrating than the traditional PC7.
To avoid rapid setting of BCSA concrete, there are some retarders that are typically added to the
mix to provide more working time. Citric acid has proven to be an effective retarder. Although
they are not as recommended as citric acid, other acids work for this same purpose such as
tartaric, gluconic and boric acids1,7. Typical PC set retarders can also be used, but experiences
using commercial stabilizers are not published.
Despite the existing studies regarding BCSA cement, there is no published guidance for how to
design mixes using this cement. This results in difficulties for practitioners who want to start
using it, and different practices in the literature in terms of mix design. The objective of this
paper is to develop the necessary guidance for achieving adequate slump and strength for BCSA
concrete mixtures with varying water, citric acid dosage, and water to cement ratio (w/c). The
effect of citric acid dosage on setting time is also presented and a comparison is drawn to a
standard commercially available set retarder based on calorimetry.
RESEARCH SIGNIFICANCE
BCSA cement has well established advantages related to fast setting time, fast strength gain,
long-term strengths, shrinkage, and sustainability. This paper provides much needed guidance on
establishing mix design criteria for BCSA cement. Guidance is also given on the effects of set
retarders on strength, slump, and setting times.
EXPERIMENTAL PROCEDURE
In this research, a commercial brand of BCSA cement was used, which, along with the fine and
coarse aggregates, several water/cement ratios, and different citric acid doses, were tested in
different proportions to compare their slumps and compressive strengths. Paste samples of

4
varying set retarder dosage were also tested using isothermal calorimetry and mortar
penetrometer testing during hydration to compare the effects of different admixtures.
Materials and Proportions
Table 1 shows a comparison between the typical composition of type I PC and BCSA cement.
Predominantly, belite and ye’elimite (also known as Klein’s compound) are contained in BCSA
cement. Belite positively influences later age strength development, and ye’elimite along with
gypsum drive setting and early age strength development14.
Table 1-Typical composition of BCSA and PC (% mass)13
Type I Portland Cement BCSA cement C3S Alite 59 - C2S Belite 17 45
C3A Aluminate 7 - C4AF Ferrite 9 2
C4A3S Ye’elimite - 30 CS Calcium Sulfate 2 15
Other 6 8
The coarse aggregate used for the mixtures was a 1-inch nominal maximum size aggregate
(NMSA) crushed limestone, while the fine aggregate was river sand from the Arkansas River in
Van Buren, Arkansas (fineness modulus of 2.50). Gradation and other properties of the
aggregates are shown in Table 2. Gradation curves for fine and coarse aggregates are shown in
Figure 1.
Due to the rapid setting of BCSA cement, it is necessary to use a retarder to provide adequate
working time to the concrete mixture. A food-grade citric acid admixture was tested in these
mixtures. The “admixture” was made using a solution of 5 lb powdered citric acid per gallon of
water. This is easier to dose in mixtures than a powder and is simpler for regular practice. Three

5
different citric acid dosages were used to compare the obtained slump with that of mixtures with
no citric acid. The three dosages of admixture used were 9 fl. oz., 18 fl. oz., and 51 fl. oz. of
citric acid per 100 lb of cement. These dosages are equivalent to 0.35%, 0.7%, and 2.0% by
weight of cement. These dosages are typical for field use of BCSA cement and should provide
45 minutes working time, 1.5 hours working time, or 4.25 hours, respectively, at room
temperature15.
For the compressive strength study three w/c were tested: 0.4, 0.5, and 0.6, either with no citric
acid or with the aforementioned 0.35%, 0.70%, or 2.00% citric acid by weight of cement.
Table 2–Gradation and properties of aggregates
Coarse aggregate Fine aggregate Sieve
denomination Sieve size,
mm Retained,
% Passing,
% Retained,
% Passing,
% 1 ½ in 37.5 0.0 100.0 1 in 25.4 0.4 99.6 ¾ in 19.1 10.8 89.2 ½ in 12.7 36.0 64.0 ⅜ in 9.5 52.6 47.4 0.0 100.0 Nº 4 4.76 84.5 15.5 2.8 97.2 Nº 8 2.38 94.9 5.1 8.1 91.9 Nº 16 1.19 96.2 3.8 19.5 80.5 Nº 30 0.6 96.5 3.5 39.0 61.0 Nº 50 0.3 96.7 3.3 83.2 16.8 Nº 100 0.15 96.9 3.1 97.9 2.1 Nº 200 0.075 97.2 2.8 99.3 0.7
Pan 97.4 2.6 99.4 0.6
Coarse Aggregate Fine Aggregate Fineness modulus 2.50 SSD specific gravity, g/cm3 2.67 2.63 Absorption, % 0.60 0.55

6
Figure 1-Gradation curves for coarse and fine aggregates (25.4 mm = 1 in.)
As another indication of the expected performance of the aggregates used, the combined
gradation of rock and sand weighted by the mixture proportions was plotted along with the
“tarantula curve” in Figure 2. The “tarantula curve” is a tool that provides maximum and
minimum limits between which the combined gradation of coarse and fine aggregates will
provide a mixture that is workable, does not promote segregation and does not create surface
finishing problems16. The combined gradation of aggregates is based on the data in Table 2 and
the proportions of rock and sand in Table 3. Those are the values plotted within the “tarantula
curve” in Figure 2.
From Table 2, the sum of the combined percentage retained from sieves #8 through #30 (coarse
sand) is 21.89%, which is greater than 20% and may result in increased cohesion16. Also, from
Table 2, the same sum from sieves #30 through #200 (fine sand) is 33.13%, which falls in the
range of 24 to 34% (allowable range for slipforming) and in the range of 25% to 40% (allowable
range for pumping).

7
Figure 2-Tarantula curve and the combined gradation of coarse and fine aggregates
Figure 2 shows that the combined gradation of fine and coarse aggregates is within the “tarantula
curve” limits. Based on this figure, mixtures produced with these aggregates would be expected
to have good performance regarding workability, cohesion, and surface finishing.
For the slump study, the mixture proportions based on 1 yd3 (0.76 m3) are shown in Table 3.
Considering 1 yd3 (0.76 m3) of concrete, five different amounts of water were used, ranging from
275 lb (1223 N) to 375 lb (1,668 N) in increments of 25 lb (111 N). These amounts of water
were predicted to provide slumps in a typical range for field use (2-10 in. [5.08 – 25.4 cm]) The
amounts of cement, sand, and rock were maintained in every mixture, while the proportions of
water and citric acid admixture were varied. Oven dry rock and sand were used, and an amount
of water matching the expected absorption for the rock and sand was added to the aggregate prior
to mixing. This was to ensure exactly the correct amount of mixing water was maintained.
Practical experience with BCSA cement has shown that inclusion of a high range water reducer
(HRWR) is effective and recommended (to facilitate quicker consolidation and finishing), no
HRWR was used in this study however, to provide a baseline metric of the performance of the
mixtures.

8
Table 3–Proportions of materials per 1 yd3 of concrete for slump study
Mix Water
content, lb
Citric acid dosage, % of cement
weight
BCSA cement,
lb
Dry sand,
lb
Dry rock,
lb
Sand water,
lb
Rock water,
lb A1
275 0.00 625 1200 1773 6.6 42.55
A2 0.35 625 1200 1773 6.6 42.55 A3 0.70 625 1200 1773 6.6 42.55 B1
300 0.00 625 1200 1773 6.6 42.55
B2 0.35 625 1200 1773 6.6 42.55 B3 0.70 625 1200 1773 6.6 42.55 C1
325 0.00 625 1200 1773 6.6 42.55
C2 0.35 625 1200 1773 6.6 42.55 C3 0.70 625 1200 1773 6.6 42.55 D1
350 0.00 625 1200 1773 6.6 42.55
D2 0.35 625 1200 1773 6.6 42.55 D3 0.70 625 1200 1773 6.6 42.55 E1
375 0.00 625 1200 1773 6.6 42.55
E2 0.35 625 1200 1773 6.6 42.55 E3 0.70 625 1200 1773 6.6 42.55
For the compression strength study, the mixture proportions on the basis of 1 yd3 (0.76 m3) are
shown in Table 4. The w/c and citric acid dose was varied, then a water content was chosen to
ensure similar workability for casting cylinders. All mixtures were targeted for a 4-inch (101.2
mm) slump.
Table 4–Proportions of materials per 1 yd3 of concrete for compressive strength study
Mix Water
content, lb
w/c Citric acid dosage, % of cement weight
BCSA cement, lb
Dry sand,
lb
Dry rock,
lb
Sand water,
lb
Rock water,
lb
F1 360 0.4 0.00 900.0 1200 1773 6.60 42.55 F2 300 0.4 0.35 750.0 1200 1773 6.60 42.55 F3 285 0.4 0.70 712.5 1200 1773 6.60 42.55 F4 285 0.4 2.00 712.5 1200 1773 6.60 42.55 G1 360 0.5 0.00 720.0 1200 1773 6.60 42.55 G2 300 0.5 0.35 600.0 1200 1773 6.60 42.55 G3 285 0.5 0.70 570.0 1200 1773 6.60 42.55 G4 285 0.5 2.00 570.0 1200 1773 6.60 42.55
9
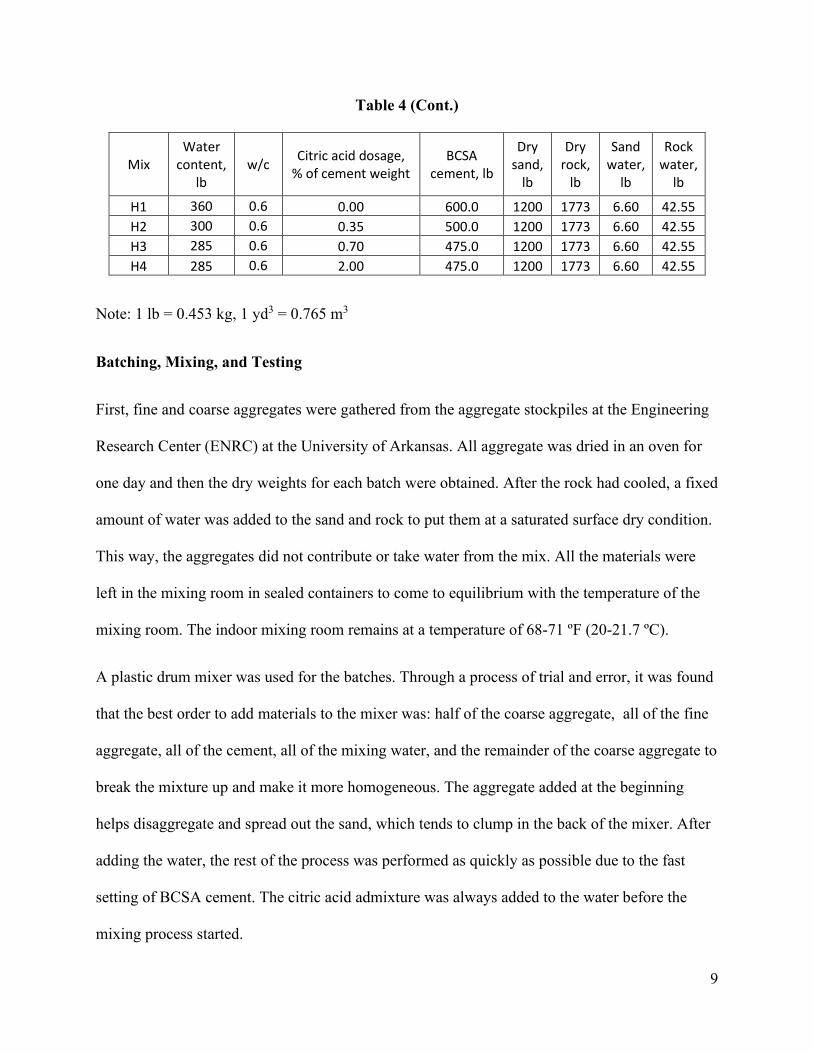
Table 4 (Cont.)
Mix Water
content, lb
w/c Citric acid dosage, % of cement weight
BCSA cement, lb
Dry sand,
lb
Dry rock,
lb
Sand water,
lb
Rock water,
lb
H1 360 0.6 0.00 600.0 1200 1773 6.60 42.55 H2 300 0.6 0.35 500.0 1200 1773 6.60 42.55 H3 285 0.6 0.70 475.0 1200 1773 6.60 42.55 H4 285 0.6 2.00 475.0 1200 1773 6.60 42.55
Note: 1 lb = 0.453 kg, 1 yd3 = 0.765 m3
Batching, Mixing, and Testing
First, fine and coarse aggregates were gathered from the aggregate stockpiles at the Engineering
Research Center (ENRC) at the University of Arkansas. All aggregate was dried in an oven for
one day and then the dry weights for each batch were obtained. After the rock had cooled, a fixed
amount of water was added to the sand and rock to put them at a saturated surface dry condition.
This way, the aggregates did not contribute or take water from the mix. All the materials were
left in the mixing room in sealed containers to come to equilibrium with the temperature of the
mixing room. The indoor mixing room remains at a temperature of 68-71 ºF (20-21.7 ºC).
A plastic drum mixer was used for the batches. Through a process of trial and error, it was found
that the best order to add materials to the mixer was: half of the coarse aggregate, all of the fine
aggregate, all of the cement, all of the mixing water, and the remainder of the coarse aggregate to
break the mixture up and make it more homogeneous. The aggregate added at the beginning
helps disaggregate and spread out the sand, which tends to clump in the back of the mixer. After
adding the water, the rest of the process was performed as quickly as possible due to the fast
setting of BCSA cement. The citric acid admixture was always added to the water before the
mixing process started.

10
The mixing time was three minutes for the mixtures with citric acid and one minute for the
mixtures with no citric acid. In the mixtures with no citric acid, the slump test was performed
very quickly since, without a retarder, the mixtures set in less than 20 minutes13.
The slump tests were based on ASTM C143/C143M-15a, “Standard Test Method for Slump of
Hydraulic-Cement Concrete”17. Besides the slump, the temperatures of the room, mixing water,
and the mixture itself were measured. This same process was repeated for each set of batches. To
have certainty about the measured slump, three replicate batches were made for each water
content to ensure consistent slump measurements.
This same process of preparation of materials and mixing was followed for the compressive
strength study. 4 in. by 8 in. (102 mm by 204 mm) concrete cylinders were made and tested in
compression according to the relevant ASTM standards18,19. They were made in the same mixing
room, maintaining a constant mix temperature. Three cylinders were cast for testing at 3 hours, 1
day, 7 days, 28 days, 6 months and 1 year making a total of 18 cylinders for each mixture. All
the specimens were stored in an environmental chamber at 72 ºF (22.2 ºC) and 50% humidity
immediately after finishing. Work is still needed to evaluate the ideal curing conditions for
BCSA concrete. Prior to compression strength testing, all cylinders were ground at each end to
achieve flatness and planeness of the loading surfaces.
Calorimetry and Setting Time Study
The calorimetry study was performed using an isothermal calorimeter with the capacity to run
two samples at the same time. The fixed proportions of the pastes tested were 0.35 oz (10 g) of
cement and 0.18 oz (5 g) of water, which means the w/c for all the samples was 0.5. One sample
was tested with no retarder and two more samples were tested with 0.35% and 0.70% citric acid

11
by weight of cement. Other samples were tested with different dosages of a commercially
available retarder, which is a phosphonic acid admixture, to find a dosage that provides similar
effects to those when using known dosages of citric acid. This work was compared to
temperature measurements made by Soriano, though Soriano’s measurements were not
performed in an isothermal calorimeter15.
First, the temperature in the calorimeter was set to 73.4 ºF (23 ºC) and allowed to stabilize for 1
day. Then, the water was put in a capped vial and left inside the calorimeter for 1 day to come to
equilibrium with the internal temperature. When the mixture being tested contains a retarder, the
respective dosage is added to the water before putting it in the calorimeter. This allows the
retarder mix well enough to be prepared when the cement is added. A scale with a precision of
0.01 g was used to measure the weight of the retarders.
The next day, the vial containing the water and retarder was taken out of the calorimeter and the
proportion of cement was added at the same time that the software controlling the calorimeter
started logging. It was ensured that the date and hour when the logging started coincided with the
exact moment when the cement was added to the water. The cement was mixed with the water
for 30 seconds before putting back the capped vial in the calorimeter. A plastic spoon whose
handle was broken was used to mix the cement. This is so it fits in the vial at the end of mixing.
Leaving the spoon there avoids taking out any amount of cement so that all the cement reacts
with the water and retarder. The test lasted 72 hours and the software recorded a value each
minute during the test. Figure 3 shows part of the materials before and after the isothermal test.

12
Figure 3-Cement, water, and phosphonic acid admixture before the test (left). Set cement paste at the end of the test (right).
To verify the values obtained with the calorimeter, several setting time tests were performed
using a mortar penetrometer for different dosages of phosphonic acid admixture. These tests
were carried out according to the ASTM C403/C403-16 standard20. In all these tests, a cement
paste with a w/c of 0.48 was used.
EXPERIMENTAL RESULTS
Slump of BCSA Mixtures
Table 5 summarizes the average temperatures for each mixture. For each citric acid dosage, the
average temperature is presented with the respective standard deviation to see how the mix
temperature was affected by retarder dosage. Each temperature in Table 5 is the average of the
temperature measurements from the three different slump tests for the same citric acid dosage.
The room temperature remained between 69.3 and 71.6 ºF (20.72 to 22 ºC) for all batches. The
water temperature varied more. The influence of the water temperature on slump must be studied
more and is subject of further investigation.

13
Table 5–Average temperatures
Mix Water
content, lb
Citric acid dosage, % of cement weight
Room temperature,
ºF
Water temperature,
ºF
Mix temperature,
ºF A1
275 0.00 70.9 67.1 71.3
A2 0.35 69.9 64.7 67.0 A3 0.70 70.2 60.0 63.0 B1
300 0.00 71.8 71.0 73.9
B2 0.35 70.0 68.4 71.4 B3 0.70 69.6 60.0 64.0 C1
325 0.00 71.6 70.8 74.9
C2 0.35 70.0 67.5 71.4 C3 0.70 70.9 68.0 69.0 D1
350 0.00 69.3 68.2 70.7
D2 0.35 71.1 66.7 70.1 D3 0.70 71.8 68.0 69.0 E1
375 0.00 69.8 68.7 71.2
E2 0.35 69.4 65.6 66.7 E3 0.70 72.0 65.5 66.0
Average 70.6 66.7 69.3
Standard deviation ± 0.9 ± 3.2 ± 3.4
Figure 4 shows the reduction in mixture temperature for each citric dosage. For each citric
dosage, the average temperature was calculated and the change in temperature was calculated
with respect to the average mixture temperature with no citric acid. The results indicate that the
mixture experiences a roughly linear decrease in temperature of approximately 8.5°F per 1%
citric acid by cement weight.

14
Figure 4-Reduction in mixture temperature
The average slump for the three mixtures at each water content is shown in Table 6. Three slump
tests were performed for each citric acid dosage to obtain its average slump. This data is also
presented graphically in Figure 5. Slump increased with increasing water content, as would be
expected for PC concrete. This is true regardless of the amount of citric acid. Also, for a given
water content, slump increases with increasing citric acid dosage. The curves shown are roughly
parallel and their slopes appear to be higher at lower water contents than at higher water
contents. This effect is most pronounced when comparing mixtures with no citric acid to
mixtures with 0.35% citric acid by weight of cement. Use of a retarder is highly recommended
for placing and finishing reasons but also has a significant effect on slump especially at lower
water contents (<325 lb water). Compared to typical guidance for proportioning of PC
mixtures21,22, BCSA mixtures containing citric acid required a lower water content to achieve
adequate slump. In Figure 5, a line used for PC mix design is included for comparison from ACI
21122. If no retarder is used, much more water is required for a given slump compared to PC.
However, when retarder is used in BCSA cement, the slump retention is good, and less water

15
may be required. Apparently, the line for BCSA cement with no citric acid is similar in shape to
PC, but with citric acid the inverse relationship is observed (decreasing change in slump with
increasing water). The two parameters here, citric acid admixture dosage and water content both
have an interconnected influence on slump. Both are factors to consider when designing BCSA
concrete mixtures to achieve a given slump.
Table 6–Average slump
Mix Water
content, lb
Citric acid dosage, % of cement weight
Slump, in
Standard deviation
A1 275
0.00 0.00 ± 0.00 A2 0.35 2.08 ± 0.72 A3 0.70 3.17 ± 1.38 B1
300 0.00 0.25 ± 0.00
B2 0.35 5.17 ± 1.04 B3 0.70 7.67 ± 0.29 C1
325 0.00 0.83 ± 0.58
C2 0.35 7.00 ± 1.00 C3 0.70 8.67 ± 0.29 D1
350 0.00 4.33 ± 1.53
D2 0.35 7.50 ± 0.87 D3 0.70 8.83 ± 0.38 E1
375 0.00 6.25 ± 0.90
E2 0.35 9.33 ± 0.76 E3 0.70 9.83 ± 0.29

16
Figure 5- Slump vs total water for BCSA and PC (PC curve from ACI 21122)
Compressive Strengths
Each set of three cylinders was tested in compression on the scheduled date. Most of them only
presented cracks when the test finished, although those with a citric acid dosage of 2% were
easily friable if tested at 3 hours of age. This comparison is illustrated in Figure 6.
Figure 6–Mix H4 tested at 3 hours (left) and mix F2 tested at 7 days (right)

17
An early observation during this research was that mixtures with no citric acid were nearly
impossible to consolidate properly. Because of the short working time of BCSA with no set
retarder, mixtures had to be broken up into sets of three cylinders to ensure adequate
consolidation. In larger batches, the final cylinders cast contained many voids due to the fast
setting of the mixture, as shown in Figure 7.
Figure 7-Mix F1 first try (left) and mix F1 second try (right).
When comparing mix F1 with mix F2 (both with a w/c of 0.4 but with 0% and 0.35% citric
dosage, respectively), the specimens of mix F2 had fewer voids. This shows qualitatively that the
use of citric acid provides improvement in terms of compactibility and workability, shown in
Figure 8. Note, both mixtures had approximately a 4 in. (101.6 mm) slump. A corresponding
strength increase was also observed, which likely owed in some part to the reduction in voids.
Figure 8-Mixes with w/c 0.4. Mix F1, 0% citric dosage (left) and mix F2, 0.35% citric dosage (right).

18
Figure 9 shows the 3-hour compressive strengths for the four different citric doses tested grouped
by w/c. For the three w/c tested, the use of citric acid until a dose of 0.70% did not have a great
impact on the 3-hour compressive strength, but a citric dose of 2% resulted in 3-hour strengths
lower than 90 psi (0.60 MPa). At 3 hours, 2% citric acid dosage resulted in specimens that had
likely not reached final set. For a citric dose from 0% to 0.70% and a w/c of 0.4, BCSA mixes
can reach a compressive strength around 4000 psi (27.5 MPa) in 3 hours. Obviously, there is a
tradeoff between early age strength and working time that will contribute to the decision to use a
particular citric acid dosage.
Figure 9-BCSA mixes: 3-hour compressive strengths.
As shown in Figure 10, it was found that, for a given w/c, the more citric acid used in the mix,
the higher compressive strength of the specimens between 1 and 7 days (up to a citric acid
dosage of 0.7% by weight of cement). However, there was not a clear trend at 3 hours, nor at 28
days. There may be a weak influence of better later age strength with more citric acid. Future

19
breaks at 6 months and 1 year might clarify this relationship. At 3 hours of age, the strength of
cylinders with a citric acid dosage greater than 0.7% by weight of cement is very low at any w/c.
The specimens with 2% citric acid by weight of cement were weaker in compression than those
with a citric dosage of 0.70%. This finding is in line with a study by Zou et al.23 performed with
CSA cement paste where it is mentioned that retarders usually cause an increase of compressive
strength for retarder dosage up to 1.5%. According to Burris and Kurtis3, citric acid dosages of
2% and greater may cause a decrease in later age strength.
Figure 10-Isolated effects of citric acid on compressive strength for a w/c of 0.4 (a), 0.5 (b), and 0.6 (c).

20
It can be observed in Figure 11 that for the same citric acid dosage, the behavior is clear; the
lower the w/c is, the stronger the specimen is. In this case, it can also be observed that more fluid
mixtures (those with higher w/c or citric dose) are more consistent. This might be due to a better
consolidation as the comparison in Figure 8 suggests. Later age strengths appear to increase
more for a w/c of 0.4 compared to 0.5 or 0.6. A w/c closer to 0.4 appears to be ideal for
compressive strength compared to the other w/c tested in this study.
Figure 11- Isolated effects of w/c in compressive strength for citric acid dosages of 0% (a), 0.35% (b), 0.70% (c), and 2% (d).

21
Figures 10 and 11 show the results of the compression tests up to 28 days. From each mix, 6
additional specimens were made to be broken after 6 months and 1 year (between July and
August, 2021), those will be broken after the submission of this thesis. Taken as a whole, the
results of the compressive strength testing show that there is a strong influence of w/c on
compressive strength, much like for PC. Citric acid dosage reduces early age strength, but its
effect on later age strength is less pronounced. Compressive strengths are negatively affected
when no citric acid (or other retarder) is used, this is mostly attributed to inability to properly
compact such mixtures. When citric acid is used as a set retarder, 28-day strengths exceeding
8,000 psi are feasible for the w/c tested in this study. Very high early strengths (4,000 psi at 3
hours) are possible with lower citric acid dosage (0.35%).
The average compressive strength at 28 days of the tested mixtures fall in the range between
3,400 psi (23 MPa) and 8,035 psi (55 MPa). The strongest specimens in compression were those
of mixes with a w/c of 0.4, all of these surpassed 6,000 psi (41 MPa) in compression.
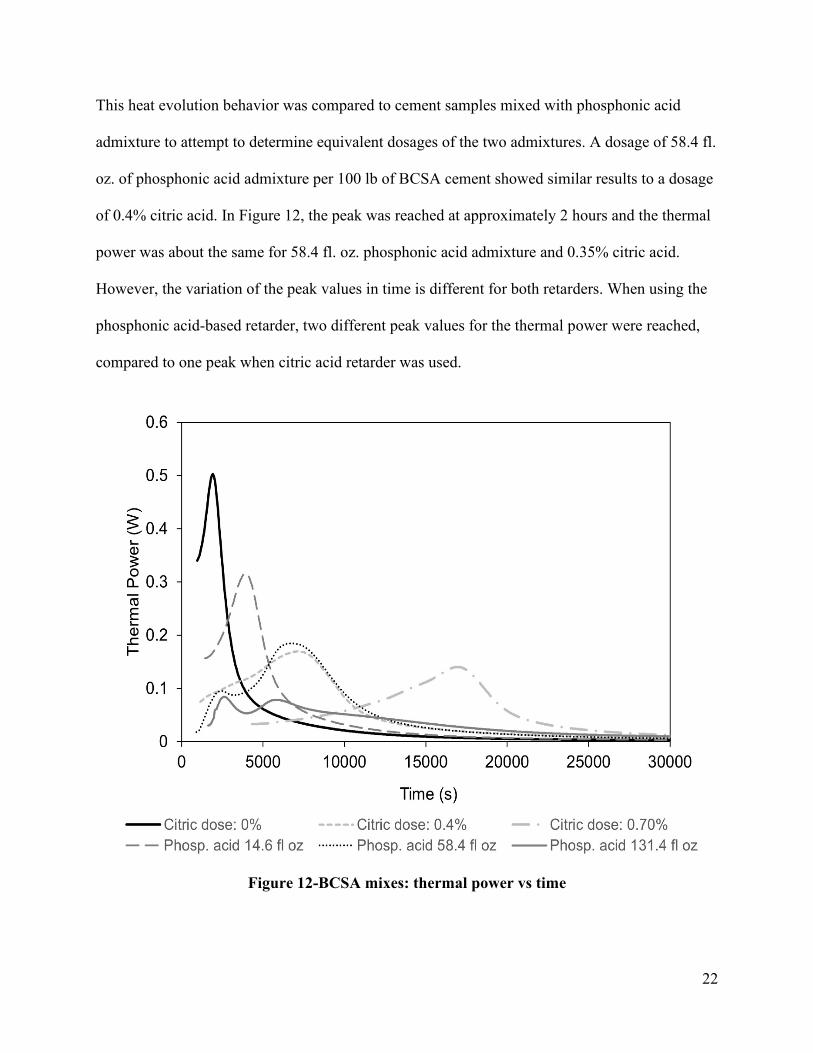
Calorimetry and Setting Time Results
The hydration of BCSA cement when no retarder is used occurs very quickly and the thermal
power reaches its peak at around 30 minutes as shown in Figure 12. Citric acid has the effect of
delaying this peak and lowering the peak power. The hydration peak was delayed until 2 hours
and 4.7 hours when using 0.4% citric acid and 0.70% citric acid, respectively. Hydration heat
evolution is mostly complete within a range of 2 and 12 hours24 for CSA cements. The results for
the BCSA cement used in this study show that at 10 hours the reaction is almost complete for all
citric acid dosages.
22
This heat evolution behavior was compared to cement samples mixed with phosphonic acid
admixture to attempt to determine equivalent dosages of the two admixtures. A dosage of 58.4 fl.
oz. of phosphonic acid admixture per 100 lb of BCSA cement showed similar results to a dosage
of 0.4% citric acid. In Figure 12, the peak was reached at approximately 2 hours and the thermal
power was about the same for 58.4 fl. oz. phosphonic acid admixture and 0.35% citric acid.
However, the variation of the peak values in time is different for both retarders. When using the
phosphonic acid-based retarder, two different peak values for the thermal power were reached,
compared to one peak when citric acid retarder was used.
Figure 12-BCSA mixes: thermal power vs time

23
Looking at Figure 12, when the dosage of the retarder is increased, the maximum thermal power
decreases faster when phosphonic acid admixture is used than when citric acid is used. For
example, the increase of phosphonic acid admixture from 58.4 fl. oz. per 100 lb of cement to
131.4 fl oz. per 100 lb of cement did not delay the peak time as much as an increase of citric acid
from 0.4% to 0.70%.
Several reactions occur during the hydration of CSA cements due to the different phases they
have15. The main hydration products are ettringite and monosulfate, which are formed together
with aluminum hydroxide24. Ettringite is formed quickly in BCSA cements, and this causes the
short setting time and fast strength gain15, as can be seen in Figures 10 and 11.
According to another study based on calorimetry, like in PC, the onset of the main peak is
coincident with the initial set in CSA cements14. In the results presented here, the peaks are
displaced every time a greater dosage of retarder is used. In Figure 12, the high heat of hydration,
which is quickly released for the sample with no retarder, is in line with the findings related to
CSA cements of Zhang and Glasser14.
To verify that a dosage of 58.4 fl. oz. of phosphonic acid admixture per 100 lb of BCA cement
was equivalent to a dosage of 0.4% citric acid, a setting time test was performed for each dosage
of retarder. Other dosages of phosphonic acid admixture were also tested to complement this
calorimetry study. Table 7 shows the results of those tests. It is also confirmed that the
aforementioned dosages of citric acid and phosphonic acid admixture provide around the same
initial and final setting time.

24
Table 7–Setting times by mortar penetrometer for citric acid and phosphonic acid admixture
Retarder Citric acid phosphonic acid admixture
Dosage 0.40% 58.4 fl. oz./ cwt
14.6 fl. oz./ cwt
Initial setting time 50 min 55 min 35 min Final setting time 55 min 1h 35 min
Water temperature (ºF) 77.5 81 72.1 Room temperature (ºF) 73.9 73.8 73.2
CONCLUSIONS
This study was intended to provide data on the effects of water content on slump of BCSA
concrete mixtures, the effect of w/c and citric acid dose on compressive strength, and the
influence of citric acid and phosphonic acid admixture on setting time. Some conclusions based
on the data presented here are as follows:
1) BCSA mixtures with citric acid experience a roughly linear decrease in
temperature of approximately 8.5ºF per 1% citric acid by cement weight.
2) Independent of the amount of citric acid, slump increases with increasing water,
as would be expected for PC.
3) For a given water content, slump increases with increasing citric acid dosage.
BCSA mixtures containing citric acid required a lower water content than would
be expected for PC to achieve adequate slump.
4) Much like for PC concrete, w/c has a strong influence on compressive strength
with lower w/c providing higher compressive strengths at every age and for every
citric acid dosage. Citric acid has a minimal effect on compressive strength
compared to w/c but obviously affects strength at a very early age (3 hours).

25
5) The results for the BCSA cement used in this study show that at 10 hours the
cement reaction is almost complete for all citric acid dosages.
6) A dosage of 58.4 fl. oz. of phosphonic acid admixture per 100 lb of BCSA cement
showed similar results to a dosage of 0.4% citric acid by cement weight in terms
of initial and final setting time, and thermal power peak. These dosages should
provide an initial setting time of approximately 50-55 minutes, which may be
desirable in many applications. 3 hour strengths of 4000 psi are possible at this
retarder dosage at a w/c of 0.4.
These conclusions and the relationships provided here can be used to help guide initial mixture
design for BCSA concrete mixtures, and should help provide a baseline for what is reasonable to
expect in concrete used in practice for other experimental studies.
REFERENCES
1. Skocek, J.; Zajac, M.; Bullerjahn F.; and Mohsen, B.H., “Effect of Retarders on the Early Performance of CSA-type Cement,” Cement and Concrete Research, V.84, 2016, pp.62-75.
2. Bescher, E.; Kim, J.; Ramseyer, C.; and Vallens, J. K., “Low Carbon Footprint Pavement: History of Use, Performance and New Oportunities for Beltic Calcium Sulfoaluminate,” Proceedings of the 13th International Symposium on Concrete Roads, Berlin, Jun. 2018.
3. Burris, L. E.; and Kurtis, K. E.; “Influence of Set Retarding Admixtures on Calcium Sulfoaluminate Cement Hydration and Property Development,” Cement and Concrete Research, 2018, pp. 105-113.
4. Bescher, E.; Stremfel, J.; Ramseyer, C.; and Rice, E., “The Role of Calcium Sulfoaluminate in Concrete Sustainability,” Twelfth International Conference on Recent Advances in Concrete Technology and Sustainability Issues, Prague, Czech Republic, Oct. 2012.
5. Klein, A., “Calcium sulfoaluminate and expansive cements containing same,” U.S. Patent No. 3, 1964.
6. Klein, A., “Expansive and shrinkage-compensated cements,” U.S. Patent No. 3, 1966.
7. Thomas, R.; Maguire, M.; Sorensen, A.; and Quezada, I., “Calcium Sulfoaluminate Cement,” Concrete International, 2018, pp. 65-69.

26
8. Murray, C. D.; Floyd, R. W.; and Ramseyer, C. C., “Using Belitic Calcium Sulfoaluminate
Cement for Precast, Prestressed Concrete Beams,” PCI Journal, 2019.
9. Ramseyer, C.; and Perez, V., “Highway Panel Replacement – CSA Concrete in California,” Concrete Pavement Technology Program (Federal Highway Administration), 2009.
10. Janotka, I.; and Krajèi, L., “Resistance to Freezing and Thawing of Mortar Specimens made from Sulphoaluminate – Belite Cement,” Bulletin of Materials Science, Vol. 23, No 6, Dec. 2000, pp. 521-527.
11. Moffatt, E.; and Thomas, M., “Durability of Rapid Strength Concrete Produced with Ettringite- Based Binders,” ACI Materials Journal, Jan. 2018, pp. 105-115.
12. Hargis, C. W.; Lothenbach, B.; Müller C. J.; and Winnefeld, F., “Carbonation of Calcium Sulfoaluminate Mortars,” Cement and Concrete Composites, V. 80, 2017, pp. 123-134.
13. Cook, G.; and Murray, C., “Behavior of Reinforced Concrete Made with Belitic Calcium Sulfoaluminate Cement at Early Ages,” ACI Materials Journal, Jan. 2020, pp. 167-174.
14. Zhang, L.; and Glasser, F. P., “Hydration of Calcium Sulfoaluminate Cement at Less than 24 h,” Advances in Cement Research, V. 40, 2002, pp. 141-155.
15. Soriano, E., “The influence of Citric Acid on Setting Time and Temperature Behavior of Calcium Sulfoaluminate-Belite Cement,” Civil Engineering Undergraduate Honors Theses. 50, 2019.
16. Cook, D.; Seader, N.; Ley, T.; and Rusell, B., “Investigation of Optimized Graded Concrete for Oklahoma-Phase 2”, Oklahoma Department of Transportation, Oklahoma City, 2015., pp.1-156.
17. “Standard Test Method for Slump of Hydraulic-Cement Concrete”, ASTM International, C143-C143M, 2015, pp. 1-4.
18. “Standard Practice for Making and Curing Concrete Test Specimens in the Laboratory”, ASTM International, C192-C192M-19, 2019.
19. “Standard Test Method for Compressive Strength of Cylindrical Concrete Specimens”, ASTM International, C39/ C39M-20, 2020.
20. “Standard Test Method for Time of Setting of Concrete Mixtures by Penetration Resistance”, ASTM International, C403/ C403M-16, 2016.
21. ACI Committee 211, “Standard Practice for Selecting Proportions for Normal, Heavyweight and Mass Concrete, ACI 211.1,” American Concrete Institute, Farmington Hills, MI. 1991, 38 pages.

27
22. Hover, K., “Graphical Approach to Mixture Proportioning by ACI 211.1-91.” Concrete
International. American Concrete Institute, Farmington Hills, MI, Sept. 1995, pp. 49-53.
23. Zou, D.; Zhang, Z.; and Wang, D., “Influence of Citric Acid and Sodium Gluconate on Hydration of Calcium Sulfoaluminate cement at various temperatures,” Construction and Building Materials, V. 263, 2020.
24. Winnefeld, F.; Lothenbach, B., “Hydration of Calcium Sulfoaluminate Cements – Experimental Findings and Thermodynamic Modeling”, Cement and Concrete Research, V. 40, 2010, pp. 1239-1247.