effect of antecolic versus retrocolic reconstruction for gastro/duodenojejunostomy on delayed...
TRANSCRIPT

Effect of antecolic versus retrocolic reconstruction forgastro/duodenojejunostomy on delayed gastric emptyingafter pancreaticoduodenectomy: A meta-analysis
Shuang-Shuang Cao,* Qi-Yuan Lin, Man-Xi He and Guang-Quan ZhangDepartment of Hepatobiliary Surgery, Sixth People’s Hospital of Chengdu, Chengdu, China.
Aim: The aim of this meta-analysis was to assess whether antecolic reconstruction is superior toretrocolic reconstruction for gastro/duodenojejunostomy with respect to delayed gastric emptying afterpancreaticoduodenectomy.Patients and Methods: A literature search of Medline (PubMed), EMBASE, OVID, EBSCO and the Cochranedatabase was done to identify randomized, controlled trials (RCT) comparing antecolic and retrocolic gastro/duodenojejunostomy after pancreaticoduodenectomy from January 1991 to April 2012. Four RCT involving 189patients, and comparing antecolic reconstruction with retrocolic reconstruction, were identified for inclusion.Results: The meta-analysis revealed that there was no significant difference between the two groups interms of operation time [mean difference (MD): 4.39, 95 per cent confidence interval (CI): −19.51 to 28.28,P = 0.72], intraoperative blood loss (MD: 22.51, 95 per cent CI: −160.56 to 205.58, P = 0.81), blood replace-ment (MD: −0.19; 95 per cent CI: −0.62 to 0.23, P = 0.38), mortality [odds ratio (OR): 0.32, 95 per cent CI:0.01–8.26, P = 0.49], morbidity (OR: 2.25, 95 per cent CI: 0.57–8.82, P = 0.24), delayed gastric emptying (OR:0.31, 95 per cent CI: 0.08–1.26, P = 0.10) and length of postoperative hospital stay (MD: −2.35, 95 per cent CI:−7.56 to 2.86, P = 0.38).Conclusion: Compared to retrocolic reconstruction, antecolic reconstruction for gastro/duodenojejunostomydoes not seem to offer an advantage with respect to delayed gastric emptying afterpancreaticoduodenectomy.
Key words: antecolic reconstruction, delayed gastric emptying, meta-analysis, pancreaticoduodenectomy,retrocolic reconstruction.
Introduction
Pancreatoduodenectomy (PD) has been accepted asa safe and primary treatment, offering the only chanceof cure for patients with periampullary malignancies.1
The first successful PD, in which the distal stomach,pylorus and duodenum were removed, was reportedindependently by Whipple2 and Trimble et al.3 in 1941.However, this procedure (classic PD) was associatedwith significant morbidity and mortality. Several yearslater, pylorus-preserving PD, which preserved thewhole stomach and 2.5 cm of the duodenum, andsubtotal stomach-preserving PD, which involvedremoving the duodenum, pyloric ring and 2 cm of thedistal stomach, were performed to decrease the inci-dence of postoperative complications.4,5 Despite the
improvements in surgical techniques, perioperativemanagement and interventional radiology, postopera-tive morbidities, including pancreatic fistula (PF),delayed gastric emptying (DGE), haemorrhage andintraabdominal abscess, still remain high.6,7 Thereported incidence of DGE varies from 9 per cent to 37per cent of patients, regardless of the type of PD.6,8,9
Although DGE is transient and not lethal, it not onlyleads to patient discomfort, but also increases the riskof aspiration pneumonia and prolongs hospital staysignificantly, which contribute to prohibitive hospitalexpenses.10,11 The occurrence of DGE was stronglyaffected by the reconstruction technique.12,13 There-fore, many modifications of the reconstruction methodhave been attempted to reduce the incidence of DGE.
There are two reconstruction routes for gastro/duodenojejunostomy: the antecolic route and theretrocolic route. Both methods have been widelyaccepted and commonly used according to surgeons’preferences. The antecolic route has recently been
*Author to whom all correspondence should be addressed.Email: [email protected] 6 December 2012; accepted 27 February 2013.
bs_bs_bannerSurgical Practicedoi:10.1111/1744-1633.12055 Original Article
© 2014 College of Surgeons of Hong Kong Surgical Practice (2014) 18, 72–81

advocated by some authors to decrease the incidenceof DGE.13–17 The incidence of DGE has been reportedto be greater than 30 per cent for the retrocolic routeand less than 15 per cent for the antecolic route,respectively.16 In contrast, two randomized, controlledtrials (RCT) and a retrospective study showed that theincidence of DGE did not differ between the tworeconstruction routes.18–20 In light of the ongoingcontroversy, the present meta-analysis provides anevidence-based evaluation. The primary outcome ofinterest was DGE.
Methods
Study selection
Both an Internet-based search and a manual searchwere used to acquire relevant studies. Multipledatabases and resources, including Medline(PubMed), EMBASE, OVID, EBSCO and the Cochranedatabase, were searched for RCT that evaluatedantecolic versus retrocolic reconstruction for gastro/duodenojejunostomy after any type of PD fromJanuary 1991 to April 2012. In addition, further articleswere identified by a manual search of reference listsfrom the retrieved publications. The following medi-cal subject headings or keywords were used withthe appropriate combinations: pancreaticoduo-denectomy, gastrojejunostomy, duodenojejunostomy,delayed gastric emptying, antecolic reconstructionand retrocolic reconstruction. Citations were limited:humans and English language and year = 1991.1–2012.1’ and randomized, controlled trials.
Inclusion and exclusion criteria
All included studies in the meta-analysis had tofulfil the following criteria: (i) explicitly reporting theindication of PD; (ii) comparing the results of ante-colic versus retrocolic reconstruction for gastro/duodenojejunostomy after PD; (iii) reporting on theoutcomes of DGE; and (iv) when two or multiplestudies were published by the same institution and/orauthors, either one of the higher-quality, or the mostrecent, article was included in the analysis. NonRCTand RCT with the number of patients less than 30 wereexcluded.
Study eligibility assessment
Two reviewers (SSC and YZ) independently identifiedand screened the search findings for potentially-eligible studies. Abstracts and full articles wereobtained for detailed evaluation, and eligible trialswere included into the meta-analysis. Any disagree-ments during the selection process were resolved
through discussions by the two reviewers, and whenthis did not resolve the differences, a third person(BLT) made a final decision on the eligibility of thestudy.
Data extraction and quality assessment
Data were independently extracted from each studyusing a standardized data-extraction tool by the tworeviewers (SSC and YZ), and then cross-checked.Data extracted from each study included first author,study period, study design, inclusion and exclusioncriteria, participant characteristics, interventions used,technique of reconstruction, definition of DGE, numberof DGE, morbidity and mortality rates, postoperativetime to remove nasogastric tube (NGT) and start liquidmeals and solid foods and length of hospital stay.Any disagreements were resolved applying the samemethod mentioned earlier. The Jadad scoring sys-tem, which evaluates studies based on appropriaterandomization, proper blinding and an adequatedescription of withdrawals and dropouts, was used toassess the quality of RCT in the study.21
Statistical analysis
Meta-analysis was performed in line with the recom-mendations of the Cochrane Collaboration using theRevman version 5.0 software package (CochraneLibrary). For continuous variables, the mean differ-ence (MD) was calculated with its 95 per cent confi-dence interval (CI). For dichotomous variables, theodds ratio (OR) was calculated with a 95 per cent CI.OR was defined as the odds of an adverse eventoccurring in the antecolic group compared with theretrocolic group, and it was considered statisticallysignificant at P < 0.05 if the 95 per cent CI did notcross the value 1. MD represented the differencebetween the two groups in the continuous variablesand was considered statistically significant at P < 0.05if the 95 per cent CI did not cross the value 0. Thedegree of heterogeneity between studies was meas-ured using χ2 and I2, with significance set at a P < 0.1and I2 > 50 per cent. Pooled effect was calculatedusing either the fixed-effect model or the random-effects model.
Results
Literature search results and theirgeneral characteristics
According to the literature searching strategies, fourRCT16–19 were identified for inclusion. The specific lit-erature screening process is shown in Figure 1. Thefour studies included a total of 189 patients: 93 in the
Antecolic versus retrocolic method 73
© 2014 College of Surgeons of Hong Kong Surgical Practice (2014) 18, 72–81
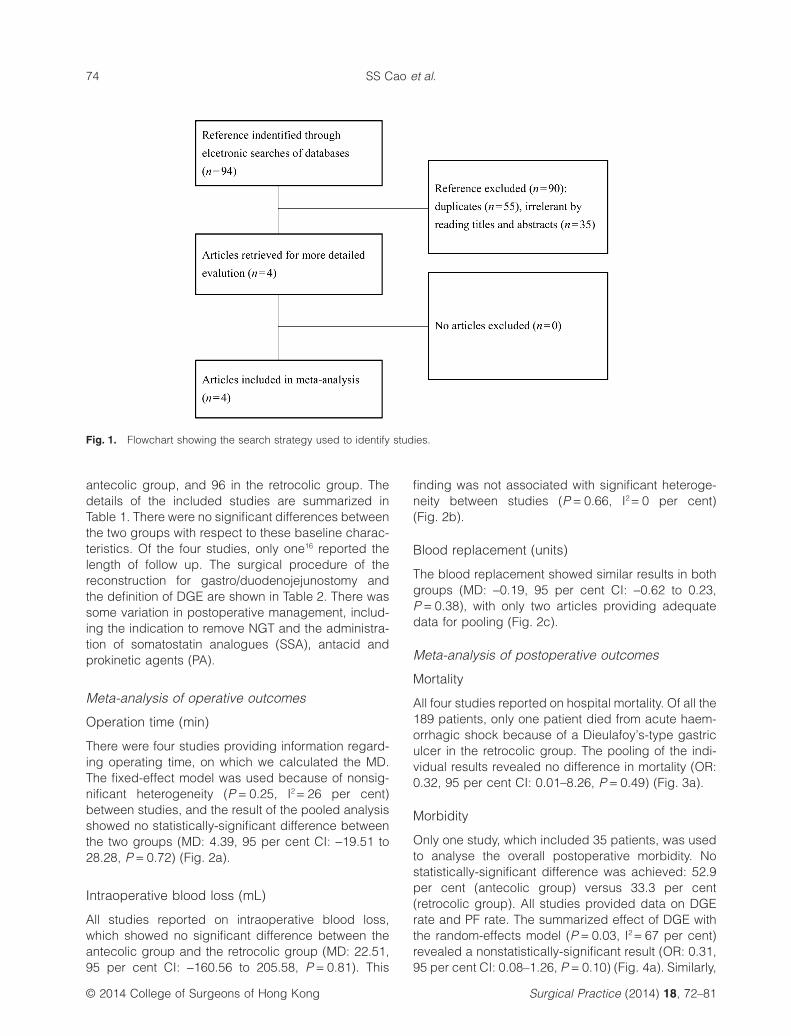
antecolic group, and 96 in the retrocolic group. Thedetails of the included studies are summarized inTable 1. There were no significant differences betweenthe two groups with respect to these baseline charac-teristics. Of the four studies, only one16 reported thelength of follow up. The surgical procedure of thereconstruction for gastro/duodenojejunostomy andthe definition of DGE are shown in Table 2. There wassome variation in postoperative management, includ-ing the indication to remove NGT and the administra-tion of somatostatin analogues (SSA), antacid andprokinetic agents (PA).
Meta-analysis of operative outcomes
Operation time (min)
There were four studies providing information regard-ing operating time, on which we calculated the MD.The fixed-effect model was used because of nonsig-nificant heterogeneity (P = 0.25, I2 = 26 per cent)between studies, and the result of the pooled analysisshowed no statistically-significant difference betweenthe two groups (MD: 4.39, 95 per cent CI: −19.51 to28.28, P = 0.72) (Fig. 2a).
Intraoperative blood loss (mL)
All studies reported on intraoperative blood loss,which showed no significant difference between theantecolic group and the retrocolic group (MD: 22.51,95 per cent CI: −160.56 to 205.58, P = 0.81). This
finding was not associated with significant heteroge-neity between studies (P = 0.66, I2 = 0 per cent)(Fig. 2b).
Blood replacement (units)
The blood replacement showed similar results in bothgroups (MD: −0.19, 95 per cent CI: −0.62 to 0.23,P = 0.38), with only two articles providing adequatedata for pooling (Fig. 2c).
Meta-analysis of postoperative outcomes
Mortality
All four studies reported on hospital mortality. Of all the189 patients, only one patient died from acute haem-orrhagic shock because of a Dieulafoy’s-type gastriculcer in the retrocolic group. The pooling of the indi-vidual results revealed no difference in mortality (OR:0.32, 95 per cent CI: 0.01–8.26, P = 0.49) (Fig. 3a).
Morbidity
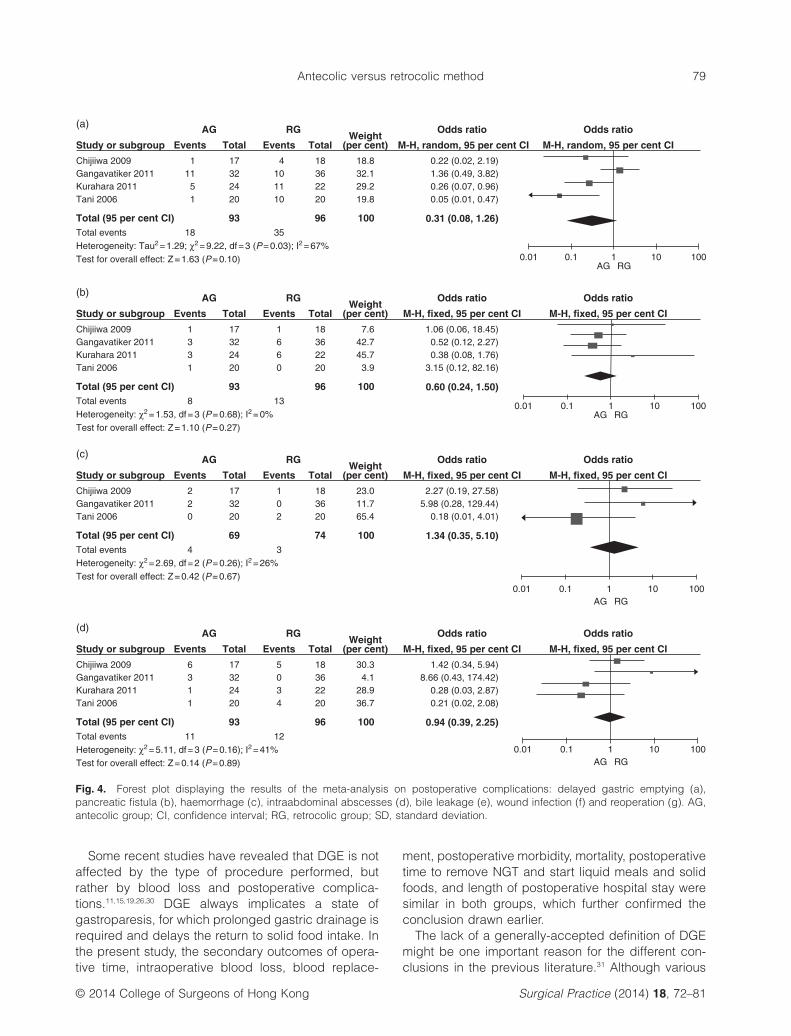
Only one study, which included 35 patients, was usedto analyse the overall postoperative morbidity. Nostatistically-significant difference was achieved: 52.9per cent (antecolic group) versus 33.3 per cent(retrocolic group). All studies provided data on DGErate and PF rate. The summarized effect of DGE withthe random-effects model (P = 0.03, I2 = 67 per cent)revealed a nonstatistically-significant result (OR: 0.31,95 per cent CI: 0.08–1.26, P = 0.10) (Fig. 4a). Similarly,
Fig. 1. Flowchart showing the search strategy used to identify studies.
SS Cao et al.74
© 2014 College of Surgeons of Hong Kong Surgical Practice (2014) 18, 72–81

the difference in the occurrence of PF between the twogroups was not statistically significant: 8.6 per centversus 13.5 per cent (OR: 0.60, 95 per cent CI: 0.24–1.50, P = 0.27) (Fig. 4b). Two studies also reportedon the grade of DGE, with no significant differencenoted: grade A (OR: 0.70, 95 per cent CI: 0.22–2.21,P = 0.54), grade B (OR: 0.55, 95 per cent CI: 0.17–1.73, P = 0.30) and grade C (OR: 0.97, 95 per cent CI:0.06–16.74, P = 0.98). There was no significant differ-ence between the antecolic group and retrocolicgroup in haemorrhage with respect to other complica-tions (OR: 1.34, 95 per cent CI: 0.35–5.10, P = 0.67)(Fig. 4c), intraabdominal abscesses (OR: 0.94, 95 percent CI: 0.39–2.25, P = 0.89) (Fig. 4d), bile leakage(OR: 1.52, 95 per cent CI: 0.45–5.14, P = 0.50)(Fig. 4e), wound infection (OR: 0.73, 95 per cent CI:0.31–1.69, P = 0.46) (Fig. 4f) and reoperation (OR:0.16, 95 per cent CI: 0.02–1.42, P = 0.10) (Fig. 4g).
Postoperative time to remove NGT (days)
The postoperative time to remove NGT was involved infour studies, and all studies reported the mean andstandard deviation. The random-effects model wasused due to significant heterogeneity (P = 0.09, I2 = 54per cent) between studies, and the overall effect indi-cated no difference between the antecolic group andthe retrocolic group (MD: −0.00, 95 per cent CI: −0.82to 0.81, P = 0.99) (Fig. 3b).
Postoperative time to start liquid meals (days)
Two studies evaluated postoperative time to startliquid meals. A meta-analysis of the two studies withthe fixed-effect model (P = 0.55; I2 = 0 per cent)showed that there was no significant difference in thepostoperative time to start liquid meals (MD: 0.16, 95per cent CI: −0.67 to 0.99, P = 0.71) (Fig. 3c).
Postoperative time to start solid foods (days)
There were three studies reporting the postoperativetime to start solid foods. The summarized effect withthe fixed-effect model (P = 0.33, I2 = 11 per cent)revealed no difference between the two groups (MD:−1.22, 95 per cent CI: −2.86 to 0.42, P = 0.15)(Fig. 3d).
Length of postoperative hospital stay (days)
The length of postoperative hospital stay wasdiscussed in four studies, and was found to bestatistically nonsignificant between the two groups(MD: −2.35, 95 per cent CI: −7.56 to 2.86, P =0.38). However, there was statistically-significantTa
ble
1.G
ener
alch
arac
teris
tics
ofth
ein
clud
edst
udie
s
Firs
tau
thor
Cou
ntry
Stu
dy
per
iod
Sur
ger
yG
roup
Pat
ient
s(n
)M
ales
/fe
mal
es(n
)
Mea
nag
e(y
ears
)Ja
und
ice,
n(
per
cent
)D
iab
etes
,n
(per
cent
)S
erum
alb
umin
(g/d
L)
Sof
tp
ancr
eas,
n(p
erce
nt)
Aet
iolo
gy
ofm
alig
nanc
y,n
(per
cent
)
Qua
lity
scor
e
Tani
16Ja
pan
2002
–200
4P
PP
DA
G20
11/9
63.1
±9.
21N
MN
MN
MN
M16
(80)
3R
G20
10/1
066
.7±
12.2
16(8
0)C
hijii
wa18
Jap
an20
05–2
007
PP
PD
AG
1711
/669
.7±
11.0
NM
5(2
9.4)
3.67
±0.
319
(52.
9)12
(70.
6)2
RG
189/
966
.9±
12.9
2(1
1.1)
3.71
±0.
4610
(55.
6)16
(88.
9)G
ang
avat
iker
19In
dia
2006
–200
8C
PD
,P
PP
DA
G32
23/9
52.8
±11
.627
(84.
4)7
(21.
9)3.
8±
0.6
NM
27(8
4.4)
2C
PD
,P
PP
DR
G36
26/1
050
.8±
10.6
30(8
3.3)
7(1
9.4)
3.8
±0.
532
(88.
9)K
urah
ara17
Jap
an20
07–2
010
SS
PP
DA
G24
16/8
67.6
±11
.610
(41.
7)5
(20.
8)3.
9±
0.4
13(5
4.2)
18(7
5)2
RG
2216
/662
.3±
12.6
9(4
0.9)
6(2
7.3)
4.1
±0.
312
(54.
5)17
(77.
3)
AG
,an
teco
licg
roup
;C
PD
,cl
assi
cp
ancr
eato
duo
den
ecto
my;
NM
,no
tm
entio
ned
;P
PP
D,
pyl
orus
-pre
serv
ing
pan
crea
tod
uod
enec
tom
y;R
G,
retro
colic
gro
up;
SS
PD
,st
omac
h-p
rese
rvin
gp
ancr
eato
duo
den
ecto
my.
Antecolic versus retrocolic method 75
© 2014 College of Surgeons of Hong Kong Surgical Practice (2014) 18, 72–81

Tab
le2.
Sur
gic
alre
cons
truc
tion,
defi
nitio
nof
del
ayed
gas
tric
emp
tyin
gan
dp
osto
per
ativ
em
anag
emen
tof
the
incl
uded
stud
ies
Firs
tau
thor
Gro
upR
econ
stru
ctio
nD
efini
tion
ofD
GE
Ind
icat
ion
for
rem
ovin
gN
GT
Sta
rtd
rinki
ngan
dea
ting
SS
AA
ntac
idPA
Tani
16A
GII
E-T
-SP
JE
-T-S
DJ
(a)
Asp
iratio
n>
500
mL/
day
from
NG
Tle
ft≥
PO
D10
;(b
)re
inse
rtio
nof
NG
T;(c
)fa
ilure
ofun
limite
dor
alin
take
by
PO
D14
Asp
iratio
n<
500
mL/
day
NM
No
H2
blo
cker
No
RG
Chi
jiiw
a18A
GII
E-T
-SP
JE
-T-S
DJ
(a)
NG
T≥
PO
D10
;(b
)re
inse
rtio
nof
NG
T;(c
)in
abili
tyto
tole
rate
anap
pro
pria
team
ount
solid
food
s≤P
OD
14
NM
NM
NM
H2
blo
cker
No
RG
Gan
gav
atik
er19
AG
IIE
-T-S
PJ
E-T
-SD
Jor
GJ
(1)
NG
T≥
PO
D10
plu
son
eof
the
follo
win
g:
(a)
emes
isaf
ter
NG
Tre
mov
ed;
(b)
use
ofp
roki
netic
agen
tsaf
ter
PO
D10
;(c
)re
inse
rtio
nof
NG
T;(d
)fa
ilure
top
rog
ress
with
die
t;or
(2)
NG
T<
PO
D10
plu
stw
oof
:(a
)th
roug
h(d
).IS
GP
Sd
efini
tion
was
also
app
lied
toth
efin
ald
ata
retro
spec
tivel
yat
the
time
ofan
alys
is
Asp
iratio
n<
200
mL/
day
on2
cons
ecut
ive
day
s
Liq
uid
sw
ere
star
ted
whe
nN
GT
was
rem
oved
Yes
PP
IYe
sR
G
Kur
ahar
a17A
GII
E-T
-SP
GE
-T-S
GJ
(IS
GP
Sd
efini
tion)
gra
de
A:
NG
Tre
qui
red
4–7
day
sor
rein
sert
ion
>P
OD
3or
unab
leto
tole
rate
solid
oral
inta
keb
yP
OD
7;g
rad
eB
:N
GT
req
uire
d8–
14d
ays
orre
inse
rtio
n>
PO
D7
orun
able
toto
lera
teso
lidor
alin
take
by
PO
D14
;g
rad
eC
:N
GT
req
uire
d>
14d
ays
orre
inse
rtio
n>
PO
D14
orun
able
toto
lera
teso
lidor
alin
take
by
PO
D21
Asp
iratio
n<
500
mL/
day
Ora
ldie
tw
asre
star
ted
with
wat
eror
tea,
and
pro
gre
ssed
inm
ultip
lest
eps
ever
y1–
2d
ays
toa
solid
die
t
NM
H2
blo
cker
NM
RG
I
AG
,ant
ecol
icg
roup
;DG
E,d
elay
edg
astr
icem
pty
ing
;DJ,
duo
den
ojej
unos
tom
y;E
-T-S
,end
tosi
de;
GJ,
gas
troje
juno
stom
y;I,
II,B
illro
thIa
ndB
illro
thII;
ISG
PS
,the
Inte
rnat
iona
lStu
dy
Gro
upof
Pan
crea
ticS
urg
ery;
NG
T,na
sog
astr
ictu
be;
NM
,not
men
tione
d;P
A,p
roki
netic
agen
ts;P
G,p
ancr
eatic
ogas
trost
omy;
PJ,
pan
crea
ticoj
ejun
osto
my;
PO
D,p
osto
per
ativ
ed
ay;
PP
I,p
roto
np
ump
inhi
bito
rs;
RG
,re
troco
licg
roup
;S
SA
,so
mat
osta
tinan
alog
ues.
SS Cao et al.76
© 2014 College of Surgeons of Hong Kong Surgical Practice (2014) 18, 72–81

heterogeneity between the groups in all availablestudies for the pooled analysis (P = 0.05, I2 = 61 percent) (Fig. 3e).
Heterogeneity analysis
A significant heterogeneity between the two groupswas observed in the DGE, grade C DGE, postopera-tive time to remove NGT and length of postoperativehospital stay. Given the heterogeneity, the random-effects model was applied for the analysis.
Discussion
DGE after PD was first reported by Warshaw andTorchiana in the 1980s.22 Although the exact mecha-nism of DGE has not been fully clarified, it is probablycaused by a complex interaction of various factors,including pylorospasm, caused by vagotomy anddecreased vascular supply to the antropyloric region,23
diminished circulating levels of motilin,24 torsion orangulation of the gastro/duodenojejunostomy25 and
other intraabdominal complications, such as ana-stomotic leakage, abscess and local inflammation.26
Despite Traverso and Kozuschek27 reporting adecade ago that antecolic reconstruction for gastro/duodenojejunostomy seems to be preferred, thereconstructive method of choice remains controver-sial. Several retrospective studies have recently pro-posed that an antecolic reconstruction for gastro/duodenojejunostomy during PD could significantlydecrease the rate of DGE. The authors of those studiesspeculated that antecolic gastro/duodenojejunostomycan avoid angulation, venous congestion and oedemaof the reconstructed alimentary tract.15,20,28,29 However,two RCT failed to find an advantage of antecolicreconstruction. This systematic review with a meta-analysis of RCT demonstrated that antecolic recon-struction for gastro/duodenojejunostomy could notdecrease the incidence of DGE after PD, which indi-cates that underpowered studies potentially over-estimate the benefits of antecolic reconstruction forgastro/duodenojejunostomy on DGE.
(a)
Study or subgroup
Total (95 per cent CI) 93 96 100
SD
AG RG Mean difference
Total
Heterogeneity: χ2 = 4.07, df = 3 (P = 0.25); I2 = 26%Test for overall effect: Z = 0.36 (P = 0.72)
17322420
IV, fixed, 95 per cent CIWeight
(per cent)
17.7
Mean difference
IV, fixed, 95 per cent CI
4.39 (–19.51, 28.28)
20.90 (–35.88, 77.68)
28.00 (–15.05, 71.05)–53.90 (–127.38, 21.38)
–6.00 (–43.25, 31.25)
–100 –50 500AG RG
100
41.210.330.8
SD
76.590
150.361
Total
18362220
Mean Mean
581.7
605.3372
351
Chijiiwa 2009Gangavatiker 2011Kurahara 2011Tani 2006
(b)
Study or subgroup
Total (95 per cent CI) 93 96 100
SD
AG RG Mean difference Mean difference
Heterogeneity: χ2 = 1.61, df = 3 (P = 0.66); I2 = 0%Test for overall effect: Z = 0.24 (P = 0.81)
Total
17322420
IV, fixed, 95 per cent CIWeight
(per cent) IV, fixed, 95 per cent CI
22.51 (–160.56, 205.58)
84.40 (–510.20, 679.00)
–198.00 (–1106.55, 710.55)–195.30 (–619.10, 228.50)
87.00 (–135.33, 309.33)
–100 –50 500AG RG
100
9.567.818.74.1
SD
877.7509
758.61915
Total
18362220
Mean Mean
1535
1621.6920
1285
Chijiiwa 2009Gangavatiker 2011Kurahara 2011Tani 2006
(c)
Study or subgroup SD
AG RG Mean difference Mean difference
Total IV, fixed, 95 per cent CIWeight
(per cent) IV, fixed, 95 per cent CI
–100 –50 500AG RG
100
SD TotalMean Mean
32 1.1 36Gangavatiker 2011
Total (95 per cent CI) 52 56 100Heterogeneity: χ2 = 0.03, df = 1 (P = 0.86); I2 = 0%Test for overall effect: Z = 0.89 (P = 0.38)
93.566
99.677
914.9426
703.1794
0.72.8 20
–0.19 (–0.62, 0.23)
–0.20 (–0.63, 0.23)0.00 (–2.10, 2.10)
95.94.11.9 20
602.6
552.3366
379
1619.4
1426.31007
1087
1.82.1
22.1Tani 2006
Fig. 2. Forest plot displaying the results of the meta-analysis on operative outcomes: operative time (a), intraoperative blood loss (b)and blood replacement (c). AG, antecolic group; CI, confidence interval; RG, retrocolic group; SD, standard deviation.
Antecolic versus retrocolic method 77
© 2014 College of Surgeons of Hong Kong Surgical Practice (2014) 18, 72–81

(a)
Study or subgroup
Total (95 per cent CI) 93 96 100
AG RG Odds ratio
Total
Total eventsHeterogeneity: Not applicable Test for overall effect: Z = 0.69 (P = 0.49)
17322420
M-H, random, 95 per cent CI
Odds ratio
M-H, random, 95 per cent CIWeight
(per cent)
1010.10.01AG RG
100
100
Total
183622
0.32 (0.01, 8.26)
0.32 (0.01, 8.26)
Not estimableNot estimableNot estimable
20
Events
0
00
0
Events
0
00
1
0 1
Chijiiwa 2009Gangavatiker 2011Kurahara 2011Tani 2006
(b)
Study or subgroup
Total (95 per cent CI) 93 96 100
SD
AG RG Mean difference Mean difference
Heterogeneity: Tau2 = 0.30; χ2 = 6.53, df = 3 (P = 0.09); I2 = 54%Test for overall effect: Z = 0.01 (P = 0.99)
Total
17322420
IV, random, 95 per cent CIWeight
(per cent) IV, random, 95 per cent CI
–100 –50 500AG RG
100
55.236.97.70.3
SD Total
18362220
Mean
1.2
2.34.8
4.2
Mean
1.1
4.54.4
18.9
Chijiiwa 2009Gangavatiker 2011Kurahara 2011Tani 2006
(d)
Study or subgroup SD
AG RG Mean difference Mean difference
Total
1732
IV, fixed, 95 per cent CIWeight
(per cent) IV, fixed, 95 per cent CI
–100 –50 500AG RG
100
SD Total
1836
Mean
8.48.9
Mean
Chijiiwa 2009Gangavatiker 2011
Total (95 per cent CI) 69 74 100Heterogeneity: χ2 = 2.24, df = 2 (P = 0.33); I2 = 11%Test for overall effect: Z = 1.46 (P = 0.15)
20
35.663.21.2
5.15.4
34.3 208.1
10.29.6
19.7Tani 2006
(e)
Study or subgroup
Total (95 per cent CI) 93 96 100
SD
AG RG Mean difference Mean difference
Heterogeneity:Tau2 = 15.45; χ2 = 7.70, df = 3 (P = 0.05); I2 = 61%Test for overall effect: Z = 0.88 (P = 0.38)
12.38.46.25.7
Total
17322420
IV, random, 95 per cent CIWeight
(per cent) IV, random, 95 per cent CI
–100 –50 500AG RG
100
22.635.334.1
8.0
SD
11.19.2
937.7
Total
18362220
Mean
40.8
20.416.3
28.7
Mean
39.4
24.815.3
47.7
Chijiiwa 2009Gangavatiker 2011Kurahara 2011Tani 2006
(c)
Study or subgroup SD
AG RG Mean difference Mean difference
Total IV, fixed, 95 per cent CIWeight
(per cent) IV, fixed, 95 per cent CI
–100 –50 500AG RG
100
SD TotalMean Mean
17 24.0185.4Chijiiwa 2009
Total (95 per cent CI) 49 54 100Heterogeneity: χ2 = 0.37, df = 1 (P = 0.55); I2 = 0%Test for overall effect: Z = 0.37 (P = 0.71)
0.41.83.1
4
33.11.6
2.72 32
–0.00 (–082, 0.81)
0.10 (–0.14, 0.34)
–14.70 (–30.57, 1.17)–2.20 (–4.96, 0.56)0.40 (–0.41, 1.21)
–1.22 (–2.86, 0.42)
–1.80 (–4.55, 0.95)–0.70 (–2.77, 1.37)
–11.60 (–26.55, 3.45)
–2.35 (–7.56, 2.68)
1.40 (–6.38, 9.18)
–19.00 (–35.71, –2.29)–4.40 (–8.91, 0.11)1.00 (–3.18, 5.18)
0.6 (–0.67, 0.99)
–0.30 (–2.00, 1.40)0.30 (–0.65, 1.25)76.0
0.31.65.936
2.42 366.6
5.76.3Gangavatiker 2011
Fig. 3. Forest plot displaying the results of the meta-analysis on postoperative outcomes: mortality (a), postoperative time to removenasogastric tube (b) and start liquid meals (c) and solid foods (d) and length of postoperative hospital stay (e). AG, antecolic group;CI, confidence interval; RG, retrocolic group; SD, standard deviation.
SS Cao et al.78
© 2014 College of Surgeons of Hong Kong Surgical Practice (2014) 18, 72–81
Some recent studies have revealed that DGE is notaffected by the type of procedure performed, butrather by blood loss and postoperative complica-tions.11,15,19,26,30 DGE always implicates a state ofgastroparesis, for which prolonged gastric drainage isrequired and delays the return to solid food intake. Inthe present study, the secondary outcomes of opera-tive time, intraoperative blood loss, blood replace-
ment, postoperative morbidity, mortality, postoperativetime to remove NGT and start liquid meals and solidfoods, and length of postoperative hospital stay weresimilar in both groups, which further confirmed theconclusion drawn earlier.
The lack of a generally-accepted definition of DGEmight be one important reason for the different con-clusions in the previous literature.31 Although various
(a)
Study or subgroup
AG RG Odds ratio
Total M-H, random, 95 per cent CI
Odds ratio
M-H, random, 95 per cent CIWeight
(per cent)
1010.10.01AG RG
100
TotalEvents Events
Total (95 per cent CI) 93 96Total eventsHeterogeneity: Tau2 = 1.29; χ2 = 9.22, df = 3 (P = 0.03); I2 = 67%Test for overall effect: Z = 1.63 (P = 0.10)
17322420
18362220
1
511
1
4
1110
18 35
10
Chijiiwa 2009Gangavatiker 2011Kurahara 2011Tani 2006
0.31 (0.08, 1.26)
0.05 (0.01, 0.47)0.26 (0.07, 0.96)1.36 (0.49, 3.82)0.22 (0.02, 2.19)
100
19.829.232.118.8
Total (95 per cent CI) 93 96Total eventsHeterogeneity: χ2 = 1.53, df = 3 (P = 0.68); I2 = 0%Test for overall effect: Z = 1.10 (P = 0.27)
17322420
18362220
1
33
1
1
66
8 13
0
Chijiiwa 2009Gangavatiker 2011Kurahara 2011Tani 2006
(b)
Study or subgroup
AG RG Odds ratio
Total M-H, fixed, 95 per cent CI
Odds ratio
M-H, fixed, 95 per cent CIWeight
(per cent)
1010.10.01AG RG
100
TotalEvents Events
0.60 (0.24, 1.50)
3.15 (0.12, 82.16)0.38 (0.08, 1.76)0.52 (0.12, 2.27)
1.06 (0.06, 18.45)
100
3.945.742.77.6
1732
1836
22
10
Chijiiwa 2009Gangavatiker 2011
Total (95 per cent CI) 69 74Total eventsHeterogeneity: χ2 = 2.69, df = 2 (P = 0.26); I2 = 26%Test for overall effect: Z = 0.42 (P = 0.67)
20 200
4 3
2Tani 2006
(c)
Study or subgroup
AG RG Odds ratio
Total M-H, fixed, 95 per cent CI
Odds ratio
M-H, fixed, 95 per cent CIWeight
(per cent)
1010.10.01AG RG
100
TotalEvents Events
1.34 (0.35, 5.10)
5.98 (0.28, 129.44)2.27 (0.19, 27.58)
0.18 (0.01, 4.01)11.723.0
100
65.4
Total (95 per cent CI) 93 96Total eventsHeterogeneity: χ2 = 5.11, df = 3 (P = 0.16); I2 = 41%Test for overall effect: Z = 0.14 (P = 0.89)
17322420
18362220
6
13
1
5
30
11 12
4
Chijiiwa 2009Gangavatiker 2011Kurahara 2011Tani 2006
(d)
Study or subgroup
AG RG Odds ratio
Total M-H, fixed, 95 per cent CI
Odds ratio
M-H, fixed, 95 per cent CIWeight
(per cent)
1010.10.01AG RG
100
TotalEvents Events
0.94 (0.39, 2.25)
0.21 (0.02, 2.08)0.28 (0.03, 2.87)
8.66 (0.43, 174.42)1.42 (0.34, 5.94)
100
36.728.94.1
30.3
Fig. 4. Forest plot displaying the results of the meta-analysis on postoperative complications: delayed gastric emptying (a),pancreatic fistula (b), haemorrhage (c), intraabdominal abscesses (d), bile leakage (e), wound infection (f) and reoperation (g). AG,antecolic group; CI, confidence interval; RG, retrocolic group; SD, standard deviation.
Antecolic versus retrocolic method 79
© 2014 College of Surgeons of Hong Kong Surgical Practice (2014) 18, 72–81

definitions for DGE exist, in recent years, two defini-tions, applied by Chijiiwa et al. and Gangavatikeret al., seem to be most widely used. In order to makethe comparison of results of different studies possible,the consensual definition of DGE proposed by theInternational Study Group of Pancreatic Surgery(ISGPS) was recommended from 2007.32 According tothe ISGPS, DGE was classified into grades A, B and Cbased on clinical impact. The present study showedthat the occurrence of ISGPS grades A, B and C DGEwas similar in the antecolic and retrocolic reconstruc-tion groups.
This meta-analysis of RCT might have some limita-tions that must be taken into account when consider-ing the final results. First, a test for heterogeneity wassignificant for DGE, grade C DGE, postoperative timeto remove NGT and the length of postoperative hos-pital stay. There are many differences between thestudies that serve as sources of heterogeneity, includ-ing differences in the nuances of surgical tech-
nique (Billroth I or Billroth II, pancreaticojejunostomy orpancreaticogastrostomy), definition of DGE, postop-erative drug use (SSA, antacid and PA) and indicationto remove NGT. Second, potential publication biasmight lie in in this meta-analysis. Studies with signifi-cant results are more prone to be published thanthose with nonsignificant results. Finally, a smallnumber of studies and poor-quality studies with(quality score < 3) were included in the meta-analysis.Due to multifactorial heterogeneity and only fourstudies being included, a subgroup analysis was notperformed. To reach an evidence-based consensuson the effect of antecolic reconstruction for gastro/duodenojejunostomy on DGE, much larger andrigorously-designed studies would be needed thanthose currently available.
In conclusion, the present meta-analysis of RCTshowed that antecolic reconstruction for gastro/duodenojejunostomy could not decrease the inci-dence of DGE after PD.
1732
1836
39
314
Chijiiwa 2009Gangavatiker 2011
Total (95 per cent CI) 69 74 100Total eventsHeterogeneity: χ2 = 0.34, df = 2 (P = 0.84); I2 = 0%Test for overall effect: Z = 0.74 (P = 0.46)
2073.918.7
7.4201
13 18
1Tani 2006
(f)
Study or subgroup
AG RG Odds ratio
Total M-H, fixed, 95 per cent CI
Odds ratio
M-H, fixed, 95 per cent CIWeight
(per cent)
1010.10.01AG RG
100
TotalEvents Events
0.73 (0.31, 1.69)
0.61 (0.22, 1.71)1.07 (0.18, 6.22)
1.00 (0.06, 17.18)
32 74.1360 4Gangavatiker 2011
Total (95 per cent CI) 52 56 100Total eventsHeterogeneity: χ2 = 0.22, df = 1 (P = 0.64); I2 = 0%Test for overall effect: Z = 1.64 (P = 0.10)
20
0.16 (0.02, 1.42)
0.11 (0.01, 2.15)0.32 (0.01, 8.26)25.9200
0 5
1Tani 2006
(g)
Study or subgroup
AG RG Odds ratio
Total M-H, fixed, 95 per cent CI
Odds ratio
M-H, fixed, 95 per cent CIWeight
(per cent)
1010.10.01AG RG
100
TotalEvents Events
Total (95 per cent CI) 93 96Total eventsHeterogeneity: χ2 = 3.53, df = 2 (P = 0.17); I2 = 43%Test for overall effect: Z = 0.68 (P = 0.50)
17322420
1.52 (0.45, 5.14)
0.32 (0.01, 8.26)0.43 (0.04, 5.16)
6.48 (0.71, 58.79)Not estimable
100
34.447.018.6
18362220
0
15
0
0
21
6 4
1
Chijiiwa 2009Gangavatiker 2011Kurahara 2011Tani 2006
(e)
Study or subgroup
AG RG Odds ratio
Total M-H, fixed, 95 per cent CI
Odds ratio
M-H, fixed, 95 per cent CIWeight
(per cent)
1010.10.01AG RG
100
TotalEvents Events
Fig. 4. Continued
SS Cao et al.80
© 2014 College of Surgeons of Hong Kong Surgical Practice (2014) 18, 72–81

References
1. Cascinu S, Falconi M, Valentini V, Jelic S, ESMO GuidelinesWorking Group. Pancreatic cancer: ESMO Clinical PracticeGuidelines for diagnosis, treatment and follow-up. Ann.Oncol. 2010; 21: v55–8.
2. Whipple AO. The rationale for cancer of the pancreas andampullary region. Ann. Surg. 1941; 114: 612–5.
3. Trimble IR, Parsons WB, Sherman CP. A one-stage opera-tion for the cure of carcinoma of the ampulla of Vater andthe head of the pancreas. Surg. Gynecol. Obstet. 1941; 73:711–22.
4. Watson K. Carcinoma of the ampulla of Vater: successfulradical resection. Br. J. Surg. 1941; 114: 612–5.
5. Hayashibe A, Kameyama M, Shinbo M, Makimoto S. Thesurgical procedure and clinical results of subtotal stomachpreserving pancreaticoduodenectomy (SSPPD) in compari-son with pylorus preserving pancreaticoduodenectomy(PPPD). J. Surg. Oncol. 2007; 95: 106.
6. Zerbi A, Balzano G, Patuzzo R, Calori G, Braga M, Carlo VD.Comparison between pylorus-preserving and Whipplepancreatoduodenectomy. Br. J. Surg. 1995; 82: 975–9.
7. Mosca F, Giulianotti PC, Balestracci T et al. Long-term sur-vival in pancreatic cancer: pylorus-preserving versus Whipplepancreatoduodenectomy. Surgery 1997; 122: 553–6.
8. Büchler MW, Friess H, Wagner M, Kulli C, Wagener V,Z’Graggen K. Pancreatic fistula after pancreatic head resec-tion. Br. J. Surg. 2000; 87: 883–9.
9. van Berge Henegouwen MI, Moojen TM, van Gulik TM,Rauws EA, Obertop H, Gouma DJ. Postoperative weightgain after standard Whipple’s procedure versus pylorus-preserving pancreatoduodenectomy: the influence oftumour status. Br. J. Surg. 1998; 85: 922–6.
10. Harkness GA, Bentley DW, Roghmann KJ. Risk factors fornosocomial pneumonia in the elderly. Am. J. Med. 1990; 89:457–63.
11. Park YC, Kim SW, Jang JY, Ahn YJ, Park YH. Factors influ-encing delayed gastric emptying after pylorus-preservingpancreatoduodenectomy. J. Am. Coll. Surg. 2003; 196: 859–65.
12. Bassi C, Falconi M, Molinari E et al. Reconstruction bypancreaticojejunostomy versus pancreaticogastrostomy fol-lowing pancreatectomy: results of a comparative study. Ann.Surg. 2005; 242: 767–71, discussion 771–3.
13. Kurosaki I, Hatakeyama K. Clinical and surgical factors influ-encing delayed gastric emptying after pyloric-preservingpancreaticoduodenectomy. Hepatogastroenterology 2005;52: 143–8.
14. Murakami Y, Uemura K, Sudo T et al. An antecolic Roux-enY type reconstruction decreased delayed gastric empty-ing after pylorus-preserving pancreatoduodenectomy. J.Gastrointest. Surg. 2008; 12: 1081–6.
15. Hartel M, Wente MN, Hinz U et al. Effect of antecolic recon-struction on delayed gastric emptying after the pylorus-preserving Whipple procedure. Arch. Surg. 2005; 140:1094–9.
16. Tani M, Terasawa H, Kawai M et al. Improvement of delayedgastric emptying in pylorus-preserving pancreaticoduo-denectomy: results of a prospective, randomized, controlledtrial. Ann. Surg. 2006; 243: 316–20.
17. Kurahara H, Shinchi H, Maemura K et al. Delayed gastricemptying after pancreatoduodenectomy. J. Surg. Res.2011; 171: e187–92.
18. Chijiiwa K, Imamura N, Ohuchida J et al. Prospectiverandomized controlled study of gastric emptying assessedby 13C-acetate breath test after pylorus-preservingpancreaticoduodenectomy: comparison between antecolicand vertical retrocolic duodenojejunostomy. J. HepatobiliaryPancreat. Surg. 2009; 6: 49–55.
19. Gangavatiker R, Pal S, Javed A, Dash NR, Sahni P,Chattopadhyay TK. Effect of antecolic or retrocolic recon-struction of the gastro/duodenojejunostomy on delayedgastric emptying after pancreaticoduodenectomy: arandomized controlled trial. J. Gastrointest. Surg. 2011; 15:843–52.
20. Eshuis WJ, van Dalen JW, Busch OR, van Gulik TM, GoumaDJ. Route of gastroenteric reconstruction in pancreato-duodenectomy and delayed gastric emptying. HPB (Oxford)2012; 14: 54–9.
21. Jadad AR, Moore RA, Carroll D et al. Assessing the qualityof reports of randomized clinical trials: is blinding neces-sary? Control. Clin. Trials 1996; 17: 1–12.
22. Warshaw AL, Torchiana DL. Delayed gastric emptyingafter pylorus-preserving pancreaticoduodenectomy. Surg.Gynecol. Obstet. 1985; 160: 1–4.
23. Fischer CP, Hong JC. Method of pyloric reconstructionand impact upon delayed gastric emptying and hospitalstay after pylorus-preserving pancreaticoduodenectomy.J. Gastrointest. Surg. 2006; 10: 215–9.
24. Strömmer L, Räty S, Hennig R et al. Delayed gastric empty-ing and intestinal hormones following pancreatoduo-denectomy. Pancreatology 2005; 5: 537–44.
25. Itani KM, Coleman RE, Meyers WC, Akwari OE. Pylorus-preserving pancreatoduodenectomy. A clinical and physi-ologic appraisal. Ann. Surg. 1986; 204: 655–64.
26. Horstmann O, Markus PM, Ghadimi MB, Becker H. Pyloruspreservation has no impact on delayed gastric empty-ing after pancreatic head resection. Pancreas 2004; 28:69–74.
27. Traverso LW, Kozuschek RA. Long-term follow-up afterpylorus-preserving pancreaticoduodenectomy for severecomplications of chronic pancreatitis. Dig. Surg. 1996; 13:118–26.
28. Paraskevas KI, Avgerinos C, Manes C, Lytras D, Dervenis C.Delayed gastric emptying is associated with pylorus-preserving but not classical Whipple pancreaticoduo-denectomy: a review of the literature and critical reappraisalof the implicated pathomechanism. World J. Gastroenterol.2006; 12: 5951–8.
29. Nikfarjam M, Kimchi ET, Gusani NJ et al. A reduction indelayed gastric emptying by classic pancreaticoduo-denectomy with an antecolic gastrojejunal anastomosis anda retrogastric omental patch. J. Gastrointest. Surg. 2009; 13:1674–82.
30. Riediger H, Makowiec F, Schareck WD, Hopt UT, Adam U.Delayed gastric emptying after pylorus-preserving pan-creatoduodenectomy is strongly related to other post-operative complications. J. Gastrointest. Surg. 2003; 7:758–65.
31. Traverso LW, Hashimoto Y. Delayed gastric emptying: thestate of the highest level of evidence. J. HepatobiliaryPancreat. Surg. 2008; 15: 262–9.
32. Wente MN, Bassi C, Dervenis C et al. Delayed gastric emp-tying (DGE) after pancreatic surgery: a suggested definitionby the International Study Group of Pancreatic Surgery(ISGPS). Surgery 2007; 142: 761–8.
Antecolic versus retrocolic method 81
© 2014 College of Surgeons of Hong Kong Surgical Practice (2014) 18, 72–81