effect of anisotropic grain boundary properties on grain boundary plane distributions during grain...
TRANSCRIPT
www.actamat-journals.com
Scripta Materialia 53 (2005) 351–355
Effect of anisotropic grain boundary properties on grainboundary plane distributions during grain growth
Jason Gruber a,*, Denise C. George b, Andrew P. Kuprat b,Gregory S. Rohrer a, Anthony D. Rollett a
a Department of Materials Science and Engineering, Carnegie Mellon University, 5000 Forbes Avenue, PA 15213, USAb Theoretical Division, Los Alamos National Laboratory, MS B221, Los Alamos, NM 87545, USA
Received 14 December 2004; received in revised form 25 March 2005; accepted 4 April 2005
Available online 13 May 2005
Abstract
The effects of anisotropic grain boundary properties on the evolution of boundary plane distributions were studied using three-
dimensional finite element simulations of normal grain growth. The distribution of boundary planes was affected by energy anisot-
ropy whereas no effect was observed for comparatively larger mobility anisotropy.
� 2005 Acta Materialia Inc. Published by Elsevier Ltd. All rights reserved.
Keywords: Grain growth; Grain boundaries; Grain boundary energy; Grain boundary mobility; Anisotropy
1. Introduction
The distribution of grain boundary types in a poly-
crystalline material has been shown to affect its bulk
properties, e.g. corrosion resistance [1]. Grain boundary
populations are specified by the grain boundary charac-
ter distribution, k(Dg,n), which is the relative areas ofdistinguishable grain boundaries parameterized by their
lattice misorientation (Dg) and boundary plane orienta-
tion (n) [2]. Previous experimental work has demon-
strated that significant texture can appear in grain
boundary character distributions and that low energy
boundaries occur in these distributions with greater fre-
quency than higher energy boundaries [2,3].
The influence of anisotropic grain boundary proper-ties on grain growth has been examined previously using
two-dimensional grain growth simulations [4–7]. The
conclusion from each of these studies was that the grain
boundary energy anisotropy was more influential than
1359-6462/$ - see front matter � 2005 Acta Materialia Inc. Published by El
doi:10.1016/j.scriptamat.2005.04.004
* Corresponding author. Tel.: +1 412 268 3044; fax: +1 412 268 3113.
E-mail address: [email protected] (J. Gruber).
the mobility anisotropy in determining the distribution
of grain boundary types. However, two-dimensional
simulations are unable to reproduce the topological
complexity of three-dimensional systems or to represent
the five-dimensional domain of grain boundary charac-
ter. A number of papers describe three-dimensional
grain growth simulations, but these were calculatedunder the assumption of isotropic grain boundary prop-
erties [8–12]. One of these methods (GRAIN3D) was
recently used to simulate growth in a system with aniso-
tropic grain boundary energies and successfully repro-
duced an experimentally observed grain boundary
character distribution [13]. The purpose of the present
work is to examine the relative effects of anisotropic
interfacial energy and mobility on the grain boundarycharacter distribution in materials undergoing normal
grain growth in three dimensions.
2. Simulations
The simulation results are provided by a three-dimen-
sional finite element model using the code GRAIN3D,
sevier Ltd. All rights reserved.
352 J. Gruber et al. / Scripta Materialia 53 (2005) 351–355
which is described in detail elsewhere [12,14]. Briefly,
GRAIN3D approximates the interfaces in a grain
boundary network as a mesh of triangular elements. No-
dal velocities are calculated by minimizing a functional
that depends on the local geometry of the mesh and
the (anisotropic) properties of the grain boundaries.Grain boundary properties are assigned on the basis of
the grain boundary character. The interfacial energy
c(Dg,n) and mobility M(Dg,n) functions we use are de-
fined by an interface plane scheme, in which we imagine
each boundary to be comprised of the two surfaces
bounding the grains on either side of the interface [2].
Taking n1 to be the interface normal pointing into grain
one and indexed in the crystal reference frame of thatgrain, and n2 to be the interface normal pointing into
grain two and indexed in the crystal reference frame of
that grain, the energy and mobility are assigned in the
following way:
c ¼ ðEðn1Þ þ Eðn2ÞÞ=2 ð1Þ
M ¼ ðlðn1Þ þ lðn2ÞÞ=2 ð2Þwhere the functions E(n) and l(n) are chosen as
E ¼ aX3
i¼1
ðjnij � 1=ffiffiffi3
pÞ2
" #þ 1 ð3Þ
l ¼ bX3
i¼1
ðjnij � 1=ffiffiffi3
pÞ2
" #þ 1 ð4Þ
where a and b are positive constants. Minima for either
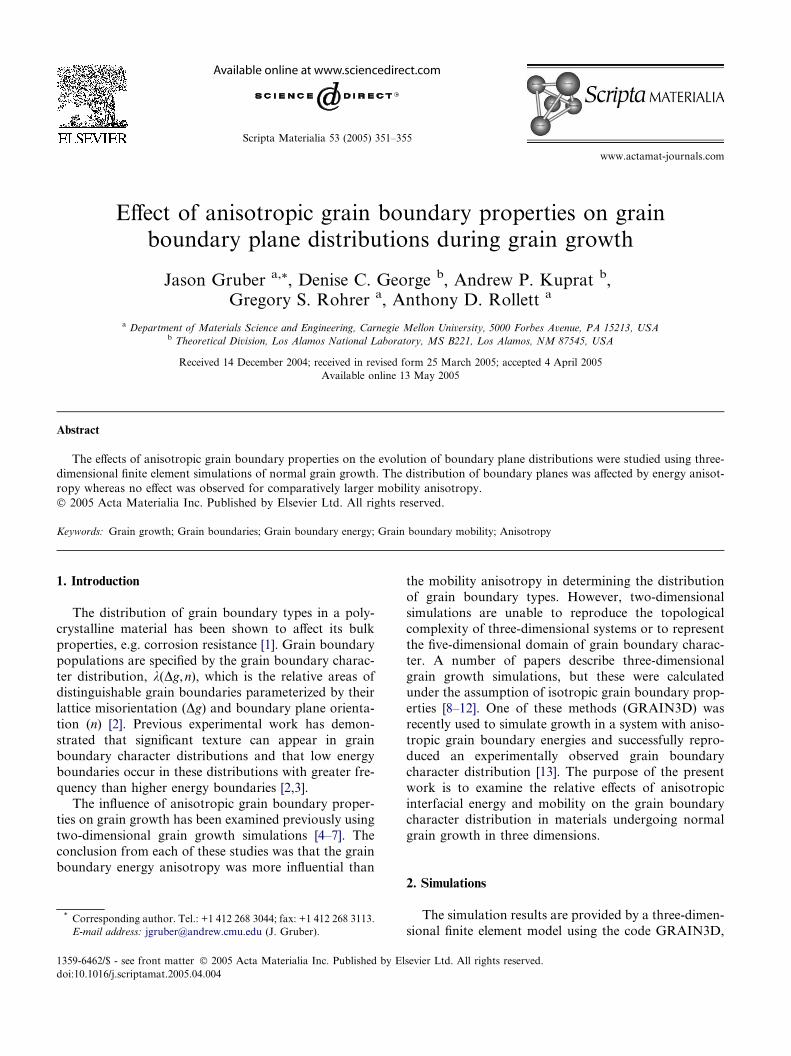
functional then occur with normal vectors of h111i typeand maxima with normal vectors of h100i type, as illus-trated in Fig. 1. Note that Eqs. (3) and (4) imply cubic
crystal symmetry. The choice of cubic symmetry mini-
mizes the number of grain boundaries necessary to pro-duce a statistically significant data set and simplifies the
analysis. The form of the energy function is also moti-
vated by experimental observations in Al [15].
The anisotropy of the energy function is controlled by
the parameter a. With a = 0 the function is isotropic and
with a = 0.2957, the ratio of the minimum to maximum
Fig. 1. Energy (En.) and mobility (Mob.) as a function of interface
normal vector, [001] stereographic projection. Scale values are in
arbitrary units.
energy is 1/1.25. Similarly, b controls the mobility anisot-
ropy; when b = 0 the mobility is isotropic and when
b = 13.60, the ratio of the minimum to maximum mobil-
ity is 1/12.5. Simulations were run for four situations: (1)
isotropic energy and mobility, (2) isotropic energy and
anisotropic mobility, (3) anisotropic energy and isotropicmobility, and (4) anisotropic energy and mobility.
The initial microstructure for each simulation was
produced from a regular volume-filling tetrahedral mesh
of the unit cube. This mesh consisted of 500,000 tetrahe-
dra. Grain centers were assigned randomly to individual
tetrahedra with the condition that no grain centers lie in
adjacent tetrahedra. After assigning 5000 grain centers,
all remaining tetrahedra were assigned to the nearestgrain. To produce a relatively equiaxed structure for
the simulations, isotropic grain growth was simulated
until about half of the grains remained. The mesh that
results from this procedure was taken as the starting
point for our simulations with anisotropic interfacial
properties.
In our simulations, individual grains are represented
by collections of tetrahedra, and so any grain boundaryis represented by a set of triangular elements. For each
triangular element, the lattice misorientation is parame-
terized by three Euler angles (/1,U,/2) and the bound-
ary orientation is parameterized by two spherical
angles (/,h). We use discrete binning to measure the rel-
ative populations of grain boundaries, with the five-
dimensional space of boundary types partitioned into
bins of equal volume with sizes of D/1 = D/2 = D/ =10� and DcosU = Dcosh = 1/9. This discretization results
in approximately 6.5 · 103 physically distinct grain
boundary types. We assume that making 1.3 · 105
observations, i.e. 20 times the number of distinct bound-
aries, will produce sufficiently accurate boundary popu-
lations. Although each face separating two grains is
represented in GRAIN3D as a number of triangular ele-
ments, the orientations of the triangles on each face areusually similar. Therefore, as a lower bound, we assume
that each face contributes only one distinct orientation.
The average grain is bounded by 13–14 faces, each of
which is shared with a neighbor grain, and therefore
contributes an average of about 6.5–7 observations. It
is therefore necessary to have data from more than
20,000 grains to ensure that the total number of obser-
vations is at least 20 times the number of distinguishableboundary types. The results from 20 simulations (51,560
grains initially) have therefore been combined to study
each case. The results presented here arise from the anal-
ysis of data sets with >20,000 grains.
3. Results
The grain boundary plane distributions reached a
steady state after a modest amount of growth, as found
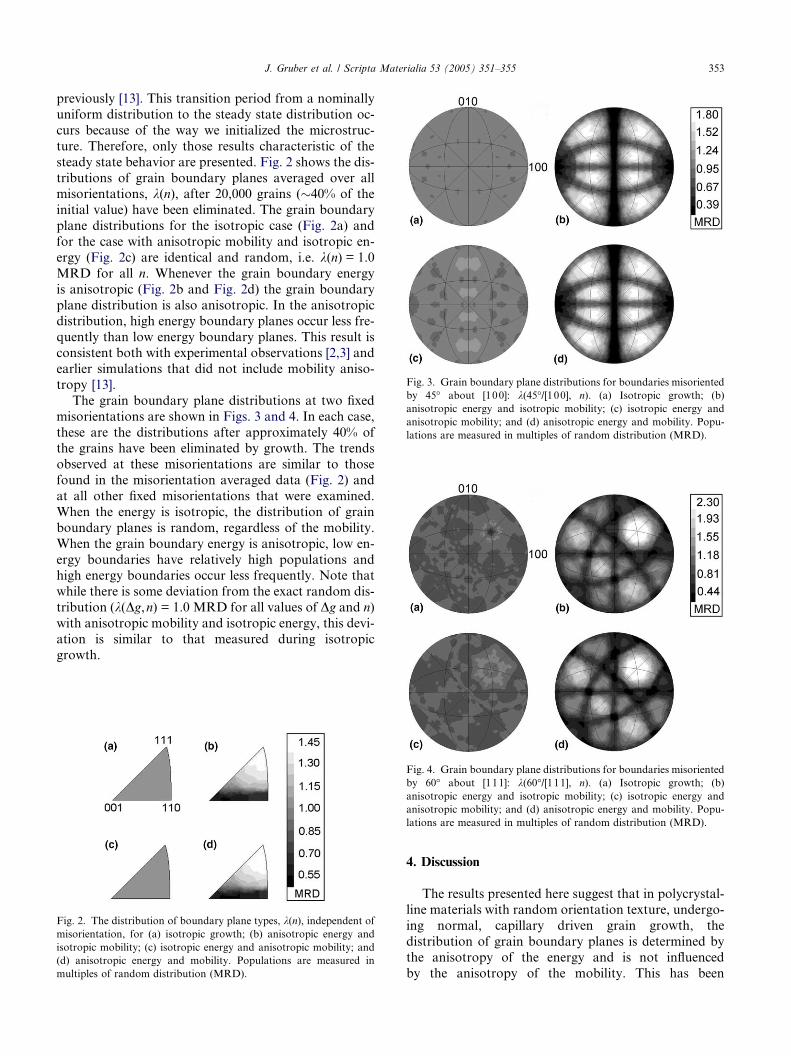
Fig. 3. Grain boundary plane distributions for boundaries misoriented
by 45� about [100]: k(45�/[100], n). (a) Isotropic growth; (b)
anisotropic energy and isotropic mobility; (c) isotropic energy and
anisotropic mobility; and (d) anisotropic energy and mobility. Popu-
lations are measured in multiples of random distribution (MRD).
J. Gruber et al. / Scripta Materialia 53 (2005) 351–355 353
previously [13]. This transition period from a nominally
uniform distribution to the steady state distribution oc-
curs because of the way we initialized the microstruc-
ture. Therefore, only those results characteristic of the
steady state behavior are presented. Fig. 2 shows the dis-
tributions of grain boundary planes averaged over allmisorientations, k(n), after 20,000 grains (�40% of the
initial value) have been eliminated. The grain boundary
plane distributions for the isotropic case (Fig. 2a) and
for the case with anisotropic mobility and isotropic en-
ergy (Fig. 2c) are identical and random, i.e. k(n) = 1.0
MRD for all n. Whenever the grain boundary energy
is anisotropic (Fig. 2b and Fig. 2d) the grain boundary
plane distribution is also anisotropic. In the anisotropicdistribution, high energy boundary planes occur less fre-
quently than low energy boundary planes. This result is
consistent both with experimental observations [2,3] and
earlier simulations that did not include mobility aniso-
tropy [13].
The grain boundary plane distributions at two fixed
misorientations are shown in Figs. 3 and 4. In each case,
these are the distributions after approximately 40% ofthe grains have been eliminated by growth. The trends
observed at these misorientations are similar to those
found in the misorientation averaged data (Fig. 2) and
at all other fixed misorientations that were examined.
When the energy is isotropic, the distribution of grain
boundary planes is random, regardless of the mobility.
When the grain boundary energy is anisotropic, low en-
ergy boundaries have relatively high populations andhigh energy boundaries occur less frequently. Note that
while there is some deviation from the exact random dis-
tribution (k(Dg,n) = 1.0 MRD for all values of Dg and n)
with anisotropic mobility and isotropic energy, this devi-
ation is similar to that measured during isotropic
growth.
Fig. 2. The distribution of boundary plane types, k(n), independent ofmisorientation, for (a) isotropic growth; (b) anisotropic energy and
isotropic mobility; (c) isotropic energy and anisotropic mobility; and
(d) anisotropic energy and mobility. Populations are measured in
multiples of random distribution (MRD).
Fig. 4. Grain boundary plane distributions for boundaries misoriented
by 60� about [111]: k(60�/[111], n). (a) Isotropic growth; (b)
anisotropic energy and isotropic mobility; (c) isotropic energy and
anisotropic mobility; and (d) anisotropic energy and mobility. Popu-
lations are measured in multiples of random distribution (MRD).
4. Discussion
The results presented here suggest that in polycrystal-
line materials with random orientation texture, undergo-
ing normal, capillary driven grain growth, the
distribution of grain boundary planes is determined by
the anisotropy of the energy and is not influenced
by the anisotropy of the mobility. This has been
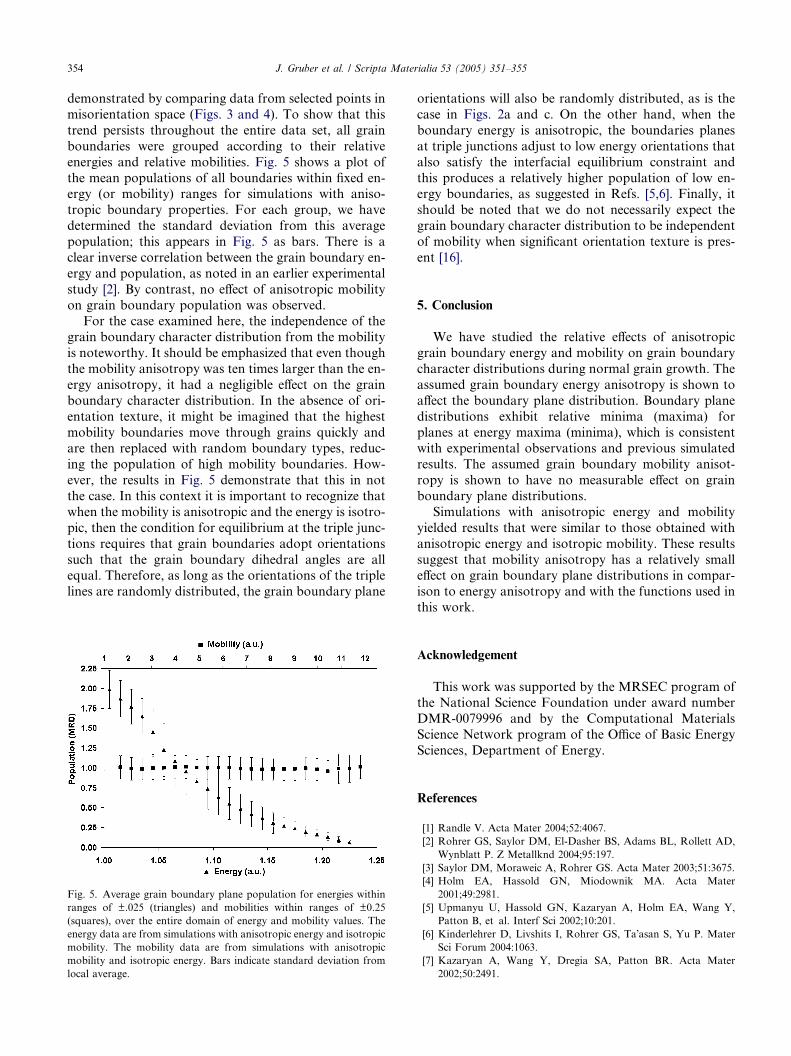
354 J. Gruber et al. / Scripta Materialia 53 (2005) 351–355
demonstrated by comparing data from selected points in
misorientation space (Figs. 3 and 4). To show that this
trend persists throughout the entire data set, all grain
boundaries were grouped according to their relative
energies and relative mobilities. Fig. 5 shows a plot of
the mean populations of all boundaries within fixed en-ergy (or mobility) ranges for simulations with aniso-
tropic boundary properties. For each group, we have
determined the standard deviation from this average
population; this appears in Fig. 5 as bars. There is a
clear inverse correlation between the grain boundary en-
ergy and population, as noted in an earlier experimental
study [2]. By contrast, no effect of anisotropic mobility
on grain boundary population was observed.For the case examined here, the independence of the
grain boundary character distribution from the mobility
is noteworthy. It should be emphasized that even though
the mobility anisotropy was ten times larger than the en-
ergy anisotropy, it had a negligible effect on the grain
boundary character distribution. In the absence of ori-
entation texture, it might be imagined that the highest
mobility boundaries move through grains quickly andare then replaced with random boundary types, reduc-
ing the population of high mobility boundaries. How-
ever, the results in Fig. 5 demonstrate that this in not
the case. In this context it is important to recognize that
when the mobility is anisotropic and the energy is isotro-
pic, then the condition for equilibrium at the triple junc-
tions requires that grain boundaries adopt orientations
such that the grain boundary dihedral angles are allequal. Therefore, as long as the orientations of the triple
lines are randomly distributed, the grain boundary plane
Fig. 5. Average grain boundary plane population for energies within
ranges of ±.025 (triangles) and mobilities within ranges of ±0.25
(squares), over the entire domain of energy and mobility values. The
energy data are from simulations with anisotropic energy and isotropic
mobility. The mobility data are from simulations with anisotropic
mobility and isotropic energy. Bars indicate standard deviation from
local average.
orientations will also be randomly distributed, as is the
case in Figs. 2a and c. On the other hand, when the
boundary energy is anisotropic, the boundaries planes
at triple junctions adjust to low energy orientations that
also satisfy the interfacial equilibrium constraint and
this produces a relatively higher population of low en-ergy boundaries, as suggested in Refs. [5,6]. Finally, it
should be noted that we do not necessarily expect the
grain boundary character distribution to be independent
of mobility when significant orientation texture is pres-
ent [16].
5. Conclusion
We have studied the relative effects of anisotropic
grain boundary energy and mobility on grain boundary
character distributions during normal grain growth. The
assumed grain boundary energy anisotropy is shown to
affect the boundary plane distribution. Boundary plane
distributions exhibit relative minima (maxima) for
planes at energy maxima (minima), which is consistentwith experimental observations and previous simulated
results. The assumed grain boundary mobility anisot-
ropy is shown to have no measurable effect on grain
boundary plane distributions.
Simulations with anisotropic energy and mobility
yielded results that were similar to those obtained with
anisotropic energy and isotropic mobility. These results
suggest that mobility anisotropy has a relatively smalleffect on grain boundary plane distributions in compar-
ison to energy anisotropy and with the functions used in
this work.
Acknowledgement
This work was supported by the MRSEC program ofthe National Science Foundation under award number
DMR-0079996 and by the Computational Materials
Science Network program of the Office of Basic Energy
Sciences, Department of Energy.
References
[1] Randle V. Acta Mater 2004;52:4067.
[2] Rohrer GS, Saylor DM, El-Dasher BS, Adams BL, Rollett AD,
Wynblatt P. Z Metallknd 2004;95:197.
[3] Saylor DM, Moraweic A, Rohrer GS. Acta Mater 2003;51:3675.
[4] Holm EA, Hassold GN, Miodownik MA. Acta Mater
2001;49:2981.
[5] Upmanyu U, Hassold GN, Kazaryan A, Holm EA, Wang Y,
Patton B, et al. Interf Sci 2002;10:201.
[6] Kinderlehrer D, Livshits I, Rohrer GS, Ta�asan S, Yu P. Mater
Sci Forum 2004:1063.
[7] Kazaryan A, Wang Y, Dregia SA, Patton BR. Acta Mater
2002;50:2491.

J. Gruber et al. / Scripta Materialia 53 (2005) 351–355 355
[8] Anderson MP, Grest GS, Srolovitz DJ. Philos Mag B
1989;59:293.
[9] Wegand D, Brechet Y, Lepinoux J, Gust W. Philos Mag B
1999;79:703.
[10] Wakai F, Enomoto N, Ogawa H. Acta Mater 2000;48:1297.
[11] Krill CE, Chen L-Q. Acta Mater 2002;50:3057.
[12] Kuprat AP. SIAM J Sci Comput 2000;22:535.
[13] Gruber J, George DC, Kuprat AP, Rollett AD, Rohrer GS.
Mater Sci Forum 2004. p. 733.
[14] Kuprat A, George D, Straub G, Demirel MC. Comput Mater Sci
2003;28:199.
[15] Saylor DM, El Dasher BS, Rollett AD, Rohrer GS. Acta Mater
2004;52:3649.
[16] Rollett AD. JOM 2004;56:63.