effect of additional magnesium on mechanical and high
TRANSCRIPT

Effect of additional magnesium on mechanicaland high-cycle fatigue properties of 6061 T6alloy
著者 Takahashi Yoshimasa, Shikama Takahiro,Nakamichi Ryota, Kawata Yuji, Kasagi Naoki,Nishioka Hironari, Kita Syuzaburo, TakumaMasanori, Noguchi Hiroshi
journal orpublication title
Materials Science and Engineering A
volume 641page range 263-273year 2015-06-20権利 This is a preprint submitted to Materials
Science and Engineering: A. Publisher'sversion is available fromhttp://doi.org/10.1016/j.msea.2015.06.051.(C) Elsevier
URL http://hdl.handle.net/10112/10313doi: 10.1016/j.msea.2015.06.051
brought to you by COREView metadata, citation and similar papers at core.ac.uk
provided by Kansai University Repository

1
Title:
Effect of additional magnesium on mechanical and high-cycle fatigue properties of 6061–T6
alloy
Authors & Affiliations:
Yoshimasa TAKAHASHI a,*, Takahiro SHIKAMA b, Ryota NAKAMICHI a, Yuji KAWATA a, Naoki
KASAGI a,**, Hironari NISHIOKA a, Syuzaburo KITA a, Masanori TAKUMA a, Hiroshi NOGUCHI c
a Department of Mechanical Engineering, Kansai University, 3-3-35 Yamate-cho, Suita-shi, Osaka
564-8680, Japan
b Kobe Steel Ltd., Aluminum & Copper Business (Chofu Works), 14-1 Chofu Minato-machi,
Shimonoseki,Yamaguchi 752-0953, Japan
c Department of Mechanical Engineering, Kyushu University, 744 Motooka, Nishi-ku, Fukuoka
819-0395, Japan
* Corresponding author
Tel: +81-6-6368-0748
E-mail: [email protected]
** Currently at Suzuki Motor Corporation Ltd.
Abstract:
The effect of additional solute magnesium (Mg) on mechanical and high-cycle-fatigue properties of
6061-T6 aluminum alloy is investigated in detail. By adding 0.5% and 0.8% Mg to the 6061-T6
alloy with a normal stoichiometric Mg2Si composition (base alloy), the alloy exhibits eminent
strain-aging characteristics demonstrated by the emergence of serrated flow, the negative

2
strain-rate-sensitivity and relatively weakened temperature dependency of flow stress. The
Mg-added new alloy also shows higher work-hardening rate than the base alloy particularly at initial
flow regime and at lower strain rate. The S-N curve of the new alloy shows a clear fatigue limit
which is absent in the base alloy. The fatigue limit of the new alloy is shown to be controlled by the
threshold against small crack growth. Moreover, the new alloy clearly exhibits a coaxing
phenomenon (time-dependent strengthening) which is absent in the base alloy. The coaxing effect is
attributed to the existence of a small quasi-non-propagating crack whose growth resistance gradually
increases during stress amplitude step-ups.
Key words:
6061-T6 alloys; Solute magnesium; Work-hardening; Strain-aging; Fatigue limit; Coaxing effect
Main text:
1. Introduction
The growing need for weight reduction of structural components has remarkably increased the
demand for high strength Aluminum (Al) alloys over the past decade particularly in automobile or
railroad industries. The 6061 alloy, a representative Al-Mg-Si (6XXX) alloy, is one of such material
class whose matrix can be age-hardened with precipitates of magnesium-silicide (Mg2Si) [1].
Despite its high specific strength, the high-cycle-fatigue (HCF) property of artificially aged 6061
(6061-T6) is inferior to conventional ferrous alloys in terms of fatigue limit; the stress-life (S-N)
curve of 6061-T6 shows no distinct knee-point around 105-106 cycles [1-4] like other non-ferrous
pure face-centered-cubic (FCC) alloys. The absence of a clear threshold in HCF regime hence
necessitates the introduction of a finite life strength (typically at 5 × 10⁷ ~ 108 cycles for Al alloys
[5]) to fatigue design, which has long been accepted as an inevitable engineering compromise while
the cost of data acquisition is monumental.

3
In order to change such a longstanding paradigm, several of the authors began to develop a new
6061-based prototype alloy and investigated its HCF property [6,7]. The concept of the new alloy
was to artificially control the appearance of a distinct fatigue limit through the addition of a
strain-aging capability. Such an idea originally came from a well-known classical theory regarding
the fatigue limit in ferrous alloys containing interstitials such as carbon (C) or nitrogen (N) [8-11].
Since possible interstitials (e.g. boron (B), C, N) were known to show hardly any solubility in Al
matrix at room temperature [12], the addition of strain-aging capability to 6061-T6 alloy had to be
achieved in a different way. Then it was found that the addition of small amount of substitutional
element (Mg) to the normal 6061-T6 alloy with a stoichiometric Mg2Si composition successfully
induced the Portevin–Le Chatelier (P–L) effect and, surprisingly, a distinct fatigue limit when
specimen with a small artificial defect was used [6]. Such a discovery (or more mildly termed an
interesting similarity to ferrous alloys) had never been explicitly reported to the best of authors’
knowledge.
Although the novelty and importance of the above phenomenon have been rapidly indicated in the
previous short note [6], the contents of the investigation remained rather introductory; it lacked e.g.
the detailed information on the strain-aging property (strain rate/temperature dependency), the
critical comparison of the growth property of life-controlling small crack during coaxing effect test,
the quantification of fatigue crack growth (FCG) resistance in terms of the fracture mechanics, etc.
In addition, the compositional design of the first prototype alloy, which was not necessarily
optimized for thermal processing, had to be further modified for practical use.
In this paper, the authors fully supplement the previously unaddressed data and revisit the
characteristic mechanical and HCF properties of the newly developed Al alloy in detail. Note that
these evaluations are thoroughly conducted again by using the modified version of the new Al alloy
(second prototype), which will provide not only a demonstration to the previous studies but also a
reliable basis for the forthcoming studies.

4
2. Materials and methods
The chemical composition of the tested Al alloys is listed in Table 1. The new alloys contain ca.
0.5wt% and 0.8wt% extra Mg compared with the base alloy with a stoichiometric Mg2Si
composition (Mg : Si = 1.73 : 1, mass ratio). The thermal process for the alloys is schematically
shown in Fig. 1. The homogenized ingots were pre-heated at 723 K (450 °C) and die-extruded to
form a round bar (23 mm) at a velocity of 50 mm s-1. During the extrusion process, the alloys were
self-heated and eventually solutionized at ca. 773 K (500 °C). The base alloy was then immediately
water-quenched. The new alloys, on the other hand, had to go through another solution treatment at a
higher temperature of 813 K × 3.6 ks (540 °C × 1 h) because the solubility of Mg2Si in the new
alloys was significantly reduced by the extra Mg when compared with the base alloy [13-15]. This
inevitably caused extreme grain coarsening (recrystallization) particularly at surface region where
severe flow strain was imposed during die extrusion (see Fig. 2) [16]. Such a side effect, which
eventually caused significant material loss in the previous prototype, was prevented by adding ca.
0.15% zirconium (Zr) to the alloys; the addition of Zr or scandium (Sc) has been shown to
remarkably restrict grain coarsening by pinning grain boundaries [17-19]. After quenching, all alloys
were age-hardened (463 K× 14.4 ks; 190 °C × 4 h) to obtain the peak hardness. The typical
microstructure of the alloys is shown in Fig. 3. The grains in all alloys are either {111} or {100}
oriented along the extrusion direction; see (a) and (b). The needle-like ’’ precipitates (G.P. zone)
oriented along the <100> are seen in both alloys; see (c). The precipitates aligned parallel to the
electron beam direction (i.e. normal to the printed surface) are shown as dots. The precipitates in the
new alloy are generally finer and denser than those in the base alloy. Other information regarding
grain size, hardness (both of which was measured on the cross-sectional plane normal to the
extrusion direction) and 0.2% proof strength are listed in Table 2. Note that the grain size of the new
alloy is somewhat larger than the base alloy owing possibly to the higher solutionization temperature.
This is, however, tolerable as it has no negative effect on the resultant hardness and strength after

5
aging treatment.
Specimens for tensile tests and fatigue tests were prepared from the above alloys. Fig. 4 shows
specimen geometry. For tensile tests, dog-bone shaped specimens having gauge length and diameter
of 30 mm and 8 mm, respectively, were machined parallel to the extrusion direction. For fatigue tests,
gauge length and diameter of 20 mm and 5 mm, respectively, were machined parallel to the
extrusion direction. The gauge portion of the fatigue specimens was electropolished to remove
damaged surface layer, and a small blind hole (diameter/depth: 300 m/300 m) was drilled at the
center of the gauge portion as a crack starter.
Tensile tests were conducted by using a uniaxial tester (AG-XplusTM, Shimadzu Ltd.) whose load
capacity was 50 kN. The gauge displacement was measures with a digital video type extensometer
(TRView XTM, Shimadzu Ltd.). The effects of strain rate and temperature on deformation properties
were evaluated: strain rate was changed by three orders of magnitude (5.6 × 10⁻⁵ ~ 5.6 × 10⁻³ s-1)
under the same temperature (298 K; 25 °C), and three different temperatures (298, 323 and 373 K;
25, 50 and 100 °C) were employed and controlled within ± 3 K (°C) during the tests (strain rate: 5.6
×10-4 s-1). All the tests were conducted in ambient air.
Fatigue tests were conducted by using a multiple rotating bending tester (GIGA QUADTM
YRB200, Yamamoto Metal Technos Co. Ltd.) that allowed four parallel testing at the same time. The
machine employed cantilever bending as the loading method; one end of the specimen was fixed to
the spindle by a collet chuck, and the other end was loaded by a dead weight. Since this loading
mode inherently generated small amount of shear stress which was completely absent in pure
bending mode (e.g. Ono-type tester), the fatigue properties of 6061-T6 alloy were preliminarily
compared in these different methods. No differences regarding fatigue crack growth (FCG) property
and the resultant fatigue life were confirmed. The comparison of the present study to the former ones
[6,7] using Ono-type tester is therefore acceptable. All the tests were conducted in ambient air at
room temperature, fatigue frequency and stress ratio of 50 Hz and -1, respectively. FCG was mainly

6
observed by plastic replica technique, and supplement analyses were also done by the scanning
electron microscopy (SEM).
3. Results
3.1 Tensile properties
Fig. 5 shows the stress-strain behavior of three alloys (base, 0.5%Mg added, 0.8%Mg added)
under different strain rate conditions. In the uniform deformation stage before ultimate tensile
strength (UTS) is achieved, no eminent strain rate effect is observed in the base alloy within the
current range. On the other hand, the new alloys clearly show strain rate dependency; the flow stress
generally becomes higher at lower strain rate. Such negative strain-rate-sensitivity (nSRS) is seen to
be also accompanied by serrated flow (P–L effect) [20-22] which is eminent at lower strain rate and
at higher Mg content. Note that a normal 6061-T6 alloy, like other pure metals, has been reported to
show positive strain-rate-sensitivity (pSRS), while its rate dependency to be very weak at strain rate
less than 10-1 s-1 [23]. Hence the observed nSRS in the new alloys at the current strain rate range (<<
10-1 s-1) is rather a unique characteristic.
Fig. 6 shows the effect of temperature on stress-strain behavior. The constant decrease of flow
stress at higher temperature is eminent in the base alloy; UTS decreases 40 MPa at 373 K. The new
alloys, on the other hand, are much more insensitive to temperature rise; flow behavior is almost the
same between R.T. and 323 K (or even slightly higher at 323 K), and the decrease of UTS at 373 K
is 20 MPa and 12 MPa for 0.5%Mg alloy and 0.8%Mg alloy, respectively. The weak (or partly
inverse!) temperature sensitivity is quite noteworthy as it suggests that the present new alloys have
potential benefit in high-temperature usage that the conventional 6061-T6 has not been applied.
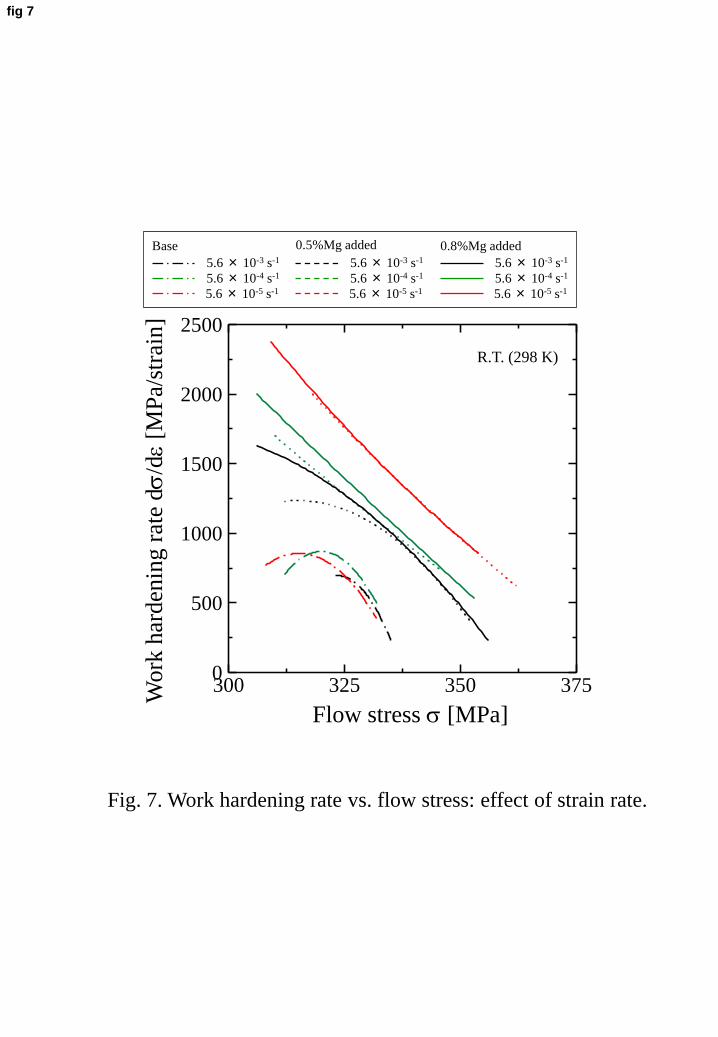
Fig. 7 shows the relation between work-hardening rate, d/d, and flow stress, , at different
strain rates. The data shown here were taken from smooth – curves fitted to the original serrated
curves. The work-hardening rate of the new alloys is clearly higher than that of the base alloy

7
particularly at lower strain rate, and the difference of work-hardening behavior due to different Mg
content (0.5%, 0.8%) is not so large in the current comparison. The pronounced work-hardening
behavior of the new alloys is reminiscent of that typically observed in solute-hardened Al-Mg alloys
[20,21,24,25] that also exhibit P–L effect. The clear effect of strain rate shown here again suggests
the strain-aging characteristic (i.e. the slower the stronger) of the new alloys.
3.2 Fatigue test
3.2.1 S-N behavior analysis
Fig. 8 shows the S-N diagrams of the base alloy and the new alloy (0.5%Mg added). The overall
fatigue strength of the new alloy is superior to the base alloy. Such a difference at finite life regime is
primarily attributed to the different FCG resistance as shown in Fig. 9; the FCG in the new alloy is
generally slower than the base alloy. The evolution of crack shape is schematically shown in the
figure: two corner cracks are independently initiated at the hole brim where the elastic stress
concentration is maximum (step (i)); the two cracks are connected behind the hole and form a
thumbnail crack (step (ii): l ≈ 500 m); the thumbnail crack keeps the similar shape and continues
growing (step (iii): l > 500 m). The aspect ratio (a/c) of the thumbnail cracks in steps (ii) and (iii)
was confirmed by statically fracturing the pre-fatigued specimens; a/c = 0.86 was obtained. Then, a
semi-circular assumption (a/c = 1) was employed and the stress intensity factor range (K) at the
deepest point ( = /2) was calculated with the following formula for a semi-circular surface crack
in a semi-infinite body under mode I loading [26]:
2πσ
π
2.2a
lK (1)
The FCG resistance represented by dl/dN-K relation is shown in Fig. 10. It can be seen that the new
alloy exhibits higher resistance particularly at high K regime. It should be added that the data
shown in Fig. 10 may not be regarded as that of a long crack measured with a standard fracture

8
mechanics specimen because the present crack dimension is less than a few millimeters [4].
The S-N diagram of the base alloy can be approximated to a smooth continuous curve; Nf
gradually increases with decreasing a even beyond 106-cycle-orders. Note that such a trend is the
same as that observed for unalloyed pure Al [27-30] or 6061 with higher Si content [2]. In contrast,
the curve of the new alloy shows clear discontinuity; Nf significantly increases at a between 90
MPa and 95 MPa (fatigue limit: 92.5 MPa). Fig. 11 shows the FCG behavior of a run-out specimen
of the new alloy fatigued slightly below the fatigue limit (a = 90 MPa, 1.0 ×10⁸ cycles). It is seen
that the initiated cracks (denoted as C1 and C2) gradually decelerate to the growth rate order of 10-13
m cycle-1, which can be regarded as almost non-propagating. Such non-propagating cracks were also
seen in other run-out specimens. The distinct fatigue limit of the new alloy can therefore be viewed
as the threshold against small crack growth.
3.2.2 Coaxing effect analysis
Base alloy
Fig. 12 and Table 3 summarize the results of a step-up tests for the base alloy. Three specimens
(Nos. B1, B2 and B3) were pre-fatigued to certain cycles at relatively low a, and the subsequent a
was gradually increased (a= 2.5 MPa) when the specimen passed 107 cycles without failure. In
the cases of specimens B1 and B2, no life-controlling cracks appeared before the final a step; Nf
values of B1 and B2 were determined by the cracks emanated at the final a steps of 85 MPa and
87.5 MPa (not shown in the figure), respectively. As the Nf values of B1 and B2 at the final step are
comparable to that of virgin ones (see Fig. 12(a)), the fatigue history before the final step has no
influence in these specimens. In the case of specimen B3, on the other hand, a non-propagating crack
(M1) appeared during the pre-fatigue period (a = 75 MPa, 1.5 ×10⁸ cycles). This micro crack
showed no eminent growth even after the fourth a was completed (see Figs. 12(b)(c)). Another
micro crack (M2), which was absent in the pre-fatigue period, appeared during the a step-ups

9
although its growth rate was significantly slow (ca. 10-14 m cycle-1). As the dimension of these cracks
is several times the grain size, they can be considered as microstructurally small cracks whose
growth is hindered e.g. by a large inclusion or a grain boundary with a relatively large orientation
difference [2,31-33]. The a step-ups in specimen B3 can then be interpreted as an extra driving
force required for overcoming the incidentally imposed microstructural barriers. In summary of
these results, it is postulated that the base alloy exhibits no eminent coaxing effect (i.e. intrinsic
strengthening) where the specimen is “coaxed” to attain a better fatigue resistance during the gradual
a step-ups [8].
New alloy
Fig. 13 and Table 3 summarize the results of a step-up tests for the new alloy (0.5%Mg added).
Three specimens (Nos. N1, N2 and N3) were pre-fatigued to 1 × 10⁸ cycles at a lower than the
fatigue limit, and infinitesimal a(= 2.5 MPa) was applied every 107 cycles except for N3 (every
106 cycles). The FCG behavior in specimen N1 is particularly focused here. A few small cracks, one
of which became the life-controller (M1) in the later stage, had already appeared in the pre-fatigue
cycles (a = 85 MPa, ~ 1.0 ×10⁸ cycles) as shown in Figs. 13(b)(c). The application of afurther
promoted initiation of other small cracks including the second life-controller (M2). At this point,
these cracks were confirmed to be independent of each other by SEM. M1 and M2 then continued to
grow exclusively and completely coupled behind the drill hole when a = 107.5 MPa was passed
(see Fig. 13(c)) although the growth rate during the a step-ups was generally very small (< 10-12 m
cycle-1 order). The united cracks eventually bore the 10th a without shifting to a fatal growth
mode. The maximum K achieved by this quasi-non-propagating crack at the semifinal step (a =
110 MPa, 1.0 × 10⁷ cycles) is calculated by Eq. (1) as 2.6 MPam1/2, which would normally cause
orders of magnitude faster FCG in a specimen with no pre-fatigue treatment (see Fig. 10). The Nf
value at the final step (a = 112.5 MPa) is also far larger than that of the normally fatigued sample.

10
The FCG in specimen N2 showed the same trend as N1. All these data clearly suggest the presence
of coaxing effect in specimens N1 and N2.
It is interesting to note that specimen N3, whose fatigue cycles in each step was ceased at much
short cycles (106 cycles), shows no sign of coaxing effect; Nf of N3 at the final step (a = 112.5
MPa) is almost the same as the normally fatigued sample. In other words, the manifestation of
coaxing effect is dependent on the duration of each a step.
4. Discussion
Originally, the modification of the stoichiometric 6061 alloy composition with extra Si or Mg has
been an important issue from a plasticity processing viewpoint [14-15]; these extra elements have
been shown to affect various indices such as proof strength, UTS, ductility (formability) [16]. The
addition of excess Si has now become an important measure to improve these indices except that it
generally reduces toughness and hence formability [14,16,34]. The effect of extra Mg, on the other
hand, has not been extensively (and perhaps eagerly) investigated as that of Si owing possibly to its
overriding negative impact (i.e. significant lowering of Mg2Si solubility and the resultant insufficient
strengthening). Meanwhile, the present study shows that such a negative effect of adding Mg can be
effectively avoided by combining appropriate thermal process condition and compositional design:
the strength level at initial flow (proof strength) is maintained and, moreover, the subsequent
work-hardenability (plus strain-aging capability) is further introduced. Such characteristics are
attributed to the coexistence of G.P. zone (for Al-Mg2Si quasi-binary alloy, Mg : Si = 2 : 1, atomic
ratio [35]) and the unbound Mg atoms that remain as free solutes.
It is well known that the emergence of P–L effect (one of the manifestation of strain-aging
capability) and its properties in Al-Mg binary alloys depend on temperature, strain rate and Mg
content as has been extensively investigated e.g. by Král and Lukáč (Al-2.75%Mg, Al-4.8%Mg) [36]
or by Pink and Grinberg (Al-5%Mg) [37]. The amount of Mg in these examples is, however,

11
relatively higher than the present study (< 1.0%), which restricts a quantitative comparison. Table 4
summarizes the conditions where P–L effect is observed in alloys containing dilute Mg (< 1%). Note
that the table includes data obtained for as-quenched (unaged) or annealed (O-tempered) Al-Mg2Si
alloys containing Mg as free solutes. It can be seen that the P–L sensitivity of the present new alloy
on each parameter is by and large the same as these reported cases. This may again suggests that the
coexistence of G.P. zone in the matrix have little effect on the strain-aging capability of the present
new alloy.
The drastic change of HCF properties by the addition of extra Mg is clearly demonstrated; the S-N
diagram of the present new alloy (i.e. the second prototype material) exhibits a distinct knee-point in
106-cycle-order which is absent in the base alloy (Fig. 8). Such a sudden jump of fatigue life is
obviously attributed to the arrest of a small crack which would lead the specimen to failure at a
slightly higher a level. The self-arrest of a small crack under constant a level is, however, a
phenomenon also incidentally found in the base alloy (Fig. 12). The existence/inexistence of a
distinct threshold against small FCG (as well as the coaxing effect) in these different alloys should
then be discussed in terms of the different underlying micro-mechanisms.
Several mechanisms can account for the self-arrest of small fatigue cracks in general: they are
typically (i) grain/phase boundary blocking of the crack tip slip [31-33], (ii) crack closure effect
[4,42] and (iii) local work hardening around the crack tip [43]. Since (i) is essentially a stochastic
factor that can be expected in both alloys, it is difficult to rationally explain the distinct threshold
that appeared only in the new alloy. The factor (ii), which is an extrinsic type of resistance that
reduces the true driving force (Keff), is expected to play a certain role in retarding FCG. It is,
however, difficult to explain the clear coaxing effect that appeared only in the new alloy. It then
appears that the factor (iii) plays an important role in the characteristic small crack behavior in the
new alloy.
Note that the effect of notch-induced K transient [44] is believed to be not important in the present

12
case: this mechanism is said to count only when the crack length from the notch root falls in the
range of r/20 ~ r/4 (r: notch radius) if an ordinary elliptical notch with kt > 2 (kt: stress concentration
factor) is of concern. Another type of notch effect that results from the notch-tip plasticity (i.e. the
temporal retardation or arrest of a small crack embedded in the notch-tip plastic zone [4]) can be
neglected in the present case: the local a at the hole brim (kta), at which non-propagating cracks
were observed, is calculated to be 190 ~ 230 MPa (kt = 2.5 [45]), which is much smaller than the
proof stress (> 300 MPa).
It should be recalled that the enhancement of work-hardening in the present new alloy can be
attributed to its strong strain-aging capability (i.e. time-dependent strengthening mechanism). In
addition, the new alloy shows much higher work-hardenability than the base alloy particularly at the
initial flow regime (see Fig. 7). It is therefore postulated that the resistance against cyclic slip at the
initial crack tip is significantly increased by the factor (iii) to the extent that it hardly continue at the
applied K level. In this first retardation process, crack tip slip may be also shifted to a non-localized
mode by Mg solutes and perhaps facilitate crack closure. Once the FCG is retarded, the crack tip
resistance can be further increased by solute aging provided that the constant a level is prolonged
for a long time period (e.g. > 107 cycles). Such a time-dependent strengthening mechanism
successfully keeps the FCG almost negligible even though the applied a is slightly shifted to a
higher level. The solute stabilization effect keeps the life-controlling crack to be
quasi-non-propagating until the applied K finally overrides the effect and a usual fast FCG mode is
attained. On the other hand, the solute stabilization effect cannot be expected in the base alloy as no
extra solute Mg is present in the matrix. It is also noted that the base alloy is susceptible to slip
localization caused by the shearing of precipitates [46,47]. These factors are believed to concurrently
cause significant slip instability: the crack tip slip process is likely to continue even though it is
temporarily shielded e.g. by grain boundaries [2]. This is why the base alloy exhibits neither a
distinct threshold in its S-N curve nor a clear coaxing effect.

13
Although the emergence of a distinct fatigue limit in the new age-hardened Al alloy is an
eye-opening phenomenon, it has been only observed in specimens with a surface blind hole. Our
previous survey on electropolished smooth specimens (0.5%Mg added, first prototype alloy)
confirmed no distinct fatigue limit [7], indicating that the mechanical threshold for the initiation
and/or propagation of the life-controlling cracks was not uniquely dependent on the nominal a
value. Such a property was attributed in part to the different crack initiation life that strongly
depended on the microscopic inhomogeneity (e.g. stress concentration at intermetallic particles of
different size, differently oriented slip planes, different grain size, etc.). The complexity could also
arise from the competition of multiply initiated cracks [48]: even though one crack was arrested (and
strain-aged), other larger cracks that incidentally attained much higher K eventually determined the
fatigue life. Note, however, that such an interpretation seem to be only viable for the present case
and not applicable to the nominally defect-free steel specimens that exhibit distinct knee
[8-10,43,49].
Apart from the effect of specimen geometry, the present new alloy may exhibit characteristic HCF
properties depending on loading frequency or temperature, both of which are important factors from
the viewpoint of strain-aging. These issues will be addressed elsewhere.
4. Conclusions
The main results obtained in this study are summarized as follows.
(1) A new 6XXX type age-hardened Al alloy was developed by adding small amount of Mg (0.5%,
0.8%) to the normal 6061-T6 alloy with a stoichiometric Mg2Si composition. By adding ca. 0.15%
Zr to the new alloy, significant grain coarsening during thermal process was effectively restricted.
(2) The tensile flow stress of the new alloy exhibited negative strain-rate sensitivity (nSRS) which
was absent in the normal base alloy.
(3) The tensile flow stress of the new alloy was relatively insensitive to temperature rise when

14
compared with the normal base alloy.
(4) The work-hardening rate of the new alloy is much higher than the base alloy particularly at the
initial flow regime and at low strain rate.
(5) The S-N diagram of the new alloy (0.5%Mg added) showed distinct fatigue limit (92.5 MPa)
which was determined as the threshold against propagation of small cracks. The base alloy, on the
other hand, showed no distinct knee-point.
(6) The new alloy exhibited a clear coaxing effect which was absent in the base alloy. The coaxing
effect was controlled by the existence of a small quasi-non-propagating crack whose growth
resistance gradually increased before shifting to the fatal FCG mode.
Acknowledgements
This study was financially supported in part by the Kansai University Grant-in-Aid for progress of
research in graduate course (2012) and also by the Kansai University Expenditures for Support of
Training Young Scholars (2013).
References
[1] F. King, Aluminium and its Alloys, Ellis Horwood, Chichester, 1987.
[2] Y. Takahashi, T. Shikama, S. Yoshihara, T. Aiura, H. Noguchi, Acta Mater. 60 (2010) 2554–2567.
[3] Fatigue Data Book: Light Structural Alloys, ASM International, Materials Park, 1995.
[4] S. Suresh, Fatigue of Materials. second ed., Cambridge University Press, Cambridge, 1998.
[5] D.G. Altenpohl, Aluminum: Technology, Applications, and Environment, A Profile of a Modern
Metal, sixth ed., TMS, Warrendale, 1998.
[6] T. Shikama, Y. Takahashi, L. Zeng, S. Yoshihara, T. Aiura, K. Higashida, H. Noguchi, Scr. Mater.
67 (2012) 49–52.
[7] L. Zeng, T. Shikama, Y. Takahashi, S. Yoshihara, T. Aiura, H. Noguchi, Int. J. Fatigue 44 (2012)

15
32–40.
[8] G.M. Sinclair, ASTM Proc. 52 (1952) 743–758.
[9] G. Oates, D.V. Wilson, Acta Metall. 12 (1964) 21–33.
[10] B. Mintz, D.V. Wilson, Acta Metall. 13 (1965) 947–956.
[11] H.A. Lipsitt, D.Y. Wang, Trans. AIME 221 (1961) 918–923.
[12] M. Hansen, K. Anderko, Constitution of Binary Alloys, second ed., McGraw-Hill, New York,
1958.
[13] H.W.L. Phillips, Annotated Equilibrium Diagrams of Some Aluminium Alloy Systems, Inst. of
Metals, London, 1959.
[14] R.C. Dorward, C. Bouvier, Mater. Sci. Eng. A254 (1998) 33–44.
[15] J. Langerweger, Proc. Int. Conf. on Aluminium Technology, 1986, pp. 216–222.
[16] I.J. Polmear, Light Alloys from Traditional Alloys to Nanocrystals, fourth ed.,
Butterworth-Heinemann, Oxford, 2006.
[17] J.X. Li, T. Zhai, M.D. Garratt, G.H. Bray, Metall. Trans. 36A (2005) 2529–2539.
[18] N. Blake, M.A. Hopkins, J. Mater. Sci. 20 (1985) 2061–2867.
[19] Z. Yin, Q. Pan, Y. Zhang, F. Jiang, Mater. Sci. Eng. A280 (2000) 151–155.
[20] J.G. Morris, Mater. Sci. Eng. 13 (1974) 101–108.
[21] D. J. Lloyd, Metall. Trans. 11A (1980) 1287–1294.
[22] S. Zhao, C. Meng, F. Mao, W. Hu, G. Gottstein, Acta Mater. 76 (2014) 54–67.
[23] K. Ogawa, JSME Int. J. Ser. A, 46 (2003) 322–327.
[24] M. Verdier, M. Janecek, Y. Bréchet, P. Guyot, Mater. Sci. Eng. A248 (1998) 187–197.
[25] D. J. Lloyd, Metall. Trans. 13A (1982) 1445–1452.
[26] G.R. Irwin, J. Appl. Mech. 29 (1962) 651–654.
[27] T. Tanaka, H. Nakayama, Bull. JSME, 18(1975) 1365-1374.
[28] S.Y. Zamrik, L.W. Hu, Exp. Mech. 5 (1967) 193–201.

16
[29] S. Kobayashi, T. Inomata, H. Kobayashi, S. Tsurekawa, T. Watanabe, J. Mater. Sci. 43 (2008)
3792–3799.
[30] F. Djavanroodi, M. Ebrahimi, B. Rajabifar, S. Akramizadeh, Mater. Sci. Eng. A528 (2010) 745–
750.
[31] K. Tanaka, Y. Akiniwa, Y. Nakai, R.P. Wei, Eng. Fract. Mech. 24 (1986) 803–819.
[32] Y.H. Zhang, L. Edwards, Scr. Mater. 26 (1992) 1901–1906.
[33] H. Toda, T. Kobayashi, Metall. Mater. Trans. 27A (1996) 2013–2021.
[34] S.M. Hirth, G.J. Marshall, S.A. Court, D.J. Lloyd, Mater. Sci. Eng. A319–321 (2001) 452–456.
[35] M. Murayama, K. Hono, Acta Mater. 47 (1999) 1537–1548.
[36] R. Král, P. Lukáč, Mater. Sci. Eng. A234-236 (1997) 786–789.
[37] E. Pink, A. Grinberg, Acta Metall. 30 (1982) 2153–2160.
[38] S. Zhao, C. Meng, F. Mao, W. Hu, G. Gottstein, Acta Mater. 76 (2014) 54–.
[39] R.B. Schwarz and L.L. Funk, Acta metall. 33 (1985) 295–307.
[40] A. Cuniberti, A. Tolley, M.V. Castro Riglos, R. Giovachini, Mater. Sci. Eng. A527 (2010) 5307–
5311.
[41] W.J. Poole, D.J. Lloyd, J.D. Embury, Mater. Sci. Eng. A234-236 (1997) 306–309.
[42] K. Tanaka, JSME Int. J. Ser. A 30 (1987) 1–13.
[43] H. Nisitani, S. Nishida, Bull. JSME 17 (1974) 1–11.
[44] N.E. Dowling, Fatigue Fract. Eng. Mater. Struct. 2 (1979) 129–138.
[45] H. Noguchi, H. Nisitani, H. Goto, JSME Int. J. Ser. 1 32 (1989) 14–22.
[46] H. Gleiter, E. Hornbogen, Mater. Sci. Eng. 2 (1968) 285–302.
[47] E. Hornbogen, K.H. Zum Gahr, Acta Metall. 24 (1976) 581–592.
[48] Y. Takahashi, H. Yoshitake, R. Nakamichi, T. Wada, M. Takuma, T. Shikama, H. Noguchi,
Mater. Sci. Eng. A614 (2014) 243–249.
[45] M.Goto, Fatigue Fract. Eng. Mater. Struct. 14 (1991) 833–845.

17
List of figure captions:
Figure 1 Schematic diagram of heat treatment process.
Figure 2 Cross-sectional view of die-extruded bars: (a) base alloy (as extruded); (b) new alloy after
resolutionization (0.5%Mg added, no Zr added); (c) new alloy after resolutionization (0.5%Mg and
Zr added). Note that coarse grained outer region is revealed by etching (etchant: 5% sodium
hydroxide solution).
Figure 3 Microstructure of base alloy and new alloy (0.5%Mg added): (a) inverse pole figure color
maps on cross-sectional planes normal to extrusion direction; (b) {100} pole figure corresponding to
the area shown in (a); (c) bright-field TEM images showing G.P. zone (after peak-age treatment).
Upper and lower figures for base alloy and new alloy, respectively.
Figure 4 Shape and dimension of specimens (unit in mm): (a) for tensile tests; (b) for fatigue tests.
Figure 5 Effect of strain rate on stress-strain behavior of three alloys (base, 0.5%Mg added,
0.8%Mg added).
Figure 6 Effect of temperature on stress-strain behavior of three alloys (base, 0.5%Mg added,
0.8%Mg added).
Figure 7 Work hardening rate vs. flow stress: effect of strain rate.
Figure 8 Comparison of S-N diagrams of base alloy and new alloy (0.5%Mg added). Run-out plots

18
are indicated with arrows.
Figure 9 Relation between fatigue cycles and apparent crack length in finite life regime: (a) a =
160, 120 MPa; (b) a = 100 MPa. Crack shape at different steps is schematically shown in (c).
Figure 10 Crack growth rate as a function of stress intensity factor range. Both plots are fitted to
the Paris’ law (dl/dN = C(K)m). Note that the plots employed here are for cracks longer than 500
m where semi-circular shape approximation is valid. K value at point A is employed.
Figure 11 Small crack growth behavior in new alloy (0.5%Mg added) fatigued at a = 90 MPa to N
= 1.0 × 10⁸ cycles: (a) growth curves of C1 and C2; (b) 60 °tilted SEM images of C1 and C2. Note
that inner crack length (l1’ and l2
’) are corrected to show the actual length measured perpendicular to
the wall of the hole.
Figure 12 Results of a step-up tests for base alloy: (a) fatigue history plotted on S-N diagram; (b)
growth behavior of life-controlling main cracks (M1, M2) in specimen B3; (c) micrographs of main
cracks in specimen B3.
Figure 13 Results of a step-up tests for new alloy (0.5%Mg added): (a) fatigue history plotted on
S-N diagram; (b) growth behavior of life-controlling main cracks (M1, M2) in specimen N1; (c)
micrographs of main cracks in specimen N1.

400
Fig. 1. Schematic diagram of heat treatment process.
500
600
700
800
900
Base alloy
New alloy
Homogenization
Extrusion
Re-solutionization
Aging
Time (arb.)
100
200
300
400
500
600
RT
Tem
pera
ture
(K
)
Tem
pera
ture
(°
C)
300
fig 1

Fig. 2. Cross-sectional view of die-extruded bars: (a) base alloy (as extruded); (b)
new alloy after resolutionization (0.5%Mg added, no Zr added); (c) new alloy
after resolutionization (0.5%Mg and Zr added). Note that coarse grained outer
region is revealed by etching (etchant: 5% sodium hydroxide solution).
(a)
(b)
(c)
fig 2

Fig. 3. Microstructure of base alloy and new alloy (0.5%Mg added): (a)
inverse pole figure color maps on cross-sectional planes normal to extrusion
direction; (b) {100} pole figure corresponding to the area shown in (a); (c)
bright-field TEM images showing G.P. zone (after peak-age treatment).
Upper and lower figures for base alloy and new alloy, respectively.
(a) (b) (c)
Base alloy Base alloy Base alloy
New alloy New alloy New alloy
20 nm
20 nm
fig 3

A f0.3
0.3
Fig. 4. Shape and dimension of specimens (unit in mm): (a) for
tensile tests; (b) for fatigue tests.
30 7.5 55
f8
f12
(a)
(b)
7.5 55
f1
0
45 20 25 5 5
f5
R50
A
fig 4

Fig. 5. Effect of strain rate on stress-strain behavior of three alloys
(base, 0.5%Mg added, 0.8%Mg added).
Fig 5

Fig. 6. Effect of temperature on stress-strain behavior of three alloys
(base, 0.5%Mg added, 0.8%Mg added).
Fig 6
300 325 350 3750
500
1000
1500
2000
2500
Fig. 7. Work hardening rate vs. flow stress: effect of strain rate.
Work
har
den
ing r
ate
ds
/de
[MP
a/st
rain
]
R.T. (298 K)
5.6 × 10⁻⁵ s-1
5.6 × 10⁻⁴ s-1
5.6 × 10⁻³ s-1
Flow stress s [MPa]
5.6 × 10⁻⁵ s-1
5.6 × 10⁻⁴ s-1
5.6 × 10⁻³ s-1
5.6 × 10⁻⁵ s-1
5.6 × 10⁻⁴ s-1
5.6 × 10⁻³ s-1
0.5%Mg added 0.8%Mg added Base
fig 7

50
100
150
200
1.E+04 1.E+05 1.E+06 1.E+07 1.E+08 1.E+09
Fig. 8. Comparison of S-N diagrams of base alloy and new alloy
(0.5%Mg added). Run-out plots are indicated with arrows.
104 105 106 107 108 109 50
100
150
200
Base alloy
New alloy
(0.5%Mg added)
Holed specimen
Air/R.T./50 Hz
Rotating bending (R = -1)
Number of cycles to failure Nf [cycles]
Str
ess
amp
litu
de s
a [M
Pa]
fig 8

Fig. 9. Relation between fatigue cycles and apparent crack length in
finite life regime: (a) sa = 160, 120 MPa; (b) sa = 100 MPa. Crack
shape at different steps is schematically shown in (c).
l ≈ 500 mm l > 500 mm
300 mm
a
300 m
m
c
a
c
Step (i) Step (ii) Step (iii)
l < 500 mm
(c)
Fig 9

1 1010-10
10-9
10-8
10-7
10-6
Stress intensity factor range DK [MPa m1/2]
Cra
ck g
row
th r
ate
dl/
dN
[m
/cy
cle]
C m
8.38×10⁻¹¹ 3.54
1.06×10⁻¹¹ 2.93
Base alloy
New alloy
(0.5%Mg added)
Fig. 10. Crack growth rate as a function of stress intensity factor
range. Both plots are fitted to the Paris’ law (dl/dN = C(DK)m). Note
that the plots employed here are for cracks longer than 500 mm
where semi-circular shape approximation is valid. DK value at point
A is employed.
Air/R.T.
l (>
50
0 m
m)
Loading
direction
A
Fig 10

0 0.5 1
(108)
20
40
60
80
100
Number of cycles N [cycles]
Cra
ck l
eng
th f
rom
ho
le
bri
m l
i [m
m]
l1
l2 C2
C1
C2
C1
Loading
direction
sa = 90 MPa
N = 1.0×10⁸
C2
C1
Fig. 11. Small crack growth behavior in new alloy (0.5%Mg added)
fatigued at sa = 90 MPa to N = 1.0×10⁸ cycles: (a) growth curves of C1
and C2; (b) 60 °tilted SEM images of C1 and C2. Note that inner crack
length (l1’ and l2
’) are corrected to show the actual length measured
perpendicular to the wall of the hole.
C2
C1
(a)
(b)
l1’= 196 mm
l2’= 150 mm
100 mm 50 mm
50 mm
fig 11

50
100
150
200
1.E+04 1.E+05 1.E+06 1.E+07 1.E+08 1.E+09
0 0.5 1
50
100
2
(108)
104 105 106 107 108 109 50
100
150
200
Number of cycles to failure Nf [cycles]
Str
ess
amp
litu
de s
a [M
Pa]
Specimen B2 (final step; )
Specimen B1 (final step; )
Specimen B3 (final step; )
Base alloy
100 mm
N = 0 N = 1.5×10⁸
20 mm
20 mm
Loading direction
N = 1.9×10⁸
Fig. 12. Results of sa step-up tests for base alloy: (a) fatigue history plotted
on S-N diagram; (b) growth behavior of life-controlling main cracks (M1,
M2) in specimen B3; (c) micrographs of main cracks in specimen B3.
Number of cycles N [cycles]
Mai
n c
rack
len
gth
fro
m
ho
le b
rim
li [m
m] l1
l2 M2
M1
Pre-fatigue
(sa = 75 MPa)
sa step-up test
(Dsa = 2.5 MPa
at solid marks)
M2
M1
Failure
(ii)
(i)
(iii)
(a)
(b)
(c)
Specimen B3
(i) (ii) (iii) M1 M1
M2
1.5
Fig 12

50
100
150
200
1.E+04 1.E+05 1.E+06 1.E+07 1.E+08 1.E+09
0 0.5
50
100
150
200
250
1.5 2
(108)
Fig. 13. Results of sa step-up tests for new alloy (0.5%Mg added): (a)
fatigue history plotted on S-N diagram; (b) growth behavior of life-
controlling main cracks (M1, M2) in specimen N1; (c) micrographs of main
cracks in specimen N1.
104 105 106 107 108 109 50
100
150
200
New alloy
(0.5%Mg added)
Number of cycles to failure Nf [cycles]
Str
ess
amp
litu
de s
a [M
Pa]
Specimen N1 (final step; )
Specimen N2 (final step; )
Specimen N3 (final step; )
100 mm
20 mm
Number of cycles N [cycles]
Mai
n c
rack
len
gth
fro
m
ho
le b
rim
li [m
m] l1
l2 M2
M1 Pre-fatigue
(sa = 85 MPa)
sa step-up test
(Dsa = 2.5 MPa
at solid marks)
M2
M1
Failure
N = 0 N=1.0×10⁸ N=1.9×10⁸
(ii) (i)
(iii)
(i) (ii) (iii)
100 mm
(a)
(b)
(c)
M1
M2
M1
M2 Loading direction
Specimen N1
1.0
Fig 13

List of Tables:
Table 1 Chemical composition of Al alloys (wt%) measured by ICP method
Si Fe Cu Mn Mg Cr Ti Zr Al
Base alloy 0.52 0.20 0.20 0.09 0.95 0.23 0.02 – bal.
0.5%Mg*
added alloy 0.54 0.19 0.20 0.09 1.43 0.25 0.02 0.16 bal.
0.8%Mg*
added alloy 0.55 0.23 0.22 0.09 1.92 0.25 0.02 0.14 bal.
* Nominal quantity
Table 2 Grain size, hardness, proof stress of Al alloys (after peak-aging treatment)
Base 0.5%Mg added 0.8%Mg added
Grain size [m] * 16.6 35.0 29.3
Vickers hardness [HV]**
90.2 96.2 95.2
0.2% proof strength [MPa]***
311 310 305
* Measured by intercept method; ** load value: 4 kgf (four point average), room temperature; *** strain rate:
5.6 × 10⁻⁴
s-1
, room temperature.
Table 3 Summary of a step-up tests
Alloy Specimen
No.
Initial a
(MPa)
Initial cycles
(cycles)
a increment
(MPa)
Cycles in one step
(cycles)
Finala at failure
(MPa)
Nf at failure a
(cycles)
Base
B1 70 1.0×10⁷
2.5 1.0×10⁷
85 8.51×10⁶
B2 70 1.0×10⁸ 87.5 1.37×10⁶
B3 75 1.5×10⁸ 87.5 8.50×10⁶
0.5%Mg
added
N1 85
1.0×10⁸ 2.5
1.0×10⁷ 112.5 4.08×10⁶
N2 90 1.0×10⁷ 110 5.13×10⁶
N3 90 1.0×10⁶ 112.5 9.07×10⁵
Table 4 Temperature/strain rate ranges for emergence of P–L effect in dilute alloys (Mg < 1%)
Mg content (wt%) Temperature (K) Strain rate (s-1
) Literature
0.5 R.T. 10-3
/10-4
/ 5 × 10⁻⁵
Zhao et al. [38], Al-0.5%Mg
1.03 289 ~ 373 < 10-2
Ogawa [23], 6061-O* (Si: 0.49%)
1.0 273 ~ 373 6.56 × 10⁻⁵
Schwarz et al. [39], 6061-aq**
(Si: 0.6%)
0.64 R.T. 4.39 × 10⁻⁴
Cuniberti et al. [40], 6082-aq (Si: 0.5%)
0.5 ~ 1.0 R.T. 2 × 10⁻³
Poole et al. [41], 6111-aq (Si: 0.6 ~ 1.1%)
*: annealed, **: as-quenched
Table(s)