efectos de los cambios en el patrÓn de …
TRANSCRIPT

UNIVERSIDAD PABLO DE OLAVIDE
DEPARTAMENTO DE SISTEMAS FÍSICOS, QUÍMICOS Y NATURALES
ÁREA DE ECOLOGIA
EFECTOS DE LOS CAMBIOS EN EL PATRÓN DE PRECIPITACIONES
SOBRE LOS MICROORGANISMOS Y LOS PROCESOS DEL SUELO
TESIS DOCTORAL
Lourdes Morillas Viñuales
Sevilla, 2014


EFECTOS DE LOS CAMBIOS EN EL PATRÓN DE
PRECIPITACIONES SOBRE LOS MICROORGANISMOS Y LOS
PROCESOS DEL SUELO
Memoria que la Licenciada Lourdes Morillas Viñuales presenta
para aspirar al grado de doctora por la Universidad Plablo de
Olavide de Sevilla
Esta memoria ha sido realizada bajo la dirección de:
Dr. Antonio Gallardo Correa
Lda. Lourdes Morillas Viñuales
Aspirante al grado de Doctora
Sevilla, Mayo de 2014


Dr. Antonio Gallardo Correa, catedrático de ecología de la
Universidad Pablo de Olavide
CERTIFICA
Que los trabajos de investigación desarrollados en la
Memoria de Tesis Doctoral: “Efectos de los cambios en el patrón de
precipitaciones sobre los microorganismos y los procesos del suelo”,
son aptos para ser presentados por la Lda. Lourdes Morillas
Viñuales ante el Tribunal que en su día se designe, para aspirar al
Grado de Doctora por la Universidad Pablo de Olavide.
Y para que así conste, y en cumplimiento de las disposiciones
legales vigentes, extiendo el presente certificado a 21 de abril de
2014
Dr. Antonio Gallardo Correa


Durante el tiempo de realización de esta Tesis Doctoral he
disfrutado de una Beca de Postgrado para la Formación de
Profesorado Universitario (AP2008-02985) del Ministerio de
Educación.
Este trabajo estuvo financiado por el proyecto CGL2010-21381
del Ministerio de Ciencia e Innovación.
Los trabajos de investigación presentados en esta Tesis
Doctoral se ha realizado en el Departamento de Sistemas Físicos,
Químicos y Naturales de la Universidad Pablo de Olavide de
Sevilla.


A mis padres,
Gracias por ayudarme a llegar tan lejos.


If you want to build a ship, don't
drum up the people to gather wood,
divide the work, and give orders.
Instead, teach them to yearn for the
vast and endless sea”
Antoine de Saint Exupéry


AGRADECIMIENTOS
Tanta gente ha contribuido de una u otra forma a la realización de esta tesis, que
muy probablemente me deje a alguien atrás. De cualquier manera, a la primera persona
a la que debo agradecer es a mi director, Antonio Gallardo, que despertó en mí el interés
por la ciencia cuando sólo era una estudiante de ambientales y que lleva guiándome en
la investigación nada menos que ocho años. Gracias por su interés y paciencia, por su
tiempo y dedicación.
Thanks to all the outstanding researchers that have hosted me during my short
research stays abroad. Thanks to Amy Austin, Peter Groffman, Gary Lovett, Ülo
Niinemets and Steffen Noe. I have really learnt a lot during these experiences, not only
professionally, but also personally. It is surprising that distinguished researches were so
willing to help me and teach me. Pero si alguien merece un agradecimiento por su
desinteresada contribución a mis habilidades como investigadora, esos son Xandra y
Jorge, que me han supervisado durante parte de esta tesis y han mejorado
“significativamente” mi entendimiento sobre la ecología del suelo.
Muchos han sido los compañeros de trabajo que me han acompañado durante
estos años. No olvidaré los desayunos en el despacho ni las fiestas injustificadas con
Cristina, Ana de Gerena, Ana de Vigo, Rocío, Felisa, Dani, Rafa, Jesús y Jose Manuel.
Recuerdo muy especialmente los días que he pasado con Miguel y con Manu en el
laboratorio, trabajábamos mucho, pero lo pasábamos mejor. También tengo que
agradecer la oportunidad de colaborar con Ana Mellado en un proyecto común que nos
entusiasmó a las dos desde el principio. No puedo dejarme atrás a otros amigos que,
aunque fuera del ámbito laboral, me han apoyado durante estos años. Muchas gracias a
Curro, Sofía, Bea, Mica… nunca he dejado de sentiros a mi lado.
Tengo la certeza de que nunca hubiera llegado a este punto sin el apoyo
incondicional y el cariño de mi familia. Mil gracias a mi padre, por apretarme las tuercas,
por confiar en mis posibilidades más de lo que yo lo hacía. A mi madre, por vivir con
tanta ilusión y entusiasmo todo este proceso, por todas las virtudes y defectos que he
heredado y aprendido de ti. A mis hermanos, por su cariño y apoyo que siempre he
necesitado. A mi tía Orosia, por su interés, por disfrutar de cada uno de mis pasos.

Muy especialmente tengo que dar las gracias a mi Javi. No sé cómo podría
agradecerte que me hayas seguido por medio mundo durante mis estancias, sin
condiciones ni restricciones. No sólo me has sacado las castañas del fuego en infinitas
ocasiones, sino que además, tu apoyo incondicional me ha puesto las cosas realmente
fáciles durante estos años. ¡Gracias por no soltarme nunca de la mano en este camino!
¡¡¡Mil gracias a todos!!!

ÍNDICE
1. Resumen ...................................................................................................................... 1
2. Introducción general ................................................................................................. 3
2.1. Cambio climático y consecuencias sobre la humedad del suelo ................. 3
2.2. Efectos de los pulsos de agua sobre los ciclos biogeoquímicos ................... 4
2.3. Moduladores de las respuestas del suelo a los pulsos de agua ................... 8
2.4. Áreas de estudio ............................................................................................... 10
2.5. Objetivos de la tesis y estructura en capítulos ............................................. 13
3. Capítulo 1: Wetting and drying events determine soil N pools in two
Mediterranean ecosystems ............................................................................................ 15
4. Capítulo 2: Unpredictable soil respiration responses to wetting and drying
cycles in Mediterranean ecosystems ............................................................................ 37
5. Capítulo 3: Temporal pattern of microbial functional diversity in two
Mediterranean ecosystems ............................................................................................ 53
6. Capítulo 4: Biological soil crusts and wetting events: Effects on soil N and C
cycles ................................................................................................................................. 75
7. Capítulo 5: Increased N supply modulates the effect of drying-rewetting
frequency on soil C and N cyclingand soil-atmosphere trace gases exchange ...... 99
8. Discusión general ...................................................................................................... 123
9. Conclusiones generales ............................................................................................ 129
10. Referencias ............................................................................................................... 131


1
1. RESUMEN
El objetivo de esta tesis doctoral es evaluar los efectos de los cambios en el patrón
de precipitación sobre los microbios y sobre una amplia variedad de procesos del suelo
en distintos ecosistemas. Para ello, hemos estudiado cuatro zonas diferentes: dos
ecosistemas mediterráneos (un pinar y un matorral), en los que se ha llevado a cabo un
estudio de campo observacional no manipulativo y un ecosistema semiárido y otro
templado en los que se han realizado experimentos manipulativos. En el capítulo 1
evaluamos los efectos de los ciclos naturales de humedecido y secado del suelo sobre el
pool de nitrógeno (N) en los dos ecosistemas mediterráneos anteriormente mencionados
muestreando semanalmente durante un año. Nuestros resultados mostraron que el pool
de N tiene una alta variabilidad temporal que es independiente del contenido en materia
orgánica y del carbono (C) y N lábil del suelo. De este modo, es esperable que los
cambios en los pulsos de agua producidos por el cambio climático tengan un impacto
significativo sobre la disponibilidad y reciclaje de las formas orgánicas e inorgánicas de
N.
En el capítulo 2 estudiamos las tasas de respiración de estos dos mismos
ecosistemas utilizando el mismo diseño muestral que en el capítulo 1. Nuestros
resultados evidenciaron que mientras que la tasa de respiración en el pinar aumentaba
durante los ciclos de humedecido y disminuía durante los de secado, la tasa de
respiración en el matorral no respondía a la humedad del suelo. Nuestros resultados
apuntaron a que las bajas concentraciones de fósforo en el matorral estaban limitando la
respuesta de la respiración del suelo a los pulsos de agua. En el capítulo 3 evaluamos la
respuesta estacional de los microbios del suelo al consumo de diferentes fuentes de C en
relación a las concentraciones de C lábil del suelo y calculamos la diversidad microbiana
en los dos ecosistemas mediterráneos de estudio. Nuestros resultados evidenciaron que
las concentraciones de C lábil del suelo no son un predictor fiable de la respuesta
microbiana a distintas fuentes de C. También encontramos un patrón estacional diferente
de la respuesta microbiana a las distintas fuentes de C en los dos ecosistemas,
probablemente debido a la distinta fertilidad de sus suelos.
En el capítulo 4 analizamos cómo la longitud y la intensidad de los ciclos de
humedecido y la presencia de la costra biológica del suelo (CBS) determinan las
variables relacionadas con el ciclo del C y N en un ecosistema semiárido. Nuestros
resultados indicaron que los eventos de humedecido más largos e intensos pueden estar

2
relacionados con un aumento en las tasas de descomposición que compensaría las
pérdidas de nutrientes asociadas con los eventos de humedecido cortos. Esta tendencia
es mucho más evidente en CBS que en suelo desnudo. De esta forma, los cambios en la
longitud e intensidad de los eventos de humedecido y la presencia de la CBS podrían
alterar la estructura y la función de la comunidad del suelo. Por último, en el capítulo 5
evaluamos cómo el efecto combinado de la adición de N en el suelo y más frecuentes
ciclos de humedecido y secado afectan al flujo de los gases de efecto invernadero (GEIs),
la diversidad funcional microbiana y los ciclos del N y C. Nuestros resultados no sólo
indicaron que la intensificación de la frecuencia de los ciclos de humedecido y secado
afecta a los flujos de los GEIs y a la capacidad del suelo de ciclar N y C, si no también
demostraron que la adición de N cambia las respuestas de estas variables a los pulsos de
humedad del suelo. La población microbiana vio aumentada su diversidad en respuesta
a la adición de N, pero no se vio afectada por la frecuencia de los ciclos de humedecido y
secado del suelo. Estos resultados confirman que cambios tanto en la frecuencia de los
ciclos de humedecido y secado como en la adición de N en el suelo pueden inducir
alteraciones significativas en la población microbiana y los procesos del suelo.
Los resultados obtenidos en esta tesis doctoral no sólo han mejorado nuestro
conocimiento sobre la importancia del efecto que los pulsos de agua tienen sobre los
microorganismos y los procesos del suelo, sino que además han explorado las
consecuencias de futuros cambios en los pulsos de agua provocados por el cambio
climático, tales como cambios en la longitud de los eventos de humedecido o en la
frecuencia de los ciclos de humedecido y secado del suelo. También se ha explorado el
papel de moduladores de la respuesta a los pulsos de agua como la CBS o la adición de
N. Estos resultados pueden ser de ayuda para realizar previsiones más aproximadas de
las consecuencias del cambio global sobre los ciclos biogeoquímicos y los
microorganismos del suelo.

3
2. INTRODUCCIÓN GENERAL
2.1. Cambio climático y consecuencias sobre la humedad del suelo
Durante las últimas décadas se han invertido grandes esfuerzos en determinar
cuáles serán las consecuencias del cambio global, que se ha visto intensificado desde
1950. Uno de los aspectos más importantes de este fenómeno desde el punto de vista de
los ciclos biogeoquímicos es el cambio climático (Gallardo et al., 2009). Según las
previsiones, el cambio climático producirá un aumento de las temperaturas, un cambio
en el tamaño y la frecuencia de las precipitaciones y un incremento de los periodos de
sequía (Huntington, 2006; IPCC, 2013). Muchos han sido los estudios que han
relacionado estos cambios ambientales con modificaciones en los procesos del suelo en
ecosistemas naturales (Skopp et al., 1990; Voroney, 2007; Evans & Wallenstein, 2011).
Actualmente, está ampliamente aceptado que la naturaleza episódica de la
disponibilidad de agua determina de forma directa e indirecta un gran número de
procesos biogeoquímicos a través de los ciclos de secado y rehumedecido del suelo en
ecosistemas limitados por la disponibilidad de agua (Cui & Caldwell, 1997; Collins et al.,
2008). Por ejemplo, las precipitaciones puntuales afectan de forma directa a la frecuencia
y a la duración de los ciclos de secado y rehumedecido del suelo, pero estos ciclos
pueden controlar indirectamente la actividad de los microorganismos del suelo, lo cual
determina en última instancia el reciclaje de C y N. Incluso se ha afirmado que los
cambios en la naturaleza de estas precipitaciones pueden llegar a ser más importantes
que los cambios en la temperatura o en la cantidad total de precipitación (Austin et al.,
2004).
Aunque han pasado 40 años desde que Noy-Meir (1973, 1974) describió cómo las
precipitaciones puntuales afectan a la mayoría de los procesos del suelo en ecosistemas
áridos, aún quedan muchas cuestiones por resolver relacionadas con cómo los ciclos de
secado y rehumedecido del suelo controlan los ciclos biogeoquímicos en ecosistemas
limitados por la disponibilidad de agua. La naturaleza efímera del efecto de los pulsos
de agua en el flujo de nutrientes, como por ejemplo pérdidas gaseosas tras una
precipitación (Schlesinger & Peterjohn, 1991), o la respuesta instantánea de los
microorganismos del suelo a los cambios de humedad del suelo (Freckman et al., 1987;

4
Schwinning & Sala, 2004) contribuye a la dificultad de obtener resultados fiables de los
efectos de los pulsos de agua sobre el funcionamiento de los ecosistemas.
Figura 1. El aumento en la temperatura del aire proyectado, conducirá a una mayor capacidad de la atmósfera para retener agua, acelerando el ciclo hidrológico y alterando las características de las precipitaciones (cantidad, frecuencia, intensidad, duración…). La frecuencia y la intensidad de las precipitaciones torrenciales es probable que aumenten en norte América y Europa. Imagen modificada de IPCC, Climate Change (2013).
2.2. Efectos de los pulsos de agua sobre los ciclos biogeoquímicos
Los efectos del de secado y rehumedecido del suelo en los procesos
biogeoquímicos han sido estudiados tanto en sistemas agrícolas como naturales. Estos
ciclos de secado y rehumedecido del suelo afectan a todos los aspectos del reciclaje de
nutrientes, incluyendo la mineralización de C y N (Birch, 1964; Agarwal et al., 1979;
Seneviratne & Wild, 1985; Degens & Sparling, 1995), la biomasa microbiana (Bottner,
1985; Kieft et al., 1987; Van Gestel et al., 1993) y flujo de gases de efecto invernadero
(Groffman & Tiedje, 1988; Mummey et al., 1994; Ruser et al., 2006; Norton et al., 2008).
- Ciclo de nutrientes
Tanto la fase de humedecido como la de secado afectan a los procesos del suelo,
pero es la dinámica cíclica la que determina la diferente respuesta del suelo comparada
con condiciones de humedad constante (Austin et al., 2004). Por ejemplo, la acumulación
de N inorgánico suele ocurrir durante los periodos secos debido a que la difusión de los
iones se encuentra muy restringida en finas películas de agua del suelo seco y a que los

sumideros de N inorgánico están limitado
disminuida toma de nutrientes por parte de las plantas en condiciones de sequía
(Barber, 1995; Stark & Firestone
generalmente estimulan la mineralización d
primeras horas tras el rehumedecido para el caso del C, Mikha et al., 2005
menos estudios se han centrado en el efecto de estos pulsos de hume
del P. La mayoría de éstos encontraron un aumento
repetidos ciclos de secado y rehumedecido
Haygarth, 2001).
Figura 2. Esquema de los ciclos biogeoquímicos del C y del N en ecosistemas limitados por agua bajo condiciones de secado (A) y de rehumedecido (B) del suelo. El grosor de las flechas indica la importancia relativa de estos procesos en las dos situaciones. Las líneas punteadas indican un flujo muy bajo o indetectable. Durantedisminuye, aumenta la muerte microbiana y la toma de nutrientes por parte de las plantas está restringida, produciendo un aumento en el nitrato y la materia orgánica lábil del suelo. Cuando el suelo se rehumedece, se estimula la mineralizacirelación de la biomasa microbiana del suelo y la materia orgánica lábil, aumentando las pérdidas potenciales de N debido al aumento de la nitrificación, desnitrificación y lavado. modificada de Austin et al., 2004.
5
sumideros de N inorgánico están limitados por el reducido crecimiento microbiano y la
disminuida toma de nutrientes por parte de las plantas en condiciones de sequía
Firestone, 1995). Los ciclos de secado y rehumedecido
generalmente estimulan la mineralización de C y N (frecuentemente
primeras horas tras el rehumedecido para el caso del C, Mikha et al., 2005
menos estudios se han centrado en el efecto de estos pulsos de hume
P. La mayoría de éstos encontraron un aumento de P inorgánico en respuesta a
secado y rehumedecido del suelo (Grierson et al.
Esquema de los ciclos biogeoquímicos del C y del N en ecosistemas limitados por agua o (A) y de rehumedecido (B) del suelo. El grosor de las flechas indica la
importancia relativa de estos procesos en las dos situaciones. Las líneas punteadas indican un flujo muy bajo o indetectable. Durante el periodo en el que el suelo está seco, el recidisminuye, aumenta la muerte microbiana y la toma de nutrientes por parte de las plantas está restringida, produciendo un aumento en el nitrato y la materia orgánica lábil del suelo. Cuando el suelo se rehumedece, se estimula la mineralización de C y N y se producen grandes cambios en la relación de la biomasa microbiana del suelo y la materia orgánica lábil, aumentando las pérdidas potenciales de N debido al aumento de la nitrificación, desnitrificación y lavado.
et al., 2004.
s por el reducido crecimiento microbiano y la
disminuida toma de nutrientes por parte de las plantas en condiciones de sequía
secado y rehumedecido del suelo
e C y N (frecuentemente durante las
primeras horas tras el rehumedecido para el caso del C, Mikha et al., 2005). Muchos
menos estudios se han centrado en el efecto de estos pulsos de humedad sobre el ciclo
de P inorgánico en respuesta a
del suelo (Grierson et al., 1998; Turner &
Esquema de los ciclos biogeoquímicos del C y del N en ecosistemas limitados por agua o (A) y de rehumedecido (B) del suelo. El grosor de las flechas indica la
importancia relativa de estos procesos en las dos situaciones. Las líneas punteadas indican un el periodo en el que el suelo está seco, el reciclaje de C y N
disminuye, aumenta la muerte microbiana y la toma de nutrientes por parte de las plantas está restringida, produciendo un aumento en el nitrato y la materia orgánica lábil del suelo. Cuando el
ón de C y N y se producen grandes cambios en la relación de la biomasa microbiana del suelo y la materia orgánica lábil, aumentando las pérdidas potenciales de N debido al aumento de la nitrificación, desnitrificación y lavado. Imagen

6
- Microorganismos
El secado y rehumedecido de los suelos supone un gran estrés fisiológico para las
comunidades microbianas que habitan en la superficie de los suelos. El rehumedecido de
un suelo seco puede inducir la muerte de una proporción significativa de la biomasa
microbiana debido al cambio repentino en potencial hídrico del suelo que puede llegar a
causar un choque osmótico induciendo a la lisis de las células microbianas (Bottner,
1985; Van Gestel et al., 1992). Este fenómeno puede directa o indirectamente afectar a la
composición de la comunidad microbiana del suelo (Fierer et al., 2003).
Alternativamente, los microbios podrían ajustar su potencial hídrico liberando solutos
intracelulares (Halverson et al., 2000). Estos sustratos lábiles de C y N pueden ser
rápidamente mineralizados por los microbios que hayan sobrevivido al choque
osmótico, produciendo un pulso de mineralización de C y de N (Birch, 1959; Kieft et al.,
1987). Por otro lado, los ciclos de secado y rehumedecido puede causar la rotura de
agregados del suelo, poniendo al alcance de los descomponedores materia orgánica
previamente protegida (Adu and Oades, 1978; Appel, 1998; Lundquist et al., 1999a).
Fierer y Schimel (2002) encontraron que los suelos sometidos a frecuentes ciclos de
secado y rehumedecido emitieron una menor cantidad de CO2 y también aumentaron la
actividad de las poblaciones de nitrificantes autótrofas. Seis semanas después del último
ciclo de secado y rehumedecido, las tasas de respiración en los suelos fueron
significativamente más bajas que las observadas en los suelos no estresados, sugiriendo
que los ciclos de secado y rehumedecidos pueden producir cambios significativos en la
dinámica microbiana del C y el N, y que estos efectos pueden durar más de un mes
después del último ciclo de secado.
Los microorganismos del suelo juegan un papel clave en la retención y liberación
de nutrientes en ecosistemas naturales, siendo al mismo tiempo una fuente y sumidero
de éstos. La cantidad de biomasa microbiana varía a lo largo del año, siendo esta
dinámica temporal muy importante en el grado de liberación o inmovilización de
nutrientes en el medio (Bauthus & Barthel, 1995; Diaz-Ravina et al, 1995). El crecimiento
de la biomasa microbiana se ve influenciado por factores tales como la humedad del
suelo, la temperatura, la aireación, la cantidad y naturaleza del C orgánico en el medio o
el pH del suelo, existiendo distintos óptimos en función del tipo de microorganismos
(Vitousek, 1982; Cochran et al., 1989; Tietema & Wessel, 1992; Wardle, 1998).

7
- Flujo de gases de efecto invernadero
Los principales gases implicados en el efecto invernadero son el dióxido de C
(CO2), el óxido nitroso (N2O) y el metano (CH4). Éstos dos últimos tienen potencial de
calentamiento global 298 y 25 veces mayores que el del CO2, respectivamente (Kaye et
al., 2005; IPCC, 2013). Ha sido ampliamente probado que los ciclos de secado y
rehumedecido del suelo tienen consecuencias evidentes para la mineralización de C
(Fierer & Schimel, 2002; Mikha et al., 2005; Xiang et al., 2008). Al frecuentemente
observado incremento en la respiración del suelo en respuesta a un pulso de humedad,
se le conoce como el “Efecto Birch” (Birch, 1958). Muchos estudios se han concentrado en
evaluar el efecto de los ciclos de secado y rehumedecido sobre la respiración del suelo
(Franzluebbers et al., 2000; Mamilov & Dilly, 2002; McCulley et al., 2007), sin embargo
aún permanecen sin resolver muchas cuestiones referentes a la dependencia de otras
variables, el origen y la magnitud de la este pico de respiración (Xiang et al., 2008).
Recientes estudios de laboratorio (Miller et al., 2005), modelos matemáticos (Yuste et al.,
2005), y studios conceptuales (Schimel et al., 2007) sugieren que los ciclos de secado y
rehumedecido del suelo pueden acelerar la pérdida de C en comparación con un suelo
en condiciones de humedad constante, aunque hay excepciones (Mikha et al., 2005).
El N2O que se emite en los suelos es un intermediario de la nitrificación y de la
desnitrificación (Sahrawat & Keeney, 1986; Granli & Bøckman, 1994; Bremner, 1997).
Tanto estudios de laboratorio como de campo han encontrado un aumento de las tasas
de emisión de N2O como consecuencia del aumento del contenido hídrico del suelo
(Cates & Keeney, 1987; Rudaz et al., 1991), éstos resultados son atribuidos a un aumento
en la desnitrificación inducida por una disminución de la difusión del O2 en el suelo
(Mosier et al., 1986; Corre et al., 1996; Ruser et al., 2001). Sin embargo, se ha encontrado
una alta variabilidad en la magnitud de este pico de emisión y la contribución de la
nitrificación y desnitrificación (Firestone & Tiedje, 1979). Por otro lado, el flujo de CH4
depende de las condiciones físicas que determinan las tasas de difusión del suelo. Por
este motivo, la absorción este gas por parte del suelo se ve frecuentemente aumentada
durante los periodos secos de los suelos debido al aumento de la difusión (Ridgwell et
al., 1999). Sin embargo, existe un gran desconocimiento sobre el efecto que tiene la
dinámica cíclica de la humedad sobre el flujo de este gas.

8
2.3. Moduladores de las respuestas del suelo a los pulsos de agua
Hay algunos factores que pueden tener un efecto modulador de los procesos del
suelo a los pulsos de agua. Nosotros hemos querido evaluar la influencia que la costra
biológica del suelo y la deposición atmosférica de N tienen sobre las respuestas de las
variables que estudiamos a los pulsos de agua. Hemos elegido testar el efecto de estos
moduladores debido a su creciente interés sobre los ciclos biogeoquímicos a nivel
mundial (Sala et al., 2000; Maestre et al., 2011).
- Costra biológica del suelo
La costra biológica del suelo, que está compuesta por algas eucariotas,
cianobacterias, hongos, musgos y líquenes, cubre los primeros milímetros de la
superficie en la mayoría de ecosistemas áridos y semiáridos a través de todo el mundo, y
son uno de los componentes bióticos más importantes de estas áreas (Belnap & Lange,
2003). Todos estos componentes, constituyen una comunidad biótica especializada que
ejerce una fuerte influencia sobre los procesos claves de los ecosistemas, tales como la
escorrentía e infiltración de las precipitaciones (Alexander & Calvo, 1990; Belnap, 2006),
la respiración del suelo (Maestre & Cortina, 2003), la fijación y transformación de N
(Belnap, 2002; Castillo-Monroy et al., 2010), y mejora las condiciones para la proliferación
del microorganismos del suelo (Belnap & Lange, 2003). Durante los últimos 20 años ha
habido un creciente interés por la costra biológica del suelo a través de todo el mundo, lo
cual ha mejorado nuestro conocimiento sobre la estructura, composición fisiología y
biogeografía de éstos organismos (Belnap & Lange, 2003). Sin embargo, el efecto de la
humedad sobre la costra biológica del suelo ha sido identificado como un tema clave
para el futuro, ya que ha sido escasamente investigado (Maestre et al., 2011).

9
Figura 3. Fotografías de la costra biológica del suelo.
- Deposición atmosférica de N
La deposición atmosférica de N es, además del cambio climático, uno de los
mayores impulsores del cambio global (Schlesinger, 2013). Los altos niveles de
deposición atmosférica de N provenientes tanto del consumo de combustibles fósiles
como de actividades agrarias, está llegando a ser un problema a nivel mundial (Vitousek
et al., 1997, Galloway & Cowling, 2002). Este exceso de deposición de N puede tener
serias consecuencias sobre los ecosistemas, tales como imbalances de nutrientes,
acidificación del suelo, eutroficación de aguas, cambios en los ciclos de C y N, y
aumentos en las emisiones de N2O del suelo, las cuales a su vez, contribuirían al
calentamiento global (Balota et al., 2004, Lal, 2004, Fenn et al., 1998). Recientemente se ha
demostrado que el enriquecimiento de N está también asociado al descenso de la
biomasa microbiana del suelo (Treseder, 2008), y teniendo en cuenta la importancia de
este reservorio de nutrientes, es previsible que afecte a las tasas de transformación de la
materia orgánica y la disponibilidad de nutrientes para las plantas (Sardans et al., 2008).
La interacción de varios impulsores del cambio global como la deposición atmosférica de
N y el cambio climático, pueden interactuar de formas que son difíciles de predecir en
base a la respuesta de un solo impulsor (Shaw et al., 2002), por eso es necesario estudiar
el efecto combinado de éstos para poder hacer previsiones más aproximadas.

10
2.4. Áreas de estudio
Aunque la mayor parte de los estudios realizados en esta tesis se han
desarrollado en dos ecosistemas mediterráneos, también hemos querido evaluar el efecto
de los ciclos de secado y rehumedecido del suelo en un ecosistema semiárido y en uno
templado. El motivo por el que nos hemos centrado en ecosistemas limitados por la
disponibilidad de agua, es porque la asincronía entre la estación de crecimiento y la
disponibilidad de agua aumenta la importancia de este recurso en el ecosistema. Los
ecosistemas en los que se ha llevado a cabo esta tesis se describen a continuación.
- Ecosistemas mediterráneos
Las zonas de estudio en las que se han desarrollado la mayoría de los
experimentos de esta tesis han sido un pinar y un matorral situados en el suroeste de
España (37° 21’N; 5° 56’ O). El año en el que se realizaron los estudios fue más húmedo
de lo habitual, habiendo recibido unas precipitaciones anuales de 853 mm el pinar y 846
mm el matorral. Los suelos de estas zonas tienen un perfil típico A(B)C. El pinar está
compuesto por Pinus pinea L. y algunas herbáceas anuales, mientras que el matorral está
dominado por Quercus coccifera L., Cistus albidus L., Genista hirsuta Vahl. y Arbutus unedo
L.
En la cuenca mediterránea, la actividad biológica se restringe a los pocos
periodos húmedos que coinciden con altas temperaturas, siendo de esta forma las
características climáticas de la región mediterránea las que más determinan los recursos
nutricionales de estos suelos. La relación inversa que frecuentemente se encuentra entre
la temperatura y la humedad óptimas para el crecimiento microbiano hacen que las tasas
de descomposición y mineralización de la materia orgánica sólo sean elevadas en
periodos cortos e impredecibles a lo largo del año (kruger et al., 1983), produciendo una
baja disponibilidad de nutrientes. Los ciclos de secado y rehumedecido del suelo
durante la estación de crecimiento son los que probablemente más determinen las tasas
de actividad microbiana, y su efecto no ha sido suficientemente estudiado en
ecosistemas mediterráneos (Li et al., 2006). La actividad biológica está inhibida en
condiciones de suelo seco, y los períodos de sequía producen una capa superior seca del
suelo que disminuye el N disponible (Garwood & Tyson, 1973). Sin embargo, los

11
microorganismos pueden sobrevivir en forma inactiva en los suelos secos, volviendo a
reactivarse al aumentar el contenido hídrico del suelo.
Figura 4. Localización e imágenes de los ecosistemas mediterráneos que han sido estudiados en esta tesis. La pimera imagen se corresponde con el pinar y la segunda con el matorral.
- Ecosistema semiárido
El cuarto capítulo de esta tesis se ha llevado a cabo con un suelo procedente de la
Estación Experimental de Aranjuez, situado en el centro de España (40° 02′ N; 3° 37′ O).
El clima en esta zona es Mediterráneo semiárido, con una media anual de 388 mm de
precipitación y 14ºC de temperatura. El suelo tiene una importante proporción de yeso y
presenta una cobertura de plantas perennes por debajo del 40%, principalmente Stipa
tenacissima L. y Retama sphaerocarpa L. El suelo desprovisto de plantas aloja costra
biológica del suelo bien desarrollada dominada por líquenes (Castillo-Monroy et al.,
2010).

12
Figura 5. Localización e imagen del ecosistema semiárido que ha sido estudiado en esta tesis.
- Ecosistema templado
A pesar de que los ciclos de secado y rehumedecido de los suelos tienen un papel
muy relevante en ecosistemas con una fuerte estacionalidad en las precipitaciones como
los mencionados anteriormente, estos ciclos también ocurren frecuentemente en una
gran variedad de ecosistemas y tienen importantes consecuencias sobre los ciclos
biogeoquímicos (Kieft et al., 1987; Groffman & Tiedje, 1988; García-Méndez et al., 1991;
Mummey et al., 1994; Cui & Caldwell, 1997; Ryan et al., 1998; Pulleman & Tietema,
1999). El quinto capítulo de esta tesis se ha realizado en el Cary Institute of Ecosystem
Studies, en el suroeste del estado de Nueva York, USA (41.797°N, 73.734°W). El bosque
del que se recogieron las muestras de suelo está dominado por Quercus rubra L., Quercus
prinus L. y Carya sp. El clima en esta zona es continental húmedo, con unas medias
anuales de 1110 mm de precipitación y 9.6 ºC de temperatura. El suelo es franco limoso y
tiene buen drenaje. Desde 1996, la mitad de las parcelas muestreadas fueron tratadas
periódicamente con NH4NO3 y la otra mitad permanecieron sin tratar como control.

13
Figura 6. Localización e imagen del ecosistema templado que ha sido estudiado en esta tesis.
2.5. Objetivos de la tesis y estructura en capítulos
El objetivo general de esta tesis es evaluar como los cambios en el patrón de
precipitación afectarán a los ciclos biogeoquímicos, los microorganismos del suelo y la
emisión de gases de efecto invernadero en distintos ecosistemas y evaluar la importancia
de los ciclos de secado y rehumedecido del suelo como controladores de los procesos del
suelo. Además, analizaremos cómo la costra biológica del suelo y la deposición
atmosférica de N modulan la respuestas de las variables de estudio a los ciclos de secado
y rehumedecido del suelo.
De forma más concreta, abordaremos los siguientes objetivos específicos a través
de los cinco capítulos de esta tesis. En el capítulo 1 se estudia la importancia de los
cambios en el contenido hídrico del suelo sobre el pool del N en dos ecosistemas
mediterráneos, un pinar y un matorral. En este estudio evaluamos N orgánico y N
inorgánico, así como la disponibilidad de N mediante el uso de resinas de intercambio
iónico. En el capítulo 2 se evalúa la respuesta de las tasas de respiración de estos dos
mismos ecosistemas a los ciclos de secado y rehumedecido del suelo en relación a su
estado nutricional, analizando también la variación temporal intra e inter estacional de
las variables estudiadas. En el capítulo 3 se determina si los cambios estacionales en la
respuesta microbiana a la adición de diferentes fuentes de C produce un patrón similar
en el pinar y el matorral nombrados anteriormente, y se evalúa su posible relación con
algunas variables orgánicas del ciclo del C en el suelo. En el capítulo 4 se estudia el

14
papel modulador de la costra biológica sobre el efecto de la longitud y la intensidad de
los ciclos de secado y rehumedecido del suelo en una serie de variables relacionadas con
el ciclo del N y del C. Finalmente, en el capítulo 5 se evalúa el potencial modulador de la
deposición atmosférica de N sobre el efecto de la frecuencia de los ciclos de secado y
rehumedecido del suelo en la comunidad microbiana, los ciclos biogeoquímicos y la
emisión de los gases de efecto invernadero.
Los resultados obtenidos de este trabajo permitirán una mejor comprensión de
los mecanismos implicados en la respuesta de los procesos del suelo y la comunidad
microbiana a los pulsos de agua sobre diferentes ecosistemas. Estos conocimientos serán
de gran valor para realizar previsiones sobre las consecuencias del cambio climático
esperado para las próximas décadas, pudiendo llegar a ser una importante herramienta a
la hora de prever futuros escenarios.

15
Capítulo 1
Wetting and drying events determine soil N pools in two Mediterranean
ecosystems
Lourdes Morillas, Miguel Portillo-Estrada and Antonio Gallardo
Published in Applied Soil Ecology, 72 (2013) 161– 170
To improve our knowledge of how nutrient cycling in Mediterranean
environments responds to climate change, we evaluated the effects of the continuous
changes in soil nitrogen (N) pools during natural wetting and drying events. We
measured soil N pools (microbial biomass [MB-N], dissolved organic nitrogen [DON],
NH4+ and NO3-) and N ion exchange resins at weekly intervals for one year in two
contrasting Mediterranean ecosystems. All soil N fractions in both ecosystems showed
high intraseasonal and interseasonal variability that was greater in inorganic soil
fractions than in organic N soil fractions. MB-N, DON and resin-NH4+ showed increased
concentrations during wetting events. Only the soil NO3- and resin-NO3- showed the
opposite trend, suggesting a different response to water pulses compared to the other
soil variables. Our results show that N pools are continuously changing, and that this
high variability is not associated with the total amount of organic matter and labile soil
carbon (C) and N soil fractions found in each ecosystem. The highest variability was
found for inorganic N forms, which suggests that organic N forms are more buffered in
soils exposed to wetting-drying cycles. Our results suggest that the changes in wetting-
drying cycles expected with global climate change may have a significant impact on the
availability and turnover of organic and inorganic N.
Keywords: Ion exchange resins N; nutrient cycling; precipitation; Dissolved organic N;
microbialbiomass-N.


17
Introduction
Mediterranean ecosystems are predicted to experience important changes in the
rainfall dynamics due to climate change, including a higher frequency of intense
precipitation and drought events (Bates et al. 2008). These ecosystems are characterized
by humid and cold temperature winters and dry and high temperature summers, and
they are particularly susceptible to wetting and drying episodes due to the infrequency
of rainfall events and the often warm and dry climate that favors rapid soil drying
(Schröter, et al.2005). These changes may affect the turnover of carbon (C) and N in
soils, but the direction of such changes is still unclear (Bortner and Matzner, 2009). A
large number of laboratory studies during recent decades have assessed the changes in
C and N turnover during wetting-drying cycles. However, the results of these studies
are not conclusive (see Table 1 in Bortner and Matzner, 2009), most likely due to the
application of different experimental conditions (Bortner and Matzner, 2009). Few field
studies have been conducted, and most of those simulated reductions in rainfall
(Davidson et al., 2004; Sotta et al., 2007; Yahdjian et al., 2006) or employed artificial
wetting (Borken et al., 2006; Emmett et al., 2004) and reached contradictory
conclusions. Consequently more detailed field observations are demanded to clarify
the role of wetting-drying cycles in N pool changes.
Wetting-drying cycles influence microbial biomass and its activity (Bottner,
1985; Orchard and Cook, 1983; Skopp et al., 1990; Voroney, 2007). Increased amounts of
N are mineralized after wetting-drying cycles compared with the amount that is
mineralized in soils that are kept moist (Sorensen, 1974; Soulides and Allison, 1961).
The mechanisms that explain this increased turnover are well known. During soil
drying, microbes may accumulate solutes such as amino acids, carbohydrates, polyols
and inorganic solutes to decrease osmotic potential in the cell and equilibrate with their
environment (Halverson et al., 2000; Harris, 1981). The rapid changes in the soil water
potential associated with rewetting cause microbes to undergo osmotic shock, which
induces microbial cell lysis (Bottner, 1985; Van Gestel et al., 1992, 1993) and the release
of the previously accumulated intracellular solutes (Halverson et al., 2000). A
significant fraction of decomposable organic substrates are derived in part from the
death of a portion of soil microorganisms (Jenkinson, 1966; Shields et al., 1974;
Sorensen, 1983).

18
Additionally, the wetting-drying of soil may break soil aggregates and expose
physically protected organic matter (Denef et al., 2001a, b; Lundquist et al., 1999a; Wu
and Brookes, 2005). This previously unavailable organic matter can be rapidly
mineralized by the microbial community (Appel, 1998). Thus, wetting-drying cycles
may indirectly control the activity of soil organisms (Evans and Wallenstein, 2011) and
ultimately determine nutrient turnover (Fierer and Schimel, 2002).
Improving our knowledge of the dynamics of wetting-drying cycles is crucial to
predicting how nutrient cycling in Mediterranean environments will respond to
ongoing global environmental change. However, it is difficult to predict the response
to wetting or drying events because of the complexity of the processes involved. For
example, in semi-arid ecosystems Schwinning and Sala (2004) have developed the idea
that there is a hierarchy of soil moisture pulse events with a corresponding hierarchy of
ecological responses, in which small pulses only trigger a small number of relatively
minor ecological events and larger pulses trigger a more inclusive set and some larger
ecological events. A higher level of complexity arises from the inverse metabolic
activity hypothesis (Huxman et al., 2004), which suggests that ecosystems functioning
at rates higher than their maximum will exhibit relatively low pulse responses
compared to ecosystems functioning at lower rates. We think that these mechanisms
might be operating in Mediterranean ecosystems as well, since small and large pulses
of water inputs are also frequent.
In order to test the hypothesis that pulses of water will make noticeable changes
in soil N pools, we evaluated the effects of the continuous changes on these pools
during wetting-drying cycles in two Mediterranean ecosystems: a pine forest and a
shrubland. These two plant communities were chosen as representative of two of the
most common terrestrial ecosystems in SW Spain. We focused on the analysis of field
observations to avoid the problems associated with manipulative experimental
techniques. Our novel approach consisted of weekly soil sampling over the course of
one year. This intensive sampling permitted consideration of all intraseasonal
variability in the studied variables, identified different wetting or drying events in
different seasons and explored the existence of an emerging and common pattern in
the response of nutrient dynamics to these wetting-drying cycles.
In this study, we explored changes in N pools, including in dissolved organic N
(DON) and microbial biomass N (MB-N), the most important labile organic pools in
soils. Because N pools do not reflect the soil ion diffusion rates, which can be

19
dramatically affected during wetting-drying cycles (Li et al., 1993; Qian and Schoenau,
2001), we utilized ion resin membranes to estimate the effect of natural wetting and
drying events on N availability. This technique is a tool which estimates plant uptake
in simulating a plant root surface (Duran et al., 2013), and thus to be a better indicator
of net N mineralization, avoiding N mineral leaching or crop capture. We first
attempted to quantify the intraseasonal and interseasonal temporal N variation in soils
and discern the consistency of temporal variability in the two Mediterranean
ecosystems. Owing to the magnitude of the biogeochemical pulses during wetting-
drying events may depend on substrate availability (Austin, 2011; Austin et al., 2004;
Collins et al., 2008; Ma et al., 2012), we expected a higher variability of soil N pools in
ecosystems rich in soil organic matter and nutrients compared to poorer ecosystems.
We also analyzed whether the soil variability was higher in organic or inorganic
forms of N because resilience to wetting and drying events may be related to the
different turnover rates of soil N fractions. We searched for directional changes in the
soil N pools during wetting and drying events and examined the consistency of these
changes in the two different ecosystems and contrasting climatic seasons. We also
tested the hypothesis that the response of N pools to wetting-drying cycles may differ
from N availability because diffusion rates are not accounted for.
Materials and methods
Study area
This study was conducted in a pine forest and a shrubland ecosystem in
southwest Spain (37° 21’N; 5° 56’ W). The distance between these study sites is 14.5 km.
The Mediterranean climate has a 30-year average rainfall and temperature of 565.7 mm
and 19.0°C, respectively. The study year was wetter than normal (852.6 mm in the pine
forest and 845.7 mm in the shrubland). The soils in these areas have a typical A(B)C
profile with a sandy clay loam and loamy sand texture in the pine forest and the
shrubland respectively. Table 1 presents the main soil properties of the study sites. The
pine forest includes Pinus pinea L. and some annual herbs. The shrubland is dominated
by Quercus coccifera L., Cistus albidus L., Genista hirsuta Vahl. and Arbutus unedo L.
Seasonally, the pine forest is subjected to fewer rapid changes in the soil water content
than the shrubland soil due to its thicker litter layer and canopy shading. Net primary

20
production in these types of pine forest is significantly higher than in the shrublands
(Merino et al. 1988).
Table 1. Soil physical and chemical properties of the top 10 cm for the pine forest and shrubland sites. Soil sampling was done weekly during 2009-2010 for MB-N, DON, NH4 +-N, NO3-- N, PO43--P, IEMs, phenols, hexoses and aromatic compounds (n=312) and twice a year (summer and winter) for the remaining variables (n=24)
Pine Forest Shrubland
Mean SE Mean SE
Clay (%)* 23.6 1.71 6.63 0.80
Silt (%) 12.8 3.64 12.5 0.69
Sand (%)* 63.6 5.26 81.0 0.36
Bulk density (g cm-3)* 1.16 0.07 1.41 0.09
Water content (%)* 12.4 0.53 7.98 0.33
Water holding capacity (%)* 45.87 0.58 27.73 0.76
pH* 7.2 0.03 5.49 0.06
Organic matter (%)* 2.84 0.21 1.91 0.17
Phenols (mg kg-1 soil)* 10.42 1.56 6.61 0.43
Hexoses (mg kg-1 soil)* 39.33 2.35 12.03 0.34
Aromatic compounds (mg kg-1 soil)* 127.74 9.29 32.8 3.06
Total N (%)* 0.15 0.02 0.10 0.01
C/N 10.9 0.49 13.09 1.91
MB-N (mg kg-1 soil)* 62.7 1.88 35.6 1.46
DON (mg kg-1 soil)* 12.0 0.39 8.82 0.48
NH4 +-N (mg kg-1 soil)* 0.32 0.04 0.35 0.08
NO3-- N (mg kg-1 soil)* 3.22 0.23 1.38 0.16
NH4+-N IEMs (µg cm-2 day -1) 0.24 0.01 0.31 0.02
NO3-- N IEMs (µg cm -2 day -1) 0.48 0.03 0.52 0.03
Sodium bicarbonate PO43--P (mg kg-1 soil)* 2.39 0.09 0.53 0.03
Mg (meq 100g-1)* 1.16 0.08 0.51 0.03
K (meq 100g-1)* 0.62 0.03 0.16 0.01
Ca (meq 100g-1)* 12.2 0.82 8.08 0.52
Na (meq 100g-1)* 0.31 0.01 0.18 0.02

21
Sampling design
The soil sampling was conducted at weekly intervals for one year (from
October 2009 to October 2010) to explore the dynamics of the N pools in the soils in
response to periods of increasing or decreasing moisture availability. Six soil samples
were collected randomly from the top 10 cm of the soil profile at each study site using a
circular soil corer (5 cm diameter × 10 cm height). The samples were taken from the top
10 cm of the soil profile because most of soil nutrients in a Mediterranean ecosystem
accumulate in the first few cm of the soil profile (Lugo et al., 1990). The soil samples
were transported in polyethylene bags to the laboratory, stored at 3 °C in laboratory
refrigerators and processed as soon as possible. All samples were processed in less
than three days. This procedure ensured that the soil samples did not experience
relevant changes (Gonzalez-Quiñones et al., 2009).
Laboratory analysis
The soil texture was estimated using the hydrometer method proposed by
Kroetsch and Wang (2008). The gravimetric soil water content was calculated in fresh 5
g subsamples after drying in an 80 ºC oven for 48 h. The water holding capacity was
determined for each soil type as the gravimetric water content of soil that was
saturated and allowed to drain freely over 48 h in a filter funnel. The soil pH was
measured in 1:5 soil-water solutions. The soil organic matter was analyzed via the wet
oxidation techniques of Skjemstad and Baldock (2006). Soil phenols, hexoses and
aromatic compounds were determined following Chantigny et al. (2006). Soil
subsamples were extracted with 0.5 M K2SO4 at a ratio of 1:5, followed by shaking for 1
h at 200 rpm at 20ºC. The extracts were filtered through a 0.45 µm Millipore filter, and
they were measured colorimetrically by using a microplate reader. The total soil N was
measured by standard Kjeldahl procedures (Rutherford et al., 2007). The soil PO43--P
content was extracted with 100 ml of 0.5 M NaHCO3 at a ratio of 1:20, and the
concentration in the extract was determined by the molybdenum blue colorimetric
method (Allen et al., 1986). Mg, K, Ca and Na were determined by atomic absorption
spectrophotometry.
To measure ammonium (NH4+-N), nitrate (NO3--N) and DON, the soil
subsamples were extracted with 0.5 M K2SO4 at a ratio of 1:5, followed by shaking for 1

22
h at 200 rpm at 20ºC. The extract was filtered through a 0.45 µm Millipore filter (Jones
and Willett, 2006). The NH4+-N concentration was estimated directly via the
indophenol blue method using a microplate reader (Sims et al., 1995). The NO3--N was
first reduced to NH4+-N with Devarda alloy, and the concentration was determined as
the difference between the Devarda-incubated and unincubated samples. The DON in
the extracts was first oxidized to NO3--N with potassium persulfate (K2S2O8) in an
autoclave at 121 ºC for 55 min and then reduced to NH4+-N with Devarda alloy (Sollins
et al., 1999). The DON contents were calculated as total dissolved N minus inorganic
N.
MB-N was determined using the fumigation-extraction method proposed by
Brookes et al. (1985). Twenty grams of fresh soil subsamples were fumigated with
chloroform for 5 days. The non-fumigated replicates were used as controls. The
fumigated and non-fumigated samples were extracted with 100 ml of K2SO4 0.5 M and
filtered through a 0.45-µm Millipore filter. The extracts were digested as described
above. The total N content in the digested extracts was determined by colorimetry
(indophenol blue method) with a microplate reader (Sims et al., 1995). The MB-N
concentration was estimated as the difference between the total N in fumigated and
unfumigated digested extracts divided by a Kn (fraction of MB-N extracted after CHCl3
treatment) of 0.54 (Brookes et al., 1985).
The availability of NH4+-N and NO3--N was measured in situ with ion-exchange
membranes (resins; Subler et al., 1995). We selected this technique to generate minimal
disturbances in the superficial soil communities and permit intensive sampling over
multiple time periods at the same spatial location. Six anion and cation resins (types I-
100 and I-200, Electropure Excellion, Laguna Hills, California) were installed per site
each week during the one-year sampling period. These resins were first subjected to
expansion treatment by submersion in distilled water at 82–90°C for 48 h. Next, the
resins were cut into 2.5 × 2.5 cm squares, attached to a plastic rod with acrylic glue and
inserted into the soil at a 0.5–3 cm depth. The difference between this depth and the top
10 cm of soil from which the soil cores were collected makes them not directly
comparable in terms of soil depth. The resins likely reflect the most organic horizon
compared with the top 0 to 10 cm of the soil profile. During each sampling period, the
resins were incubated in the field for 7 days. Following collection, the resins were taken
to the laboratory and dried at ambient temperature. The resins were carefully
separated from the plastic rod, brushed to remove soil particles, and placed into 125 ml

23
flasks for extraction with 25 ml of 2 M KCl via orbital spinning (1 h at 200 rpm). The
extracts were analyzed to measure NH4+-N and NO3--N, as explained above.
Statistical and numerical analyses
During the study year, we identified eight major intervals of increasing soil
water content (wetting events) and eight periods of decreasing soil water content
(drying events) at each study site (Figure 1 a and b). We identified the intervals in all
seasons, and the interval length ranged from 1 and 9 weeks. To calculate the impact of
further wetting events on an already wet soil or a relatively dry soil on N dynamics, we
classified these intervals based on occurrence on dry or wet soil. We defined dry or wet
soil based on the initial water content, with the wet soil found approximately between
November and April. A wetting interval was arbitrarily considered to occur within a
wet soil if the water content starting point (the driest point) was above 10% in the pine
forest or 5% in the shrubland. A drying interval was considered to occur within a dry
soil if the water content starting point (the wettest point) was below 15% for both sites.
The increases or decreases in soil variables were calculated as the difference
between the final and initial concentration in each wetting or drying interval, except
for the NO3- and resin-NO3-, with a lag time of one week with respect to the wetting
and drying events. We performed a Spearman correlation between changes in soil
variables during wetting and drying events, mean temperature, mean soil water
content (SWC), length of the wetting and drying event (LE) and length of the previous
wetting or drying event before the next event (LPE).
To assess the effect of the study sites and seasons on the analyzed soil
variables, we used a linear mixed model that treated the study site as a fixed effect and
the seasons as random effects. We used linear mixed models that are particularly
useful in settings with repeated measurements, such as our sampling design. The effect
of each independent variable on the model was analyzed using a permutation test
(1000 permutations of raw data). The linear mixed model and permutation tests were
run using the libraries “nlme” and “pgirmess”, respectively, in the R statistical
package, version 2.15 (R Development Core Team 2012). The effects of the wetting and
drying events on the changes in the analyzed variables for each site were determined
using a linear model and permutation tests as described above. We adopted a

24
significance level of p<0.05. We used coefficients of variation (CV) as a metric for soil
variability.
Figure 1. Soil water holding capacity (a) measured at weekly intervals in the top 10 cm of the soil profile during the study year in the pine forest and shrubland sites. Shaded bands indicate the selected wetting phases. Error bars are ±2SE. Soil temperature and precipitations (b) in the pine forest and shrubland plant communities during the study year
Results
Soil differences between ecosystems
Significant differences for soil texture and for all other physical properties were
found between the two sites (Table 1). The pine forest showed both the highest water
holding capacity and water content, and a neutral pH as opposed to the more acidic
shrubland soil. All soil chemical variables were also significantly different between
ecosystems, with the exception of the C:N ratio, and the resin-NH4+ and -NO3-.
Intraseasonal and annual variability
The maximum MB-N values were found in autumn and winter at the pine
forest and in winter at the shrubland, while the minimum values were found in

25
summer at the pine forest and in autumn and summer at the shrubland (Figure 2a).
The MB-N contents ranged between 10.7 and 110.8 mg kg-1 soil in the pine forest and
0.09 and 64.5 mg kg-1 soil in the shrubland. The highest CV for this variable were found
in summer (CV=0.65 and 0.79 in the pine forest and the shrubland, respectively) at
both study sites (Table 2). We detected significant differences in the MB-N contents
between the two study sites and the seasons (Table 3). Differences between seasons
were also observed when we analyzed each site separately (PShrubland<0.0001, Ppine
Forest<0.0001).
Table 2. Coefficients of variation for the soil variables due to seasons and sites (annual)
Pine Forest Shrubland
Variables Autumn Winter Spring Summer Annual Autumn Winter Spring Summer Annual
MB-N 0.35 0.38 0.41 0.65 0.50 0.71 0.50 0.56 0.79 0.65
DON 0.55 0.37 0.51 0.35 0.53 0.59 0.39 0.53 0.57 0.84
NO3--N 0.66 1.09 0.95 1.29 1.21 1.24 1.82 2.16 1.56 1.95
Resin-NH4+-N 0.32 0.79 0.45 0.35 0.91 0.35 0.64 0.53 0.45 0.97
Resin-NO3--N 0.78 0.86 0.81 1.15 0.99 0.94 0.52 0.77 1.12 1.04
The maximum DON contents were found in summer at both study sites, while
the minimum DON values were similar in the remainder seasons (but with minimum
peaks in spring, Figure 2b). The DON values ranged between 2.81 and 26.4 mg kg-1 soil
in the pine forest and 0.84 and 21.73 mg kg-1 soil in the shrubland. The highest CV
values for this variable were found in autumn (CV=0.55 and 0.59 in the pine forest and
the shrubland, respectively) at both study sites (Table 2). We detected significant
differences in this variable between study sites and seasons (Table 3).
Table 3. Permutation test evaluating the effect of the site and season on soil variables
Variables P site P season P Site x Season
MB-N <0.0001 <0.0001 <0.0001
DON <0.0001 <0.0001 0.071
NH4+-N 0.752 0.028 0.054
NO3--N <0.0001 0.004 0.019
Resin-NH4+-N <0.0001 <0.0001 <0.0001
Resin-NO3--N 0.163 0.921 0.205

26
Very low (or undetectable) NH4+-N values were found throughout the whole
year at both study sites. The maximum values were recorded in winter, summer and
autumn, and the minimum values were found in spring at both study sites (Figure 3a).
The NH4+- N contents ranged from 0 to 2.53 mg kg-1 soil in the pine forest and from 0 to
3.87 mg kg-1 soil in the shrubland. The highest coefficients of variation (CV=4.03 and
4.55 in the pine forest and the shrubland, respectively) in this variable were found in
autumn at both study sites (Table 2). We detected significant differences between the
seasons but not between sites (Table 3).
Figure 2. MB-N (a) and DON (b) measured at weekly intervals throughout the year in the pine forest and shrubland plant communities.
The maximum NO3--N contents were observed in autumn at both study sites,
while the minimum NO3--N values were observed in the rest of the seasons (Figure 3b).
The NO3--N contents ranged from 0 to 12.3 mg kg-1 soil in the pine forest and from
undetectable to 11.13 mg kg-1 soil in the shrubland. The highest CV values were found
in summer (1.29) and spring (2.16) in the pine forest and the shrubland, respectively
(Table 2). We detected significant differences in the contents of NO3--N between the
study sites and seasons (Table 3).

27
Figure 3. NH4+-N (a), NO3--N (b), resin-NH4+-N (c) and resin-NO3--N (d) measured at weekly intervals during the study period in the pine forest and shrubland plant communities
For resin-NH4+-N, the highest CV values was found in winter (CV=0.79 and
0.64 in the pine forest and the shrubland, respectively) at both study sites (Table 2).
Significant differences were observed among seasons for this variable (Table 3), with

28
the maximum and minimum peaks occurring in autumn and spring, respectively, for
both study sites (Figure 3c). Significant differences were detected in the mean values
between the two sites (Table 3), with values ranging between 0.047 and 0.83 µg cm-2
day-1 in the pine forest and 0.014 and 1.24 µg cm-2 day-1 in the shrubland. We observed
a significant site x season interaction (Table 3) because differences between sites were
only found in autumn.
For resin-NO3--N, the highest CV values were found in summer (CV=1.15 and
1.12 in the pine forest and the shrubland, respectively) at both study sites (Table 2).
Significant differences were not found between seasons for this variable (Table 3) or
sites (Table 3; Figure 3d). The values ranged between 0.027 and 2.3 µg cm-2 day-1 in the
pine forest and between 0.09 and 2.16 µg cm-2 day-1 in the shrubland.
Changes during wetting-drying events
Positive and negative changes were observed during the wetting and drying
events, respectively, for MB-N (p<0.0001), DON (p=0.015) and resin-NH4+-N (p=0.002)
in the pine forest soils (Figure 4 and 5). However, the opposite trend (increases during
the drying phases and decreases during the wetting phases) was found for NO3--N
(p=0.104) and resin-NO3--N (p<0.0001, Figure 5). In the shrubland soils, these
differences between wetting and drying events were of a lower magnitude but still
significant for MB-N (p<0.0001), DON (p=0.05), NO3--N (p=0.045) and resin-NO3--N
(p=0.006, Figure 4 and 5). The pattern noted for the whole year was also observed for
the dry and wet soils for most variables (Table 4). However, some differences emerged
for soil NO3--N, as the variations between the wetting and drying events were apparent
only for the dry season at both sites (p=0.085 and p=0.008 in the pine forest and the
shrubland, respectively). Similarly, the differences for resin-NH4+-N were apparent
only in the dry season for both sites (p=0.032 and p=0.07 in the pine forest and the
shrubland, respectively).

29
Table 4. Permutation test evaluating the effect of the wetting-drying events for all conditions (whole year) or within the wet and dry soils on soil variables
Pine Forest Shrubland
Variables Whole year Dry soil Wet soil Whole year Dry soil Wet soil
MB-N < 0.0001 0.09 0.029 < 0.0001 0.016 0.305
DON 0.015 0.141 0.071 0.05 0.381 0.049
NH4+-N 0.971 0.121 0.719 0.262 0.271 Undetectable
NO3--N 0.05 0.085 0.916 0.045 0.008 0.897
Resin-NH4+-N 0.002 0.032 0.315 0.565 0.07 0.296
Resin-NO3--N < 0.0001 0.205 0.026 0.006 0.03 0.398
Figure 4. Increments of MB-N (a) and DON (b) during eight wetting and drying events for each study site. Error bars are ±2SE. n=8 for “Whole year” and n=4 for “Dry soil” and “Wet soil”
The changes in soil variables during wetting and drying events were not
correlated with the mean temperature of each time period. In the pine forest during the
drying events, the changes in the amount of NH4+-N and NO3--N were positively
correlated with the mean SWC (Table 5). We also found negative correlations between
the changes in the MB-N during wet events and the LE and LPE in the pine forest and
the shrubland, respectively (Table 5). We identified a positive correlation between

30
changes in NO3 and resin- NO3--N and LE in the shrubland during wet and dry events,
respectively.
Table 5. Spearman correlation matrix (rho) between changes in soil variables during wetting and drying events, and the mean temperature, mean soil water content (SWC), the length of the wetting and drying event (LE) and the length of the previous wetting or drying event before the next event (LPE). Significant correlations (P≤0.05) are indicated in bold numbers. N=8.
MB-N
(µg/g)
DON
(µg/g)
NH4 +-N
(µg/g)
NO3--N
(µg/g)
NH4+-N IEMs
(µg/(cm2*day))
NO3-- N IEMs
(µg/(cm2*day))
Pine forest Wet event T 0.2143 0.1905 -0.4059 -0.1905 -0.3214 0.3214
SWC 0.1667 -0.2619 0.4312 0.2619 -0.0357 -0.4643
LE -0.8301 0.2554 0.6191 0.0255 0.6736 -0.3930
LPE -0.3604 -0.3063 -0.0374 -0.0180 0.4638 0.3424
Dry event T -0.5476 -0.7143 0.7413 0.3571 0.4048 -0.2619
SWC -0.0878 0.6786 -0.8901 -0.714 0.3333 0.3810
LE 0.1708 -0.2594 -0.0374 -0.5124 0.0732 0.5855
LPE -0.7093 0.3947 0.2464 0.4335 0.2167 -0.0985
Shrubland Wet event T -0.1429 0.0952 -0.535 -0.3214 0.5238 -0.1191
SWC -0.1905 0.0238 0.1336 0.6429 -0.6667 0.4048
LE -0.2887 -0.0138 0.5916 0.8964 -0.4949 -0.1237
LPE -0.8001
0.3273 -0.429 0.4058 0.2546 0.2364
Dry event T -0.3095 0.4643 0.6547 0.3095 -0.5238 0.5714
SWC 0.0238 -0.2500 -0.131 -0.5000 0.3333 -0.5476
LE -0.0603 0.2342 0.5314 0.1566 -0.3615 0.7711
LPE -0.1336 -0.1690 0.7906 -0.2673 -0.4009 0.4009
31
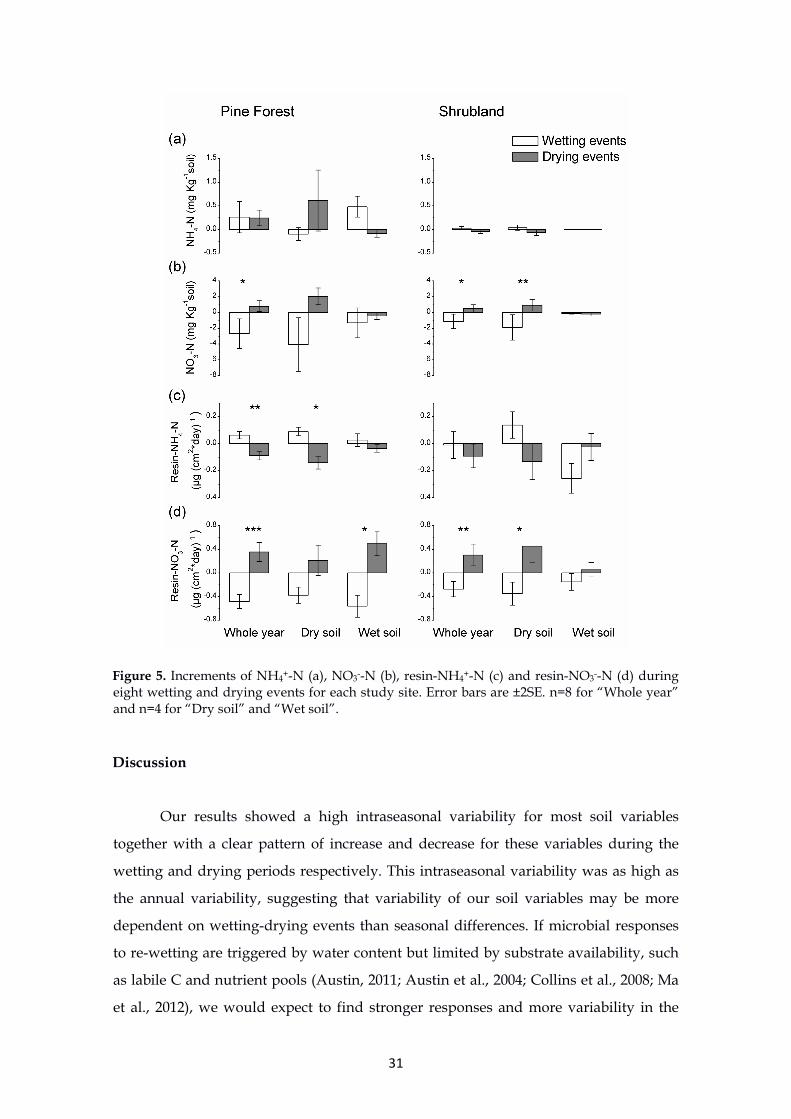
Figure 5. Increments of NH4+-N (a), NO3--N (b), resin-NH4+-N (c) and resin-NO3--N (d) during eight wetting and drying events for each study site. Error bars are ±2SE. n=8 for “Whole year” and n=4 for “Dry soil” and “Wet soil”.
Discussion
Our results showed a high intraseasonal variability for most soil variables
together with a clear pattern of increase and decrease for these variables during the
wetting and drying periods respectively. This intraseasonal variability was as high as
the annual variability, suggesting that variability of our soil variables may be more
dependent on wetting-drying events than seasonal differences. If microbial responses
to re-wetting are triggered by water content but limited by substrate availability, such
as labile C and nutrient pools (Austin, 2011; Austin et al., 2004; Collins et al., 2008; Ma
et al., 2012), we would expect to find stronger responses and more variability in the

32
pine forest (where there is a higher soil organic matter content and lower C-to-N ratio)
than the shrubland. However, the variability in the soil N variables was similar in both
ecosystems; this result provides little support for the substrate limitation hypothesis in
these ecosystems (Jenerette and Chatterjee, 2012).
The inorganic forms of N were more variable than the organic forms,
suggesting that the turnover of microbial biomass and organic polymers is more
resilient to wetting-drying cycles than inorganic forms of N due to the many processes
involved in transformation, inputs (atmospheric N deposition) and outputs (leaching
and denitrification), in addition to internal ammonification and nitrification processes.
Other authors have reported similar results. For example, the wetting of dry soil from a
semi-arid ecosystem was found to initially stimulate gross N mineralization to a
greater extent than N immobilization and cause a short-lived wetting pulse of
inorganic N (Saetre and Stark, 2005). Less variability in the organic N forms may agree
with the observation that the C cycle is less sensitive than the N cycle to wetting-drying
cycles (Borken and Matzner, 2009).
The values of most of the analyzed variables increased during wetting events,
as expected due to the increasing microbial activity observed by numerous authors
(e.g., Borken et al., 2003; Lee et al., 2004; Sponseller, 2007). Several mechanisms have
been proposed to explain the directional changes in microbial biomass and N pools
detected during the wetting-drying cycles, which were also observed in the present
study. For example, dry intervals can result in high microbial mortality due to
desiccation and radiation damage (Castenholz and Garcia-Pichel, 2000). These dead
microorganisms are readily decomposed by surviving organisms when the soil is
rewetted. Surviving microorganisms may experience greater stress than during the
drying interval and possibly die following wetting (Schimel et al., 2007).
Sudden changes in soil moisture are stressful to microbes because they must
expend energy to regulate osmotic pressure in relation to their microenvironment
(Bottner, 1985; Van Gestel et al., 1993). To achieve osmotic regulation as the soil dries,
many microbes synthesize solutes such as aminated sugars and amino acids (Csonka,
1989). Because the soil water potential increases rapidly after precipitation events, the
microbes must release solutes before osmotic pressure bursts their cells (Halverson et
al. 2000; Wood et al., 2001). These mechanisms are complex, and the dominance of one
process over another may explain the contrasting directional changes that several
authors observed during wetting-drying cycles (Fierer et al., 2003; Halverson et al.,

33
2000; Schimel et al., 2007). Borken and Matzner (2009) argue that the contradictory
results of these studies may depend on experimental and local conditions, such as the
intensity, frequency and duration of drying and wetting cycles. In the present study,
we observed an increase and decrease in most variables during the wetting and drying
phases, respectively. We did not perform a manipulative experiment (i.e., reduce or
increase precipitation). These changes were observed under natural conditions in the
two different ecosystems for both dry and wet seasons during the year and provide
strong support for the directional changes in these variables reported in Mediterranean
ecosystems.
The soil NO3- pools and resin-NO3- showed a trend opposite to that of MB-N
and DON, increasing during drying events and decreasing during wetting events.
Unsurprisingly, the soil NH4+ pools showed no detectable directional changes during
the wetting and drying events because the NH4+-N concentration was very low in both
ecosystems during the year. However, the resin-NH4+ showed an inverse tendency to
resin-NO3-, suggesting rapid nitrification during the dry season. The mineralization
process is known to be less affected by drought than by other microbial-driven soil
processes (Reynolds et al., 1999; Smolander et al., 2005). Schwinning and Sala (2004)
suggested that small pulses may occur during drying events due to the higher water
content in the soil during early morning hours, which can be sufficient to trigger
nitrification but not to trigger plant nutrient uptake (Gelfand and Yakir, 2008).
Inorganic N may also accumulate during drying events because ion diffusion is
severely restricted in thin water films in dry soils and because inorganic N sinks are
limited by reduced microbial growth and limited plant uptake (Barber, 1995; Stark and
Firestone, 1995). The length of the wetting or drying events also influenced the
response of some soil variables. In the pine forest, we detected a negative correlation
between changes in MB-N during a wetting event and their length, indicating the
short-lived nature of the microbial biomass pulses after rewetting (Landesman and
Dighton, 2011). This correlation was not found in the shrubland site, in which the only
correlation was the length of the previous drying event. This different pattern showed
that these changes in microbial biomass after rewetting in different ecosystems cannot
be explained by a single mechanism. We also found a positive correlation between the
changes in soil NO3- during wetting events and their length, which suggests that large
decreases in soil NO3- were produced at the beginning of the wetting event (by
leaching or by plant and microbial uptake) and that NO3- levels were later recovered by

34
soil nitrification. Unsurprisingly, the length of the drying event affected only to the
resin- NO3-, emphasizing the importance of diffusion in dry soils.
We expected to observe different patterns of change during the wetting and
drying events based on whether they occurred on wet or dry soils. However, our
observations of most of the analyzed variables revealed very similar responses to
wetting and drying events, suggesting that the initial soil water content and
temperature are not as determinant as abrupt changes in soil humidity for triggering a
microbial response to these events. These results do not support the inverse metabolic
activity hypothesis (Huxman et al., 2004), which predicts larger pulse responses
outside of the primary growing season (wet soil). However, we only studied the top 10
cm of the soil profile, and we would expect a reduced effect of wetting-drying cycles in
deeper soils. Because most fine roots are found in this horizon, we argue that these
results are relevant for soil biogeochemistry and plant nutrition.
Based on diffusion limitations, we expected to find clear differences between
inorganic N pools and resin-N availability. We focused on NO3--N because of the low
(or even undetectable) NH4+-N concentration in the soils. Both soil NO3- pools and
resin-NO3- showed increases during soil drying and decreases during soil wetting.
However, these changes in resin-NO3- were patent during both wet and dry soils.
Besides, the relative magnitude of the changes was greater for resin-NO3- than for NO3-
in all cases. Thus, the measurement of N availability, including diffusion rates,
provides more information than traditional soil N pool measurements in ecosystems
under frequent wetting-drying cycles and emphasizes the importance of soil diffusion
for nutrient availability during these cycles.
Conclusions
Soil variables showed a high intraseasonal variability and a clear pattern of
increase and decrease during the wetting and drying periods. This high variability was
not associated with the amount of labile C and N pools available for microbial
processes. Because we found that inorganic N forms have the highest variability, we
suggest that organic N forms are more buffered in the soils exposed to wetting-drying
cycles. A future with more intense and frequent cycles may produce greater losses of
inorganic N. Increases in the concentrations of N variables clearly occurred during
wetting events, independent of the time of the year or the ecosystem type, except for

35
soil NO3-, which showed the opposite trend. Soil N measurements taking in account
diffusion rates improve the understanding of the responses of N pools to wetting and
dry cycles. These trends may be sufficiently robust to extend to other Mediterranean
ecosystems because these results are based on an analysis of field observations without
experimental manipulation. Further research is necessary to determine how these
increases and decreases in N availability synchronize with plant demand and uptake.
Acknowledgments
This study was financed by the Ministerio Espanol de Ciencia e Innovación of
the Spanish government, grant CGL2010-21381. Lourdes Morillas was supported by a
graduate student fellowship from the Spanish government. We appreciate the help of
Javier Roales, Begoña Morillas and Juan Morillas during the field sampling. We thank
Javier Sevillano for his contribution of meteorological data for the study sites.


37
Capítulo 2
Unpredictable soil respiration responses to wetting and drying cycles in
Mediterranean ecosystems
Lourdes Morillas and Antonio Gallardo
A better knowledge of changes in soil respiration during natural wetting and
drying events in highly susceptible regions such as Mediterranean ecosystems is
essential, as expected climate changes lead to increased precipitation variability. We
analyzed soil respiration rates, mineral nitrogen, ion-exchange resin mineral nitrogen
and phosphate at weekly intervals over one year in two Mediterranean ecosystems: a
pine forest and a shrubland. Higher soil respiration rates were detected in the pine
forest than the shrubland. The pine forest showed an increased soil respiration rate
during the wetting events and a decreased rate during the drying events, while the soil
respiration of the shrubland did not show any relationship to wetting-drying cycles.
Soil and resin mineral nitrogen showed increased concentrations during the drying
events in both ecosystems, but we found no trend for the phosphate at any site. The
lack of a soil respiration response to water pulses at the shrubland was unexpected
because the nearby pine forest showed a well-defined pattern. The two ecosystems are
separated by few kilometres, yet their soil respiration responses to water pulses ranged
from predictable to unpredictable. Although we cannot identify the process underlying
these differences, our results suggested that phosphorous limitation may restrict the
soil respiration response to wetting-drying events.
Keywords: Soil moisture; Precipitation; Mineral nitrogen; phosphate; resin mineral-N;
Carbon mineralization.


39
Introduction
Climate models predict an intensification of the hydrologic cycle, which will
result in longer dry periods and more intense rainfall events (Huntington, 2006). These
climatic changes may have implications for biogeochemical processes including
changes in the long term of carbon (C) and nitrogen (N) pools in soils (Lindner et al.,
2010). Many laboratory studies evaluated the soil biochemical response to intermittent
water availability (Birch, 1964; Fierer and Schimel, 2002; Evans and Wallenstein, 2011),
but these results do not readily transfer to field conditions due to the combination of
different mechanisms (Borken and Matzner, 2009). The influence of plants (water and
nutrient uptake, root production, exudation), heterogeneous patterns of soil moisture,
soil aggregation, and different temperature regimes may affect C and N mineralization,
and fluxes may differ under field conditions compared to laboratory studies. Few field
studies assess the effects of wetting-drying cycles on soil biochemical response, and
most of these studies manipulated natural rainfall (Yahdjian et al., 2006). Borken and
Matzner (2009) highlighted the contradictory conclusions that these researches
reached, since some of them found increase, some others decrease, and some others no
change in C mineralization during drying and wetting relative to moist control or
moist condition before drying, most likely resulting from the application of different
experimental conditions. The results of these studies are inconsistent due to the wide
variety of processes involved in N and C cycling. Non-manipulative field experiments
would provide valuable information on this topic.
The changes in soil moisture and temperature are considered to be the main
drivers of mineralization processes in Mediterranean ecosystems (Noy-Meir, 1973).
Both C and N mineralization rates generally increase following the rewetting of dry
soil (Cui and Caldwell, 1997; Franzluebbers et al., 2000) since soil microbial activity is
no longer limited by water, but the source of this burst of C and N is still unclear. Few
studies have considered the effect of wetting-drying events on phosphorous (P) cycling
(Austin et al., 2004), although P might be highly limiting in terrestrial ecosystems as a
consequence of increased atmospheric N deposition (Elser et al., 2007). We evaluated
the effects of the continuous changes in soil respiration rates, mineral N, resin-mineral
N and PO43- during natural wetting-drying cycles in two Mediterranean ecosystems: a
pine forest and a shrubland. The relevance of water pulses on N cycle has been
previously proved in these study sites (Morillas et al., 2013). We conducted our study
with a non-manipulative field study to overcome the problems associated with

40
experimental techniques and other types of manipulations that provide inconsistent
results, most likely due to varying experimental designs, incubation temperatures, soil
properties and treatments. We conducted an intensive weekly sampling over a year to
capture the entire intra-seasonal variability in the studied variables and to identify
different wetting or drying events in each season. This survey allows exploration of
any emergent and common patterns in the C mineralization response to these wetting-
drying cycles, a topic scarcely studied in natural conditions.
Enhanced knowledge of the implications of wetting-drying events is crucial to
understand these effects on soil respiration rates and nutrient cycling in Mediterranean
environments. This valuable information will permit prediction of how these variables
respond to ongoing global environmental change. This study responds to the need for
more research in Mediterranean ecosystems and recognizes that current climate
models indicate these regions are highly susceptible to global change (Giorgi, 2006).
Our specific goals were (i) to study whether the response to wetting-induced
pulses on soil respiration rates produced a similar pattern in our two study
ecosystems, (ii) to identify the intraseasonal or interseasonal temporal variation in the
analyzed soil variables and determine the consistency of this temporal variability in the
two studied Mediterranean ecosystems, and (iii) to test whether the directional changes
in soil respiration and nutrient contents during wetting and drying events are
dependent on the soil water content or the temperature and length of the wet or dry
period.
Material and methods
Study area
This study was conducted in a pine forest and a shrubland ecosystem in
southwest Spain (37° 21’N; 5° 56’ W) with a typical Mediterranean-type climate. The
distance between these study sites is 14.5 km. In these Mediterranean sites 30-year
average rainfall and temperature was of 565.7 mm and 19.0 ◦C, respectively. The study
year was wetter than normal (852.6 mm in the pine forest and 845.7 mm in the
shrubland).The soils in these areas show a typical A(B)C profile. Table 1of chapter 1
presents the main properties of these soils. The pine forest contains the species Pinus
pinea L., with scarce annual herbs and forbs under their canopies. The shrubland is
dominated by Quercus coccifera L., Cistus albidus L., Genista hirsuta Vahl. and Arbutus
unedo L.

41
Field sampling
To explore the temporal dynamics of soil respiration and nutrient availability,
we conducted soil sampling at weekly intervals for one year, from October 2009 to
October 2010. Six soil samples from each study site were collected randomly from the
top 10 cm of the soil profile with a circular soil corer (5 cm diameter × 10 cm height).
Soil samples were transported in refrigerated plastic bags to the laboratory and stored
at 3 °C. Litter and stones were removed from soils prior to analysis and they were
processed as soon as possible (less than three days in all cases). On each sampling date,
the soil respiration rates were determined as the surface CO2 efflux utilizing a portable
soil respiration system (EGM-4 PP SYSTEMS) with a chamber of 10 cm ∅ and 15.5 cm
depth. The soil respiration and soil temperature were measured between 10:00 am and
11 am for each sampling date. On six randomly chosen spots these variables were
monitored in each sampling week by using a digital soil thermometer and a portable
chamber which were placed on a different location on each sampling date.
Laboratory analysis
The soil texture was estimated with the hydrometer method suggested by
Kroetsch and Wang (2008). The soil conductivity and pH were measured in 1:2.5 and
1:5 soil-water solutions, respectively. The soil organic matter was analyzed via the wet
oxidation techniques utilized by Skjemstad and Baldock (2006). The carbonate levels
were analyzed according to Boon Goh and Mermut (2007). The total soil N was
measured utilizing standard Kjeldahl procedures (Rutherford et al., 2007). The
dissolved organic nitrogen (DON) was analyzed following the Sollins et al. (1999)
methodology. The DON contents were calculated as total dissolved N minus mineral
N. The microbial biomass-N (MB-N) was determined with the fumigation-extraction
method proposed by Brookes et al. (1985). The MB-N concentration was estimated as
the difference between the total N in fumigated and unfumigated digested extracts
divided by a Kn (fraction of MB-N extracted after CHCl3 treatment) of 0.54 (Brookes et
al., 1985). All these variables were analysed for the general description of the two study
sites.
The following analyses were done for monitoring purposes. The gravimetric
soil moisture was calculated in fresh 5 g subsamples after drying at 80 ºC for 48 h until

42
constant weight. The water holding capacity (WHC, %) was determined for each soil
type as the gravimetric water content of soil that was saturated and allowed to drain
freely over 48 h in a filter funnel. To measure the mineral N, the soil subsamples were
extracted utilizing 0.5 M K2SO4 at a ratio of 1:5. Soil samples were shaken with the
extractant in an orbital shaker at 200 rpm for 1 h at 20ºC and filtered through a 0.45 µm
Millipore filter (Jones and Willett 2006). The filtered extract was kept at 2ºC until
colorimetric analyses, which were conducted within seven days following the
extraction. The NH4+-N concentration was directly estimated with the indophenol blue
method utilizing a microplate reader (Sims et al., 1995). The NO3--N was first reduced
to NH4+ with Devarda alloy, and its concentration was determined as described above.
The NO3--N concentration in the extracts was calculated as the difference between the
Devarda-incubated and unincubated samples. The mineral N is expressed as the sum
of NH4+ and NO3-.
The availability of NH4+-N, NO3--N and mineral N was measured in situ
utilizing ion-exchange membranes (resins; Subler et al., 1995). We selected this
technique because it generates minimal disturbances to soil surface communities and
allows intensive sampling over multiple time periods at the same spatial location. Six
anion and cation resins (types I-100 and I-200, Electropure Excellion, Laguna Hills,
California) were installed per site and week over the one year sampling period. These
resins were first subjected to expansion treatment by submersion in distilled water at
82–90°C for 48 h. Then, the resins were cut into 2.5 × 2.5 cm squares, attached to a
plastic rod with acrylic glue and inserted into the soil at a 0.5–3 cm depth. The resins
were incubated in the field for seven days during each sampling period. Following
collection, the resins were taken to the laboratory and dried at ambient temperature.
The resins were carefully separated from the plastic rod, brushed to remove soil
particles and placed into 125 ml flasks for extraction with 25 ml of 2 M KCl via orbital
spinning (1 h at 200 rpm). The extracts were analyzed to measure the NH4+-N and NO3-
-N utilizing the above method. To measure PO43--P, the soil subsamples were extracted
with 100 ml of 0.5 M NaHCO3 at a ratio of 1:20, and the concentration in the extract was
determined with the molybdenum blue colorimetric method (Allen et al., 1986).

43
Statistical and numerical analyses
During the study year, we identified eight major intervals of increasing soil
water content (wetting events) and eight periods of decreasing soil water content
(drying events) at each study site (Figure 1 a and b of chapter 1). We found these
intervals in all seasons and identified interval lengths ranging from 1 and 9 weeks. We
classified these intervals into dry or wet soil occurrences to calculate how further
wetting events on an already wet soil or a relatively dry soil might affect the dynamics
of the studied variables. A wetting interval was arbitrarily considered to occur within a
wet soil if the water content starting point (the driest point) was above 10% in the pine
forest or 5% in the shrubland. A drying interval was considered to occur within a dry
soil if the water content starting point (the wettest point) was below 15% in both sites.
The increases or decreases in soil variables were calculated as the difference between
the final and initial concentration in each wetting or drying interval. We calculated the
Spearman correlation between these changes in soil variables during wetting and
drying events and the mean soil temperature, mean soil water content, the length of
the wetting and drying event and the length of the previous wetting or drying event
before the next event. The daily precipitation values were obtained from the AEMET
weather station network in close proximity to the study sites.
To assess the effect of the study sites and soils on the analyzed soil variables, we
utilized a linear mixed model in which the study site was treated as a fixed effect and
the soil variables were treated as random effects. We utilized linear mixed models that
are particularly useful in settings (such as our sampling design) that require repeated
measurements. The effect of each independent variable on the model was analyzed
with a permutation test (1000 permutations of raw data). The linear mixed model and
permutation tests were conducted utilizing the libraries “nlme” and “pgirmess”,
respectively, in the R statistical package, version 2.15 (R Development Core Team
2012). The effects of the wetting and drying events on the changes in the analyzed
variables for each site were determined with a linear model and permutation tests as
described above. We adopted a significance level of p<0.05. We used coefficients of
variation (CV) as a metric for soil variability.

44
Results
Intraseasonal and annual variability
Higher soil respiration rates were detected in the pine forest compared to the
shrubland (Table 1), ranging between 0.12 and 0.76 g CO2 m-2 hour-1 for the first and
between 0.04 and 0.67 gCO2 m-2 hour-1 for the second. We detected significant
differences among seasons (Figure 2, Table 2), with a significant interaction between
site and season. Differences between seasons were found during a separate site
analyses (PShrubland=0.001, Ppine Forest<0.0001). The highest coefficients of variation (CV)
values for this variable were found in winter and autumn for the pine forest and the
shrubland, respectively (Table 3).
Figure 2. Soil respiration rates measured at weekly intervals during the study period in the pine forest and shrubland plant communities
Significantly higher values of mineral N were found in the pine forest
compared to the shrubland (Table 1 and 2), with a significant interaction between site
and season. Differences between the seasons were found during a separate site
analyses (PShrubland=0.009, Ppine Forest=0.009). The maximum and minimum mineral N
values were found in winter and spring for both study sites (Figure 3a). The highest
CV for this variable was found in summer and spring in the pine forest and the
shrubland, respectively (Table 3).

45
Figure 3. Mineral N (a), Resin Mineral N (b) and PO43- -P (c) measured at weekly intervals throughout the study year in the pine forest and shrubland plant communities.
We detected significant differences in the resin mineral N values among
seasons but not between sites (Table 1 and 2). The maximum and minimum resin
mineral N contents at both study sites were found in autumn and spring (Figure 3b).
We found a significant site by season interaction. Differences between seasons were
found during a separate site analyses (PShrubland<0.0001, Ppine Forest<0.0001). The highest
CV values for this variable were found in the summer at both study sites (Table 3).

46
Table 2. Permutation test performed on the linear mixed models evaluating the effect of Site and Season on soil respiration and soil nutrient variables during the whole year
P site P season P site x season
Respiration < 0.0001 < 0.0001 < 0.0001
Mineral N < 0.0001 0.012 0.015
Resin-Mineral N 0.068 < 0.0001 0.005
PO43--P < 0.0001 0.471 < 0.0001
The PO43- content was significantly higher in the pine forest (ranging between
0.33 and 7.00 mg kg-1 soil, mean of 2.37 mg kg-1 soil) than the shrubland (values
between 0.07 and 2.16 mg kg-1 soil, mean of 0.53 mg kg-1 soil, Table 1). We did not
observe significant differences between seasons, with the maximum and minimum
peaks in both study sites occurring in summer and autumn, respectively (Figure 3c).
However, the significant interaction that we have found during the statistical analyses
in each site indicates that the seasons influence the differences between sites (Table 2).
Differences between seasons were found during a separate site analyses for both study
sites (PShrubland=0.007, Ppine Forest=0.007). The highest CV values for this variable were
found in winter at both study sites (Table 3).
Table 3. Coefficients of variation for the soil respiration and soil nutrients variables at the two study sites during the different seasons
Pine Forest Shrubland
Variables Autumn Winter Spring Summer Annual Autumn Winter Spring Summer Annual
Respiration 0.48 0.60 0.51 0.54 0.59 0.70 0.62 0.56 0.46 0.62
Mineral N 0.84 0.94 0.92 1.25 1.17 1.26 1.41 2.23 1.36 1.74
Resin-Mineral N 0.42 0.62 0.66 0.97 0.77 0.40 0.46 0.67 0.92 0.77
PO43--P 0.59 0.79 0.67 0.58 0.69 0.91 1.09 1.06 0.65 0.92
Changes during wetting-drying events
The soil respiration in the pine forest increased during wetting events and
decreased during drying events, but we did not find any significant response to
wetting and drying events in the shrubland soils (Table 4a, b and c, Figure 4). The
inverse pattern of increases during the drying phases and decreases during the wetting

47
phases was found for mineral N and resin mineral N (Figure 5), although these
differences only were significant for the last variable. In the shrubland soils, the resin
mineral N differences between wetting and drying events were of a lower magnitude
yet still significant (Figure 4, Table 4). The pattern noted above can be observed during
separate analysis of the dry and wet soils (Table 4). However, some differences
emerged for soil resin mineral N, where the variations between the wetting and drying
events were only apparent for the wet soil at both sites. No trend was observed for the
PO43--P at any site.
Table 4. Probabilities that the differences of mean soil respiration and soil variables between wetting and drying events were found by random. Data were also analyzed separately for the wet and dry soils. For simplicity, P > 0.1 is arbitrary showed as non-significant (NS)
Pine Forest Shrubland
Variables Whole year Wet soil Dry soil Whole year Wet soil Dry soil
Respiration 0.001 0.063 0.006 NS 0.073 NS
Mineral N 0.080 NS 0.093 0.096 NS NS
Resin-Mineral N 0.005 0.009 NS 0.017 0.062 NS
PO43--P NS NS NS NS NS NS

48
Figure 4. Increments of Mineral N (a), Resin Mineral N (b) and PO43- -P (c) during eight wetting and drying events for each study site. Error bars are ±2SE. Asterisks indicate significant differences.
The changes in soil respiration during wetting and drying events did not show
any significant correlations with the mean soil temperature, the mean soil water
content, the length of the wetting and drying event and the length of the previous
wetting or drying event before the next event (Table 5).
Table 5. Spearman correlation matrix (rho) between changes in soil respiration during wetting and drying events, and the mean soil temperature, mean soil water content (SWC), the length of the wetting and drying event (LE) and the length of the previous wetting or drying event before the next event (LPE). None of the correlations were statistically significant (p< 0.05). N=8.
Pine forest Shrubland
Wet event Dry event Wet event Dry event
T -0.0714 0.0476 -0.0857 -0.0857
SWC -0.1905 0.0149 -0.3143 -0.3143
LE 0.1916 -0.6099 0.3928 0.3928
LPE -0.5225 0.2955 -0.2060 -0.2060

49
Figure 5. Increments of soil respiration rate during eight wetting and drying events in each study site. Error bars are ±2SE. Asterisks indicate significant differences.
Discussion
While we found a clear soil respiration response to wetting and drying pulses
in the pine forest, this response did not exist in the shrubland. We cannot easily explain
the reason for this difference. Although the two ecosystems present different soil
organic matter and soil texture (Table 1), these differences might not be large enough to
predict a completely different microbial response to wetting and drying events. We did
not intend to compare both ecosystems, since they are unreplicated, indeed, we chose
these two ecosystems to serve as site pseudoreplicates and expected to describe the
same pattern of soil respiration with modulation of local soil conditions. But the lack of
response to wetting and drying events in the grassland and the striking differences in
the inorganic P between the two sites may shed light on the mechanisms contributing
to this different site behavior. Recent studies have supported the idea that the response
to a drying-wetting event is triggered by soil wetting but regulated by resource
limitation (Jenerette and Chatterjee, 2012). The lack of a common pattern in response to
drying and wetting events in both sites is even more striking since the variability of
analyzed variables was similar in both ecosystems. The intra-seasonal variability at our
study sites was as high as the inter-seasonal variability in all analyzed variables,

50
suggesting that the magnitude of changes is more dependent on short-term events than
seasonal differences.
Soil respiration pulses are generally derived from the microbial consumption of
soil organic matter, which is highly responsive to precipitation pulses (Austin et al.,
2004). Several mechanisms may explain the soil respiration rate changes detected
during wetting-drying cycles. The decomposable organic substrates are derived
partially from the death of a portion of soil microorganisms and partially from the non-
living soil organic matter (Jenkinson, 1966). The portion of the microbial biomass that
dies under dry conditions (Bottner, 1985) is readily decomposed by the surviving
organisms when the soil is rewetted. The rapid changes in soil water potential
associated with rewetting may cause microbes to undergo osmotic shock, including
microbial cell lysis (Van Gestel et al., 1993) or release of intracellular solutes (Halverson
et al., 2000). The drying and rewetting process makes the non-living soil organic matter
available for decomposition by the physical disruption of the soil structure, the
substrate desorption from surfaces (Adu and Oades, 1978), and by the increased
microbial mobility and diffusion of soluble organic compounds (Lund and Gokssyr,
1980). On the other hand, wetting events of a dry soil also produces a CO2 burst in the
short term, due to the physical displacement of air present in the soil pores.
However, none of these mechanisms help us to understand the lack of
relationship between the soil respiration and wetting-drying events at the shrubland
site. Its lower amount of soil organic matter may explain a lower response as outlined
above, but this potential explanation fails to account for the absence of response. Other
studies indicate no systematic difference in C mineralization after wetting-drying
events (Borken and Matzner, 2009). Approximately 50% of these studies revealed an
increase in soil respiration following wetting-drying events, whereas the other studies
showed either no change or a decrease in soil respiration relative to a moist control soil
(van Veen et al., 1985; Degens and Sparling, 1995; Fierer and Schimel, 2002, 2003).
However, our study is not directly comparable with the above research because we did
not compare soils under wetting-drying cycles with soils under constant moisture. Our
novel approach aimed to identify differences between wetting and drying phases in
natural conditions throughout one year.
Besides, it is important to consider the role of plant root respiration, which
makes a large contribution to soil respiration (Schwinning et al., 2002). We should take
into account that measured variable is an integrated measure of heterotrophic and

51
autotrophic respiration (Hanson et al., 2000). Autotrophic respiration could be masking
any pattern related to heterotrophic respiration. In fact, soil respiration is relatively
high in dry months of the year in the shrubland, and it could be due to higher
autotrophic respiration in this ecosystem. It is interesting to note that in the shrubland
respiration rates were much lower in autumn and winter compared to the pine forest,
while in spring and summer respiration rates were higher in the shrubland. We
attribute this fact to site differences in soil water availability, productivity and plant
community phenology (Carbone et al., 2008). Plant (as well as microbial) uptake will
influence mineral N content and the uptake will in turn depend on soil moisture. In the
short-term, the activity of soil microbial biomass may be less sensitive to low soil water
content than is water uptake by plants (Singh et al., 1989), and small rain events might
be of insufficient magnitude to produce a plant response, nevertheless it may generate
a rapid rise in activity of soil microbes (Schwinning and Sala, 2004). Thus, soil
microorganism may become active in moments when plant roots are not, diminishing
competition for mineral N and raising the immobilization in microbial biomass (Bolton
et al., 1993).
Soil organic matter availability to microorganisms is related to its position
within the soil matrix (Elliot and Coleman, 1986). Taking into account the higher clay
plus silt content of the pine forest soil compared to that of the shrubland, we would
expect a higher degree of soil aggregation, and therefore a higher proportion of the
organic carbon chemically protected and thus unavailable to microorganisms
decomposition. However, the higher labile organic C content (phenols, hexoses and
aromatic compounds) found in the pine forest than in the shrubland suggested higher
C availability in the pine forest site. On the other hand, we have found a declining
linear response of CO2 soil effluxes to increases in soil moisture in the shrubland
community during winter, when WHC was above 80%. The high bulk density shown
by the soil shrubland may cause anaerobic conditions, stopping of gas diffusion. Thus,
differences between soil textures may help to explain this distinct behavior of soil
respiration across ecosystems. Although the soil organic matter and soil texture may
somehow affect the lack of a soil respiration response to wetting-drying cycles in the
shrubland, the low PO43- values found in this soil (Table 1) may limit the response of
soil microbial activity to water pulses. The seasonality of soil PO43- may offer additional
clues. During the growing season, we observed an increase of the soil PO43- coupled
with a soil respiration rise, which suggests that these two variables are dependent.

52
Thus, the soil microbial activity may be limited by the shrubland PO43- availability,
which minimizes the triggered effect of water pulses. However, our descriptive
experimental approach cannot demonstrate that the PO43- availability governs soil
respiration.
Other mechanisms may explain the strikingly different soil respiration
responses to the wetting and drying events in both ecosystems. For example, the
differing soil hydrophobicity is largely dependent on the amount and quality of the
organic matter (Franco et al., 2000), and different microbial communities have different
resilience to water stress (Landesman and Dighton, 2010). We explored the additional
possibility that soil respiration relates to the mean soil temperature, mean soil water
content, length of the wetting and drying event and length of the previous wetting or
drying event before the next event, but we failed to find an effect in either ecosystem.
The effect of wetting and drying events on soil respiration seems to be
ecosystem-specific, although we cannot clearly identify the ecosystem process
underlying these differences. Our initial goal was to obtain a “mean response” to
wetting and drying events in two ecosystems under the same climate and similar soil
characteristics. Instead, we demonstrated that two ecosystems located in the same
climatic regime and separated by a few kilometres can present both predictable and
unpredictable responses to water pulses. More research is needed to understand the
effect of wetting-drying cycles on soil respiration in a changing world where these
episodes are predicted to intensify.
Acknowledgments
This study was financed by the Ministerio Espanol de Ciencia e Innovación of
the Spanish government, grant CGL2010-21381. Lourdes Morillas was supported by a
graduate student fellowship from the Spanish government.We appreciate the help of
Javier Roales, Begoña Morillas and Juan Morillas during the field sampling.

53
Capítulo 3
Temporal pattern of microbial functional diversity in two Mediterranean
ecosystems
Lourdes Morillas and Antonio Gallardo
Under Revision in The Scientific World Journal
Soil microbial communities drive crucial ecosystem processes, and the way
they respond to changes in seasonal climatic conditions can be a critical factor for
predicting shifts in ecosystem processes. We assessed the seasonal response of soil
microbial substrate induced respiration (SIR) to different amino acids, carbohydrates
and carboxylic acids by using MicroResp technique; following this method we have
also calculated the Shannon Index diversity of microbial consumption of C sources. We
also measured in situ soil hexoses, aromatic compounds and phenols as a proxy of soil
C availability. Soils of two Mediterranean ecosystems located in southwest Spain: a
pine forest and a shrubland community were sampled at weekly intervals for soil C
variables and 10 times along all seasons for SIR measurements during one year. Both
plant communities showed clear differences in carbon source preferences, with higher
respiration rates in the pine forest than in the shrubland. Soil hexoses, aromatic
compounds and phenols showed a clear seasonality in both ecosystems, with
minimum during the wet period and maximum during the dry season. Our results
showed that the soil labile C concentration was a poor predictor of microbial response
to different C sources addition in our two sites. We have also found that the seasonal
changes on soil microbial response to different C sources addition produce a different
pattern in our two ecosystems, most likely due to the contrasting fertility. Lastly, we
conclude that the microbial consumption of the studied C sources may be partially
determined by their physico-chemical properties.
Keywords: Soil moisture; Hexoses; Aromatic compounds; Phenols; MicroResp;
Carbon source consumption.


55
Introduction
Seasonal precipitation pattern is a key limiting factor regulating primary
productivity, soil microbial activity, and soil biochemical dynamics in Mediterranean
ecosystems (Bell et al., 2008). As decomposers, soil microbial communities mediate
critical ecosystem processes and the activity of these microbial communities is
primarily regulated by moisture availability (Fierer et al, 2003). The soils of
Mediterranean ecosystems are particularly susceptible to seasonal dynamics due to the
infrequency of rainfall events and the often warm and dry climate that favors rapid soil
drying (Fierer and Schimel, 2002). Thus, soil water content may play a critical role for
the soil biological responses in Mediterranean ecosystems (Jarvis et al., 2007). Soil
moisture can also strongly affect carbon transformations (Fierer and Schimel, 2002)
throughout soil aeration creating anaerobic and aerobic conditions that promote a
diversity of microorganisms (Fierer et al., 2003) and nutrient cycling through microbial
activity (Austin et al., 2004). Previous researches established that soil temperature and
water content affect decomposition rates of soil organic carbon (Hogg et al., 1992;
Howard and Howard, 1993; Fierer and Schimel, 2002), and could also affect the
quantity as well as the chemical characteristics of dissolved organic carbon (Lundquist
et al., 1999a; Chow et al., 2003; Blodau et al., 2004). Hexoses, phenols and aromatic
compounds are part of soil carbon pool. Aromatic compounds are positively correlated
to the amount of XAD-8 adsorbable dissolved organic C (DOC) (Dilling and Kaiser,
2002; Kalbitz et al., 2003), therefore we measured aromatic compounds as surrogate of
DOC. Phenols mainly derive from decomposition of polyphenolic plant metabolites,
such as tannins and lignine (Guggenberger and Kaiser, 2003). Soil hexoses are labile
energy sources to soil microbes. Labile organic carbon is a precursor of microbial
growth and activity, thus driving decomposition processes in the soil (Boyer and
Groffman, 1996). Soil labile organic carbon have been proposed as an indicator of the
carbon availability to soil microorganisms (DeLuca and Keeney, 1993), so hexoses,
phenols and aromatic compounds contents in soil may be related to microbial response
to different C sources addition.
Fluctuations in soil water content are expected to be even greater in the future
due to more frequent extreme weather events resulting from climate change (Bernstein,
2007; IPCC, 2007). Soil biogeochemical responses to moisture pulses driven by dynamic
precipitation patterns are especially complex and difficult to predict (Collins et al.,
2008). Under these conditions, the role of seasons regulating ecosystem function may

56
become critical (Knapp et al., 2002), since seasonal changes may modify soil microbial
community functionality that could alter rates of nutrient cycling and soil biological
responses. More detailed descriptions of the microbial seasonal dynamics could
improve predictions for how microbially-mediated processes will respond to global
changes (Treseder et al., 2012).
Since soil microbes are key drivers of biogeochemical cycles, the way they
respond to seasonal precipitation changes can be a critical factor for predicting shifts in
ecosystem processes. Sudden changes in soil water content are stressful to
microorganism because they must expend energy to regulate osmotic pressure
(Bottner, 1985; Van Gestel et al., 1993). These physiological adaptations to soil water
content require a great investment of resources (Schimel et al., 2007), thus, the
capability of soil microbes to perform these processes may be limited by the soil
nutritional status. For this reason, we expect that soil with distinct fertilities lead soil
microbes to respond in different ways to changes in soil water content. One means of
assessing the heterotrophic function of a soil microbial community is to measure the
ability of the active microbial community to utilize a range of organic carbon sources.
We have analyzed our samples using MicroResp method, which has been reported to
have greater sensitivity in resolving soil differences compared to Biolog (Chapman et
al., 2007) or the Degens and Harris method (Lalor et al., 2007). The carbon sources
utilized have different characteristics that affect to microbial degradation due to their
distinct molecular weight, solubility, oxidation state and heat of combustion. We
hypothesized these physico-chemical properties of the different C source, being all
other conditions equal, should determine the preferences of soil microorganism for the
C sources.
We studied two Mediterranean ecosystems: a pine forest with a higher level of
organic matter content and nutrients, and a shrubland with lower C and nutrient
availability. Few studies have explored the soil hexoses, aromatic compounds and
phenols levels throughout the year, even less is known about how the seasonal changes
in these soil variables affect to microbial response to different C sources addition in
Mediterranean ecosystems. On the other hand, the biochemical reasons of the different
microbial consumption of different carbon sources have been scarcely analyzed. This
represents a significant gap in understanding the role of these carbon substrates of
great ecological importance on soil microbial consumption and diversity. An improved
57
knowledge of how seasonal changes affect these soil variables is of critical importance
as these shifts could alter carbon substrate consumed by microbial biomass.
The objectives of this research were (i) to assess whether the seasonal changes
on soil microbial response to different C sources addition produce a similar pattern in
two contrasting ecosystems, (ii) to determine whether hexoses, phenols and aromatic
compounds contents in soil are related to microbial response to different C sources
addition throughout the year, (iii) to evaluate the importance of physico-chemical
properties of the studied C sources for the microbial consumption.
Material and methods
Study area
This research was carried out in a pine forest and a shrubland community
ecosystem located in southwest Spain (37° 21’N; 5° 56’ W) with a Mediterranean-type
climate. The Mediterranean climate has a 30-year average rainfall and temperature of
565.7 mm and 19.0°C, respectively. The study year was wetter than normal (852.6 mm
in the pine forest and 845.7 mm in the shrubland). The soils in these areas show a
typical A (B) C profile. Table 1 of chapter 1 presents the main properties of these soils.
The pine forest is comprised of the species Pinus pinea L., with scarce annual herbs
under their canopies. The shrubland is dominated by Quercus coccifera L., Cistus albidus
L., Genista hirsuta Vahl. and Arbutus unedo L. The pine forest is seasonally subjected to
fewer rapid changes in the soil water content than the shrubland soil due to a thicker
litter layer and canopy shading.
Field sampling
We conducted soil sampling at weekly intervals for one year, from October 2009
to October 2010. Six soil samples from each study site were collected randomly from
the top 10 cm of the soil profile with a circular soil corer (5 cm diameter × 10 cm
height). The soil samples were transported in polyethylene bags to the laboratory,
sieved (2 mm mesh) and separated into two fractions. One fraction was immediately
frozen for microbial analysis, the other was stored at 3 °C in refrigerators and
processed as soon as possible (less than three days in all cases) for biogeochemical

58
analyses. This procedure ensured that the soil microbial populations did not
experience relevant changes (Gonzalez-Quiñones et al., 2009). Two sampling of each
season were selected randomly for microbial analysis. On each sampling date, the soil
respiration rates were determined as the surface CO2 efflux utilizing a portable soil
respiration system (EGM-4 PP SYSTEMS) with a chamber of 10 cm ∅ and 15.5 cm
depth. The soil respiration and soil temperature were measured at approximately 10:00
am on each sampling day. The daily precipitation values were obtained from the
AEMET weather station network in close proximity to the study sites.
Laboratory analysis
The gravimetric soil moisture was calculated in fresh 5 g subsamples after
drying in an 80 ºC oven for 48 h. The water holding capacity (WHC, %) was
determined for each soil type as the gravimetric water content of soil that was
saturated and allowed to drain freely over 48 h in a filter funnel. The soil texture was
estimated with the hydrometer method suggested by Kroetsch and Wang (2008). The
soil conductivity and pH were measured in 1:2.5 and 1:5 soil-water solutions,
respectively. The soil organic matter was analyzed via the wet oxidation techniques
utilized by Skjemstad and Baldock (2006). The carbonate levels were analyzed
according to Boon Goh and Mermut (2007). The soil PO43--P content was extracted with
100 ml of 0.5 M NaHCO3 at a ratio of 1:20, and the concentration in the extract was
determined with the molybdenum blue colorimetric method (Allen et al., 1986). The
total soil N was measured utilizing standard Kjeldahl procedures (Rutherford et al.,
2007). The NH4+-N concentration was estimated directly via the indophenol blue
method using a microplate reader (Sims et al., 1995). The NO3--N was first reduced to
NH4+-N with Devarda alloy, and the concentration was determined as the difference
between the Devarda-incubated and unincubated samples. The DON in the extracts
was first oxidized to NO3--N with potassium persulfate (K2S2O8) in an autoclave at 121
ºC for 55 min and then reduced to NH4+-N with Devarda alloy (Sollins et al., 1999). The
DON contents were calculated as total dissolved N minus inorganic N. MB-N was
determined using the fumigation-extraction method proposed by Brookes et al., (1985).
The total N content in the digested extracts was determined by colorimetry
(indophenol blue method) with a microplate reader (Sims et al., 1995). The MB-N
concentration was estimated as the difference between the total N in fumigated and

59
unfumigated digested extracts divided by a Kn (fraction of MB-N extracted after CHCl3
treatment) of 0.54 (Brookes et al., 1985).
The availability of NH4+-N and NO3--N was measured in situ utilizing ion-
exchange membranes (resins, Subler et al., 1995). Six anion and cation resins (types I-
100 and I-200, Electropure Excellion, Laguna Hills, California) were installed per site
and week over the one year sampling period. The resins were incubated in the field for
seven days during each sampling period. Following collection, the resins were
extracted with 25 ml of 2 M KCl via orbital spinning. The extracts were analyzed to
measure the NH4+-N and NO3--N utilizing the above method. All these variables were
analysed for the general description of the two study sites.
The following analyses were done for monitoring purposes. To measure
hexoses, aromatic compounds and phenols, the soil subsamples were extracted with
0.5 M K2SO4 at a ratio of 1:5, followed by shaking for 1 h at 200 rpm at 20ºC. The extract
was filtered through a 0.45 µm Millipore filter. All concentration were estimated
following (Chantigny and Angers, 2008) using a microplate reader.
We analyzed soil heterotrophic microbial communities with the MicroResp
system (Campbell et al., 2003). This method tests 15 carbon sources that vary in
structural complexity (Oren and Steinberger, 2008). Carbon sources were selected
depending on their ecological importance to soil and their solubility in water. In
particular rhizospheric C substrates were chosen taking into account the relevance of
root inputs for microbial metabolism. We utilized amino acids (L-alanine, L-lysine,
arginine, L-cysteine and N-acetyl-glucosamine [NAGA]), carbohydrates (D-fructose, D-
galactose, D-glucose, L-arabinose and D-trehalose) and carboxylic acids (citric acid, L-
malic acid, oxalic acid, oxoglutaric acid and amino butyric acid [GABA]). In functional
terms, the substrate utilization rates of the carbon sources correspond to the catabolic
attributes of different soil microbial functional groups (Zak et al., 1994). Even if we
cannot evaluate microbial communities in relation to taxonomic or phylogenetic
diversity (Øvreås, 2000), we still can use MicroResp results to explain functional
diversity shifts. Before performing the MicroResp method, defrosted soils were
introduced into the flasks and pre-incubated for five days at 25 ºC. The moisture within
the flaks was corrected to 40% WHC in order to condition the soils and reestablish
active microbial populations. Although potential changes in microbial communities
may have occurred due to freeze-thaw cycles, samples are still comparable because all
the soils had the same treatments. To avoid changes in soil moisture content during
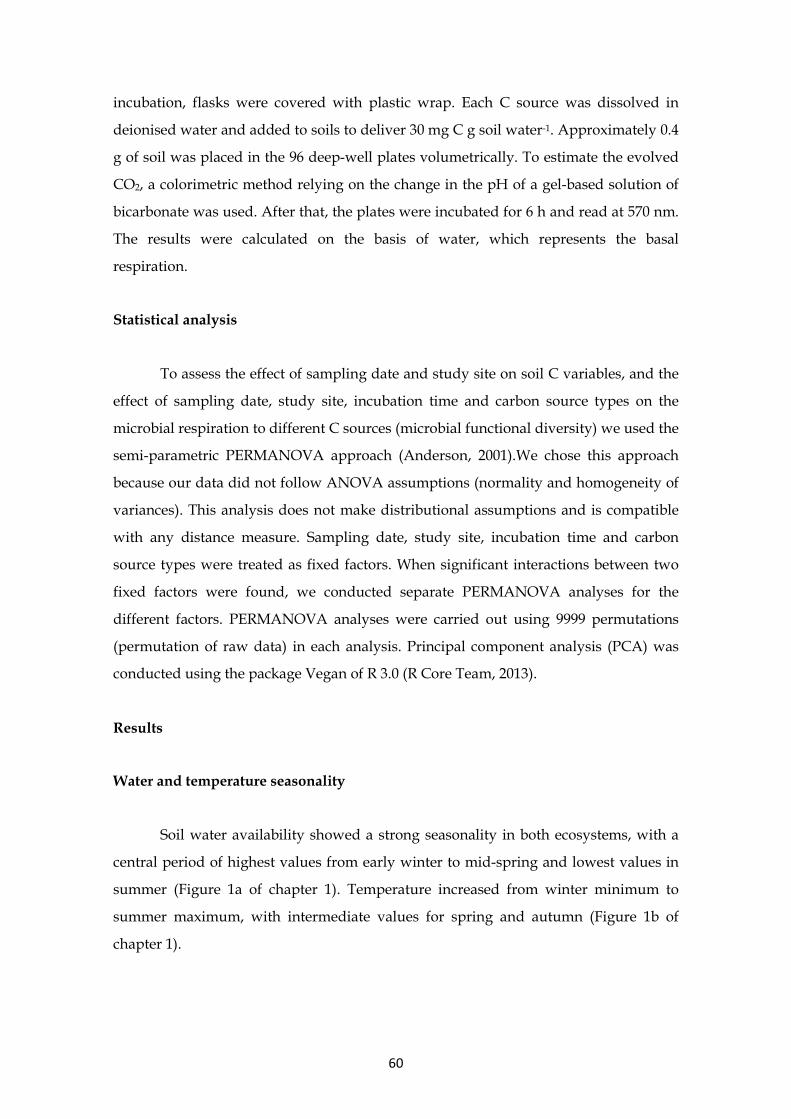
60
incubation, flasks were covered with plastic wrap. Each C source was dissolved in
deionised water and added to soils to deliver 30 mg C g soil water-1. Approximately 0.4
g of soil was placed in the 96 deep-well plates volumetrically. To estimate the evolved
CO2, a colorimetric method relying on the change in the pH of a gel-based solution of
bicarbonate was used. After that, the plates were incubated for 6 h and read at 570 nm.
The results were calculated on the basis of water, which represents the basal
respiration.
Statistical analysis
To assess the effect of sampling date and study site on soil C variables, and the
effect of sampling date, study site, incubation time and carbon source types on the
microbial respiration to different C sources (microbial functional diversity) we used the
semi-parametric PERMANOVA approach (Anderson, 2001).We chose this approach
because our data did not follow ANOVA assumptions (normality and homogeneity of
variances). This analysis does not make distributional assumptions and is compatible
with any distance measure. Sampling date, study site, incubation time and carbon
source types were treated as fixed factors. When significant interactions between two
fixed factors were found, we conducted separate PERMANOVA analyses for the
different factors. PERMANOVA analyses were carried out using 9999 permutations
(permutation of raw data) in each analysis. Principal component analysis (PCA) was
conducted using the package Vegan of R 3.0 (R Core Team, 2013).
Results
Water and temperature seasonality
Soil water availability showed a strong seasonality in both ecosystems, with a
central period of highest values from early winter to mid-spring and lowest values in
summer (Figure 1a of chapter 1). Temperature increased from winter minimum to
summer maximum, with intermediate values for spring and autumn (Figure 1b of
chapter 1).

61
Seasonal changes in soil sources of labile carbon
Soil hexoses, aromatic compounds and phenols showed a clear seasonality in
both ecosystems, with minimum during the wet period and maximum during the dry
season (Figure 2a, 2b and 2c). We found significantly higher values in the pine forest
compared to the shrubland for all these variables (Table 2). We also detected significant
differences among sampling dates and significant interactions between site and
sampling date. Differences among the sampling date were found during a separate site
analyses for soil hexoses, aromatic compounds and phenols (Table 2).
Table 2. PERMANOVA analyses evaluating the effect of the study sites and sampling dates on the soil concentration of hexoses, aromatic compounds (AC) and phenols. Individual analysis for each study site is also shown.
Hexoses AC Phenols
df Pseudo-F P Pseudo-F P Pseudo-F P
Site 1 264.5 <0.0001 189.7 <0.0001 14.7 <0.0001
Sampling date 3 15.9 <0.0001 14.6 <0.0001 22.8 <0.0001
Site x Date 3 12.1 <0.0001 12.5 <0.0001 15.5 <0.0001
Pine forest 3 14.9 <0.0001 16.1 <0.0001 22.8 <0.0001
Shrubland 3 3.4 0.026 3.7 0.021 4.2 0.008

62
Figure 2. Hexoses (a), aromatic compounds (AC, b) and phenols (c) concentrations in the top 10 cm of soil profile measured at weekly intervals along the study period at the pine forest and shrubland plant community.
Seasonal changes in carbon microbial consumption
In the pine forest, microbial consumption of amino acids and carbohydrates
showed maximum values in summer, with the lowest values in autumn and winter
(Figure 3a and 3b). The increase in microbial responses to carboxylic acids from winter
to summer was less pronounced than amino acids and carbohydrates, with a 6-h
response peak in autumn (Figure 3c). In the shrubland, a different pattern emerged,
with maximum in autumn for amino acids, carbohydrates and carboxylic acids and no
clear trend afterwards. In both ecosystems the 6-h and 24-h responses to carbon
sources showed parallel lines, with significantly lower rates and less marked seasonal
differences for the 24-h responses for all the carbon sources types (Figure 3). We also

63
found significant differences among sampling dates for all carbon sources types and
sites (Table 3). Interactions between incubation time and sampling dates were found
for all these variables, excepting amino acids and carboxylic acids consumption in the
pine forest and shrubland respectively (Table 3). Differences among sampling dates for
all carbon sources types were found during a separate analysis for each incubation
time (Table 3). We also found a greater SIR response to amino acids, carbohydrates and
carboxylic acids in the pine forest than in the shrubland site (df=1, Pseudo-F=29.8, 89.1
and 69.4, respectively, P<0.0001 for all the cases).
Table 3. PERMANOVA analyses evaluating the effect of incubation times and sampling dates on the mean SIR response to three types of low molecular weight carbon sources (amino acids, carbohydrates and carboxylic acids). Separate analyses for the two incubation times are also showed.
Pine forest Shrubland
df Pseudo-F P Pseudo-F P
Amino acids
Incubation time 1 85.2 <0.0001 65.9 <0.0001
Sampling date 9 37.7 <0.0001 14.3 <0.0001
Incubation time x Date 9 1.8 0.058 5.5 <0.0001
6-h response 9 14.2 <0.0001 11.5 <0.0001
24-h response 9 53.1 <0.0001 6.3 <0.0001
Carbohydrates
Incubation time 1 489.7 <0.0001 540.1 <0.0001
Sampling date 9 58.4 <0.0001 24.4 <0.0001
Incubation time x Date 9 5.7 <0.0001 8.1 <0.0001
6-h response 9 28.1 <0.0001 19.1 <0.0001
24-h response 9 53.7 <0.0001 28.4 <0.0001
Carboxylic acids
Incubation time 1 781.9 <0.0001 339.5 <0.0001
Sampling date 9 18.2 <0.0001 4.1 <0.0001
Incubation time x Date 9 3.1 0.002 1.5 0.152
6-h response 9 9.2 <0.0001 2.5 0.007
24-h response 9 27.6 <0.0001 6.4 <0.0001

64
Figure 3. SIR due to amino acid (a), carbohydrates (b) and carboxylic acid (c) microbial consumption at 6 and 24 hours response at the pine forest and shrubland plant community soils through the different sampling dates.
Carbon source preferences
Amino acids were the most reduced C sources, showing the highest heat of
combustion per gram of substance or per gram of C, while carboxylic acids were the
most oxidized compounds (Table 4). Carboxylic acids were the carbon sources that
showed the highest 6-h response as compared with carbohydrates and amino acids, the
latest showing the minimum values in both ecosystems (Figure 3a, 3b and 3c). Both
plant communities were clearly different, with higher respiration rates and C sources

65
preferences in the pine forest than in the shrubland (Figure 3, Table 3), being the
responses to C sources much more plastic in the pine forest than in the shrubland
(Figure 4).
Table 4. Physico-chemical properties of the C sources added to the soils. Heat of combustion data were taken from Kienzle et al., (2002) and Domalsky (1972).
C source Formula MW C:O
Heat of
combustion Hc:MW Hc:C
Solubility
(25ºC)
(Hc; kcal mol-1) (g/L)
Amino acids
Alanine C3H7NO2 89.09 1.5 -386.7 -4.3 -128.9 166.5
Arginine C6H14N4O2 174.2 3 -893.9 -5.1 -149.0 148.7
Aminobutyric acid C4H9NO2 103.12 2 -545.5 -5.3 -136.4 1300
Cysteine C3H7NO2S 121.16 1.5 -540.5 -4.5 -180.2 280
Lisine C6H14N2O2 146.19 3 -880.3 -6.0 -146.7 1500
Carboxylic acids
Citric acid C6H8O7 192.12 0.86 -468.6 -2.4 -78.1 730
Malic acid C4H6O5 134.09 0.80 -317.4 -2.4 -79.3 558
Oxalic acid C2H2O4 90.03 0.50 -58.7 -0.7 -29.4 143
Oxoglutaric acid C5H6O5 146.11 1.00 -429.9 -2.9 -86.0 100
Carbohydrates
Arabinose C5H10O5 150.13 1.00 -559.0 -3.7 -111.8 1000
N-Acetilglucosamine C8H15NO6 221.21 1.33 -973.3 -4.4 -121.7 50
Fructose C6H12O6 180.16 1.00 -672.0 -3.7 -112.0 3750
Galactose C6H12O6 180.16 1.00 -670.1 -3.7 -111.7 683
Glucose C6H12O6 180.16 1.00 -671.4 -3.7 -111.9 910
Tetrahalose C12H26O13 342.30 0.92 -1348.8 -3.9 -112.4 689

66
Figure 4. Principal-component analyses of carbon microbial consumption data of both studied soils.
We found differences among sampling dates and amino acids, carbohydrates
and carboxylic acids types in both ecosystems (Table 5). In the pine forest, malic acid
and oxoglutaric acid showed the highest respiration rates, while citric acid and oxalic
acid showed the minimum (Figure 5a). However in the shrubland, oxoglutaric acid
was the highest consumed C source, with lowest values for the other three carboxylic
acids (Figure 5b). Glucose and fructose were the most consumed labile carbohydrates
in the pine forest (Figure 6a), but no differences were found in the shrubland (Figure
6b). Among the amino acids C sources, the arginine was the less consumed in both
ecosystems, with no significant differences between the other amino acids (Figure 7a
and 7b).

67
Table 5. (a) PERMANOVA analyses evaluating the effect of sampling dates on the mean SIR response to the different amino acids, carbohydrates and carboxylic acids. (b) PERMANOVA analyses evaluating the effect of incubation times and sampling dates on the Shannon index of diversity of SIR response to the different low molecular weight carbon sources. Separate analyses for the two incubation times are also shown.
a
Pine forest Shrubland
df Pseudo-F P Pseudo-F P
Aminoacids
Sampling date 9 39.7 <0.0001 12.8 <0.0001
Amino Acid type 4 36.8 <0.0001 11.7 <0.0001
Date x Amino Acid type 36 0.6 0.968 0.6 0.969
Carbohydrates
Sampling date 9 34.6 <0.0001 12.9 <0.0001
Carbohydrates type 5 12.7 <0.0001 3.2 0.012
Date x Carbohydrates type 45 0.3 0.999 0.5 0.998
Carboxylic acids
Date 9 6.6 <0.0001 2.9 0.005
Carboxylic acids type 3 6.2 <0.0001 38.7 <0.0001
Date x Carboxylic acids type 27 0.2 0.999 0.5 0.986
b
Pine forest Shrubland
df Pseudo-F P Pseudo-F P
Shannon Index
Incubation time 1 335.7 <0.0001 111.4 0.002
Sampling date 9 12.6 <0.0001 3.3 <0.0001
Incubation time x Date 9 7.9 <0.0001 2.6 0.006
6-h response 9 11.4 <0.0001 2.9 0.007
24-h response 9 2.3 0.033 1.9 0.074

68
Microbial functional diversity
Microbial functional diversity tended to increase from minimum winter values
to the highest summer values in both ecosystems for the 6-h responses (Figure 8a and
8b). However, whereas in the pine forest the maximum values were found in summer,
in the shrubland soil, these maximum were found in the autumn. We found significant
differences among sampling dates and incubation times for both ecosystems. No
significant differences were found in a separate analysis between sampling dates of the
24-h responses to C sources in the shrubland ecosystem (Table 5).
Figure 5. SIR due to microbial consumption of different carboxylic acids at the pine forest (a) and shrubland plant community (b) soils through the different sampling dates.

69
Figure 6. SIR due to microbial consumption of different carbohydrates at the pine forest (a) and shrubland plant community (b) soils through the different sampling dates.

70
Figure 7. SIR due to microbial consumption of different amino acids at the pine forest (a) and shrubland plant community (b) soils through different sampling dates.

71
Figure 8. Shannon diversity index at 6 and 24 hours response at the pine forest (a) and shrubland plant community (b) soils through the different sampling dates.
Discussion
Soil labile C concentration is the result of the balance between inputs such as
litter and root decomposition or root exudates and outputs such as microbial
consumption and soil leaching (Cheshire, 1979, Strobel, 2001). Thus, the seasonal
pattern of soil labile C that we can see in the pine forest is likely reflecting the fast
consumption by soil microbes and/or rapid leaching from soil during winter, and the
higher litter inputs mediated by plants in spring and summer. The less clear pattern in
the shrubland might be due to the lower primary production and labile C
concentration in this soil, however soil solution concentration is also buffered by
sorption to the solid phase, which is soil specific and may help to explain the
differences found between the two ecosystems (Jones et al. 2003). Because it has been
proposed that the capacity of a microbial community to mineralize specific organic C

72
substrates likely reflects differences in the type, abundance and bioavailability of C
substrates present in the in situ organic matter pool (Hamer and Marschner, 2005;
Orwin et al., 2006; Banning et al., 2012), we expected that this seasonal pattern
observed in the soil labile C was also reflected in changes in the respiration rates
induced by the addition of labile C sources. However, although some common patterns
were observed, such as the summer maximum in the pine forest, and the winter and
spring minimum in the shrubland, we can conclude that the soil labile C concentration
is a poor predictor of microbial response to different C sources addition in our two
sites.
The Microresp method, such as another SIR method, is based in the rapid
response of the soil microbial community to different C sources, with the essential
premise that no changes in the original microbial community are induced by the
method (Pennaten et al., 2004; Lagomarsino et al. 2007). Short incubations are therefore
preferred, and although we found the same temporal pattern in the 6-h and 24-h
incubations, differences between sampling dates and between the different C sources
tended to decreases in the 24-h incubation, suggesting a late consume of non-preferred
C sources, and explaining the observed increase in microbial functional diversity in the
24-h incubations for all sampling dates and sites.
A higher soil respiration of soil microbial communities in response to carboxylic
acids addition than to carbohydrates or amino acids have been found for several
authors (Bell et al., 2009, García-Palacios et al., 2011, Banning et al., 2012 ), but the
reasoning of this differential response has not been clearly elucidated. Indeed,
carboxylic acids are more oxidized compounds, yielding lower heat of combustion
than amino acids or carbohydrates. However van Hees et al. (2005) calculated that 60-
90% of organic acid substrate C evolved as CO2 in the short term, as opposed to
carbohydrates (20-60%) and amino acids (10-30%). We propose that carboxylic acids
are preferred C sources over carbohydrates and amino acids because these simple
organic acids are not directly involved in synthesis of more complex compounds inside
the cell. Thus, the low response of SIR to amino acids found in this study and others
(García-Palacios et al., 2011) does not mean a lower consumption by soil microbes, but
only that amino acids or carbohydrates are not preferentially used as a primary source
of energy as compared with carboxylic acids. Accordingly, van Hees et al. (2005)
explained the highest respiration percentages for labile organic acids based on the large
ATP requirement for uptake into cells and synthesis of metabolic monomers from these

73
compounds (Stouthamer, 1976). However, if enough time is allowed, such as in a 24-h
incubation period, preferences for C sources disappeared, suggesting that new
components of the microbial community may emerge specialized in the most abundant
substrate. The relative low preference of amino acids as a carbon source for metabolism
may also be enhanced in poor nutrient sites. Our two ecosystems showed low soil
nitrogen availability which may explain that amino acids could be preferentially used
for protein synthesis.
Differences within use of carboxylic acids C sources are even more difficult to
explain. While in the pine forest microbes response was highest for malic acid and
oxoglutaric acid, in the shrubland the highest response was for the oxoglutaric acid. A
preference for this compound is expected based in the lowest oxidation state and
highest heat of combustion as compared with the other carboxylic acids, but no
physico-chemical properties can explain the differences between carboxylic acids
found in the pine forest. Different responses to carboxylic acids have been explained
based on their availability in the soil profile. One controlling factor may be the extent
of exposure of microorganisms to specific organic acids in soils (Banning et al. 2012).
Different carboxylic acids have been found to have different depth distribution
patterns in forest soil horizons, which have been suggested to relate to organic matter
content, pH and complexation with metal cations (Tani and Highashi, 1999).
Differences in microbial community structure have also been proposed to influence the
availability of specific carboxylic acid. For example, van Hees et al. (2002) found higher
soil capacity to mineralize the organic acids in the presence of ectomycorrhizal fungi.
Within amino acids the only clear pattern was that arginine was the less
consumed, which was observed for both ecosystems. Arginine has the highest
molecular weight and lowest solubility of all other amino acids, which may difficult
the movement through cell membranes. Besides, arginine differs from the other amino
acids in that it has two amine groups and four N atoms in its structure. Before entering
in the Krebs cycle to be catabolized, amino acids have to be deaminized, which is an
energy-consuming process and other possible reason why arginine is negatively
discriminated as a C source. Less clear differences emerged among the carbohydrates C
sources in both ecosystems. Only in the pine forest glucose and fructose were more
respired that the other C sources. N-Acetilglucosamine should be preferred by soil
microorganism based on its lowest oxidation state and highest heat of combustion,
however its solubility is very low as compared with the other carbohydrates. N-

74
Acetilglucosamine is part of a biopolymer in the bacterial cell wall and the main
component of the cell walls of fungi, and part of the N-Acetilglucosamine can be
directed to anabolism more than to catabolism.
Based on the C source consumption, the soil samples in the pine forest showed
more diversity of responses than the shrubland. The difference may be based on the
lower fertility of the shrubland soils compared with the pine forest soil, which
precludes soil microbes in the shrubland site to rapid response to C additions. There
are also differences in terms of microbial functional diversity as measured by the
Shannon index between sites, since in the shrubland site the maximum diversity was
reached in the autumn samples, while in the pine forest the maximum was reached in
the summer samples, although microbial functional diversity increased in both sites
from winter to summer. These increases were due to the relatively higher consumption
of amino acids in summer, which may be related to the known mechanism of solutes
incorporation in microbial cells (particularly dissolved organic nitrogen substances) to
overcome water stress in summer (Csonka, 1989).
In conclusion, our results showed that the soil labile C concentration is not a
reliable predictor of microbial response to different C sources addition in our two
study sites. We have also found that the seasonal changes on soil microbial response to
different C sources addition produce a different pattern in our two ecosystems, most
likely due to the contrasting fertility. Finally, we suggest that the common pattern
showed in microbial consumption of the studied C sources may be partially
determined by their physico-chemical properties.
Acknowledgments
This study was financed by the Ministerio Espanol de Ciencia e Innovación of
the Spanish government, grant CGL2010-21381. Lourdes Morillas was supported by a
graduate student fellowship from the Spanish government. We appreciate the help of
Javier Roales, Begoña Morillas and Juan Morillas during the field sampling.

75
Capítulo 4
Biological soil crusts and wetting events: Effects on soil N and C cycles
Lourdes Morillas and Antonio Gallardo
Biological soil crusts (BSC) communities control many functional processes in
arid and semiarid ecosystems, where biological activity is closely influenced by soil
wetting. Our goal was to analyze how the length of wetting events and the presence of
BSC determine soil variables related to C and N cycling in a semiarid ecosystem. We
applied three watering treatments (1, 6 and 10 days) on soils from two microsites (BSC
and bare ground) in a microcosm experiment. We analyzed N in microbial biomass
[MB-N], dissolved organic nitrogen [DON], NH4+-N, NO3--N, Resin-NH4+-N and -NO3-
-N, phenols and carbohydrates. Our results showed that longer lasting wetting events
kept higher mineral and organic N as well as labile organic C in soils under BSC, which
suggest that longer wetting events may be related to an enhancement in the
decomposition rate that compensate for nutrient losses associated to short lasting
wetting events. This trend is much less obvious in bare ground than under BSC. Our
data suggest that changes in the length of wetting events and the presence of BSC with
climate changes could alter future soil community structure and function.
Keywords: Drylands; DON; Microbial Biomass -N; Mineralization rate, Nitrogen cycle,
Carbon cycle.


77
Introduction
Arid and semiarid ecosystems (also known as drylands) cover approximately
40% of Earth’s terrestrial surface (Reynolds et al. 2007). Soils in dryland areas are
commonly covered with biological soil crust (BSC), which is variably composed of
cyanobacteria, bacteria, mosses, lichens, algae, and fungi. BSC are globally widespread
and constitute a key biotic component of these areas (Belnap and Lange 2003), since
they can completely cover plant interspaces in undisturbed areas and represent up to
70% of the living cover in these sparsely-vegetated areas (Belnap 1995). These crusts
exert a strong effect on key ecosystem processes including water retention and
infiltration (Eldridge et al. 2010), soil respiration (Maestre and Cortina 2003), nitrogen
and carbon fixation and transformations (Belnap 2002; Evans and Lange 2003; Castillo-
Monroy et al. 2010).
Since BSC are such an important part of soil drylands, there has been concern
related to the effect of projected climate change on their functioning (Belnap et al. 2008;
Grote et al. 2010; Maestre et al. 2013) and the ecosystem processes that are affected by
them (Maestre et al. 2010). As their activity is directly tied to periods following rain
events, any change in the timing and duration of precipitation will likely affect their
physiological functioning (e.g., C and N fixation) and their response to stress. Future
climate scenarios predict important changes in the temperature and rainfall dynamics
of drylands, including larger and less frequent rain events (Knapp et al. 2008) and
more extreme events (Easterling et al. 2000; Solomon et al. 2007). Nevertheless, how
much precipitation will change is still a matter of debate (Weltzin and McPherson
2003). These climatic changes could have important implications, because previous
research on vascular plants suggested that shifts in timing and size of individual
precipitation events might be as or more relevant for ecosystem function than shifts in
the absolute amount of annual precipitation (Cable and Huxman 2004; Schwinning et
al. 2004). All this suggests that soil nutrients may be affected not only by the amount of
rainfall, but by the length of precipitation event. Nevertheless, there have been few
studies on the effects of the length of wetting event on soil nutrients, and no studies to
our knowledge, on the combined effects of the length of wetting event and biological
soil crusts on soil nutrients.
Despite some recent studies have proved that carbon mineralization rates in
deserts are highly affected by photodegradation (Austin, 2011), water availability plays
a central part in affecting many biotic processes in aridland ecosystems (Noy-Meir,

78
1973). In arid and semi-arid regions, biological activity is closely related to the
frequency, size, and timing of rainfall events (Noy-Meir 1973), since low soil water
potentials can limit microbial contact with available substrate (Orchard and Cook
1983). Hence, most of these ecosystems show a pulse-dynamic response to
precipitation, in which individual rainfall events allow short pulses of resource
availability to microbes (Huxman et al. 2004). Soil surface properties, such as the
existence of a biological soil crust, determine the location, amount, and timing of water
infiltration into drylands soils (Eldridge and Greene 1994; Belnap and Lange 2003),
which affects the type and size of microbial response.
Rapid rewetting of dry soils may kill up to one-third of the soil microbes due to
osmolysis, since microbial biomass accumulate solutes during dry intervals in order to
rise desiccation tolerance (Kieft et al. 1987). Thus, microbes must rapidly acclimate
through physiological mechanisms to survive. Nevertheless, acclimation strategies
have physiological costs that may change the composition of the soil microbial
community, which may involve shifts in ecosystem-level C and nutrient flows (Schimel
et al. 2007). Excessive stress will force microbes into dormancy (Farrar and Reboli 1999;
Suzina et al. 2004) or will even kill them, which will result in organic carbon and
nutrients release. This resource and soil moister pulse may stimulate an increase of
microbial biomass (Kieft et al. 1987) and microbial metabolic rates such as
decomposition and mineralization of soil organic matter (Schwinning and Sala 2004;
Fisher and Whitford 1995) or, alternatively, these resources might be lost to deeper
soils or to the atmosphere (Miller et al. 2005). Some studies suggest dryland
microorganisms will be relatively resilient to changes in precipitation regime, since
they are adapted to extreme environments (Kleidon et al. 2000; Ward 2009). In contrast,
others researches suggest these microbes are already living near the physiological
limits of tolerance, and hence they are likely to be particularly sensitive to climatic
changes (Sala and Lauenroth 1982; Weltzin et al. 2003; Schwinning et al. 2004).
Improving our knowledge on the effect of length of wetting event on soil
nutrients in BSC areas is critical to improve our understanding of nutrient cycling in
arid and semiarid environments, in order to accurately predict how they will respond
to the ongoing global environmental change. To advance in this direction, we
evaluated how different length of wetting events affect multiple variables related to N
(N in microbial biomass [MB-N], dissolved organic nitrogen [DON], NH4+-N, NO3--N,

79
Resin-NH4+-N and Resin-NO3--N) and C (phenols and carbohydrates) cycling in BSC
and bare ground in a microcosm experiment.
We hypothesize that physical processes leading to nutrient losses such as
leaching and runoff are faster than biological processes related to decomposition and
mineralization rates. Therefore, longer wetting events should be conservative for soil
nutrients. We also hypothesize that soils under BSC will show a different response of
the soil variables to different lengths of wetting events than bare ground samples, due
to the interferences of BSC in the water infiltration and to the different composition of
microbial communities found under BSC (Delgado-Baquerizo et al., 2013a). Therefore,
an enhancement in the microbial metabolic rates may be expected in longer wetting
events, altering inorganic and organic N as well as labile C sources as a result of
increasing both decomposition and mineralization rates.
Material and methods
Study area
This study was conducted in the Aranjuez Experimental Station, located in
central Spain (40° 02′ N; 3° 37′ W; 590 m; 8 ° slope facing SE). The climate is
Mediterranean semiarid, with a 30-year average rainfall and temperature of 388 mm
and 14°C. There is a pronounced dry season from June to September, with only small
amounts of rain. The soil in this area is derived from gypsum outcrops, and it is
classified as Xeric Haplogypsid (Marqués et al. 2008). It is characterized by a fine
texture, dominated by the presence of gypsum. Table 1 presents the relevant physical
and chemical properties of this soil. Perennial plant cover is below 40% and is
dominated by Stipa tenacissima L. (18% of plant cover) and the N-fixing shrub Retama
sphaerocarpa L. (6% of plant cover). The open areas between plant patches host well-
developed BSC community dominated by lichens such as Diploschistes diacapsis Ach.,
Squamarina lentigera Weber., Fulgensia subbracteata Nyl., Toninia sedifolia Scop., and Psora
decipiens Hedw. (see Castillo-Monroy et al. 2010 for a full species checklist). Bare
ground and BSC-dominated areas cover 28 and 32% of the study area, respectively.

80
Experimental Design
Soil sampling and laboratory analyses were performed in spring of 2011, the
most biologically active season at the study site (Castillo-Monroy et al. 2011). In May
2011, we randomly selected 30 intact soil cores (4 cm depth, 7 cm diameter) under each
of two studied soils: well-developed BSC communities (cover of mosses and lichens >
75%; see Appendix B of Castillo-Monroy et al. 2010) and bare ground areas lacking in
vascular vegetation and BSC components (cover of lichens and mosses < 15%; see
Appendix B of Castillo-Monroy et al. 2010). This soil depth was selected to keep the
whole effect of BSC (top 0-4 cm of soil, Castillo-Monroy et al. 2010; Delgado-Baquerizo
et al. 2010). Soil cores were transported to the laboratory and air-dried at room
temperature for three weeks. Soil cores with and without BSC were incubated in the
laboratory for 17 days and watered once a day until saturation for one, six and ten
days (1-d, 6-d and 10-d, hereafter), conforming three treatments of one wetting and
drying cycle with different length of watering. The incubation was performed in a
sunlight location in the laboratory. The soil cores were allowed to drain after each
watering in order to avoid anoxic conditions. Ten replicates were used for each
combination of treatments. From each sample, we collected 3 g of soil from each
replicated core at different times: immediately before the first watering (T 0), 1 day
after T 0 (T 1), 2 days after T 0 (T 2), 6 days after T 0 (T 6), 10 days after T 0 (T 10) and
17 days after T0 (T 17).
We also measured mineral N availability in situ by using ion-exchange
membranes (resins; Subler et al. 1995; Durán et al., 2013a). Resins were the technique of
choice to produce minimal disturbances in the soil communities and allow intensive
sampling over multiple time periods at the same spatial location. Five pairs of anionic
and cationic resins (types AMI-7001S and CMI-7000S, Membranes International INC,
New Jersey) were installed per each replicated core during the experiment. Each pair of
resins was incubated in soil during different periods of time throughout the
experiment (from T 0 to T 1, from T 1 to T 2, from T 2 to T 6, from T 6 to T 10 and from
T 10 to T17).

81
Laboratory analysis
To measure ammonium (NH4+-N), nitrate (NO3--N) and DON, the soil
subsamples were extracted with 0.5 M K2SO4 at a ratio of 1:5, followed by shaking for 1
h at 200 rpm at 20ºC. The extract was filtered through a 0.45 µm Millipore filter (Jones
and Willett 2006). The NH4+-N concentration was estimated directly via the indophenol
blue method using a microplate reader (Sims et al. 1995). The NO3--N was first reduced
to NH4+-N with Devarda alloy, and the concentration was determined as the difference
between the Devarda-incubated and unincubated samples. The DON in the extracts
was first oxidized to NO3--N with potassium persulfate (K2S2O8) in an autoclave at 121
ºC for 55 min and then reduced to NH4+-N with Devarda alloy (Sollins et al. 1999). The
DON contents were calculated as total dissolved N minus inorganic N.
MB-N was determined using the fumigation-extraction method proposed by Brookes
et al. (1985). Fresh soil subsamples were fumigated with chloroform for 5 days. The
non-fumigated replicates were used as controls. The fumigated and non-fumigated
samples were extracted with K2SO4 0.5 M at a ratio of 1:5 and filtered through a 0.45-
µm Millipore filter. The extracts were digested as described above. The total N content
in the digested extracts was determined by colorimetry (indophenol blue method) with
a microplate reader (Sims et al. 1995). The MB-N concentration was estimated as the
difference between the total N in fumigated and unfumigated digested extracts
divided by a Kn (fraction of MB-N extracted after CHCl3 treatment) of 0.54 (Brookes et
al. 1985). Potentially available N (total available N hereafter) was calculated as the sum
of ammonium, nitrate and DON.
The ion-exchange resins were first subjected to expansion treatment by
submersion in distilled water at 82–90°C for 48 h. Next, the resins were cut into 2.5 ×
2.5 cm squares and inserted into the soil at a 0.5–3 cm depth. After soil incubation time,
the resins were collected and dried at ambient temperature. The resins were carefully
brushed to remove soil particles, and placed into 125 ml flasks for extraction with 25 ml
of 2 M KCl via orbital spinning (1 h at 200 rpm). The extracts were analyzed to measure
NH4+-N and NO3--N by following Morillas et al. (2013).
To measure carbohydrates (sum of pentoses and hexoses) and phenols, the soil
subsamples were extracted with 0.5 M K2SO4 at a ratio of 1:5, followed by shaking for 1
h at 200 rpm at 20ºC. The extract was filtered through a 0.45 µm Millipore filter. All

82
concentrations were estimated following Chantigny et al. (2006). All results were
expressed on a dry soil basis.
Statistical and numerical analyses
Differences in soil variables concentration between watering treatments and
microsites were evaluated via repeated-measures ANOVA by using IBM SPSS 15.0
(SPSS Inc, Chicago, IL, USA). Net changes of soil variables during the experiment for
each watering treatment was calculated as the difference between T 17 and T 0
concentrations. Since these data did not follow ANOVA assumptions (normality and
homogeneity of variances), the effects of watering treatments (1-d, 6-d and 10-d) and
microsites (BSC and bare ground) on net changes were tested using the semi-
parametric PERMANOVA approach (Anderson 2001). BSC presence or absence and
watering treatments were treated as fixed factors. PERMANOVA does not make
distributional assumptions and is compatible with any distance measure. To
investigate interactions, data were divided into subsets based on one of the factors of
interaction, and then were subjected to PERMANOVA analyses. PERMANOVA
analyses were performed by using 9999 permutations (permutation of raw data) and
the Euclidean distance with the PERMANOVA+ for PRIMER statistical package
(PRIMER-E Ltd., Plymounth Marine Laboratory, UK).
Results
Soil differences between microsites
Before any treatment the concentration of resin-NH4+, resin-NO3- and
carbohydrates was significantly higher in bare ground than in BSC, meanwhile NH4+-
N showed the opposite trend (Table 1). Initial differences in the concentrations of MB-
N, DON, NO3-- N, mineral N, total available N and phenols were not found between
microsites (Table 1).

83
Table 1. Physical and chemical properties for the top 4 cm of the soil profile for the bare ground and biological soil crust (BSC) microsites (n=30).
Bare ground BSC
Mean SE Mean SE
MB-N (mg kg-1 soil) 58.67 8.68 64.95 8.38
DON (mg kg-1 soil) 27.06 1.84 26.08 1.51
NH4 +-N (mg kg-1 soil)*** 0.85 0.21 2.25 0.41
NO3-- N (mg kg-1 soil) 7.75 0.70 6.22 0.51
Min N (mg kg-1 soil) 8.56 0.80 8.32 0.69
Total available N (mg kg-1 soil) 35.34 2.68 34.93 1.95
Resins-NH4+ (µg cm-2 day -1)* 0.16 0.01 0.14 0.01
Resins-NO3- (µg cm-2 day -1)* 0.67 0.06 0.51 0.05
Phenols (mg kg-1 soil) 22.44 2.52 22.81 3.43
Carbohydrates (mg kg-1 soil) *** 67.71 6.68 34.61 4.30
*Significant differences between microsites in the initial soil variables concentrations are as
follows: * p<0.05, ** p<0.01 and ***p<0.001 (n=5). Total available N is the sum of mineral N plus
DON.
Soil variables concentration
We found a significant effect of the different watering treatments on the C
variables (phenols and carbohydrares) and on NO3- (both NO3- concentration and NO3--
Resin), but not on soil MB-N, DON and NH4+. (Online Resource 1, Figure 1, 2, 3 and 4).
The presence of BSC affected significantly all variables, excepting MB-N and NH4+-
Resins (Online Resource 1). For all watering treatments, DON concentrations reached
their minimum values earlier in BSC than in bare ground, while maximum NO3-
concentrations appeared earlier in BSC than in bare ground (Figure 1b and 2b). Soils
under BSC showed lower values of DON than in bare ground for all watering
treatments (Figure 1b). Increases of NH4+ were only perceptible under BSC (Figure 2a).
We found a significant effect of time for all analyzed variables, excepting soil NH4+
(Online Resource 1). There was a significant time x microsite interaction for all
variables, except for phenols (Online Resource 1). We also found a significant time x
treatment and treatment x microsite interaction for NO3--Resin and NH4+-Resin,
respectively (Online Resource 1).

84
Figure 1. MB-N (a) and DON (b) measured at T 0, T 1, T 6, T 10 and T 17 in the top 4 cm of the soil profile throughout the study in the bare ground and BSC microsites. Error bars are ±2SE (n=10)
Figure 2. NH4+-N (a) and NO3--N (b) measured at T 0, T 1, T 6, T 10 and T 17 in the top 4 cm of the soil profile throughout the study in the bare ground and BSC microsites. Error bars are ±2SE (n=10)

85
Figure 3. Resin-NH4+-N (a) and Resin-NO3--N (b) measured at T 0, T 1, T 6, T 10 and T 17 in the top 4 cm of the soil profile throughout the study in the bare ground and BSC microsites. Error bars are ±2SE (n=10).
Figure 4. Phenols (a) and Carbohydrates (b) measured at T 0, T 1, T 6, T 10 and T 17 in the top 4 cm of the soil profile throughout the study in the bare ground and BSC microsites. Error bars are ±2SE (n=10)
Soil variables net changes
There was a significant effect of watering treatment on the net change of all
analyzed variables, except for NO3- (Table 2, Figure 5 and 6). Microsite significantly
affected all soil variables net changes, excepting MB-N and NO3- (Table 2, Figure 5 and
6). There was a significant treatment x microsite interaction for all the soil variables net
changes, excepting NO3-, phenols and carbohydrates (Table 2). For the 1-d watering the

86
net changes were negative for all soil variables under the BSC. For the 6-d and 10-d
treatments these values tended to be less negative or even positive for all variables
excepting MB-N and resin-N. In the bare ground only DON and NH4+ showed
positive values for the 1-d watering treatment, and for the 6-d and 10-d watering
treatments only NH4 and carbohydrates showed a significant trend toward less
negative or more positive values. Net changes of DON showed an inverse pattern in
bare ground than under BSC.
Table 2. PERMANOVA test evaluating the effect of the microsite and length of wetting event (treatment) on the net changes (differences between final and initial values) of soil variables
Soil variables P Microsite P Treatment P Microsite x Treatment
MB-N 0.152 < 0.001 < 0.001
DON < 0.001 0.006 < 0.001
NH4+-N < 0.001 < 0.001 0.016
NO3--N 0.068 0.194 0.566
Resin-NH4+-N < 0.001 < 0.001 < 0.001
Resin-NO3--N < 0.001 < 0.001 < 0.001
Phenols < 0.001 < 0.001 0.074
Carbohydrates < 0.001 < 0.001 0.259

87
Figure 5. MB-N (a), DON (b), NH4+-N (c), NO3--N (d), Resin-NH4+-N (e) and Resin-NO3--N (f) net changes for each watering treatment measured as the difference between T 17 and T 0 concentrations in the bare ground and BSC microsites. Error bars are ±2SE (n=10)

88
Figure 6. Phenols (a) and Carbohydrates (b) net changes for each watering treatment measured as the difference between T 17 and T 0 concentrations in the bare ground and BSC microsites. Error bars are ±2SE (n=10)
Discussion
As we expected, increasing length of wetting event had a noticeable effect on
bare ground and biological soil crust microsites, though it was larger on the latest. Our
results showed that longer wetting events produced higher mineral N and organic C
production, which suggests that longer wetting events may be related to an
enhancement in microbial metabolic rates such as both decomposition and
mineralization rates. Our results are consistent with those of Schwinning and Sala
(2004), who suggested that there is a hierarchy of soil moisture pulse events with a
corresponding hierarchy of ecological responses in semi-arid ecosystems. Based on this
idea, small watering events trigger only a few relatively minor ecological responses,
whereas larger events trigger more complex and larger ecological responses. However,
we like to point out a complementary idea; the results observed under small watering
events may be a consequence of the dominance of physical processes, such as leaching

89
or runoff versus biological processes, such as those derived from the microbial
metabolism.
Mineral N production increased with the length of wetting event supporting
that microbial activity is mainly limited by soil moisture. High levels of soil moisture
reduce the transport rate of oxygen through soil and decrease oxygen availability to the
microbes whereas too low levels of soil moisture inhibit cellular activity (Grote et al.
2010). Since dryland soils are moist and metabolically active <10% of the time (Lange et
al. 1994), long wetting events are unlikely to occur frequently. Nevertheless, these
findings prove the potential for C and N cycles in dryland soils to respond to a broad
range of length of wetting events. Our findings suggest that longer wetting events can
be related to an increase in the microbial metabolic rates such as both decomposition
and mineralization rates, but this increase was observed earlier under BSC, suggesting
better conditions for microbial activity. However, the presence of BSC may slow down
water infiltration (Maestre et al. 2011), avoiding rapid leaching of labile solutes, which
may contribute to the earlier increase in mineral and organic compound in soils. We
found net changes of NH4+, NO3-, DON, phenols and carbohydrates increased for the
two longest wetting events in BSC, while only net changes of NH4+ and carbohydrates
showed the same trend in bare ground. Since this trend was more obvious in BSC than
in bare ground, our results suggest that BSC communities may benefit these microbial
activities throughout the larger amount of heterotrophic bacteria and fungi compared
to bare ground (Belnap and Lange 2003), and that BSC communities plays a key role in
nutrient conservation in semiarid ecosystems. Thus, the decrease of BSC cover
predicted under climatic change scenarios (Maestre et al. 2013) may have consequences
on the soil balance of soil labile C and N cycling, even without considering changes in
the length of wetting events. Besides, we found that all the soil studied variables,
excepting MB-N and NH4+, had a different response throughout the studied period to
distinct length of wetting event when BSC were present. For all treatments, DON
concentration decreased faster in BSC than in bare ground, while NO3- showed the
inverse response, increasing faster in BSC than in bare ground. Increases of NH4+ were
only perceptible under BSC. These findings suggest a differential response of microbes
in BSC and bare ground microsites under different length of wetting events. Other
researchers have observed rapid physiological responses of BSC to water pulses
(Wilske et al. 2008).

90
It is interesting to note the strong decrease of net change of MB-N found for all
watering treatments and microsites. Several previous studies (Henry et al. 2005; Chung
et al. 2007; Allison and Martiny 2008; Zelikova et al. 2012) found that more frequent
wetting and drying cycles regarding to the control may modify microbial community
composition. Zelikova et al. (2012) found a decrease in both bacterial and fungal
biomass in frequently watered soils in a desert ecosystem with presence of BSC. They
suggested that a direct response to watering or an indirect response to the decrease of
moss cover could be potential explanations for this microbial biomass reduction. Fierer
et al. (2003) found shifts in microbial processes 6 weeks after the end of several wetting
and drying cycles, and these changes were related to shifts in the composition of the
microbial population. Pesaro et al. (2004) found that respiration rates recovered rapidly
after drought, meanwhile microbial biomass remained depressed for at least one
month. Even tolerable stresses suppose C and N costs on microbes that they must
overcome in order to survive and remain active, these costs may have relevant
influences on ecosystem functioning (Shimel et al. 2007).
In drylands, dry soil and the stress imposed by sudden rewetting can select
against gram negative bacteria and favor gram positive bacteria and fungi (Shimel et
al. 2007), this selection gain importance due to different groups of microbes perform
distinct biogeochemical functions. Most of microbes responsible for soil organic matter
breakdown are gram positives and fungi, and therefore they are drought tolerant, for
this reason soil respiration may be only slightly sensitive to climate-induced
community changes (Schimel 1995a). Nevertheless, most of the microbes performing
specialized functions in soil, such as nitrifiers (Schimel 1995a), are gram negatives and
therefore can be more sensitive. However, our results showed both decomposition and
mineralization rates increased in response to longer wetting events, suggesting that
both decomposer and nitrifier microbes are equally sensitive to the length of wetting
events.
Physicochemical decomposition might also be relevant in this ecosystem, since
the slightly alkaline pH shown in these soils favors high oxidative enzyme potentials
(Stursova et al. 2006). These conditions allow the breakdown of recalcitrant organic
compounds such as phenols. Net changes of these compounds increased in response to
longer wetting events only for BSC, highlighting the role of BSC microsites as a factor
modulating physicochemical decomposition of recalcitrant organic compounds.

91
Alternatively, the increment of this variable observed under BSC can be the result of
active microbial synthesis.
It is noticeable that most of the net changes in soil variables are negative, our
experimental design cannot provide a certain understanding for these findings, but it
might be related to the leakage of C and N with wetting (Kieft et al. 1987). Thus, soils
that are wetted for a longer period are likely to lose more nutrients than those receiving
less watering. Because soil water content determines soil microbial activity (Morillas et
al. 2013), a shift in precipitation patterns as predicted by climate change models, can
change microbial responses in a pulse driven ecosystem (Rustad et al. 2000; Easterling
et al. 2000). Our data suggest that changes in the length of wetting events and the
presence of BSC with climate changes could alter the C and N balance in semiarid soils.
Conclusions
Results from this study support the hypothesis that soil N and C cycling is
markedly affected by the length of wetting events and the presence of BSC, and such
changes could alter future soil community structure and function. Our findings show
that longer wetting events may activate the microbial communities, mainly those
related to BSC, stimulating microbial decomposition and mineralization of soil organic
matter. They also indicate that BSC change the response of DON, NH4+ and NO3- to
wetting events, producing a faster or higher microbial response compared to bare
ground. The different response found in BSC and bare ground suggests that distinct
microbial communities may modulate the response to wetting events in these
microsites. These findings highlight the relevance of BSC as a key factor of C and N
cycling in drylands, and complement the results of previous researches.
Acknowledgments
This study was financed by the Ministerio Espanol de Ciencia e Innovación of
the Spanish government, grant CGL2010-21381. Lourdes Morillas was supported by a
graduate student fellowship from the Spanish government. We thank the Instituto
Madrileño de Investigación y Desarrollo Rural, Agrario y Alimentario (IMIDRA) for
allowing us to work in the Aranjuez Experimental Station (Finca de Sotomayor). We

92
also appreciate the help of Cristina Allely and Ana Prado during the field sampling
and the lab analysis.

93
Online Resource 1. Repeated measurements ANOVA analyses for all the studied variables. Mi = Microsite, Ti = Time, Tr = Treatment (watering length), BG= Bare ground.
Factor Source df F p
MB-N
Ti 4 27.13 0.0005
Mi 1 1.54 0.238
Tr 2 1.96 0.208
Ti x Mi 4 4.90 0.042
Ti x Tr 8 13.75 0.069
Tr x Mi 2 0.78 0.490
Tr x Mi x Ti 8 2.31 0.336
Interaction Ti x Mi Mi (BG) Ti 4 21.44 0.001
Tr 2 2.01 0.195
Ti x Tr 8 11.86 0.080
Mi (BCS) Ti 4 8.75 0.011
Tr 2 0.76 0.497
Ti x Tr 8 1.32 0.498
DON
Ti 4 44.12 < 0.0001
Mi 1 41.25 < 0.0001
Tr 2 3.41 0.085
Ti x Mi 4 30.03 < 0.0001
Ti x Tr 8 9.77 0.096
Tr x Mi 2 0.63 0.554
Tr x Mi x Ti 8 10.75 0.087
Interaction Ti x Mi Mi (BG) Ti 4 11.64 0.005
Tr 2 1.70 0.242
Ti x Tr 8 15.23 0.063
Mi (BCS) Ti 4 85.71 < 0.0001

94
Tr 2 4.13 0.058
Ti x Tr 8 3.00 0.273
NH4+
Ti 4 3.26 0.095
Mi 1 40.07 < 0.0001
Tr 2 2.35 0.156
Ti x Mi 4 32.31 < 0.0001
Ti x Tr 8 1.22 0.525
Tr x Mi 2 3.06 0.103
Tr x Mi x Ti 8 2.01 0.374
Interaction Ti x Mi Mi (BG) Ti 4 14.43 0.003
Tr 2 2.13 0.180
Ti x Tr 8 1.81 0.403
Mi (BCS) Ti 4 6.24 0.025
Tr 2 2.36 0.156
Ti x Tr 8 3.17 0.261
NO3-
Ti 4 34.33 < 0.0001
Mi 1 12.33 0.006
Tr 2 53.27 < 0.0001
Ti x Mi 4 19.09 0.001
Ti x Tr 8 6.86 0.133
Tr x Mi 2 2.35 0.157
Tr x Mi x Ti 8 67.59 0.015
Interaction Ti x Mi Mi (BG) Ti 4 15.02 0.003
Tr 2 13.95 0.002
Ti x Tr 8 14.21 0.067
Mi (BCS) Ti 4 37.46 < 0.0001

95
Tr 2 7.73 0.014
Ti x Tr 8 0.84 0.644
NH4+- Resin
Ti 4 1635.59 < 0.0001
Mi 1 3.40 0.097
Tr 2 4.32 0.053
Ti x Mi 4 13.65 0.003
Ti x Tr 8 0.67 0.717
Tr x Mi 2 12.92 0.003
Tr x Mi x Ti 8 7.10 0.129
Interaction Ti x Mi Mi (BG) Ti 4 677.83 < 0.0001
Tr 2 11.26 0.004
Ti x Tr 8 31.07 0.031
Mi (BCS) Ti 4 313.70 < 0.0001
Tr 2 3.93 0.064
Ti x Tr 8 0.71 0.699
Interaction Tr x Mi Tr (A) Ti 4 144.77 < 0.0001
Tr (B) Ti 4 107.41 < 0.0001
Tr (C) Ti 4 313.73 < 0.0001
NO3-- Resin
Ti 4 43.02 < 0.0001
Mi 1 11.95 0.007
Tr 2 11.64 0.004
Ti x Mi 4 28.67 0.0004
Ti x Tr 8 84.78 0.011
Tr x Mi 2 0.29 0.751
Tr x Mi x Ti 8 4.08 0.211
Interaction Ti x Mi Ti (T1) Mi 1 4.99 0.052

96
Tr 2 0.86 0.457
Mi x Tr 2 2.75 0.123
Ti (T2) Mi 1 3.11 0.111
Tr 2 6.78 0.018
Mi x Tr 2 1.15 0.361
Ti (T3) Mi 1 32.84 0.0002
Tr 2 104.97 < 0.0001
Mi x Tr 2 7.91 0.012
Ti (T4) Mi 1 0.02 0.882
Tr 2 17.46 0.001
Mi x Tr 2 1.26 0.331
Ti (T5) Mi 1 17.32 0.002
Tr 2 13.49 0.002
Mi x Tr 2 41.86 < 0.0001
Interaction Mi x Tr (T3) Mi (BG) Tr 2 71.30 < 0.0001
Mi (BCS) Tr 2 52.35 < 0.0001
Interaction Mi x Tr (T5) Mi (BG) Tr 2 1.99 0.198
Mi (BCS) Tr 2 13.55 0.002
Phenols
Ti 4 15.46 0.002
Mi 1 41.48 0.0001
Tr 2 5.73 0.028
Ti x Mi 4 4.47 0.051
Ti x Tr 8 3.55 0.238
Tr x Mi 2 2.08 0.187
Tr x Mi x Ti 8 0.77 0.674
Carbohydrates
Ti 4 9.47 0.009

97
Mi 1 39.49 0.0001
Tr 2 16.36 0.001
Ti x Mi 4 14.37 0.003
Ti x Tr 8 12.36 0.076
Tr x Mi 2 2.49 0.143
Tr x Mi x Ti 8 16.59 0.058
Interaction Ti x Mi Mi (BG) Ti 4 11.86 0.005
Tr 2 5.70 0.028
Ti x Tr 8 6.77 0.135
Mi (BCS) Ti 4 10.52 0.007
Tr 2 47.05 < 0.0001
Ti x Tr 8 4.38 0.198


99
Capítulo 5
Increased N supply modulates the effect of drying-rewetting frequency on
soil C and N cyclingand soil-atmosphere trace gases exchange
Lourdes Morillas, Jorge Durán, Alexandra Rodríguez, Javier Roales, Antonio
Gallardo, Gary M. Lovett and Peter M. Groffman
Despite climate change and atmospheric nitrogen (N) deposition are two of the
most important and concomitant global change drivers, the non additive effects that
they can generate on soil response remain to be tested. We aimed to assess how the
combined effect of soil N additions and more frequent drying-rewetting events affects
carbon (C) and N cycling, functional microbial diversity and greenhouse gases (GHGs)
soil-atmosphere exchange. To do so, we manipulated the frequency of soil drying-
rewetting events on ambient and N-treated soils from a template forest. To evaluate
how N-addition modulates the resistance of the soil to changes in the frequency of
drying-rewetting events, we calculated the Orwin and Wardle Resistance index. Our
results indicate that the intensification of the frequency of drying-rewetting cycles can
affect the ability of soil to cycle C and N and the soil:atmosphere GHGs exchange, and
that soil N input change the response of these variables to drying-rewetting cycles. We
found a buffer effect of N-treated soil to changes in the frequency of the stresses,
making soils more resistant to the predicted climate change. Overall, repeated drying-
rewetting cycles led to reduction in NO3-, potential nitrification rate and GHGs
emissions, and to increase in NH4+ and mineral N. The addition of N affected the
functionality of the microbial population and increased the microbial functional
diversity of the soil, but we found no effect of the intensification of the drying-
rewetting cycles on these variables. Our results suggest that the combination of
increased drying-rewetting cycles and N input can induce significant changes in C and
N cycles, soil:atmosphere GHGs exchange and soil microbial community, therefore,
they should be incorporated into models of the global change on soil C and N cycling.
Keywords: global change, nutrient cycling, precipitation pattern, microbial functional
diversity, nitrogen addition.


101
Introduction
Human activities are altering the global climate. As a result, an intensification
of the hydrological cycle manifested as raised evapotranspiration and soil drought
coupled to more frequent and intense storms (Wetherald and Manabe, 2002), and an
increase in the frequency of soil drying-rewetting cycles are expected (Huntington,
2006; IPCC, 2007). Soil moisture is one of the most critical controls of soil
biogeochemical processes (Parton et al., 1987; Paul and Clark, 1996), and many studies
have shown that changes in hydrological dynamics (i.e. drying-rewetting cycles) due to
climate change can deeply alter soil carbon(C) and nitrogen (N) cycling (Cui and
Caldwell, 1997), microbial biomass and activity (Stark and Firestone, 1995; Schimel et
al., 1999), and the emission of greenhouse gases (GHGs) such as carbon dioxide (CO2),
nitrous oxide (N2O) and methane (CH4; Matson et al., 1991).
Atmospheric N deposition is one of the major drivers of global environmental
change (Schlesinger, 2013). High levels of atmospheric N deposition from both fossil
fuel combustion and agricultural activities are increasingly becoming a problem
worldwide (Vitousek et al., 1997; Galloway and Cowling, 2002). This excess in N
deposition can have serious consequences on ecosystems, such as nutrient imbalances,
soil acidification, waters eutrophication, changes in C and N cycles, and increases in
N2Osoil emissions (Balota et al., 2004; Lal, 2004; Fenn et al., 1998; Driscoll et al., 2003).
Recent reviews about the effect of N addition on soil C cycling in forest soils also show
that increased N inputs can influence C storage through its effect on various aspects of
soil C cycling such as changes in organic matter decomposition and soil respiration,
among others (see Nave et al., 2009; Janssens et al., 2010; Liu and Greaver, 2010).
However, other studies show that this effect can be transient (Hagedorn et al., 2012),
highly heterogeneous (Pregitzer et al., 2008), modulated by the tree species
composition (Rodríguez et al. under review) or insignificant (Lovett and Goodale,
2011).
While soil N additions reportedly affects soil C and N cycling and GHGs
soil:atmosphere exchange, fewer studies have examined how the frequency of drying-
rewetting cycles influences these processes (Fierer and Schimel, 2002). Further, to our
knowledge, how increased N supply modulates soil response and resistance to changes
in the frequency of drying-rewetting stresses has never been thoroughly tested before,
even when climate change and atmospheric N deposition are two of the most
important and concomitant global change drivers in the Northern Hemisphere (Sala et

102
al., 2000; Gruber and Galloway, 2008). It is well known that ecosystems frequently face
multiple human-driven problems that can generate non-additive effects unpredictable
from one single-factor studies. However most of the studies about global change effects
on ecosystems have focused on the effects of one single driver (Sala et al., 2000;
Matesanz et al., 2009).There is therefore a major challenge in developing a better
understanding of how the combined effect of soil N additions and more frequent
drying-rewetting events affects soil processes.
As soil microbes are mediators of biogeochemical cycles, understanding their
responses to environmental changes will be critical to comprehend and project the
effects of different drivers of global change on biogeochemical cycles and feedbacks,
and to preserve ecosystem services (Nie et al., 2013). Thus, improving our knowledge
of the combined effects of changes in N supply and changes in the frequency of drying-
rewetting cycles on the soil microbial community is crucial to our understanding of
future ecosystem C and N cycling in a global change scenario. Rapid changes in soil
moisture are stressful to microbes mainly because they have to invest energy to
regulate osmotic pressure (Bottner, 1985; Van Gestel et al., 1993). Since these
physiological adaptations to soil moisture need for a large investment of resources, the
ability of soil microorganisms to carry out these processes can be restricted by the
nutritional status of the soil and other soil conditions (Schimel et al., 2007). Thus, N-
supply could modulate, through its own effect on soil C and N cycling and on the
microbial community, the response of soil microorganisms to different frequency of
drying-rewetting cycles.
The goal of this study was to assess the effect of the frequency of drying-
rewetting events on the microbial community and microbial processes of soil forests
with different N-supply. To do so, we subjected N-treated and non-treated (ambient)
soils from a 15 years N addition experiment (Lovett and Goodale, 2001) to different
frequency of drying-rewetting stresses, and measured different variables related to C
and N cycling, and to the soil:atmosphere GHGs exchange. To address the role of
microbial populations on the observed response, we calculated the soil functional
microbial diversity. To better understand how soil N supply modulates the response of
microbial biomass and activity to changes in drying-rewetting frequency, we
calculated the Orwin and Wardel Resistance Index (2004) for all variables. We
hypothesized that (i) the ability to cycle C and N and the soil:atmosphere GHGs

103
exchange will be influenced by the intensification of the frequency of drying-rewetting
cycles, but that (ii) this effect will be modulated by previous soil N-supply conditions.
Materials and methods
Research site and soil sampling
This study wascarried out at the Cary Institute of Ecosystem Studies, Millbrook,
in southeastern New York State, USA (41.797°N, 73.734°W). The forest is comprised of
upland mixed-oak woods dominated by red oak (Quercus rubra L.), chestnut oak
(Quercus prinus L.) and several species of hickory (Carya sp.). The site has a humid
continental climate, with an annual average temperature of 9.6 °C and precipitation
averages 111 cm y-1. Soils in this area are well-drained silt loams of the Nassau and
Woodlawn series (Glitzenstein et al., 1990) classified as lithic dystrudepts. Ambient
inorganic N deposition (wet + dry) at this site average approximately 9 kg N ha-1 y-1
(Lovett and Goodale, 2011). In 1996, six pairs of plots of 20 m in diameter each were
selected. The two plots of each pair were within 40 m of each other. One plot of each
pair was continuously N-treated adding granular NH4NO3 to the forest floor at a rate
equivalent of 100 kg N ha-1 y-1 from 1996 to 1999, and then the N addition rate was
diminished to 50 kg N ha-1 y-1 from 2000 to 2012. This annual application was
distributed into four equal doses each year. The other plot of each pair was left
untreated as an ambient plot [see Lovett and Goodale (2011) for more information
about the research site]. In May 2012, three sampling points were randomly selected at
each of the six pairs of plots, and cleared form fresh litter plus some Oi horizon to
facilitate soil sample collection. We took three samples of the first 10 cm of the soil
profile from each plot using a 5 cmdiameter corer. All samples from the ambient and
from the N-treated plots were combined separately into two composite samples,
hereafter referred to as ‘ambient’ and ‘N-treated’, respectively.
Soil incubation
The two composite samples were homogenized by hand to remove roots and
rocks and oven dried at 38° C to constant weight. Soil water holding capacity (WHC)
was determined as the gravimetric water content of soil that was saturated and

104
allowed to drain freely over 48 h in a filter funnel. Soils were then placed in tins (150 g
of soil per tin) and conditioned for 4 days at 35% WHC (21% of soil water content) at
20-22 °C. Soils from 5 randomly selected tins of each type of soil were used for
chemical and trace gases analysis (see below) at time zero (T0). Then, 5 replicates (tins)
of each soil type (N-treated and ambient) where selected for each drying-rewetting
treatment. Soils were incubated during 31 days in darkness at 30 °C, and initially at
35% WHC. To avoid soil drying and allowing gases exchange, tins were closed with
plastic wrap secured with a rubber band, and tins were daily weighed to make sure
that the soil WHC was the appropriate. We applied 4 different drying-rewetting stress
treatments. In the ‘D0’ treatment soils were constantly kept at 35% of WHC, while in
‘D1’, ‘D2’ and ‘D4’ treatments, soils were subjected to one, two and four drying-
rewetting events, respectively: D1 received a drying-rewetting event at the end of the
experiment; D2 received one drying-rewetting event in the middle of the experiment
(during the second week) and one drying-rewetting event at the end of the experiment;
D4 received four drying-rewetting events, one each week of the incubation.
Drying-rewetting events consisted of a 2-day drying period followed by a
rewetting. We dried soils by removing the plastic wrap and incubating at 30 °C under
forced air flow so soil moister reached~5% of soil water content. To rewet the soils we
homogeneously added deionized water using a syringe until the tins gained the weight
corresponding to the soil 35% WHC. At the end of the last drying-rewetting event, all
soils were rewetted at 35% WHC and incubated for three more days. After that, soils
were harvested and one fraction was immediately frozen for microbial analysis, the
other was stored at 3 °C for chemical analysis. This procedure ensured that the soil
microbial populations did not experience relevant changes (Gonzalez-Quiñones et al.,
2009).
Soil, trace gases and microbial analyses
Soil and trace gases analyses were carried out at the beginning (T0) and at the
end of the incubation. Soil samples were analyzed for water content by drying a
subsample at 60 °C for 48 h (McInnes and Weaver, 1994). We measured soil NH4+, NO3-
, inorganic N, microbial biomass C and N, potential microbial respiration and potential
mineralization and nitrification rates using the chloroform fumigation -incubation
method (Jenkinson and Powlson, 1976) as described by Durán et al. (2013b).

105
Soil-atmosphere CO2, N2O and CH4 fluxes were determined for all soil samples
by placing each tin inside a Mason jar and incubating for 150 minutes at 30 °C. Then,
the jar headspace was sampled through rubber septa on Mason jar lids with a fine
needle polypropylene syringe. Samples were then transferred to evacuated glass vials
and stored at room temperature before analysis by gas chromatography using electron
capture, thermal conductivity, and flame ionization detection for N2O, CO2 and CH4,
respectively.We calculated fluxes from the linear rate of change in gas concentration,
the jar internal volume, and soil volume.
We estimated soil microbial functional diversity by analyzing soil heterotrophic
microbial communities with the MicroResp system (Campbell et al., 2003). This
method tests 15 carbon sources that vary in structural complexity (Oren and
Steinberger, 2008). Carbon sources were selected depending on their ecological
importance to soil and their solubility in water. Specifically, we used amino acids (L-
alanine, L-lysine, arginine, L-cysteine and N-acetyl-glucosamine), carbohydrates (D-
fructose, D-galactose, D-glucose, L-arabinose and D-trehalose), and carboxylic acids
(citric acid, malic acid, oxalic acid and amino butyric acid) (Delgado-Baquerizo et al.,
2013b). Before performing the MicroResp method, defrosted soils were introduced into
the flasks and pre-incubated for five days at 25 ºC. The moisture within the flaks was
corrected to 40% WHC in order to condition the soils and reestablish active microbial
populations. To avoid changes in soil moisture content during incubation, flasks were
covered with plastic wrap. Each C source was dissolved in deionized water and added
to soils to deliver 30 mg C g soil water-1. Approximately 0.4 g of soil was placed in the
96 deep-well plates volumetrically. To estimate the evolved CO2, a colorimetric method
relying on the change in the pH of a gel-based solution of bicarbonate was used. After
that, the plates were incubated for 6 h and read at 570 nm. The results were calculated
on the basis of water, which represents the basal respiration.

106
Data and statistical analyses
Percent change of all analyzed variables was calculated as follows:
where DX is the studied variable valueat the end of the disturbance, is the variable
mean value for the samples that were kept at constant moisture and is the variable
mean value before the incubation.
To test how soil N treatment affected the resistance of the soil to different
drying-rewetting treatments, we calculated the Orwin and Wardle Resistance Index
(RS, 2004) for all the studied variables by using the following equation:
where X0 is the difference between the control (D0) and the disturbed soil at the end of
the disturbance. Disturbance is used as the period of time that the soils were exposed
to the drying-rewetting treatments (31 days). This index is standardized by the control
and it is bounded by −1 (less resistance) and +1 (maximal resistance).
We calculated the Shannon-Weaver Diversity Index (H’) to assess microbial
functional diversity using the soil respiration responding to the different C sources as
(Shannon and Weaver, 1963):
where pi is the ratio of the activity of a particular C substrate and the sum of activities
of all C substrates (Zak et al., 1994).
We assessed how the studied variables were influenced by N treatment
(ambient vs. N-treated) and the different drying-rewetting treatments by using the
semiparametric PERMANOVA approach developed by Anderson (2001). We
established the presence/absence of soil N treatment and the different drying-
rewetting treatments as fixed factors. Significant differences among drying-rewetting
treatments were evaluated for each N treatment by using a posteriori pairwise
comparison with the PERMANOVA t-statistic. PERMANOVA analyses were
performed using 9999 permutations and the Euclidean distance. We used Primer 6 and
Dx
− D0( ) ×100
T0
0D
0T
∑=
−=s
i
pipiH1
ln.'
( )0 0
02
1
XD
XRS
+−=

107
Permanova+ (PRIMER-E Ltd, Plymouth, UK) to carry out all statistical analyses.
Principal component analysis (PCA) was conducted using SPSS 17.
Results
Soil variables
All studied soil variables, except potential mineralization rate, were
significantly affected by drying-rewetting treatment (P<0.001). Soil NH4+-N and
inorganic N significantly increased from treatment D0 to treatment D4 while NO3--N,
microbial biomass C and potential nitrification rate showed the opposite trend (Table
1). Soil N treatment significantly altered all soil variables, except potential N
mineralization rate (Table 1). Soil NO3--N, inorganic N and potential nitrification rate,
were positively and significantly affected by the N additions, while the rest of variables
showed the opposite trend (Table 1). We also found a significant N x drying-rewetting
treatment interaction for all soil variables, except for microbial biomass N and potential
N mineralization.
Table 1. Absolute valuesof the studied variables for the different N and drying-rewetting treatments.Data represent means ± SE (n=5). Different superscripts indicate significant differences among drying-rewetting treatments after permutational-repeated measures ANOVA (9999 permutations, P < 0.05). Asterisks indicate significant differences between N treatments (** means p<0.01, *** means p<0.001).A= ambient soils;N= N-treated soils.
T0 D0 D1 D2 D4
NH4-N *** A 78.2±0.97A 124.1±1.05B 125.8±1.26BC 130.0±1.40CD 133.1±1.14D
N 84.6±0.34a 102.1±1.83b 110.1±2.62c 113.4±1.56c 121.3±2.38d
NO3-N *** A 0.27±0.00A 1.85±0.04B 1.81±0.04B 1.74±0.04B 1.41±0.04C
N 1.64±0.01a 21.5±0.18b 20.8±0.50bc 19.1±0.59c 15.1±0.34d
Inorganic N ** A 78.4±0.97A 126.1±1.09B 127.6±1.27BC 131.7±1.39CD 134.6±1.11D
N 86.3±0.31a 124.1±2.21b 133.6±1.48c 132.5±1.86c 137.0±3.06c
Microbial
Biomass N ***
A 169.1±0.78A 214.4±3.30B 219.7±4.57B 219.5±1.03B 214.8±3.91B
N 158.5±2.02a 199.8±5.09bc 198.9±0.89b 196.1±0.41c 199.3±1.66bc
Microbial
Biomass C ***
A 1676.5±73.6 A 1563.2±32.9 A 1509.6±30.1 A 1415.7±14.4 B 1320.5±8.26 C
N 1632.9±97.1a 1258.5±27.6 b 1212.5±39.7bd 1056.8±45.9 cd 1066.1±64.1 d
Pot Nitrification
***
A 0.065±0.002A 0.113±0.001AB 0.100±0.004AB 0.098±0.007B 0.092±0.005C
N 0.260±0.010a 1.42±0.078b 1.29±0.031bc 1.43±0.099b 1.05±0.095c

108
Except for soil microbial biomass N and potential N mineralization rate, there
was a significant effect of drying-rewetting treatment on the percent change of all
analyzed variables (Table 2). The percent change of soil NH4+-N in both N treatments
and of inorganic N in ambient soils increased concurrently and significantly with the
number of drying-rewetting cycles (Figure 1a and c). The percent change of soil NO3--N
in both N treatments, of microbial biomass C and potential microbial respiration in
ambient soils, and of potential nitrification in N-treated soils were negatively and
significantly affected by the number of drying-rewetting cycles (Figure 1b, e, f and h).
Soil N treatment significantly affected the percent change of all variables, except for
microbial biomass N and C (Table 2, Figure 1). Nitrogen addition positively affected
the percent change of all variables, excepting that of NO3--N, potential nitrification and
potential mineralization. There was a significant N x drying-rewetting treatments
interaction for the percent change of soil NO3--N and potential nitrification and
microbial respiration rates (Table 2).
Pot
Mineralization
A 0.92±0.19A 1.68±0.18B 1.89±0.30B 1.45±0.11AB 1.77±0.15B
N 1.06±0.02a 1.44±0.21ab 1.74±0.33b 1.69±0.28ab 1.35±0.74ab
Pot microbial
respiration ***
A 41.7±1.79A 23.2±0.73B 23.0±0.23B 23.6±0.74B 21.0±0.19C
N 43.6±1.79a 17.7±0.29b 19.2±0.10c 17.8±0.15b 18.4±0.45bc
CO2-C *** A 73.8±1.42A 30.4±0.02B 42.2±2.70C 35.8±0.79D 30.6±1.10B
N 93.4±2.16a 23.2±1.68b 32.6±0.76c 29.5±1.98cd 28.5±0.41d
N2O-N *** A -0.037±0.11A 6.74±0.32B 5.06±0.17C 3.36±0.20D 1.52±0.22E
N -0.258±0.33a 28.6±0.53b 35.9±4.34b 26.5±2.71b 16.1±0.61c
CH4-C *** A -64.6±1.59A -49.9±1.06B -48.1±3.44BC -44.3±1.79C -38.4±1.97C
N -50.2±1.47a -2.02±0.79b -0.70±1.21b -3.33±2.28bc -5.95±1.22c
NH4-N, NO3-N, inorganic N and microbial biomass N are expressed in ug N gr dry soil-1; microbial biomass C is expressed in ug C gr dry soil-1; potential N mineralization and nitrification are expressed in ug N gr dry soil day-1; potential microbial respiration is expressed in ug C gr dry soil day-1; CO2-C and CH4-C are expressed in mg C Kg soil-1 day-1; and N2O-N is expressed in mg N Kg soil-1 day-1.

109
Table 2. Summary of permutational-repeated measures ANOVA exploring the effect of N-and drying-rewetting (D-R) treatments on the percent change of the studied variables. Ambient (A) and N-treated (N) soils were also analyzed separately for all variables in order to assess the effect of the drying-rewetting treatment in both of them (9999 permutations, P < 0.05)
All soils combined Ambient and N-treated separated
df Pseudo-F P Soil df Pseudo-F P
NH4+-N N-treat 1 17.612 <0.001
D-R treat 2 10.895 <0.001 A 2 5.678 0.029
N xD-R 2 0.657 0.526 N 2 6.571 <0.001
NO3--N N-treat 1 27.923 <0.001
D-R treat 2 45.604 <0.001 A 2 15.201 0.001
N x D-R 2 7.011 0.006 N 2 28.946 <0.001
Inorganic N N-treat 1 7.067 0.015
D-R treat 2 3.455 0.046 A 2 5.118 0.038
N x D-R 2 0.895 0.419 N 2 0.979 0.423
Microbial N-treat 1 4.444 0.052
biomass N D-R treat 2 0.301 0.739 A 2 0.558 0.592
N x D-R 2 0.878 0.435 N 2 1.236 0.337
Microbial N-treat 1 2.668 0.117
biomass C D-R treat 2 6.613 0.007 A 2 11.735 0.001
N x D-R 2 0.662 0.525 N 2 2.309 0.145
Potential N-treat 1 5.626 0.026
nitrification D-R treat 2 5.529 0.009 A 2 0.530 0.602
N x D-R 2 3.852 0.040 N 2 4.917 0.035
Potential N-treat 1 4.601 0.039
mineralization D-R treat 2 0.316 0.736 A 2 1.062 0.394
N x D-R 2 0.409 0.679 N 2 0.186 0.834
Potential
microbial
N-treat 1 436.25 <0.001
D-R treat 2 4.229 0.031 A 2 6.241 0.023
respiration N x D-R 2 5.615 0.013 N 2 3.017 0.109
CO2-C N-treat 1 0.004 0.971
D-R treat 2 12.201 <0.001 A 2 11.222 <0.001
N x D-R 2 3.899 0.031 N 2 2.247 0.149
N2O-N N-treat 1 0.871 0.371
D-R treat 2 13.941 <0.001 A 2 70.287 <0.001
N x D-R 2 3.437 0.049 N 2 8.981 0.004

110
CH4-C N-treat 1 17.318 <0.001
D-R treat 2 0.204 0.813 A 2 3.775 0.047
N x D-R 2 6.275 0.005 N 2 2.525 0.118
Figure 1. Percent changes of soil NH4+ (a), NO3- (b), inorganic N (c), microbial biomass N (d), microbial biomass C (e), potential nitrification (f), potential mineralization (g) and potential microbial respiration (h) measured following incubation in ambient and N-treated soils. Values are means ± standard error. Different letters show statistically significant differences at P < 0.05. Asterisks indicate significant differences between N treatments (* means p<0.05, ** means p<0.01)
Drying-rewetting treatment significantly altered resistance of soil NH4+-N, NO3-
-N and microbial biomass C (Table 3). Resistance of NH4+-N and NO3--N in both N
treatments, and of inorganic N, microbial biomass C, and microbial respiration in
ambient soils decreased with the number of drying-rewetting cycles (Table 3, Figure 2).

111
Resistances of soil NH4+-N, inorganic N, and potential mineralization rate were
significantly and negatively affected by N-fertilization, whereas the effect on the
microbial biomass N resistance was significant and positive (Table 3, Figure 2). A
significant N x drying-rewetting treatments interaction was also observed for
resistance in potential microbial respiration (Table 3).
Table 3. Summary of permutational-repeated measures ANOVA exploring the effect of N and drying-rewetting (D-R) treatments on the Orwin-Wardle resistance index (RS) of the studied variables. Ambient (A) and N-treated (N) soils have been analyzed separately for all variables in order to assess the effect of the drying-rewetting treatment in both of them (9999 permutations, P < 0.05). All soils combined Ambient and N-treated separated
df Pseudo-F P Soil df Pseudo-F P
NH4+-N N treat 1 32.896 <0.001
D-R treat 2 10.143 <0.001 A 2 5.315 0.033
N xD-R 2 0.972 0.392 N 2 6.485 0.007
NO3--N N treat 1 1.900 0.181
D-R treat 2 41.587 <0.001 A 2 18.138 <0.001
N x D-R 2 0.665 0.522 N 2 23.697 <0.001
Inorganic N N treat 1 8.711 0.007
D-R treat 2 2.959 0.069 A 2 4.553 0.043
N x D-R 2 0.565 0.572 N 2 0.936 0.423
Microbial N treat 1 9.200 0.009
biomass N D-R treat 2 0.295 0.745 A 2 1.224 0.325
N x D-R 2 1.584 0.240 N 2 0.604 0.578
Microbial N treat 1 0.918 0.341
biomass C D-R treat 2 4.724 0.022 A 2 16.355 <0.001
N x D-R 2 0.640 0.537 N 2 1.462 0.271
Potential N treat 1 0.002 0.878
nitrification D-R treat 2 3.137 0.063 A 2 0.500 0.602
N x D-R 2 0.619 0.549 N 2 3.743 0.052
Potential N treat 1 7.165 0.014
mineralization D-R treat 2 0.946 0.397 A 2 0.651 0.533
N x D-R 2 1.386 0.263 N 2 1.565 0.248
Potential
microbial
N treat 1 0.542 0.482
D-R treat 2 2.994 0.059 A 2 11.217 0.004
respiration N x D-R 2 9.211 0.002 N 2 3.600 0.072

112
CO2-C N treat 1 7.543 0.014
D-R treat 2 13.646 <0.001 A 2 13.383 <0.001
N x D-R 2 1.441 0.257 N 2 2.789 0.105
N2O-N N treat 1 5.311 0.034
D-R treat 2 9.413 0.002 A 2 63.434 <0.001
N x D-R 2 2.600 0.097 N 2 2.211 0.151
CH4-C N treat 1 53.99 <0.001
D-R treat 2 2.797 0.079 A 2 2.708 0.109
N x D-R 2 2.368 0.116 N 2 1.149 0.344
Figure 2. Orwin and Wardle Resistance index for soil NH4+ (a), NO3- (b), inorganic N (c), microbial biomass N (d), microbial biomass C (e), potential nitrification (f) potential mineralization (g) and potential microbial respiration (h) measured following incubation in

113
ambient and N-treated soils. Values are means ± standard error. Different letters show statistically significant differences at P < 0.05. Asterisks indicate significant differences between N treatments (* means p<0.05, ** means p<0.01)
Trace gases
Soil CO2 (F=19.87, P<0.0001) and N2O (F=14.63, P<0.0001) emissions were
significantly affected by drying-rewetting treatment. Emissions of CO2 and N2O
decreased from D1 to D4 in both N treatments whereas CH4 uptake decreased from D0
to D4 in ambient soils and increased from D1 to D4 in N-treated soils (Table 1). Soil N
treatment significantly affected all trace gases variables, positively to N2O and CH4 and
negatively to CO2 (Table 1). We also found a significant N x drying-rewetting
treatments interaction for N2O and CH4 (F=6.51, P<0.001; F=7.16, P=0.001, respectively).
The percent change of CO2 and N2O emissions were significantly affected by
drying-rewetting treatment (Table 2). Percent change of CO2 emission in both N
treatments and CH4 uptake in ambient soils decreased significantly with the number of
drying-rewetting cycles (Figure 3a and c), whereas the opposite trend was found for
that of N2O emission in both N treatments and for that of CH4 uptake in N-treated soils
(Figure 3b). Percent change of CH4 uptake, but not of CO2 or N2O emissions, was
significantly affected by soil N treatment (Table 2, Figure 3). This percent change of
CH4 was increasing as the number of drying-rewetting treatments increased, but in the
opposite direction for each N treatment (positively in the case of N-treated soils and
negatively in the ambient ones). We also found a significant N x drying-rewetting
treatments interaction for the percent change of all trace gases variables (Table 2).

114
Figure 3. Percent changes of soil: atmosphere CO2-C (a), N2O-N (b) and CH4-C (c) exchange measured following incubation in ambient and N-treated soils. Values are means ± standard error. Different letters show statistically significant differences at P < 0.05. Asterisks indicate significant differences between N treatments (* means p<0.05, ** means p<0.01)
The resistances of CO2 and N2O emissions were also significantly altered by the
drying-rewetting treatment (Table 3). In both N treatments, the resistance of CO2
emissions was higher in D4 than in D1, whereas that of N2O emission showed the
opposite trend (Figure 4a and b). We also observed a significant N treatment effect on
the resistances of trace gases soil:atmosphere exchange with lower values of resistance
of CO2 emissions and higher values of that of N2O emissions and CH4 uptake in N-
treated than in ambient soils (Table 3, Figure 4).

115
Figure 4. Orwin and Wardle Resistance index for soil: atmosphere CO2-C (a), N2O-N (b) and CH4-C (c) exchange measured following incubation in ambient and N-treated soils. Values are means ± standard error. Different letters show statistically significant differences at P < 0.05. Asterisks indicate significant differences between N treatments (* means p<0.05, ** means p<0.01)
Microbial functional diversity
Soil N treatment significantly and positively affected the microbial functional
diversity (F=6.44, P=0.015), whereas we did not find any effect of drying-rewetting
treatment on this variable (Figure 5). The PCA did show an evident separation between
N treatments, but it was not clear the discrimination of the drying-rewetting treatment
(Figure 6).

116
Figure 5. Shannon-Weaver soil microbial functional diversity index following incubation in ambient and N-treated soils. Values are means ± standard error.
Figure 6. Principal-component analyses of soil microbial functional diversity data following incubation in ambient and N-treated soils.
117
Discussion
Our results support our first hypothesis, demonstrating that the projected
climate change-driven increase in the frequency of drying-rewetting cycles affects the
ability of soil to cycle C and N and the soil:atmosphere GHGs exchange. Our study also
shows that not all studied variables are equally affected by different drying-rewetting
frequency scenarios, with some variables such as microbial biomass N, N
mineralization rate and microbial functional diversity appearing to be more resistant to
changes, independently of the previous N supply conditions, than mineral N,
microbial biomass C or trace gasses fluxes. Further, the drying-rewetting treatment
affected more to the percent change and resistance of ambient than N-treated soils,
which gives support to our second hypotheses about the modulator effect of the N
supply conditions.
Different mechanisms could explain the observed increases in NH4+ and
mineral N in both N treated and ambient soils in response to the increase in the
number of drying-rewetting cycles. Frequent drying-rewetting can cause soil aggregate
disruption and release of physically protected organic matter (Adu and Oades, 1978;
Lundquist et al., 1999a). Through this mechanism, previously protected soil organic
matter can be exposed to microbial attack and mineralization (Appel, 1998; Miller et al.,
2005). Alternatively, frequent changes in soil moisture related to rewetting can induce
microbes to undergo osmotic shock and cell lyses due to the rapid change in water
potential (Harris 1981; Kieft et al., 1987). This decrease in the amount of microbes
reduces the mineral N that is consumed, which facilitates its accumulation. Also,
microbes surviving osmotic shock must release intracellular solutes (Halverson et al.,
2000; Schimel et al., 2007) which involve labile N and C solutes that can be easily
mineralized by the extant microbes, thus allowing a pulse of inorganic N (Birch, 1959;
Kieft et al., 1987). It is interesting to note that the inorganic N pool consisted almost
entirely of NH4+, and a flush of NH4+ related to soil rewetting has been earlier reported
by others researches (Birch, 1959; Cabrera, 1993).
These results are consistent with the observed significant decrease in soil CO2
emissions and microbial biomass C (in both N treatments), and in soil microbial
respiration (in ambient soil) with the increased amount of drying-rewetting cycles.
Microbes might have been suffering from the stress of frequent drying-rewetting
treatments, which likely led to the above described substrate release and a decrease of

118
soil microbial respiration. This assumption is consistent with a number of studies that
have found a decrease in microbial biomass after drying-rewetting events (Sorensen,
1983; Van Gestel et al., 1996), and support the idea that increased drying-rewetting
cycles due to projected climate change will negatively affect the development of soil
microbial populations (Xiang et al., 2008). Further, we show that, concurrently to the
increase of microbial death, surviving microbes under stress may have modified its
metabolism by accelerating nutrient (i.e. N) turnover (Mamilov and Dilly, 2002), which
is consistent with other studies that exposed soil microbes to different types of stresses
(Fließbach et al., 1994; Moreno et al., 1999; Pratt and Barreiro, 1998) and supports the
idea that enhanced metabolism rates is likely a microbial unspecific response to the
stress (Selye, 1950).
The contrasted difference between the slightly declining trend in microbial
biomassin N-treated soils and the abrupt microbial decline in ambient soils responding
to increased drying-rewetting cycles supports the hypothesized modulator effect of the
previous N supply. This modulation might be due to the greater microbial functional
diversity found in N-treated soils (compared to ambient soils), which has been shown
to allow microbes to cope better with disturbances such as drastic osmotic shock upon
soil rewetting (Allison and Martiny, 2008). Alternatively, the higher mineral N content
found in the N-treated soils might have helped microbes to overcome the drying-
rewetting stress better than in the ambient plots as the ability of soil microorganisms to
regulate the osmotic pressure in presence of rapid changes in soil moisture relies in
part in their capability to make a large investment of resources and, therefore, in the
nutritional status of the soil (Bottner, 1985; Van Gestel et al., 1993; Schimel et al., 2007).
It has been proved that the frequency of drying-rewetting cycles has
consequences for soil C mineralization rates (Fierer and Schimel, 2002; Mikha et al.,
2005; Xiang et al., 2008). In our study, one drying-rewetting stress (D1) consistently
produced a significant increase in C mineralization (i.e. CO2 emissions) respect to
samples that not experience any stress (D0). Further, C mineralization decreased as we
increased the amount of drying-rewetting cycles from 1 to 4. These findings are
consistent with a number studies that show decreases in C mineralization rates when
increasing the frequency of drying-rewetting cycles (Magid et al., 1999; Fierer and
Schimel, 2002; Mikha et al., 2005). The pattern found in the response of CO2 emissions
in our study could be explained by the combination of two different mechanisms. First,
the disruption of the soil structure and physically protected organic matter with the
119
first drying-rewetting cycle, which could lead to an increase in the material available
for microbes and, therefore, the mineralization of C. Then, after a series of drying-
rewetting events, this labile organic matter is reduced by the microbial uptake,
diminishing the size of the CO2 pulse. Second, an increase in microbial mortality as we
enhance the frequency of drying-rewetting cycles, supported by the observed decrease
in C microbial biomass, could also be behind the C mineralization response (Fierer and
Schimel, 2003).
The effect of drying-rewetting cycles on NO3- was roughly parallel to that on
potential nitrification rate, C mineralization and C microbial biomass, suggesting a
notable decrease in the nitrifier population in frequently stressed soils. Other studies
found similar results following repeated drying-rewetting cycles (Franzluebbers et al.,
1994; Xiang et al., 2008). This finding is also supported by the observations of Stark and
Firestone (1995), who concluded that nitrifiers are highly sensitive to moisture stress.
Since soil NO3- and/or its production have been demonstrated to largely determine
denitrification rates, the observed reductions in the NO3- content and in the nitrification
rate with the frequency of drying-rewetting cycles could be linked to the observed
decrease of N2O emissions in our soils with the drying-rewetting cycles increase.
Although the soil moisture in our incubations should not have led to extended
anaerobic conditions (a traditionally assumed requirement for denitrification
processes), it has been recently proved that small areas suffering brief periods of low
O2 availability can be of great relevance emitting significant amounts of N2O, especially
in N-rich soils (McClain et al., 2003; Groffman et al., 2009). In addition, Groffman (2012)
demonstrated that soil texture and N and C mineralization may produce large spatial
and temporal variation in N2O emissions; and Robertson et al. (1995) showed that
heterotrophic nitrifiers bacteria such as Alcaligenes faecalis and Thiosphaera
pantotrophacan denitrify under aerobic conditions. Regarding the comparison between
soils, N treatment significantly increased the N2O emissions compared to ambient soils,
adding more evidence to the dependence of denitrification on the availability soil NO3-
(Flessa and Beese, 2000).
Long-term N enrichment diminished soil CH4 uptake, whereas the direction of
the effect of drying-rewetting cycles on this gas fluxes varied depending on the soil N
previous conditions. The main driver of soil CH4 uptake is accepted to be the soil
physical conditions that determine soil diffusion rates (Ridgwell et al., 1999), but
inorganic N availability have also been recognized to affect this flux (Steudler et al.,

120
1989; Mosier et al., 1991). Consistent with our results, previous studies have also
reported reduced CH4 uptake in N fertilized soils due to additional C substrates
compared to unfertilized soils (Lu et al., 2000; Zheng et al., 2007). We observed an
increase in the CH4 uptake in frequently stressed N-treated soils, but the opposite trend
in ambient soils. These findings highlight the importance of the increased soil N inputs
on the climate change through its effect on greenhouse gasses emissions, but also
suggest previous soil N conditions as a significant modulator of the drying-rewetting
stress effect on something so important such as the soil feedback to the climate change.
The percent change of most of the variables was affected by the drying-
rewetting cycles. In addition, when analyzing N treatments separately, both the
percent change and the RS index show that the ambient soils were consistently more
sensitive to the drying-rewetting treatment. These findings add further evidence to the
idea that while the intensification of drying-rewetting cycles will trigger changes in
ecosystem processes (Fenn et al., 1998; Driscoll et al., 2003; Borken and Matzner, 2009),
higher N supply may contribute to stabilize crucial ecosystem processes, hence making
soils more resistant to the projected climate change. Interestingly, while in ambient
soils, the percent change and the resistance of both C- and N-related variables were
equally affected by the drying-rewetting treatment, in N-treated soils none of the C-
related variables were affected. This unexpected finding seems to add a new
dimension to the widespread idea that N addition can have a stabilization effect on soil
C (Janssens et al. 2010; Rodríguez et al., under review).
The long-term N addition not only had an effect in the size and functionality of
the microbial population, but also in the soil microbial functional diversity. The
increased microbial functional diversity observed in N-treated soils compared with
ambient soils contrasts with previous studies that reported a decrease in microbial
diversity with N additions (Campbell et al., 2010) or no significant effects of this
treatment on bacterial diversity (Ramirez et al., 2010; Fierer et al., 2011). These different
findings among studies suggest that the effects of N amendments on bacterial diversity
levels are variable and likely site-dependent (Fierer et al., 2011). On the other hand, we
did not find a change in the functional diversity of soil microbial community due to the
increased frequency of drying-rewetting cycles. Three mechanisms found in literature
may explain this lack of response. First, microbial communities are metabolically very
flexible and physiologically tolerable to environmental changes resulting in microbial
populations surprisingly resistant to change (Meyer et al., 2004). Second, soil microbial

121
adaptation to drying-rewetting stress can occur without change in its diversity by
developing strategies such as the building of thicker polysaccharide layers (Roberson
and Firestone, 1992) or the accumulation of higher levels of osmoprotective solutes
(Kempf and Bremer, 1998). And third, microbial communities can maintain their
functionality despite stresses due to functional redundancy (Allison and Martiny,
2008). It is important to note that while our soils were subjected to 16 years of N
addition, they just experienced the different drying-rewetting stresses for a short-term
period. Thus, how these soils microbial diversity and functionality would response to
long-term drying-rewetting and N addition interactive stresses is yet to be explored.
We conclude that the ability of temperate forests soils to cycle C and N will be
significantly altered by the changes in precipitation patterns projected by future
climate change scenarios. Our results demonstrate that repeated drying-rewetting
cycles are likely to modify C and N cycling through changes in soil inorganic N pools,
C and N mineralization rates, and GHG emissions, with likely implications in the
ecosystem function. Further, our study highlights the key role of N supply as
modulator of the responses of soil variables to increased drying-rewetting cycles.
While the atmospheric N deposition could minimize the impacts of the expected
increase in drying-rewetting cycles with the climate change on important soil
processes, this modulator effect could be stronger for the C than the N cycle. Our
results emphasize that a better understanding of the interactive effect of different
global change factorsis necessary in order to accurately model the effects of the global
change on ecosystem processes.
Acknowledgements
We thank Lisa Martel, Kate Shepard and Cristina Allely for excellent laboratory
and data analysis work. L. M. was supported by a PhD fellowship of the Spanish
Ministry of Education, and a short-research stay grant of the Pablo de Olavide
University. J. D. was supported by a Fulbright fellowship of the Spanish Ministry of
Education, and a Postdoctoral Grant of the Portuguese Science and Technology
Foundation (SFRH/BDP/87966/2012). A. R. was supported by a Fulbright fellowship
of the Spanish Ministry of Education, and by the Spanish National Research Council
(CSIC) in the JAE-doc modality co-financed by the European Social Fund (ESF).


123
8. DISCUSIÓN GENERAL
A lo largo de esta tesis hemos analizado los efectos que los cambios en el patrón
de precipitación pueden inducir a diferentes niveles de los ciclos de nutrientes, los
microorganismos del suelo y la emisión de gases de efecto invernadero,
desencadenando una serie de respuestas que pueden llegar a afectar en última
instancia a la dinámica y el funcionamiento del ecosistema. Además, hemos
determinado la gran importancia del efecto modulador tanto de la costra biológica del
suelo como de la deposición atmosférica de N sobre las respuestas de las variables de
estudio a los cambios en los ciclos de secado y rehumedecido del suelo. A
continuación, se discutirán tanto los patrones comunes como las diferencias entre los
distintos ecosistemas y tratamientos aplicados encontrados en los distintos capítulos de
esta tesis.
En los capítulos 1, 2, 4 y 5 se evalúa cómo responde el pool de N y su
disponibilidad a distintos cambios en el patrón de precipitación. En todos ellos
encontramos una evidente respuesta de estas variables a los cambios en la humedad
del suelo. Tanto en el capítulo 4 como en el 5, encontramos que estos cambios en el
patrón de precipitaciones provocarían un importante efecto sobre las tasas metabólicas
microbianas. Sin embargo, mientras que en el capítulo 4 se muestra una intensificación
de estas tasas, en el capítulo 5 encontramos la tendencia opuesta. Probablemente estas
diferentes respuestas estén debidas a las grandes diferencias que hay entre un
ecosistema semiárido (zona de estudio del capítulo 4) y uno templado (zona de estudio
del capítulo 5). A pesar de esta disimilitud, podemos concluir que en las tres zonas de
estudio, que abarcan una amplia gama de ecosistemas, la actividad microbiana está
principalmente limitada por la humedad del suelo. Esta dependencia de la actividad
microbiana del contenido hídrico del suelo en diversos ecosistemas ha sido observada
previamente por otros investigadores (Van Gestel et al. 1993, Jenerette & Chatterjee,
2012; Curlevski et al., 2014). Esta consistente dependencia probablemente se deba a que
en todos los ecosistemas el rehumedecido del suelo supone un estrés (más o menos
fuerte) para los microorganismos, obligándolos a hacer una inversión energética para
sobrevivir. Estos costes energéticos pueden llegar a tener importantes consecuencias
sobre el funcionamiento de los ecosistemas (Shimel et al. 2007).
Mientras que en el capítulo 1 concluíamos que un futuro con ciclos de secado y
rehumedecido del suelo más intensos y frecuentes podría llegar a producir grandes

124
pérdidas de N inorgánico en ecosistemas mediterráneos, nuestros resultados en un
ecosistema semiárido (capítulo 4) y en uno templado (capítulo 5) indican la tendencia
opuesta. Debido a la similitud entre el ecosistema semiárido y los mediterráneos,
esperábamos que respondieran a los cambios en el patrón de las precipitaciones de una
forma parecida, y a la vez diferente al ecosistema templado. El hecho de que el capítulo
1 se haya llevado a cabo en el campo con un diseño experimental no manipulativo, y
los capítulos 4 y 5 se hayan realizado en el laboratorio sometiendo a las muestras de
suelo a distintos tratamientos de riego, nos lleva a pensar en la posibilidad de que estas
diferencias se deban a disimilitudes en los diseños experimentales y en los tratamientos
aplicados. Previas investigaciones han relacionado las diferencias en las respuestas de
los procesos del suelo a los diseños experimentales manipulativos (Borken & Matzner,
2009).
Los resultados obtenidos en el capítulo 4 sugieren que los microorganismos
nitrificantes no son especialmente sensibles al estrés hídrico, sin embargo en el capítulo
5 encontramos una notable disminución en la población nitrificante en los suelos
frecuentemente estresados por los ciclos de secado y rehumedecido del suelo. La
bibliografía referente a este tema es controvertida. Por un lado, hay estudios que
destacan el hecho de que los organismos nitrificantes son en su mayoría gram
negativos (Schimel 1995b) y por lo tanto son más sensibles al estrés que otros microbios
(Franzluebbers et al., 1994; Xiang et al., 2008). Otros estudios respaldan que los
procesos de mineralización se ven menos afectados por el estrés hídrico que otros
procesos microbianos (Reynolds et al., 1999; Smolander et al., 2005). Nuestros
resultados sugieren que los microorganismos nitrificantes de ecosistemas semiáridos
podrían estar más adaptados al estrés hídrico que los de ecosistemas templados, ya que
están sometidos a ciclos de secado y rehumedecido del suelo más frecuentes.
Un estudio reciente desarrollado por Jenerette & Chatterjee (2012) ha sugerido
la idea de que las respuestas a los ciclos de secado y rehumedecido del suelo son
desencadenadas por el humedecido del suelo, pero están reguladas por la limitación de
recursos. Ya que los capítulos 1, 2 y 3 de esta tesis se han llevado a cabo en dos
ecosistemas mediterráneos con diferentes fertilidades, hemos querido contrastar esta
hipótesis en nuestra zona de estudio. Dado que el suelo del pinar tenía una mayor
disponibilidad de recursos que el del matorral, tales como C lábil y pool de nutrientes
(Austin, 2011; Collins et al., 2008; Ma et al., 2012), nosotros esperábamos encontrar una
mayor respuesta a los pulsos de humedad en el pinar. Sin embargo, en los capítulos 1 y

125
2 encontramos que la variabilidad del pool de nutrientes fue similar en los dos
ecosistemas, y que por lo tanto la variabilidad de las variables de estudio no estaba
asociada al tamaño del pool de C y N lábil disponible para los procesos microbianos,
dando poco apoyo a esta hipótesis. Por otro lado, en los capítulos 2, 3 y 5 hemos
encontrado un importante papel de la fertilidad del suelo en la respuesta de la
actividad microbiana a los pulsos de humedecido. En el capítulo 2, la actividad
microbiana ha resultado estar limitada por la disponibilidad de fosfato en el matorral,
lo que ha minimizado el efecto desencadenador del pulso de humedad del suelo. En
base al consumo de las fuentes de C en el capítulo 3, las muestras de suelo del pinar
mostraron una mayor diversidad de respuestas que el matorral, probablemente debido
a la menor fertilidad de los suelos del matorral, que evita que los microbios respondan
de una forma más rápida y diversa a las adiciones de C. Finalmente, en el capítulo 5,
encontramos una mayor diversidad funcional microbiana en los suelos tratados con N
que en los suelos control, esto ha podido ayudar a los microorganismos del suelo a
superar el estrés hídrico asociado a los ciclos de secado y rehumedecido facilitando la
regulación de la presión osmótica. Como consecuencia, la biomasa microbiana del
suelo tratado con N se ha visto menos perjudicada por la alta frecuencia de estreses
hídricos que la del suelo control.
En los capítulos 1, 2 y 4 hemos utilizado resinas de intercambio iónico para
estimar el efecto de los eventos de humedecido en la disponibilidad de nitrógeno del
suelo. Esta técnica que estima la toma de nutrientes por parte de las plantas (Duran et
al., 2013a) ha resultado ser una herramienta muy útil para determinar la mineralización
de nitrógeno en el suelo. En general, tener en cuenta las tasas de difusión ha mejorado
nuestro entendimiento de las respuestas del pool de N a los cambios en el patrón de
precipitación. Éste método gana importancia en ecosistemas limitados por agua como
es el caso de ecosistemas mediterráneos o semiáridos debido a la relevancia de la
difusión del suelo para la disponibilidad de nutrientes.
En esta tesis, tanto en el capítulo 2 como en el 5, hemos evaluado la respuesta
de la respiración del suelo (medida como la emisión de CO2) a los ciclos de secado y
rehumedecido. Las consecuencias de estos ciclos sobre esta variable han sido
previamente estudiadas en diferentes ecosistemas (Fierer and Schimel, 2002; Mikha et
al., 2005; Xiang et al., 2008). Mientras que en el capítulo 2 encontramos que durante la
época lluviosa, en la que se produjeron frecuentes ciclos de secado y rehumedecido del
suelo, la respiración aumentó en el pinar y disminuyó en el matorral, en el capítulo 5

126
encontramos la misma tendencia que en el matorral. Comparando los resultados de
estos dos capítulos, podemos concluir que el efecto de los ciclos de secado y
rehumedecido sobre la respiración del suelo es específica del ecosistema y que
únicamente la frecuencia de los ciclos no puede explicar esta respuesta.
Dado que no todos los miembros de la comunidad microbiana del suelo son
igualmente capaces de superar el estrés asociado con los eventos de rehumedecido
(Lundquist et al., 1999b; McLean & Huhta, 2000), cabe esperar algún tipo de presión
selectiva hacia los grupos de microorganismos que son más capaces de controlar los
choques osmóticos, como por ejemplo hongos o bacterias gran positivas (Harris, 1981).
Previos estudios han encontrado que ciclos de secado y rehumedecido del suelo más
frecuentes con respecto al control, pueden modificar la composición de la comunidad
microbiana (Chung et al. 2007; Allison & Martiny 2008; Zelikova et al. 2012). En los
capítulos 3 y 5 de esta tesis, hemos estudiado la diversidad funcional microbiana
mediante el índice de Shannon- Weaver. Mientras que en el capítulo 3 hemos
observado como la diversidad funcional varía estacionalmente, en el capítulo 5 no
hemos encontrado ninguna diferencia en esta variable en respuesta a la mayor
frecuencia de ciclos de secado y rehumedecido del suelo. Dos motivos podrían explicar
estos resultados. Por un lado, es posible que las comunidades microbianas no sean
capaces de verse modificadas rápidamente en respuesta a un cambio brusco en el
patrón de precipitaciones, si no que varíen gradualmente a lo largo de las estaciones.
Por otro lado, las diferencias entre ecosistemas mediterráneos (zona de estudio del
capítulo 3) y templados (zona de estudio del capítulo 5) también pueden explicar los
resultados encontrados en estos capítulos.
De los dos primeros capítulos de esta tesis hemos podido deducir la gran
relevancia de los ciclos de secado y rehumedecido del suelo en los ecosistemas
mediterráneos, ya que tanto los nutrientes como la respiración del suelo han resultado
depender en mayor medida de los eventos de secado y rehumedecido del suelo que de
diferencias estacionales. Estos resultados subrayan la importancia de las consecuencias
sobre los procesos del suelo que los cambios en el patrón de precipitación pueden
llegar a inducir en los ecosistemas mediterráneos (Fierer & Schimel, 2002; Casals et al.,
2009; Ouyang & Li, 2013)
En esta tesis hemos querido testar la hipótesis de Schwinning & Sala (2004), que
sugiere que en ecosistemas semiáridos, existe una jerarquía de los eventos de los pulsos

127
de humedad en el suelo que se corresponde con una jerarquía de las respuestas
ecológicas, de forma que pulsos cortos de humedecido desencadenan respuestas
ecológicas menores y pulsos más largos desencadenan respuestas ecológicas mayores y
más complejas. Para ello, en los capítulos 1, 2 y 4 hemos evaluado el efecto de la
longitud de los eventos de humedecido del suelo sobre las variables de estudio. En el
capítulo 1 encontramos una correlación negativa entre la longitud de los eventos de
humedecido y la biomasa microbiana de suelo en el pinar, mientras que en el matorral
esta correlación fue positiva para el nitrato. En ninguna de las variables estudiadas en
el capítulo 2 encontramos ningún efecto de la longitud del humedecido. En el capítulo
4 observamos como los eventos de humedecido más largos produjeron un aumento del
N mineral y del C orgánico en el suelo, sugiriendo un aumento de las tasas metabólicas
microbianas tales como la descomposición y la mineralización. Estos distintos patrones
en estos tres diferentes ecosistemas indican que los cambios en los procesos del suelo
en respuesta a la longitud de los eventos de humedecido no pueden ser explicados por
este único mecanismo, y que otros procesos y factores intervienen en estas respuestas.
En los capítulos 4 y 5 de esta tesis se estudia el papel modulador de la costra
biológica del suelo y de la adición de nitrógeno respectivamente. Mientras que en el
capítulo 4 hemos observado cómo la costra modula las tasas metabólicas microbiana
del suelo, en el capítulo 5 hemos encontrado un efecto tampón de la adición de N al
aumento en la frecuencia de los ciclos de secado y rehumedecido del suelo, así como
un incremento de la diversidad funcional microbiana. Nuestros resultados indican que
los dos factores evaluados cambiaron las respuestas de los procesos del suelo
estudiados a los cambios en el patrón de precipitación, evidenciando de esta forma su
relevancia como moduladores de las respuestas del suelo. Por lo tanto, la prevista
disminución en la cobertura de la costra biológica del suelo (Maestre et al. 2013) y el
aumento en la deposición atmosférica de nitrógeno (Schlesinger 2013) pueden llegar a
tener consecuencias sobre los balances de los ciclos de C y N en el suelo.
En general, todos los capítulos de esta tesis coinciden en que dado que el
contenido hídrico determina la actividad microbiana del suelo (Austin et al, 2004;
Morillas et al. 2013), un cambio en el patrón de precipitaciones como el que los
modelos del cambio climático predicen, puede llegar a modificar la estructura y la
función de la comunidad microbiana del suelo, así como el balance de C y N y la
emisión de gases de efecto invernadero no sólo en ecosistemas limitados por la

128
disponibilidad de agua (Rustad et al. 2000; Easterling et al. 2000), sino también en otro
tipo de ecosistemas como los templados.

129
9. CONCLUSIONES GENERALES
1. En los cuatro ecosistemas que se han estudiado en esta tesis, la actividad microbiana
ha demostrado estar principalmente limitada por la humedad del suelo. Dado que las
comunidades microbianas, en última instancia, son las que determinan los ciclos
biogeoquímicos, los cambios en el patrón de precipitaciones podrían llegar a afectar al
balance de los ciclos del N y del C.
2. Los diseños experimentales manipulativos comparados con los no manipulativos
pueden producir resultados inconsistentes e incluso contradictorios, probablemente
debido a variaciones en el diseño experimental, temperaturas y humedades de
incubación, propiedades del suelo y tratamientos.
3. Los microorganismos nitrificantes de ecosistemas semiáridos podrían estar más
adaptados al estrés hídrico que los de ecosistemas templados, ya que están sometidos a
ciclos de secado y rehumedecido del suelo más frecuentes.
4. Tomar en consideración las tasas de difusión mediante el uso de resinas de
intercambio iónico ha mejorado nuestro entendimiento de las respuestas del pool de N
a los cambios en el patrón de precipitación, especialmente en ecosistemas limitados por
agua debido a la relevancia de la difusión del suelo para la disponibilidad de
nutrientes.
5. El efecto de los ciclos de secado y rehumedecido sobre la respiración del suelo es
específica del ecosistema, y únicamente la frecuencia de los ciclos no puede explicar
esta respuesta.
6. Es posible que las comunidades microbianas no sean capaces de verse modificadas
rápidamente en respuesta a un cambio brusco en el patrón de precipitaciones, si no que
varíen gradualmente a lo largo de las estaciones.
7. En los ecosistemas mediterráneos, los procesos del suelo parecen depender en mayor
medida de los eventos de secado y rehumedecido del suelo que de diferencias
estacionales, subrayando la importancia que los cambios en el patrón de
precipitaciones pueden llegar a tener en estos ecosistemas.
8. La costra biológica del suelo modifica la respuesta del pool de N a los eventos de
humedecido, produciendo mayores o más rápidas respuestas microbianas en
comparación con el suelo desnudo. Estos resultados evidencian su efecto modulador y
subrayan la relevancia de la costra como un factor clave en los ciclos del C y N en
ecosistemas semiáridos.

130
9. Mientras que la deposición atmosférica de N puede minimizar el impacto sobre los
procesos del suelo del aumento previsto de los ciclos de secado y rehumedecido con el
cambio climático, este efecto modulador puede ser mayor para en ciclo del C que para
el del N.

131
10. REFERENCIAS
Adu J, Oades J (1978) Physical factors influencing decomposition of organic materials
in soil aggregates. Soil Biol Biochem. 10: 109– 115
Agarwal AS, Singh BR, Kanehiro Y (1979) Soil nitrogen and carbon mineralization as
affected by drying-rewetting cycles. Soil Sci Soc Am Proc. 35: 96–100
Alexander RW, Calvo A (1990) The influence of lichens on slope processes in some
Spanish badlands. In: Thornes JB (Ed).Vegetation and Erosion. J Wiley & Sons,
Chichester, pp. 385–398
Allen SE, Grimshaw HM, Rowland AP (1986) Chemical analysis. In: Moore PD,
Chapman SB (Eds). Methods in Plant Ecology. Blackwell Scientific Publications,
Oxford. pp. 285– 343
Allison SD, Martiny JBH (2008) Resistance, resilience, and redundancy in microbial
communities. PNAS. 105 (1): 11512–11519
Anderson MJ (2001) A new method for non-parametric multivariate analysis of
variance. Austral Ecol. 26: 32–46
Appel T (1998) Non-biomass soil organic N—the substrate for N flushes following soil
drying-rewetting and for organic-N rendered CaCl2-extractable upon soil
drying. Soil Biol Biochem. 30: 1445–1456
Austin AT (2011) Has water limited our imagination for aridland biogeochemistry?
Trends Ecol Evol. 26 (5): 229-235. Doi: 10.1016/j.tree.2011.02.003
Austin AT, Yahdjian L, Stark JM, Belnap J, Porporato A, Norton U, Ravetta DA,
Schaeffer SM (2004) Water pulses and biogeochemical cycles in arid and
semiarid ecosystems. Oecologia. 141: 221–235
Balota EL, Filho AC, Andrade DS, Dick RP (2004) Long-term tillage and crop rotation
effects on microbial biomass and C and N mineralization in a Brazilian oxisol.
Soil Tillage Research. 77: 137–145
Banning NC, Lalor BM, Cookson WR, Grigg AH, Murphy DV (2012) Analysis of soil
microbial community level physiological profiles in native and post-mining
rehabilitation forest: Which substrates discriminate? Appl Soil Ecol. 56: 27–34
Barber SA (1995) Soil nutrient bioavailability: a mechanistic approach. Wiley, New
York

132
Bates BC, Kundzewicz ZW, Wu S, Palutikof JP (2008) Climate change and water,
technical paper of the intergovernmental panel on climate change. IPCC
Secretariat, Geneva
Bauthus J, Barthel R (1995) Mechanisms for carbon and nutrient release and retention
in beech forest gaps. II. The role of soil microbial biomass. Plant Soil. 168–169:
585–592
Bell C, McIntyre N, Cox S, Tissue D, Zak J (2008) Soil microbial responses to temporal
variations of moisture and temperature in a Chihuahuan desert grassland. Microb
Ecol. 56: 153–167
Bell C, Acosta-Martinez V, McIntyre N (2009) Linking microbial community structure
and function to seasonal differences in soil moisture and temperature in a
Chihuahuan desert grassland. Microb Ecol. 58: 827–842
Belnap J (1995) Surface disturbances: their role in accelerating desertification. Environ
Monit Assess. 37: 9–57
Belnap J (2002) Nitrogen fixation in biological soil crusts from southeast Utah. USA.
Biol Fert Soils. 35: 128–135
Belnap J (2006) The potential roles of biological soil crusts in dryland hydrologic cycles.
Hydrol Processes. 20: 3159–3178
Belnap J, Lange OL (2003) Biological Soil Crusts: Structure, Function, and Management.
Springer Verlag, Berlin
Belnap J, Phillips SL, Flint S, Money J, Caldwell M (2008) Global change and biological
soil crusts: effects of ultraviolet augmentation under altered precipitation
regimes and nitrogen additions. Glob Chang Biol. 14: 670–686
Bernstein L (2007) An Assessment of the Intergovernmental Panel on Climate Change
p. 52
Birch HF (1959) Further observations on humus decomposition and nitrification. Plant
Soil. 11: 262–286
Birch HF (1964) Mineralization of plant nitrogen following alternate wet and dry
conditions. Plant Soil. 20: 43–49
Blodau C, Basiliko N, Moore TR (2004) Carbon turnover in peatland mesocosms
exposed to different water table levels. Biogeochemistry. 67: 331–351
Bolton H, Smith JL, Link SO (1993) Soil microbial biomass and activity of a disturbed
and undisturbed shrub-steppe ecosystem. Soil Biol Biochem. 25: 545–552. Doi:
10.1016/0038-0717(93)90192-E

133
Boon Goh T, Mermut AR (2007) Carbonates. In: Carter MR, Gregorich E (Eds). Soil
Sampling and Methods of Analysis. 2nd edn. CRC Press.
Borken W, Davidson EA, Savage K, Gaudinski J, Trumbore SE (2003) Drying and
wetting effects on CO2 release from organic horizons. Soil Sci Soc Am J. 67:
1888–1897
Borken W, Savage K, Davidson EA, Trumbore SE (2006) Effects of experimental
drought on soil respiration and radiocarbon efflux from a temperate forest soil.
Glob Change Biol. 12: 177–193
Borken W, Matzner E (2009) Reappraisal of drying and wetting effects on C and N
mineralization and fluxes in soils. Glob Change Biol. 15: 808–824,
Doi: 10.1111/j.1365-2486.2008.01681.x
Bottner P (1985) Response of microbial biomass to alternate moist and dry conditions
in a soil incubated with 14C and 15N-labelled plant material. Soil Biol Biochem.
17: 329–337. Doi: 10.1016/0038-0717(85)90070-7
Boyer JN, Groffman PM (1996) Bioavailability of water extractable organic carbon
fractions in forest and agricultural soil profiles. Soil Biol Biochem. 28: 783–790
Bremner JM (1997) Sources of nitrous oxide in soils. Nutrient Cycling Agroecosyst 49:
7–16
Brookes PA, Landman A, Pruden JD (1985) Chloroform fumigation and the release of
soil nitrogen: a rapid direct extraction method to measure microbial biomass
nitrogen in soil. Soil Biol Biochem. 17: 837–842. Doi: 10.1016/0038-
0717(85)90144-0.
Cable JM, Huxman TE (2004) Precipitation pulse size effects on Sonoran Desert soil
microbial crusts. Oecologia. 141: 317–324
Cabrera ML (1993) Modeling the flush of nitrogen mineralization caused by drying and
rewetting soils. Soil Sci Soc Am J. 57: 63–66
Campbell CD, Chapman SJ, Cameron CM, Davidson MS, Potts JM (2003) A rapid
microtiter plate method to measure carbon dioxide evolved from carbon
substrate amendments so as to determine the physiological profiles of soil
microbial communities by using whole soil. Appl Environ Microbiol. 69: 3593–
3599
Campbell BJ, Polson SW, Hanson TE, Mack MC, Schuur EAG (2010) The effect of
nutrient deposition on bacterial communities in Arctic tundra soil. Environ
Microbiol. 12: 1842–1854

134
Carbone MS, Winston GC, Trumbore SE (2008) Soil respiration in perennial grass and
shrub ecosystems: Linking environmental controls with plant and microbial
sources on seasonal and diel timescales. JGR-Biogeosciences 113(G2).
Doi: 10.1029/2007JG000611
Casals P, Gimeno C, Carrara A, Lopez-Sangil L, Sanz M (2009) Soil CO2 efflux and
extractable organic carbon fractions under simulated precipitation events in a
Mediterranean Dehesa. Soil Biol Biochem. 41 (9): 1915–1922
Castenholz RW, Garcia-Pichel F (2000) Cyanobacterial responses to UV-radiation. In:
Whitton BA, Potts M (Eds). The ecology of cyanobacteria. Kluwer Academic
Publishers, Dordrecht, The Netherlands. pp. 591–611
Castillo-Monroy AP, Maestre FT, Delgado-Baquerizo M, Gallardo A (2010) Biological
soil crusts modulate nitrogen availability in semi-arid ecosystems: insights from
a Mediterranean grassland. Plant Soil. 333: 21–34
Castillo-Monroy AP, Maestre FT, Rey A, Soliveres S, García- Palacios P (2011)
Biological soil crust microsites are the main contributor to soil respiration in a
semiarid ecosystem. Ecosystems. 14: 835–847
Cates RL, Keeney DR (1987) Nitrous oxide production throughout the year from
fertilized and manured maize fields. J Environ Qual. 4: 443–447
Chantigny MH, Angers DA, Kaiser K, Kalbitz K (2006) Extraction and charac-
terization of dissolved organic matter. In: Carter MR, Gregorich EG (Eds). Soil
Sampling and Methods of Analysis, second ed. Canadian Society of Soil
Science. pp. 617–635
Chantigny MH, Angers DA (2008) Carbohydrates. In: Soil Sampling and Methods of
Analysis. pp. 653–665
Chapman SJ, Campbell CD, Artz RRE (2007) Assessing CLPPs using MicroRespTM - A
comparison with biolog and multi-SIR. J Soil Sediment. 7: 406–410
Chatterjee A, Jenerette GD (2011) Spatial variability of soil metabolic rate along a
dryland elevation gradient. Landsc Ecol. 26: 1111–1123. Doi: 10.1007/s10980-
011-9632-0
Cheshire MV (1979) Nature and Origin of Carbohydrates in Soils. Academic Press,
New York.
Chow AT, Tanji KK, Gao S (2003) Production of dissolved organic carbon (DOC) and
trihalomethane (THM) precursor from peat soils. Water Research. 37: 4475–4485

135
Chung HG, Zak DR, Reich PB, Ellsworth DS (2007) Plant species richness, elevated
CO2, and atmospheric nitrogen deposition alter soil microbial community
composition and function. Glob Change Biol. 13: 980–989
Cochran VL, Elliott LF, Lewis CF (1989) Soil Biomasa and enzyme activity in subarctic
agricultural and forest soils. Biol Fert Soils. 7: 283–288
Collins SL, Sinsabaugh RL, Crenshaw C, Green L, Porras-Alfaro A, Stursova M, Zeglin
LH (2008) Pulse dynamics and microbial processes in aridland ecosystems. J
Ecol. 96: 413–420
Corre MD, Van Kessel C, Pennock DJ (1996) Landscape and seasonal patterns of
nitrous oxide emissions in a semiarid region. Soil Sci Soc Am J. 60: 1806–1815
Csonka LN (1989) Physiological and genetic responses of bacteria to osmotic-stress.
Microbiol Rev. 53(1): 121–147
Cui M, Caldwell M (1997) A large ephemeral release of nitrogen upon wetting of dry
soil and corresponding root responses in the field. Plant Soil. 191: 291–299
Curlevski NJA, Drigo B, Cairney JWG, Anderson IC (2014) Influence of elevated
atmospheric CO2 and water availability on soil fungal communities under
Eucalyptus saligna. Soil Biol Biochem. 70: 263–271
Davidson EA, Ishida FY, Nepstad DC (2004) Effects of an experimental drought on soil
emissions of carbon dioxide, methane, nitrous oxide, and nitric oxide in a moist
tropical forest. Glob Change Biol. 10: 718–730
Degens BP, Sparling GP (1995) Repeated wet-dry cycles do not accelerate the
mineralization of organic C involved in the macro-aggregation of a sandy loam
soil. Plant Soil. 175: 197– 203
Delgado-Baquerizo M, Castillo-Monroy AP, Maestre FT, Gallardo A (2010) Change in
the dominance of N forms within a semiarid ecosystem. Soil Biol Biochem. 42:
376–378
Delgado-Baquerizo M, Maestre FT, Rodríguez JGP, Gallardo A (2013a) Biological soil
crusts promote N accumulation in response to dew events in dryland soils. Soil
Biol Biochem. 62: 22–27
Delgado-Baquerizo M, Morillas L, Maestre FT, Gallardo (2013b) A Biocrusts control the
nitrogen dynamics and microbial functional diversity of semi-arid soils in
response to nutrient additions. Plant Soil. Doi: 10.1007/s11104-013-1779-9
DeLuca TH, Keeney DR (1993) Soluble anthrone-reactive carbon in soils: Effect of
carbon and nitrogen amendments. Soil Sci Soc Am J. 57: 1296–1300

136
Denef K, Six J, Bossuyt H, Frey SD, Elliott ET, Merckx R, Paustian K (2001a) Influence
of dry–wet cycles on the interrelationship between aggregate, particulate
organic matter, and microbial community dynamics. Soil Biol Biochem. 33:
1599–1611
Denef K., Six J, Paustian K, Merckx R (2001b) Importance of macroaggregate dynamics
in controlling soil carbon stabilization: short-term effects of physical
disturbance induced by dry–wet cycles. Soil Biol Biochem. 33: 2145–2153
Diaz-Ravina M, Acea MJ, Carballas T (1995) Seasonal changes in microbial biomasa
and nutrient flush in forest soils. Biol Fert Soils. 19: 220–226
Dilling J, Kaiser K (2002) Estimation of the hydrophobic fraction of dissolved organic
matter in water samples using UV photometry. Water Research. 36: 5037–5044
Domalski ES (1972) Selected Values of Heats of Combustion and Heats of Formation of
Organic Compounds Containing the Elements C, H, N, O, P and S. J Phys Chem
Ref Data. 1: 221–277
Driscoll CT, Whitall D, Aber J, Boyer E, Castro M, Cronan C, Goodale CL, Groffman P,
Hopkinson C, Lambert K, Lawrence G, Ollinger S (2003) Nitrogen pollution in
the northeastern United States: sources, effects, and management options.
Bioscience. 53: 357–74
Durán J, Delgado-Baquerizo M, Rodriguez A, Covelo F, Gallardo A (2013a) Ionic
exchange membranes (IEMs): A good indicator of soil inorganic N production.
Soil Biol Biochem. 30: 964–968
Durán J, Rodríguez A, Morse JL, Groffman PM (2013b) Winter climate change effects
on soil C and N cycles in urban grasslands. Glob Change Biol. Doi:
10.1111/gcb.12238
Easterling DR, Meehl GA, Parmesan C, Changnon SA, Karl TR, Mearns LO (2000)
Climate extremes: observations, modeling, and impacts. Science. 289: 2068–2074
Eldridge DJ, Greene RSB (1994) Microbiotic soil crusts-a review of their roles in soil
and ecological processes in the rangelands of Australia. Aust J Soil Res. 32: 389–
415
Eldridge DJ, Bowker MA, Maestre FT, Alonso P, Mau RL, Papadoloulos J, Escudero A
(2010) Interactive effects of three ecosystem engineers on infiltration in a semi-
arid Mediterranean grassland. Ecosystems. 13: 499–510
Elliott ET, Coleman DC (1988) Let the soil work for us. Ecol Bull. 39: 23–32

137
Elser JJ, Bracken MES, Cleland EE, Gruner DS, Harpole WS, Hillebrand H, Ngai JT,
Seabloom EW, Shurin JB, Smith JE (2007) Global analysis on nitrogen and
phosphorus limitation of primary producers in freshwater, marine and
terrestrial ecosystems. Ecol Lett. 10: 1135–1142. Doi: 10.1111/j.1461-
0248.2007.01113.x
Emmett BA, Beier C, Estiarte M et al. (2004) The response of soil processes to climate
change: results from manipulation studies of shrublands across an
environmental gradient. Ecosystems. 7: 625–637
Evans RD, Lange OL (2003) Biological soil crusts and ecosystem nitrogen and carbon
dynamics. In: Belnap J, Lange OL (Eds). Biological soil crusts: structure,
function, and management. Springer, Berlin Heidelberg New York. pp. 263–279
Evans SE, Wallenstein MD (2011) Soil microbial community response to drying and
rewetting stress: does historical precipitation regime matter? Biogeochemistry.
http://dx.doi.org/10.1007/s1053301196383
Farrar W, Reboli A (1999) The genus Bacillus: medical. In: Dworkin M (Ed). The
prokaryotes: an evolving electronic resource for the microbiological
community. Third edition, release 3.0. Springer-Verlag, New York, USA
Fenn ME, Poth MA, Aber JD, Baron JS, Bormann BT, Johnson DW, Lemly AD, McNulty
SG, Ryan DF, Stottlemeyer R (1998) Nitrogen excess in North American
ecosystems: predisposing factors, ecosystem responses and management
strategies. Ecol Appl. 8: 706–733
Fierer N, Schimel JP (2002) Effects of rewetting frequency on soil carbon and nitrogen
transformations. Soil Biol Biochem. 34: 777–787
Fierer N, Schimel JP (2003) A proposed mechanism for the pulse in carbon dioxide
production commonly observed following the rapid rewetting of a dry soil. Soil
Sci Soc Am J. 67 (3): 798–805
Fierer N, Schimel JP, Holden PA (2003) Influence of drying–rewetting frequency on soil
bacterial community structure. Microb Ecol. 45: 63–71
Fierer N, Lauber CL, Ramirez KS, Zaneveld J, Bradford MA, et al. (2011) Comparative
metagenomic, phylogenetic and physiological analyses of soil microbial
communities across nitrogen gradients. The ISME Journal. 6: 1007– 1017
Firestone MK, Tiedje JM (1979) Temporal Change in Nitrous Oxide and Dinitrogen
from Denitrification Following Onset of Anaerobiosis. Appl Environ Microbiol.
38: 673–679

138
Fisher FM, Whitford WG (1995) Field simulation of wet and dry years in the
Chihuahuan desert—soil moisture, N-mineralization and ion-exchange resin
bags. Biol Fert Soils. 20(2): 137–146
Flessa H, Beese F (2000) Laboratory estimates of trace gas emissions following surface
application and injection of cattle slurry. J Environ Qual. 29: 262–268
Fließbach A, Martens R, Reber HH (1994) Soil microbial biomass and microbial activity
in soils treated with heavy metal contaminated sewage sludge. Soil Biol
Biochem. 26: 1201–1205
Franco CMM, Clarke PJ, Tate ME, Oades JM (2000) Hydrophobic properties and
chemical characterisation of natural water repellent materials in Australian
sands. J Hydrol. 231: 47–58. Doi: 10.1016/S0022-1694(00)00182-7
Franzluebbers K, Weaver RW, Juo ASR, Franzluebbers AJ (1994) Carbon and nitrogen
mineralization from cowpea plants part decomposing in moist and in
repeatedly dried and wetted soil. Soil Biol Biochem. 26: 1379–1387
Franzluebbers AJ, Haney RL, Honeycutt CW, Schomberg HH, Hons FM (2000) Flush of
carbon dioxide following rewetting of dried soil relates to active organic pools.
Soil Sci Soc Am J. 64: 613–623
Freckman DW, Whitford WG, Steinberger Y (1987) Effect of irrigation on nematode
population dynamics and activity in desert soils. Biol Fertil Soil. 3: 3–10
Gallardo A, Covelo F, Morillas L, Delgado M (2009) Ciclos de nutrientes y procesos
edáficos en los ecosistemas terrestres: especificidades del caso mediterráneo y
sus implicaciones para las relaciones suelo-planta. Ecosistemas. 18 (2): 4–19
Galloway JN, Cowling EB (2002) Reactive nitrogen and the world: 200 years of change.
Ambio. 31: 64–71
García-Méndez G, Maass JM, Matson PA, Vitousek PM (1991) Nitrogen
transformations and nitrous oxide flux in a tropical deciduous forest in México.
Oecologia. 88: 362–366
García-Palacios P, Bowker MA, Chapman SJ, Maestre FT, Soliveres S, Gallardo A,
Valladares F, Guerrero C, Escudero A (2011) Early-Successional Vegetation
Changes After Roadside Prairie Restoration Modify Processes Related with Soil
Functioning by Changing Microbial Functional Diversity. Soil Biol Biochem. 43:
1245–1253
Garwood EA, Tyson KC (1973) Losses of nitrogen and other plant nutrients to drainage
from soil under grass. J Agric Sci. 80: 303–312

139
Gelfand I, Yakir D (2008) Influence of nitrite accumulation in association with seasonal
patterns and mineralization of soil nitrogen in a semi-arid pine forest. Soil Biol
Biochem. 40: 415–424
Giorgi F (2006) Climate change hot-spots. Geophys Res Lett. 33: L08707.
Doi: 10.1029/2006GL025734
Giorgi F, Whetton PH, Jones RG, Christensen JH, Mearns LO, Hewitson B, von Storch
H, Francisco R, Jack C (2001) Emerging patterns of simulated regional climatic
changes for the 21st century due to anthropogenic forcings. Geophys Res Lett.
28: 3317–3320. Doi: 10.1029/2001GL013150
Glitzenstein JS, Canham CD, McDonnell MJ, Streng DR (1990) Effects of environment
and land-use history on upland forests of the Cary Arboretum, Hudson Valley,
NY. Bull Torrey Bot Club. 117: 106–22
Gonzalez-Quiñones V, Banning NC, Jimenez Ballesta R, Murphy DV (2009) Influence
of cold storage on soil microbial community level physiological profiles and
implications for soil quality monitoring. Soil Biol Biochem. 41: 1574–1576
Gordon H, Haygarth PM, Bardgett RD (2008) Drying and wetting effects on soil
microbial community composition and nutrient leaching. Soil Biol Biochem. 40:
302–311
Granli T, Bøckman OC (1994) Nitrous oxide from agriculture. Norwegian J Agr Sci
Suppl. 12
Grierson PF, Comerford NB, Jokela EJ (1998) Phosphorus mineralization kinetics and
response of microbial phosphorus to drying and rewetting in a Florida spodsol.
Soil Biol Biochem. 10–11: 1323–1331
Groffman PM, Tiedje JM (1988) Denitrification hysteresis during wetting and drying
cycles in soil. Soil Sci Soc Am J. 52: 1626–1629
Groffman PM, Butterbach-Bahl K, Fulweiler RW, Gold AJ, Morse JL, Stander EK,
Tague C, Tonitto C, Vidon P (2009) Challenges to incorporating spatially and
temporally explicit phenomena (hotspots and hot moments) in denitrification
models. Biogeochemistry. 93: 49–77
Groffman PM (2012) Terrestrial denitrification: challenges and opportunities. Ecol
Processes. 1–11
Grote EE, Belnap J, Housman DC, Sparks JP (2010) Carbon exchange in biological soil
crust communities under differential temperatures and soil water content:
implications for global change. Glob Chang Biol. 16: 2763–2774

140
Gruber N, Galloway JN (2008) An Earth-system perspective of the global nitrogen cycle.
Nature. 451: 293–296
Guggenberger G, Kaiser K (2003) Dissolved organic matter in soil: Challenging the
paradigm of sorptive preservation. Geoderma. 113: 293–310
Hagedorn F, Kammer A, Schmidt M, Goodale CL (2012) Nitrogen addition alters
mineralization dynamics of 13C-depleted leaf and twig litter and reduces
leaching of older DOC from mineral soil. Glob Change Biol. 18: 1412–1427
Halverson LJ, Jones TM, Firestone MK (2000) Release of intracellular solutes by four
soil bacteria exposed to dilution stress. Soil Sci Soc Am J. 64: 1630–1637
Hamer U, Marschner B (2005) Priming effects in soils after combined and repeated
substrate additions. Geoderma. 128: 38–51
Hanson PJ, Edwards NT, Garten CT, Andrews JA (2000) Separating root and soil
microbial contributions to soil respiration: a review of methods and
observations. Biogeochemistry. 48: 15– 46
Harris RF (1981) The effect of water potential on microbial growth and activity. In: Parr
JF, Gardner WR, Elliott LF (Eds). Water Potential Relations in Soil
Microbiology. SSSA Special Publication No. 9, Wisconsin, USA. pp. 23–95
Henry HAL, Juarez JD, Field CB, Vitousek PM (2005) Interactive effects of elevated
CO2, N deposition and climate change on extracellular enzyme activity and soil
density fractionation in a California annual grassland. Glob Chang Biol. 11:
1808–1815
Hogg EH, Lieffers VJ, Wein RW (1992) Potential carbon losses from peat profiles:
effects of temperature, drought cycles, and fire. Ecol Appl. 2: 298–306
Howard DM, Howard PJA (1993) Relationships between CO2 evolution, moisture
content and temperature for a range of soil types. Soil Biol Biochem. 25: 1537–1546
Huntington TG (2006) Evidence for intensification of the global water cycle: review and
synthesis. J Hydrol. 319(1–4): 83–95
Huxman TE, Snyder KA, Tissue DT, Leffler AJ, Ogle K, Pockman WT, Sandquist DR,
Potts DL, Schwinning S (2004) Precipitation pulses and carbon fluxes in
semiarid and arid ecosystems. Oecologia. 141: 254–268
IPCC, Climate Change (2013) The Physical Science Basis. Working Group I
Contribution to the Fifth Assessment Report of the Intergovernmental Panel on
Climate Change. In: Climate Change 2013: The Physical Science Basis

141
IPCC, Climate Change (2007) The Physical Science Basis. Contribution of the Working
Group i to the Fourth Assessment Report of the Intergovernmental Panel on
Climate Change. Climate Change 2007: The Physical Science Basis. Cambri
Jager G, Bruins EH (1975) Effect of repeated drying at different temperatures on soil
organic matter decomposition and characteristics, and on the soil microflora.
Soil Biol Biochem. 7: 153–159
Janssens IA, Dieleman W, Luyssaert S, Subke J-A, Reichstein M, Ceulemans R, Ciais P,
Dolman AJ, Grace J, Matteucci G, Papale D, Piao SL, Schulze E-D, Tang J, Law
BE (2010) Reduction of forest soil respiration in response to nitrogen deposition.
Nature Geoscience. 3: 315–322
Jarvis P, Rey A, Petsikos C, Wingate L, Rayment M, Pereira J, Banza J, David J,
Miglietta F, Borghetti M, Manca G, Valentini R (2007) Drying and wetting of
Mediterranean soils stimulates decomposition and carbon dioxide emission: the
“Birch effect”. Tree physiol. 27: 929–40
Jenerette GD, Chatterjee A (2012) Soil metabolic pulses: water, substrate, and biological
regulation. Ecology. 93(5): 959–966
Jenkinson DS (1966) Studies on the decomposition of plant material in soil. II. Partial
sterilization of soil and the soil biomass. J Soil Sci. 17: 280–302.
Doi: 10.1111/j.1365-2389.1966.tb01474.x
Jenkinson DS, Powlson DS (1976) The effects of biocidal treatments on metabolism in
soil—V: A method for measuring soil biomass. Soil Biol Biochem. 8: 209–213
Jones DL, Dennis PG, Owen AG, Van Hees PAW (2003) Organic acid behavior in soils -
Misconceptions and knowledge gaps. Plant Soil. 248: 31-41
Jones DL, Willett VB (2006) Experimental evaluation of methods to quantify dissolved
organic nitrogen (DON) and dissolved organic carbon (DOC) in soil. Soil Biol
Biochem. 38: 991–999
Kalbitz K, Schmerwitz J, Schwesig D, Matzner E (2003) Biodegradation of soil-derived
dissolved organic matter as related to its properties. Geoderma. 113: 273–291
Kaye JP, McCulley RL, Burke IC (2005) Carbon fluxes, nitrogen cycling, and soil
microbial communities in adjacent urban, native and agricultural ecosystems.
Glob Change Biol. 11: 575–587
Kempf B, Bremer E (1998) Uptake and synthesis of compatible solutes as microbial
stress responses to high osmolality environments. Arch Microbiol. 170: 319–330

142
Kharin VV, Zwiers FW, Zhang XB, Hegerl GC (2007) Changes in temperature and
precipitation extremes in the IPCC ensemble of global coupled model
simulations. J Clim. 20: 1419–1444. Doi: 10.1175/JCLI4066.1
Kieft TL, Soroker E, Firestone MK (1987) Microbial biomass response to a rapid
increase in water potential when dry soil is wetted. Soil Biol Biochem. 19: 119–
126
Kienzle E, Schrag I, Butterwick R, Opitz B (2002) Calculation of gross energy in pet
foods: Do we have the right values for heat of combustion? J Nutr. 132 (6–1):
1799S-1800S
Kleidon A, Fraedrich K, Heimann, M (2000) A green planet versus a desert world:
Estimating the maximum effect of vegetation on the land surface climate. Clim
Chang. 44(4): 471–493
Knapp AK, Fay PA, Blair JM, Collins SL, Smith MD, Carlisle JD, Harper CW, Danner
BT, Lett MS, McCarron JK (2002) Rainfall variability, carbon cycling, and plant
species diversity in a mesic grassland. Science. 298: 2202–2205
Knapp AK, Beier C, Briske DD, Classen AT, Luo Y, Reichstein M, Smith MD, Smith SD,
Bell JE, Fay PH, Heisler JA, Leavitt SW, Sherry R, Smith B, Weng E (2008)
Consequences of more extreme precipitation regimes for terrestrial ecosystems.
BioScience. 58: 811–821
Kroetsch D, Wang C (2008) Particle size distribution. In: Carter MR, Gregorich EG
(Eds). Soil Sampling and Methods of Analysis. CRC Press, Boca Raton. pp. 713–
727
Kruger FJ, Mitchell DT, Jarvis JUM (1983) Mediterranean-Type Ecosystems: The Role of
Nutrients. Ecological Studies 53. Springer-Verlag, Berlin, Germany.
Lagomarsino A, Knapp BA, Moscatelli MC, De Angelis P, Grego S, Insam H (2007)
Structural and Functional Diversity of Soil Microbes is Affected by Elevated
[CO2] and N Addition in a Poplar Plantation. J Soils Sediments. 7: 399–405
Lal R (2004) Soil carbon sequestration to mitigate climate change. Geoderma. 123: 1–22
Lalor BM, Cookson WR, Murphy DV (2007) Comparison of two methods that assess
soil community level physiological profiles in a forest ecosystem. Soil Biol
Biochem. 39: 454–462
Landesman WJ, Dighton J (2010) Response of soil microbial communities and the
production of plant-available nitrogen to a two-year rainfall manipulation in
the New Jersey Pinelands. Soil Biol Biochem. 42: 1751–1758

143
Landesma WJ, Dighton J (2011) Shifts in microbial biomass and the bacteria: fungi ratio
occur under field conditions within 3 h after rainfall. Microb Ecol. 62: 228–236
Lange OL, Meyer A, Zellner H, Heber U (1994) Photosynthesis and water relations of
lichen soil crusts: field measurements in the coastal fog zone of the Namib
Desert. Funct Ecol. 8: 253–264
Lee X, Wu HJ, Sigler J, Oishi C, Siccama T (2004) Rapid and transient response of soil
respiration to rain. Glob Change Biol. 10: 1017–1026
Li ZM, Skogley EO, Ferguson AH (1993) Resin adsorption for describing bromide
transport in soil under continuous or intermittent unsaturated water flow. J
Environ Qual. 22: 715–722
Li X, Meixner T Sickman J, Miller A, Schimel J, Melack J (2006) Decadal-scale dynamics
of water, carbon and nitrogen in a California chaparral ecosystem: DAYCENT
Modeling Results. Biogeochemistry. 77: 217–245
Lindner M, Maroschek M, Netherer S, Kremer A, Barbati A, Garcia-Gonzalo J, Seidl R,
Delzon S, Corona P, Kolström M, Lexer MJ, Marchetti M (2010) Climate change
impacts, adaptative capacity and vulnerability of European forest ecosystems.
Forest Ecol Manag. 259: 698–709. Doi: 10.1016/j.foreco.2009.09.023
Liu L, Greaver TL (2010) A global perspective on belowground carbon dynamics under
nitrogen enrichment. Ecol Letters. 13: 819–828
Lovett GM, Goodale CL (2011) A new conceptual model of nitrogen saturation based
on experimental nitrogen addition to an oak forest. Ecosystems. 14: 615–631.
Doi: 10.1007/s10021-011-9432-z
Lu WF, Chen W, Duan BW, Guo WM, Lu Y, Lantin RS, Wassmann R, Neue HU (2000)
Methane emission and mitigation options in irrigated rice fields in southeast
China. Nutr Cycl Agroecosys. 58: 65–74
Lugo AE, Cuevas E, Sanchez MY (1990) Nutrients and mass in litter and top soil of ten
tropical tree plantations. Plant Soil. 125: 263–280
Lund V, Goksoyr J (1980) Effect of water fluctuations on microbial mass and activity in
soil. Microb Ecol. 6: 115–123
Lundquist E, Jackson L, Scow K (1999a) Wet dry cycles affect DOC in two California
agricultural soils. Soil Biol Biochem. 31: 1031–1038
Lundquist E, Scow K, Jackson L, Uesugi S, Johnson C (1999b) Rapid response of soil
microbial communities from conventional, low input, and organic farming
system to a wet/dry cycle. Soil Biol Biochem. 31: 1661–1675

144
Ma S, Baldocchi DD, Hatala JA, Detto M, Curiel Yuste J (2012) Are rain-induced
ecosystem respiration pulses enhanced by legacies of antecedent
photodegradation in semi-arid environments? Agric For Meteorol. 154–155:
203–213
Maestre FT, Cortina J (2003) Small-scale spatial variation in soil CO2 efflux in a
Mediterranean semiarid steppe. Appl Soil Ecol. 23: 199–209
Maestre FT, Bowker MA, Puche MD, Escolar C, Soliveres S, Mouro S, García-Palacios
P, Castillo-Monroy AP, Martínez I, Escudero A (2010) Do biotic interactions
modulate ecosystem functioning along abiotic stress gradients? Insights from
semi-arid plant and biological soil crust communities. Phil Trans R Soc B. 365:
2057–2070
Maestre FT, Bowker MA, Cantón Y, Castillo-Monroy AP, Cortina J, Escolar C, Escudero
A, Lázaro R, Martínez I (2011) Ecology and functional roles of biological soil
crusts in semi-arid ecosystems of Spain. J Arid Environ. 75: 1282–1291
Maestre TF, Escolar C, Ladrón de Guevara M, Quero JL, Lázaro R, Delgado-Baquerizo
M, Ochoa V, Berdugo M, Gozalo B, Gallardo A (2013) Changes in biocrust cover
drive carbon cycle responses to climate change in drylands. Glob Chang Biol.
19: 3835–3847
Magid J, Kjærgaard C, Gorissen A, Kuikman PJ (1999) Drying and rewetting of a loamy
sand soil did not increase the turnover of native organic matter, but retarded
the decomposition of added 14C-labelled plant material. Soil Biol Biochem. 31:
595–602
Mamilov AS, Dilly OM (2002) Soil microbial eco-physiology as affected by short-term
variations in environmental condition. Soil Biol Biochem. 34: 1283–1290
Marqués MJ, Bienes R, Pérez-Rodríguez R, Jiménez L (2008) Soil degradation in Central
Spain due to sheet water erosion by low-intensity rainfall events. Earth Surf
Process Land. 33: 414–423
Matson PA, Volkmann C, Coppinger K, Reiners WA (1991) Annual nitrous oxide flux
and soil nitrogen characteristics in sagebrush steppe ecosystems.
Biogeochemistry.14(1): 1–12
Matesanz S, Escudero A, Valladares, F (2009) Impact of three global change drivers on
a Mediterranean shrub. Ecology. 90(9): 2609–2621
McClain ME, Boyer EW, Dent CL, Gergel SE, Grimm NB, Groffman PM, Hart SC,
Harvey JW, Johnston CA, Mayorga E, McDowell WH, Pinay G (2003)

145
Biogeochemical hot spots and hot moments at the interface of terrestrial and
aquatic ecosystems. Ecosystems. 6: 301–312
McCulley RL, Boutton TW, Archer SR (2007) Soil respiration in a subtropical savanna
parkland: response to water additions. Soil Sci Soc Am J. 71: 820–828
McInnes K, Weaver R (1994) Soil water potential. In: Weaver R (Ed). Methods of soil
analysis, part 2—microbiological and biochemical properties, 53–58. WI, Soil
Science Society of America, Madison.
McLean MA, Huhta V (2000) Temporal and spatial fluctuations in moisture affect
humus microfungal community structure in microcosms. Biol Fert Soils. 32:
114–119
Meehl GA, Stocker TF, Collins WD et al. (2007) Global climate projections.In: Solomon
S, Qin D, Manning M et al. (Eds). Climate Change 2007: The Physical Science
Basis. Contribution of Working Group I to the Fourth Assessment Report of the
Intergovernmental Panel on Climate Change. Cambridge University Press,
Cambridge, UK. pp. 747–845
Merino J, et al. (1988) Vegetation nutrition and climate. In: Specht RL (Ed).
Mediterranean-type ecosystems. Kluver Academic Publichers. La Haya. pp.13-
61
Meyer AF, Lipson DA, Martin AP, Schadt CW, Schmidt SK (2004) Molecular and
metabolic characterization of cold-tolerant alpine soil Pseudomonas sensu stricto.
Appl Environ Microbiol. 70: 483–489
Mikha MM, Rice CW, Milliken GA (2005) Carbon and nitrogen mineralization as
affected by drying and wetting cycles. Soil Biol Biochem. 37: 339–347
Miller AE, Schimel JP, Meixner T, Sickman JO, Melack JM (2005) Episodic rewetting
enhances carbon and nitrogen release from chaparral soils. Soil Biol Biochem.
37: 2195–2204
Moreno JL, Hernandez T, Garcia C (1999) Effects of a cadmium contaminated sewage
sludge compost on dynamics of organic matter and microbial activity in an arid
soil. Biol Fertil Soils. 28: 230–237
Morillas L, Portillo-Estrada M, Gallardo A (2013) Wetting and drying events determine
soil N pools in two Mediterranean ecosystems. Appl Soil Ecol. 72: 161– 170
Mosier AR, Guenzi WD, Schweizer EE (1986) Soil losses of dinitrogen and nitrous
oxide from irrigated crops in northeastern Colorado. Soil Sci Soc Am J. 50: 344–
348

146
Mosier AR, Schimel D, Valentine D, Bronson K, Parton W (1991) Methane and nitrous
oxide fluxes in native, fertilized and cultivated grasslands. Nature. 350: 330–332
Mummey DL, Smith JL, Bolton H (1994) Nitrous oxide flux from a shrub-steppe
ecosystem: sources and regulation. Soil Biol Biochem. 26: 279–286
Nave LE, Vance ED, Swanston CW, Curtis PS (2009) Impacts of elevated N inputs on
north temperate forest soil C storage, C/N, and net N-mineralization.
Geoderma. 153: 231–240
Nie M, Pendall E, Bell C, Gasch CK, Raut S, Tamang S et al. (2013) Positive climate
feedbacks of soil microbial communities in a semi-arid grassland. Ecol Lett. 16:
234–241
Norton U, Mosier AR, Morgan JA, Derner JD, Ingram LJ, Stahl PD (2008) Moisture
pulses, trace gas emissions and soil C and N in cheatgrass and native grass-
dominated sagebrush-steppe in Wyoming, USA. Soil Biol Biochem. 40: 1421–
1431
Noy-Meir I (1973) Desert ecosystems: environment and producers. Annu Rev Ecol Syst.
4: 25–52
Noy-Meir I (1974) Desert ecosystems: higher trophic levels. Annu Rev Ecol Syst. 5: 195–
214
Orchard VA, Cook FJ (1983) Relationship between soil respiration and soil moisture.
Soil Biol Biochem. 15: 447–453
Oren A, Steinberger Y (2008) Catabolic profiles of soil fungal communities along a
geographic climatic gradient in Israel. Soil Biol Biochem. 40: 2578–2587
Orwin KH, Wardle DA (2004) New indices for quantifying the resistance and resilience
of soil biota to exogenous disturbances. Soil Biol Biochem. 36: 1907–1912
Orwin KH, Wardle DA, Greenfield LG (2006) Ecological consequences of carbon
substrate identity and diversity in a laboratory study. Ecology. 97: 580–593
Ouyang Y, Li X (2013) Impacts of drying-wetting cycles on CO2 and N2O emissions
from soils in different ecosystems. Acta Ecol Sinica. 33(4): 1251–1259
Øvreås L (2000) Population and community level approaches for analysing microbial
diversity in natural environments. Ecol Lett. 3: 236–251
Parton WJ, Schimel DS, Ojima DS, Cole CV (1987) Analysis of factors controlling soil
organic matter levels in great plains grasslands. Soil Sci Soc Am J. 51: 1173–1179
Paul EA, Clark F (1996) Soil Microbiology and Biochemistry. Academic Press, San
Diego, CA.

147
Pennanen T, Caul S, Daniell TJ, Griffiths BS, Ritz K, Wheatley RE (2004) Community-
level responses of metabolically-active soil microorganisms to the quantity and
quality of substrate inputs. Soil Biol Biochem. 36: 841–848
Pesaro M, Nicollier G, Zeyer J, Widmer F (2004) Impact of soil drying-rewetting stress
microbial communities and activities and on degradation of two crop protection
products. Appl Environ Microbiol. 70: 2577–2587
Pratt JR, Barreiro R (1998) Influence of trophic status on the toxic effects of a
herbicide—a microcosm study. Arch Environ Contam Toxicol. 35: 404–411
Pregitzer KS, Burton AJ, Zak DR, Talhelm AF (2008) Simulated chronic nitrogen
deposition increases carbon storage in Northern Temperate forests. Glob
Change Biol. 14: 142–153
Pulleman M, Tietema A (1999) Microbial C and N transformations during drying and
rewetting of coniferous forest floor material. Soil Biol Biochem. 31: 275–285
Qian P, Schoenau JJ (2001) Practical applications of ion exchange resins in agricultural
and environmental soil research. Can J Soil Sci. 82(1): 9–21
R Core Team (2013) R: A language and environment for statistical computing. R
Foundation for Statistical Computing, Vienna, Austria. URL http://www.R-
project.org/
Ramirez KS, Lauber CL, Knight R, Bradford MA, Fierer N (2010) Consistent effects of
nitrogen fertilization on soil bacterial communities in contrasting systems.
Ecology. 91: 3463–3470
Reynolds JF, Virginia RA, Kemp PR, De Soyza AG, Tremmel DC (1999) Impact of
drought on desert shrubs: effects of seasonality and degree of resource island
development. Ecol Monogr. 69 (1): 69–106
Reynolds JF, Stafford Smith M, Lambin EF, Turner BLII, Mortimore M, Batterbury SPJ,
Downing TE, Dowlatabadi H, Fernandez RJ, Herrick JE, Huber-Sannvald E,
Leemans R, Lynam T, Maestre FT, Ayarza M, Walker B (2007) Global
desertification: building a science for dryland development. Science. 316: 847–51
Ridgwell AJ, Marshall SJ, Gregson K (1999) Consumption of atmospheric methane by
soils: A process-based model. Glob Biogeochem Cycles. 13, 59
Roberson EB, Firestone MK (1992) Relationship between desiccation and
exopolysaccharide production in a soil Pseudomonas spp. Appl Environ
Microbiol. 58: 1284–1291

148
Robertson LA, Dalsgaard T, Revsbeck NP, Kuenen JG (1995) Confirmation of ‘‘aerobic
denitrification’’ in batch cultures using gas chromatography and 15N mass
spectrometry, FEMS. Microbiol Ecol. 18: 113–120. Doi: 10.1111/j.1574-
6941.1995.tb00168.x
Rodríguez et al. under review
Rubio A, Merino A, Blanco A (2010) Soil–plant relations in Mediterranean forest
environments. Eur J Forest Res. 129: 1–3
Rudaz AO, Davidson EA, Firestone MK (1991) Sources of nitrous oxide production
following wetting of dry soil. Federation of European Microbiological Societies,
Microb Ecol. 85: 117–124
Ruser R, Flessa H, Schilling R, Beese F, Munch JC (2001) Effect of crop type-specific soil
management and N fertilization on N2O emissions from a fine-loamy soil. Nutr
Cycl Agroecosys. 59: 177–191
Ruser R, Flessa H, Russow R, Schmidt G, Buegger F, Munch JC (2006) Emission of
N2O, N2 and CO2 from soil fertilized with nitrate: effect of compaction, soil
moisture and rewetting. Soil Biol Biochem. 38: 263–274
Rustad LE, Huntington TG, Boone RD (2000) Controls on soil respiration: Implications
for climate change. Biogeochemistry. 48: 1–6
Rutherford PM, McGill WB, Arocena JM, Figueiredo CT (2007) Total Nitrogen. In:
Carter MR, Gregorich E. Soil Sampling and Methods of Analysis. 2nd edn. CRC
Press
Ryan MG, O’Toole P, Farrell EP (1998) The influence of drought and natural rewetting
on nitrogen dynamics in a coniferous ecosystem in Ireland. Environ Pollut. 102:
445–451
Saetre P, Stark JM (2005) Microbial dynamics and carbon and nitrogen cycling
following re-wetting of soils beneath two semi-arid plant species. Oecologia.
142: 247–260
Sahrawat KL, Keeney DR (1986) Nitrous oxide emission from soils. Adv Soil Sci. 4:
103–148
Sala OE, Lauenroth WK (1982) Small rainfall events: An ecological role in semiarid
regions. Oecologia 53(3): 301–304. Doi: 10.1007/BF00389004
Sala EO, Chapin III FS, Armesto JJ, Berlow E et al. (2000) Global Biodiversity Scenarios
for the Year 2100. Science. 287: 1770–1774

149
Sardans J, Peñuelas J, Prieto P, Estiarte M (2008) Drought and warming induced
changes in P and K concentration and accumulation in plant biomass and soil in
a Mediterranean shrubland. Plant Soil. 306: 261–271
Schimel JP (1995a) Ecosystem consequences of microbial diversity and community
structure. In: Chapin F , Korner C (Eds). Arctic and alpine biodiversity:
patterns, causes, and ecosystem consequences. Springer-Verlag, Berlin,
Germany. pp. 239–254
Schimel DS (1995b) Terrestrial ecosystems and the carbon cycle. Glob Change Biol. 1(1):
77–91
Schimel JP, Gulledge JM, Clein-Curley JS, Lindstrom JE, Braddock JF (1999) Moisture
effects on microbial activity and community structure in decomposing birch
litter in the Alaskan taiga. Soil Biol Biochem. 31(6): 831–838
Schimel JP, Balser TC, Wallenstein M (2007) Microbial stress–response physiology and
its implications for ecosystem function. Ecology. 88(6): 1386–1394
Schlesinger WH (2013) An estimate of the global sink for nitrous oxide in soils. Glob
Change Biol. Doi: 10.1111/gcb.12239
Schlesinger WH, Peterjohn WT (1991) Processes controlling ammonia volatilization
from Chihuahuan Desert soils. Soil Biol Biochem. 23: 637–642
Scholes M, Martin R, Scholes R, Parsons D, Winstead E (1997) NO and N20 emissions
from savanna soils following the first simulated rains of the season. Nutr Cycl
Agroecosys. 48: 115–122
Schröter D et al. (2005) Ecosystem Service Supply and Global Change in Europe.
Science. 310: 1333–1337
Schwinning S, Davis K, Richardson L, Ehleringer JR (2002) Deuterium enriched
irrigation suggests three forms of pulse use in perennial species of the Colorado
Plateau. Oecologia. 130: 345–355. Doi: 10.1007/s00442-001-0817-0
Schwinning S, Sala OE (2004) Hierarchical organization of resource pulse responses in
arid and semiarid ecosystems. Oecologia. Doi: 10.1007/s00442-004-1520-8
Schwinning S, Sala OE, Loik ME, Ehleringer JR (2004) Thresholds, memory, and
seasonality: Understanding pulse dynamics in arid/semi-arid ecosystems.
Oecologia. 141(2): 191–193. Doi: 10.1007/s00442-004-1683-3
Selye H (1950) Stress and the general adaptation syndrome. Br Med J. 4667: 1383–1392
Seneviratne R, Wild A (1985) Effect of mild drying on the mineralization of soil
nitrogen. Plant Soil. 84: 175–179

150
Shannon CE, Weaver W (1963) The mathematical theory of Comunication Univ of
Illinois Press, 117
Shaw MR, Zavaleta ES, Chiariello NR, Cleland EE, Mooney HA, Field CB (2002)
Grassland Responses to Global Environmental Changes Suppressed by
Elevated CO2. Science. 298: 1987– 1990
Shen WJ, Reynolds JF, Hui DF (2009) Responses of dryland soil respiration and soil
carbon pool size to abrupt vs. gradual and individual vs. combined changes in
soil temperature, precipitation, and atmospheric CO2: a simulation analysis.
Glob Change Biol. 15: 2274–2294. Doi: 10.1111/j.1365-2486.2009.01857.x
Shields JA, Paul EA, Lowe WE (1974) Factors influencing the stability of labelled
microbial materials in soils. Soil Biol Biochem. 6: 31–37
Sims GK, Ellsworth TR, Mulvaney RL (1995) Microscale determination of inorganic
nitrogen in water and soil extracts. Commun Soil Sci Plant Anal. 26: 303–316.
Doi: 10.1080/00103629509369298
Singh JS, Raghubanshi AS, Singh RS, Srivastava SC (1989) Microbial biomass act as a
source of plant nutrients in dry tropical forest and savanna. Nature. 338: 499–
500. Doi: 10.1038/338499a0
Skjemstad J, Baldock J (2006) Soil Organic Carbon and Productivity. In: Skjemstad J
(Ed). Climate Change, Carbon and Plants Briefings. 13 June 2006, Sydney.
(Australian Greenhouse Office, Canberra).
Skopp J, Jawson MD, Doran JW (1990) Steady-state aerobic microbial activity as a
function of soil water content. Soil Sci Soc Am J. 54: 1619–1625
Smolander A, Barnette L, Kitunen V, Lumme I (2005) N and C transformations in long-
term N-fertilized forest soils in response to seasonal drought. Appl Soil Ecol.
29(3): 225–235
Sollins P, Glassman C, Paul EA, Swantston C, Lajtha K, Heil JW, Ellikott ET (1999) Soil
carbon and nitrogen: pools and fraction. In: Robertson GP (Ed). Standard Soil
Methods for Long-Term Ecological Research. Oxford University Press, Oxford.
pp 89–105
Solomon S, Qin D, Manning M, Chen Z, Marquis M, Averyt KB, Tignor M, Miller HL
(2007) Climate Change 2007: The Physical Basis. Contribution of Working
Group I to the Fourth Assessment Report of the Intergovernmental Panel on
Climate Change, Cambridge Univ. Press, Cambridge, U K

151
Sorensen LH (1974) Rate of decomposition of organic matter in soil as influenced by
repeated air drying-rewetting and repeated additions of organic material. Soil
Biol Biochem. 6: 287–292
Sorensen LH (1983) The influence of stress treatments on the microbial biomass and the
rate of decomposition of humified matter in soils containing different amounts
of clay. Plant Soil. 75: 107–119
Sotta ED, Veldkamp E, Schwendenmann L, Guimarães BR, Paixão RK, Ruivo M de LP,
Lola da Costa AC, Meir P (2007) Effects of an induced drought on soil carbon
dioxide (CO2) efflux and soil CO2 production in an Eastern Amazonian
rainforest, Brazil. Glob Change Biol. 13: 2218–2229
Soulides DA, Allison FE (1961) Effect of drying and freezing soils on carbon dioxide
production, available mineral nutrients, aggregation, and bacterial population.
Soil Sci. 91: 291–298
Sponseller RA (2007) Precipitation pulses and soil CO2 flux in a Sonoran Desert
ecosystem. Glob Change Biol. 13: 426–436
Stark JM, Firestone MK (1995) Mechanisms for soil moisture effects on activity of
nitrifying bacteria. Appl Environ Microbiol. 61: 218–221
Steudler PA, Bowden RD, Melillo JM, Aber JD (1989) Influence of nitrogen fertilization
on methane uptake in temperate forest soils. Nature. 341: 314–316
Stouthamer AH (1976) Yield studies in microorganisms. Meadowfield Press, Shildon,
UK
Strobel BW (2001) Influence of vegetation on low-molecular-weight carboxylic acids in
soil solution—a review. Geoderma. 99: 169–198
Stursova M, Crenshaw C, Sinsabaugh RL (2006) Microbial responses to long term N
deposition in a semi-arid grassland. Microb Ecol. 51: 90–98
Subler S, Blair JM, Edwards CA (1995) Using anion-exchange membranes to measure
soil nitrate availability and net nitrification. Soil Biol Biochem. 27: 911–917
Suzina NE, Mulyukin AL, Kozlova AN, Shorokhova AP, Dmitriev VV, Barinova ES,
Mokhova ON, El’-Registan GI, Duda VI (2004) Ultrastructure of resting cells of
some non-spore-forming bacteria. Microbiology. 73: 435–447
Tani M, Higashi T (1999) Vertical distribution of low molecular weight aliphatic
carboxylic acids in some forest soils of Japan. Eur J Soil Sci. 50: 217–226

152
Tietema A, Wessel W (1992) Gross nitrogen transformations in the organic layer of acid
forest ecosystems subjected to increased atmospheric nitrogen input. Soil Biol
Biochem. 24: 943–950
Treseder K (2008) Nitrogen additions and microbial biomass: a meta-analysis of
ecosystem studies. Ecol Lett. 11: 1111– 1120
Treseder KK, Balser TC, Bradford MA, Brodie EL, Dubinsky EA, Eviner VT, Hofmockel
KS, Lennon JT, Levine UY, MacGregor BJ, Pett-Ridge J, Waldrop MP (2012)
Integrating microbial ecology into ecosystem models: Challenges and priorities.
Biogeochemistry. 109: 7–18
Turner BL, Haygarth PM (2001) Phosphorus solubilization in rewetted soils. Nature.
411: 258
Van Gestel M, Ladd J, Amato M (1992) Microbial biomass responses to seasonal change
and imposed drying regimes at increasing depths of undisturbed topsoil proles.
Soil Biol Biochem. 24: 103–111
Van Gestel M, Merckx R, Vlassak K (1993) Microbial biomass responses to soil drying
and rewetting: the fate of fast- and slow-growing microorganisms in soils from
different climates. Soil Biol Biochem. 25: 109–123. Doi: 10.1016/0038-
0717(93)90249-b
Van Gestel M, Merckx R, Vlassak K (1996) Spatial distribution of microbial biomass in
microaggregates of a silty- loam soil and the relation with the resistance of
microorganisms to soil drying. Soil Biol Biochem. 28(4–5): 503–510
Van Hees PAW, Jones DL, Godbold DL (2002) Biodegradation of low molecular weight
organic acids in coniferous forest podzolic soils. Soil Biol Biochem. 34: 1261–1272
Van Hees PAW, Jones DL, Finlay R, Godbold DL, Lundström US (2005) The carbon we
do not see - The impact of low molecular weight compounds on carbon dynamics
and respiration in forest soils: A review. Soil Biol. Biochem. 37: 1-13
Van Veen JA, Ladd JN, Amato M (1985) Turnover of carbon and nitrogen through the
microbial biomass in a sandy loam and a clay soil incubated with [14C(U)]
glucose and [15N] (NH4)2SO4 under different moisture regimes. Soil Biol
Biochem. 17: 747–756. Doi: 10.1016/0038-0717(85)90128-2
Vitousek P (1982) Nutrient cycling and nutrient use efficiency. Am Naturalist. 119: 553–
572
153
Vitousek PM, Aber JD, Howarth RW, Likens GE, Matson PA, Schindler DW,
Schlesinger WH, Tilman DG (1997) Human alteration of the global nitrogen
cycle: sources and consequences. Ecol Appl. 7: 737–750
Voroney RP (2007) The soil habitat. In: Paul EA (Ed). Soil Microbiology, Ecology, and
Biochemistry. Elsevier, Oxford, UK. Pp. 25–49
Ward D (2009) The Biology of Deserts. Oxford University Press, Oxford, UK
Wardle DA (1998) Control of temporal variability of the soil microbial biomass: a
global scale synthesis. Soil Biol Biochem. 30: 1627–1637
Weltzin JF, McPherson GR (2003) Changing precipitation regimes and terrestrial
ecosystems. University of Arizona Press, Tucson, Ariz
Weltzin JF, Loik ME, Schwinning S, Williams DG, Fay PA, Haddad BM, Harte J, Zak JC
et al. (2003) Assessing the Response of Terrestrial Ecosystems to Potential
Changes in Precipitation. BioScience. 53(10): 941–952
Wetherald RT, Manabe S (2002) Simulation of hydrologic changes associated with
global warming. J Geophys Res. 107: 4379
Wilske B, Burgheimer J, Karnieli A, Zaady E, Andreae MO, Yakir D, Kesselmeier J
(2008) The CO2 exchange of biological soil crusts in a semiarid grass-shrubland
at the northern transition zone of the Negev desert, Israel. Biogeosciences. 5:
1411–1423
Wood JM, Bremer E, Csonka LN, Kraemer R, Poolman B, van der Heide T, Smith LT
(2001) Osmosensing and osmoregulatory compatible solute accumulation by
bacteria. Comp Biochem Physiol A. 130(3): 437–460
Wu J, Brookes PC (2005) The proportional mineralisation of microbial biomass and
organic matter caused by air-drying and rewetting of a grassland soil. Soil Biol
Biochem. 37: 507–515
Xiang S, Doyle A, Holden PA, Schimel JP (2008) Drying and rewetting effects on C and
N mineralization and microbial activity in surface and subsurface California
grassland soils. Soil Biol Biochem. 40: 2281–2289
Yahdjian L, Sala O, Austin A (2006) Differential controls of water input on litter
decomposition and nitrogen dynamics in the Patagonian steppe. Ecosystems. 9:
128–141. Doi: 10.1007/s10021-004-0118-7
Yuste JC, Nagy M, Janssens IA, Carrara1 A, Ceulemans R (2005) Soil respiration in a
mixed temperate forest and its contribution to total ecosystem respiration. Tree
Physiol. 25: 609–619

154
Zak JC, Willig MR, Moorhead DL, Wildman HG (1994) Functional diversity of
microbial communities, a quantitative approach. Soil Biol Biochem. 26: 1101–
1108
Zelikova TJ, Housman DC, Grote EE, Neher DA, Belnap J (2012) Warming and
increased precipitation frequency on the Colorado Plateau: implications for
biological soil crusts and soil processes. Plant Soil. 355: 265–282. Doi:
10.1007/s11104-011-1097-z
Zheng J, Zhang X, Li L, Zhang P, Pan G (2007) Effect of long-term fertilization on C
mineralization and production of CH4 and CO2 under anaerobic incubation
from bulk samples and particle size fractions of a typical paddy soil. Agric
Ecosyst Environ. 120: 129–138