eelgrass habitat and faunal assemblages in the … · assemblages at 15 locations in the cbj from...
TRANSCRIPT
NOAA Technical Memorandum NMFS-AFSC-182
Eelgrass Habitat and Faunal Assemblages in the City and Borough of Juneau, Alaska
by P. M. Harris, A. D. Neff, S. W. Johnson, and J. F. Thedinga
U.S. DEPARTMENT OF COMMERCE National Oceanic and Atmospheric Administration
National Marine Fisheries Service Alaska Fisheries Science Center
March 2008

NOAA Technical Memorandum NMFS
The National Marine Fisheries Service's Alaska Fisheries Science Centeruses the NOAA Technical Memorandum series to issue informal scientific andtechnical publications when complete formal review and editorial processingare not appropriate or feasible. Documents within this series reflect soundprofessional work and may be referenced in the formal scientific and technicalliterature.
The NMFS-AFSC Technical Memorandum series of the Alaska FisheriesScience Center continues the NMFS-F/NWC series established in 1970 by theNorthwest Fisheries Center. The NMFS-NWFSC series is currently used bythe Northwest Fisheries Science Center.
This document should be cited as follows:
Harris, P. M., A. D. Neff, S. W. Johnson, and J. F. Thedinga. 2008.Eelgrass habitat and faunal assemblages in the City and Borough ofJuneau, Alaska. U.S. Dep. Commer., NOAA Tech. Memo. NMFS-AFSC-182, 46 p.
Reference in this document to trade names does not imply endorsement bythe National Marine Fisheries Service, NOAA.
NOAA Technical Memorandum NMFS-AFSC-182
Eelgrass Habitat and Faunal Assemblages in the City and Borough
of Juneau, Alaska
by P. M. Harris, A. D. Neff, S. W. Johnson, and J. F. Thedinga
Alaska Fisheries Science Center Auke Bay Laboratories
17109 Lena Point Loop Road Juneau, AK 99801
www.afsc.noaa.gov
U.S. DEPARTMENT OF COMMERCE Carlos M. Gutierrez, Secretary
National Oceanic and Atmospheric Administration Vice Admiral Conrad C. Lautenbacher, Jr., U.S. Navy (ret.), Under Secretary and Administrator
National Marine Fisheries Service James W. Balsiger, Acting Assistant Administrator for Fisheries
March 2008

This document is available to the public through:
National Technical Information Service U.S. Department of Commerce 5285 Port Royal Road Springfield, VA 22161
www.ntis.gov

Notice to Users of this Document
This document is being made available in .PDF format for the convenience of users; however, the accuracy and correctness of the document can only be certified as was presented in the original hard copy format.


Clockwise from left: Sampling eelgrass (Zostera marina) at Auke Nu Cove in the City and Boroughof Juneau, Alaska; exposed eelgrass; and submerged eelgrass with a sampling quadrat.


iii
ABSTRACT Eelgrass (Zostera marina) is an ecologically important nearshore habitat and is susceptible to degradation and loss due to coastal development and natural environmental changes. The distribution, areal extent, health, and faunal use of eelgrass habitat within the City and Borough of Juneau (CBJ), Alaska are unknown. We sampled eelgrass and faunal assemblages at 15 locations in the CBJ from 2004 to 2007 to establish a baseline of information to track long-term and large-scale biotic changes. Eelgrass was present on approximately 3% of the estimated 235 km of shoreline surveyed and occupied a total of 20.4 ha. Repeated sampling over 4 years found that most eelgrass beds were stable in size. Eelgrass characteristics (i.e., above-ground stem density, biomass) varied among years and locations and were generally lower than in other Pacific Northwest eelgrass beds.
Diverse species were found in the eelgrass beds, underscoring the importance of eelgrass as fishery habitat. A total of 18,134 fish, representing 42 species, were captured with a beach seine. The five most abundant species in decreasing order of abundance were chum salmon (Oncorhynchus keta), tubesnout (Aulorhynchus flavidus), crescent gunnel (Pholis laeta), threespine stickleback (Gasterosteus aculeatus), and Pacific herring (Clupea pallasii). Juvenile fish dominated our catches, indicating that eelgrass may be important nursery habitat in the CBJ for some species. The most ubiquitous invertebrate species epiphytic on eelgrass was the variegated chink snail (Lacuna variegata), whereas the most common invertebrates captured with a seine were juvenile shrimp (Crangonidae and Pandalidae), hermit crabs (Pagurus spp.), and juvenile Dungeness crabs (Cancer magister). We identified five locations representing a wide range of geographic locations and potential development for long-term monitoring. Limited distribution of eelgrass in the CBJ and its importance for many commercially important species warrant the monitoring and protection of this valuable habitat.


v
CONTENTS Abstract ........................................................................................................................................ iii Introduction....................................................................................................................................1 Study Area .....................................................................................................................................2 Materials and Methods...................................................................................................................2
Eelgrass Mapping and Description ......................................................................................2 Faunal Sampling ..................................................................................................................3 Water Temperature and Salinity ..........................................................................................3
Data Analysis .................................................................................................................................4 Results............................................................................................................................................4 Eelgrass Mapping and Description ......................................................................................4
Fauna....................................................................................................................................6 Water Temperature and Salinity ..........................................................................................6
Discussion......................................................................................................................................6 Eelgrass Distribution and Description .................................................................................6 Fauna....................................................................................................................................7 Water Temperature and Salinity ..........................................................................................8 Monitoring ...........................................................................................................................9 Acknowledgments........................................................................................................................10 Citations .......................................................................................................................................11 Tables...........................................................................................................................................14 Figures..........................................................................................................................................23 Appendices...................................................................................................................................42


INTRODUCTION
Eelgrass (Zostera marina) is the most widely distributed seagrass along the North
American Pacific coast (Wyllie-Echeverria and Ackerman 2003), but it is susceptible to anthropogenic and natural environmental changes both in nearshore waters and on adjacent uplands. The low-gradient sheltered beaches, typical of eelgrass habitat, are often sought for development. Coastal modifications such as dredging, filling, or construction of overwater structures (e.g., ferry terminals, docks, residential floats) can eliminate or displace eelgrass (Wyllie-Echeverria and Ackerman 2003). Increased nutrient loads from agricultural runoff and sewer outfalls, sedimentation, and pervasive propeller or anchor scour have also been correlated with reductions in eelgrass bed area, density, depth limits, and biomass (Orth et al. 2006). In Alaska, filling, dredging, and deposition of logging and fish processing waste threaten eelgrass habitat (National Marine Fisheries 2005); eelgrass loss from such activities, however, is poorly documented.
Eelgrass beds in the nearshore waters of the City and Borough of Juneau (CBJ) are not widely distributed and are particularly vulnerable to development because construction on the predominantly steep terrain is often more difficult and expensive than on wetland habitat. Public harbors, private and commercial docks, and mariculture continue to be permitted in or near eelgrass beds. Since this study began in 2004, a fish processing plant began operation and a 60,000-68,000 liter oil spill occurred within a few meters of an eelgrass bed. Most recently, a new commercial loading facility has been permitted in the eelgrass bed at Auke Nu Cove.
Eelgrass supports high abundance and diversity of marine fish and invertebrates (Constanza et al.1997, Murphy et al. 2000, Johnson et al. 2003, Johnson and Thedinga 2005, Johnson et al. 2005), and may be an essential habitat for some species. In Alaska, eelgrass is used as a spawning substrate by Pacific herring (Clupea pallasii) (Blankenbeckler and Larson 1982) and provides rearing habitat in spring and summer for many sport and commercial fish species (Johnson and Thedinga 2005). Eelgrass also provides other important ecological functions–oxygen production, nutrient recycling, erosion control, and contaminant filtration (Spalding et al. 2003).
To date, there has not been an inventory of eelgrass beds in the CBJ. Anecdotally, it is known that some beds have changed over time, but changes near development sites have not been documented nor compared to beds not subject to developmental pressure. Environmental assessments of proposed development projects (USCOE 1984, USCOE 1985, ADOT 1996) identified some eelgrass beds in the CBJ, but lack of geo-referenced mapping decreased the usefulness of these studies as baseline information for monitoring potential changes in eelgrass habitat. In addition, most eelgrass beds in the CBJ have never been sampled for fish or invertebrates; exceptions are beds at Echo and Bridget coves (Harris et al. 2005).
Our study was undertaken to provide a baseline of information on the distribution, size, health, and faunal use of eelgrass within the CBJ for long-term assessment of biotic change. To establish the baseline and develop a measure of annual variability, we sampled eelgrass communities at 15 locations over a 4-year period for physical and biological characteristics (e.g., water temperature, stem density, faunal assemblages). Periodic re-sampling of some of these locations will allow resource managers to monitor large-scale and long-term changes in eelgrass communities and guide future development and protection of this valuable habitat.

2
STUDY AREA
The CBJ encompasses 841,228 hectares (ha) (8,412 km2) of northern southeastern Alaska (Fig. 1). Our study focused on eelgrass sites that were accessible from the road system since future development will probably concentrate around this transportation corridor. The shoreline near Juneau is characterized by a mosaic of habitat types including protected bays, exposed rocky shorelines, deep inlets, numerous islands, and glacial fiords. Approximately 235 km of shoreline was surveyed for eelgrass; this represents about 30% of the entire shoreline in the CBJ (Fig. 1). Within the survey area, eelgrass was identified at 15 locations (Fig. 1); at many of these locations, there was more than one eelgrass bed. Most eelgrass and faunal assemblages were sampled in summer 2004 to 2007 (Table 1).
MATERIALS AND METHODS
Eelgrass Mapping and Description
All 15 eelgrass beds were mapped at least once from 2004 to 2007 (Table 1). At extreme
low tide, a person with a backpack Trimble TSC1® Asset Surveyor GPS (global positioning system) walked the exposed perimeter of the eelgrass bed following the edge of the bed as closely as possible. On foot, eelgrass could be mapped in water up to about 1 m deep. Deeper portions of beds were mapped from a small boat by motoring slowly around the bed perimeter while keeping the GPS antenna over the visible edge. The GPS collected real-time, differentially corrected positions once each second while we circumnavigated the eelgrass beds. Accuracy of positions was +0.5 m. Eelgrass maps (Figs. 2-16) are presented at a scale of 1:4,000, with the exceptions of Echo Cove (Fig. 2, 1:11,000) and Fish Creek (Fig. 15, 1:7,000). For those beds mapped more than once, the eelgrass shown on the map and the eelgrass area calculated is a compilation of all mapping.
Beach slope and tide height were determined using a laser level. A permanent transect perpendicular to the waterline was established at seven locations (Appendix 1) from the lower edge of the exposed bed to the upper edge and divided into 0.5 m blocks by tidal elevation. For example, if a bed extended from -1.0 m to +1.5 m tidal elevation relative to mean lower low water (MLLW = 0 m), five tidal blocks were delineated (block 1, -1.0 m to -0.5 m; block 2, -0.5 m to 0.0 m; block 3, 0.0 m to +0.5 m; block 4, +0.5 m to +1.0 m; and block 5, +1.0 m to +1.5 m). Some beds extended below tidal block 1, and only a few beds extended into tidal block 5. Substrate was visually examined and classified on site. Eelgrass characteristics (percent cover, canopy height, stem density, biomass) were measured along each permanent transect following the methods of Duarte and Kirkman (2001) and Short et al. (2004). A 0.5 m × 0.5 m quadrat was placed (using a random numbers table) five times in each tidal block. Percent cover was the percentage of the quadrat covered by eelgrass shoots to the nearest 5% when beds were exposed. Percent-cover reference photos were used to standardize estimates, and two observers often conferred to determine an estimate. Canopy height was the height in millimeters (mm) of 80% of the eelgrass shoots in a quadrat (i.e., the tallest 20% were not included in this measurement). Above-ground stem density was determined by counting stems in a subquadrat (0.25 m × 0.25 m) placed inside the upper left corner of the 0.5 m × 0.5 m quadrat. To estimate above-ground biomass, all eelgrass shoots at the substrate

3
surface in half of the subquadrat were clipped and collected. In the laboratory, each eelgrass shoot was rinsed and scraped of sediment and epiphytic flora and fauna. The separated shoots and epiphytes were then dried at 60° C to a constant weight and were weighed to the nearest 0.01 g. Epiphytic and benthic fauna in each 0.5 m × 0.5 m quadrat were identified to major taxonomic groups. At an additional four locations (Bridget Cove north, Auke Village, Indian Cove, and Waydelich Creek, Fig. 1), only percent cover, slope, and substrate were determined. Percent cover was estimated by placing a 0.5 m × 0.5 m quadrat every five paces along a temporary transect at right angles to the shoreline.
Faunal Sampling
Fish and invertebrates were sampled with a beach seine at 9 of the 15 locations (Fig. 1). Locations were selected because they had relatively large areas of eelgrass with sufficient gradient and were free from obstructions. Two locations (Echo Cove and Auke Nu Cove) had more than one seine site (Figs. 2, 11). Locations of seine sites were recorded with GPS (Table 1). At most seine sites, fauna were sampled with a variable-mesh 37-m long net that tapered from 5 m wide at the center to 1 m wide at the ends. Outer panels were each 10 m of 32-mm stretch mesh, intermediate panels were each 4 m of 6-mm square mesh, and the bunt was 9 m of 3.2-mm square mesh. We set the seine as a round haul by holding one end of the seine on the beach, backing around in a skiff with the other end along the beach about 18 m from the start, and pulling the seine onto shore. The seine had a lead line and a float line so that the bottom contacted the substrate and the top floated. In 2006, we began using a 37-m long, non-tapering (1.2 m wide), non-variable mesh (3.2-mm) net at four locations with low beach gradients (< 3.5%) (Tee Harbor, Auke Nu Cove, Bay Creek, and Peterson Creek; Fig. 1). This narrower net was more practical for the low gradients at these locations. We set the narrower seine as a modified round haul by having two people, each holding opposite ends of the seine, disembark either side of the bow of the skiff in about 1.0 m of water and then walk towards the beach pulling the seine onto shore about 18 m apart. All sampling occurred in daylight and within 2 hours of low tide (range +1.0 m to -1.5 m below MLLW).
Captured fish were identified to species and enumerated. Fork length or total length (TL) (the appropriate measurement for a given species) was measured to the nearest millimeter for up to 50 individuals of each fish species. Fish were anesthetized in a mixture of 1 part carbonated water to 2 parts seawater for identification and measurement. Smaller individuals (< 50 mm TL) of some families of fish (e.g., Cottidae, Gadidae, Hexagrammidae) that could not be easily identified to species in the field, were grouped and recorded as juvenile sculpin, juvenile cod, or juvenile greenling. Invertebrates collected in the seine were identified to major taxonomic groups and enumerated. Fauna were released at site of capture after they had been measured and counted.
Water Temperature and Salinity
Surface water temperature and salinity were measured at seine sites with a thermometer
and hand-held refractometer at about 20 cm depth. In addition, TidbiT1 thermographs recorded
1 Onset Computer Corporation, PO Box 3450, Pocasset, Massachusetts.
4
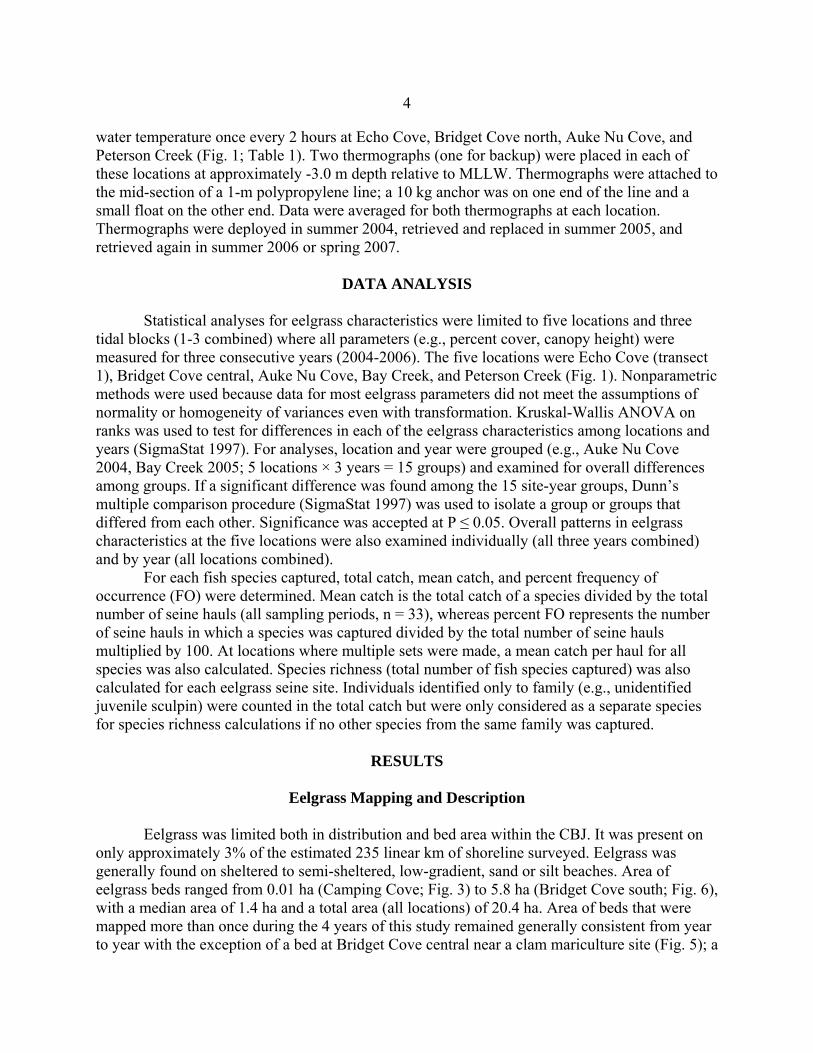
water temperature once every 2 hours at Echo Cove, Bridget Cove north, Auke Nu Cove, and Peterson Creek (Fig. 1; Table 1). Two thermographs (one for backup) were placed in each of these locations at approximately -3.0 m depth relative to MLLW. Thermographs were attached to the mid-section of a 1-m polypropylene line; a 10 kg anchor was on one end of the line and a small float on the other end. Data were averaged for both thermographs at each location. Thermographs were deployed in summer 2004, retrieved and replaced in summer 2005, and retrieved again in summer 2006 or spring 2007.
DATA ANALYSIS
Statistical analyses for eelgrass characteristics were limited to five locations and three tidal blocks (1-3 combined) where all parameters (e.g., percent cover, canopy height) were measured for three consecutive years (2004-2006). The five locations were Echo Cove (transect 1), Bridget Cove central, Auke Nu Cove, Bay Creek, and Peterson Creek (Fig. 1). Nonparametric methods were used because data for most eelgrass parameters did not meet the assumptions of normality or homogeneity of variances even with transformation. Kruskal-Wallis ANOVA on ranks was used to test for differences in each of the eelgrass characteristics among locations and years (SigmaStat 1997). For analyses, location and year were grouped (e.g., Auke Nu Cove 2004, Bay Creek 2005; 5 locations × 3 years = 15 groups) and examined for overall differences among groups. If a significant difference was found among the 15 site-year groups, Dunn’s multiple comparison procedure (SigmaStat 1997) was used to isolate a group or groups that differed from each other. Significance was accepted at P ≤ 0.05. Overall patterns in eelgrass characteristics at the five locations were also examined individually (all three years combined) and by year (all locations combined).
For each fish species captured, total catch, mean catch, and percent frequency of occurrence (FO) were determined. Mean catch is the total catch of a species divided by the total number of seine hauls (all sampling periods, n = 33), whereas percent FO represents the number of seine hauls in which a species was captured divided by the total number of seine hauls multiplied by 100. At locations where multiple sets were made, a mean catch per haul for all species was also calculated. Species richness (total number of fish species captured) was also calculated for each eelgrass seine site. Individuals identified only to family (e.g., unidentified juvenile sculpin) were counted in the total catch but were only considered as a separate species for species richness calculations if no other species from the same family was captured.
RESULTS
Eelgrass Mapping and Description
Eelgrass was limited both in distribution and bed area within the CBJ. It was present on only approximately 3% of the estimated 235 linear km of shoreline surveyed. Eelgrass was generally found on sheltered to semi-sheltered, low-gradient, sand or silt beaches. Area of eelgrass beds ranged from 0.01 ha (Camping Cove; Fig. 3) to 5.8 ha (Bridget Cove south; Fig. 6), with a median area of 1.4 ha and a total area (all locations) of 20.4 ha. Area of beds that were mapped more than once during the 4 years of this study remained generally consistent from year to year with the exception of a bed at Bridget Cove central near a clam mariculture site (Fig. 5); a

5
portion of this bed increased from 0.15 ha in 2004 and 2005 to 0.26 ha in 2007. Beach slopes ranged from 1% (Peterson Creek; Fig. 16) to 12% (Echo Cove; Fig 2), with a median slope of 3.4%. Eelgrass depth distribution was also limited and ranged from -2.8 m to +2.0 m relative to MLLW (Figs. 2-16). Only the eelgrass bed at Camping Cove (Fig. 3) was entirely subtidal. Upper tidal height limits were highly variable, ranging from -0.4 m at Echo Cove (Fig. 2) to +2.0 m at Bridget Cove south (Fig. 6). Variability appeared to relate to substrate, slope, and drainage. Beaches supported eelgrass at higher elevations in drainage channels or tide pools or on substrates that were not well-drained because of mussel beds, topography, or fine sediments. Eelgrass beds tended to be relatively narrow on steeper shores and more expansive where gradients were shallower at the head of bays or coves. Percent cover, canopy height, stem density, and biomass differed significantly (P < 0.001) among locations and years. Some of the significant differences identified in pairwise comparisons were the following: for percent cover, Bay Creek 2004 versus Peterson Creek 2004, 2005, and 2006; for canopy height, Echo Cove 2004 versus Peterson Creek 2004, 2005, and 2006; for stem density, Bay Creek 2004 versus Echo Cove 2005 and 2006; and for biomass, Auke Nu Cove 2004 versus Peterson Creek 2004 and 2005. A matrix of all pairwise comparisons and their significance is given in Appendix 2. Some site differences in eelgrass characteristics were associated with substrate type, energy exposure, or tidal elevation. For example, mean percent cover was 27% at Peterson Creek versus 80% at Bay Creek (Fig. 17); Peterson Creek is a sandy, moderately exposed beach compared to Bay Creek where the substrate is finer and the beach more protected. Similarly, mean canopy height ranged from 244 mm at Peterson Creek to 702 mm at Echo Cove (Fig. 17). At Echo Cove, eelgrass distribution was limited to the lowest tidal block, where grass blades in all beds tended to be longer than blades at shallower depths; the mean canopy height at Echo Cove, therefore, was relatively long compared to beds with distribution over a greater tidal range. Eelgrass distribution at Peterson Creek was higher in the intertidal; hence, mean canopy height was shorter. A more detailed description of all eelgrass characteristics by location, transect, year, and tidal block is provided in Appendix 1.
By year (all five locations combined), overall mean percent cover, density, and biomass were highest in 2004, lowest in 2005, and intermediate in 2006 (Fig. 18). For example, mean percent cover was 68% in 2004, 53% in 2005, and 59% in 2006. Overall mean canopy heights, however, were similar (about 428 mm) in all 3 years (Fig. 18). Individual beds did not always follow the above patterns. For example, at Bridget Cove central, stem density increased each year from 419 stems/m2 in 2004 to 480 stems/m2 in 2006.
Fauna
A total of 18,134 fish representing at least 42 species were captured in 33 seine hauls (all sampling periods; Table 2). Among locations, mean catch per seine haul ranged from 73 fish (n = 3) at Peterson Creek to 1,195 fish (n = 3) at Bridget Cove south (Table 2). Catches were strongly influenced by month of sampling. For example, at Bridget Cove (north, central and south), 5,722 juvenile chum salmon (Oncorhynchus keta) were captured in June 2004, 142 in July 2005, and zero in August 2006. Similarly, at Echo Cove, 468 chum salmon were captured in June 2004, 50 fish in July 2005, and zero fish in August 2006.

6
Based on total catch, the five most abundant species accounted for 86% of the overall catch. The five most abundant species in decreasing order of abundance were chum salmon (35% of total catch), tubesnout (Aulorhynchus flavidus, 25%), crescent gunnel (Pholis laeta, 13%), threespine stickleback (Gasterosteus aculeatus, 7%), and Pacific herring (Clupea pallasii, 6%). Some species were captured infrequently but often in large numbers (e.g., chum salmon–6,400 fish in 33% of all seine hauls), whereas other species were captured frequently but usually in small numbers (e.g., Pacific staghorn sculpin–260 fish in 79% of all seine hauls) (Table 2). Other species important in sport or commercial fisheries that were caught in small numbers (< 4% of total catch) were walleye pollock (Theragra chalcogramma), coho salmon (O. kisutch), Pacific cod (Gadus macrocephalus), pink salmon (O. nerka), Dolly Varden (Salvelinus malma), cutthroat trout (O. clarkia), Chinook salmon (O. tshawytscha), steelhead trout (O. mykiss), and sockeye salmon (O. nerka). Forage fish species caught in small numbers (< 0.1% of total catch) were surf smelt (Hypomesus pretiosus), Pacific sand lance (Ammodytes hexapterus), Pacific sandfish (Trichodon trichodon), and capelin (Mallotus villosus).
Species richness ranged from 7 at Peterson Creek to 31 at Bridget Cove central (Table 2). The most ubiquitous species, crescent gunnel, Pacific staghorn sculpin, threespine stickleback, and frog sculpins (Myoxocephalus stelleri) were captured at all seine sites (Table 2). Other widely distributed species were tubesnout and starry flounder (Platichthys stellatus); these species were captured at 11 of the 12 sites.
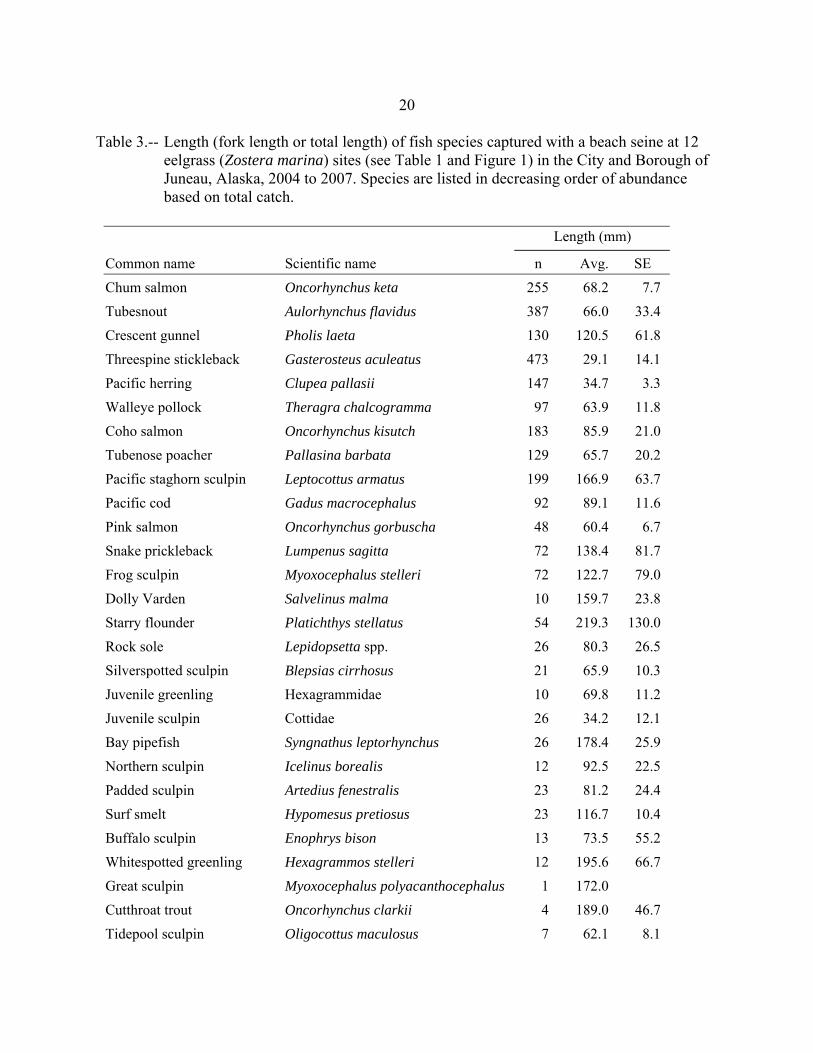
Most of the commercially important and forage fish species captured were juveniles (FishBase 2008). For example, mean length ranged from 35 mm for Pacific herring to 89 mm for Pacific cod (Table 3). All chum and pink salmon captured were young-of-the-year; mean fork length was less than 69 mm. Some of the largest species captured were starry flounder (219 mm mean total length) and whitespotted greenling (Hexagrammos stelleri; 196 mm mean fork length).
At least 25 invertebrate species were either observed epiphytic on eelgrass along transects, or captured with a beach seine (Table 4). The number of invertebrate species ranged from 6 at Echo Cove to 13 at Auke Nu Cove. The most ubiquitous epiphytes on eelgrass, variegated chink snail (Lacuna varigata) and juvenile Pacific blue mussel (Mytilus trossulus), were observed at seven locations. Other common epiphytic animals were barnacles (Balanus glandula and Semibalanus balanoides), bryozoans (Membraniporidae), and juvenile limpets (Lottiidae). Dry weights of epiphytic fauna and flora ranged from 2.0 g/m2 (Bay Creek, tidal block 5) to 35.6 g/m2 (Bridget Cove central, tidal block 1). Adult Mytilus were common as well but were attached to the substrate rather than eelgrass blades. False white sea cucumber (Eupentacta pseudoquinquesemita), mottled sea star (Evasterias troschellii), and amphipods (Gammarus spp.) were often observed. The most numerous invertebrates captured with the beach seine were juvenile shrimp (Pandalidae and Crangonidae, n >1,000) and hermit crabs (Pagurus spp., n = 160) (Table 4). Sixty-two juvenile Dungeness crabs (Cancer magister) were captured with a beach seine; most (92%) were captured at Bridget Cove.
Water Temperature and Salinity
At the four thermograph sites, annual mean seawater temperatures ranged from 7.9° to
8.5° C (SE = 0.85 to 1.21). Monthly mean seawater temperature profiles were similar at the four thermograph sites (Fig. 19), ranging from 3° C in February to 15° C in July. Salinity ranged from
7
2 to 28 practical salinity scale (PSS) during the summer months (June, July, and August), with a mean of 25 PSS in June, 15 PSS in July, and 10 PSS in August. Surface salinities became more dilute with seasonal fresh water input and increased stratification of the water column.
DISCUSSION
Eelgrass Distribution and Description
Eelgrass is very limited in the City and Borough of Juneau. Eelgrass was found at 15
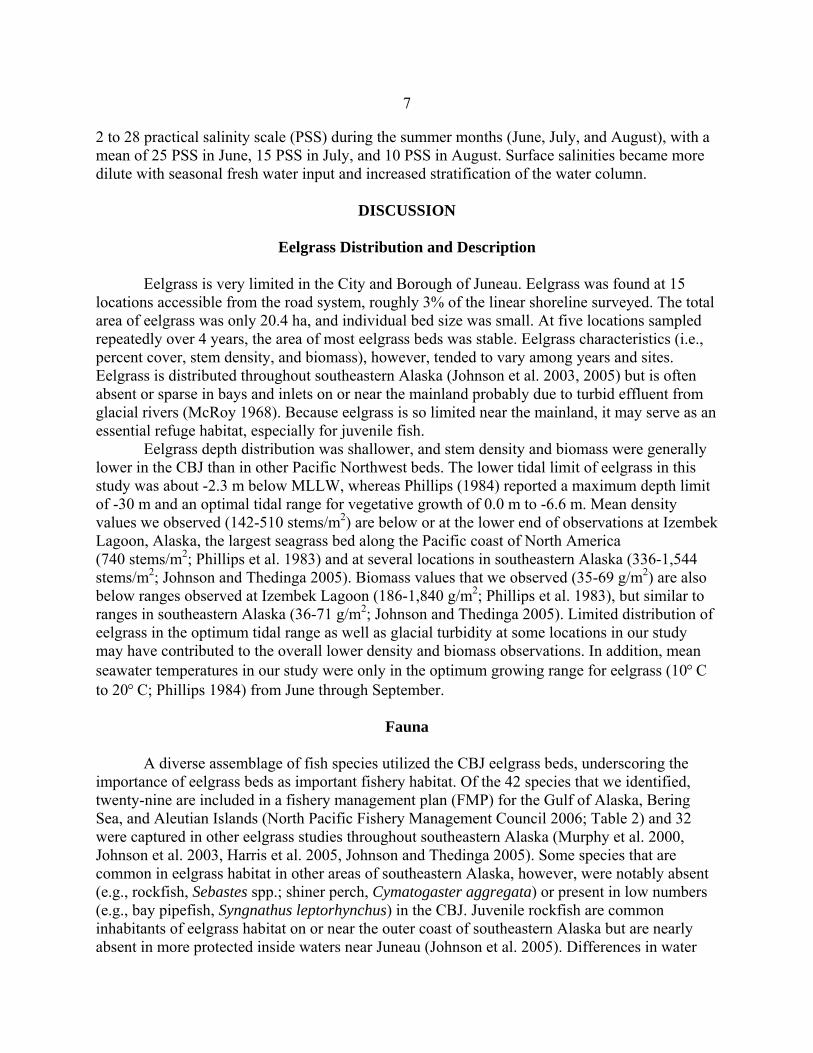
locations accessible from the road system, roughly 3% of the linear shoreline surveyed. The total area of eelgrass was only 20.4 ha, and individual bed size was small. At five locations sampled repeatedly over 4 years, the area of most eelgrass beds was stable. Eelgrass characteristics (i.e., percent cover, stem density, and biomass), however, tended to vary among years and sites. Eelgrass is distributed throughout southeastern Alaska (Johnson et al. 2003, 2005) but is often absent or sparse in bays and inlets on or near the mainland probably due to turbid effluent from glacial rivers (McRoy 1968). Because eelgrass is so limited near the mainland, it may serve as an essential refuge habitat, especially for juvenile fish. Eelgrass depth distribution was shallower, and stem density and biomass were generally lower in the CBJ than in other Pacific Northwest beds. The lower tidal limit of eelgrass in this study was about -2.3 m below MLLW, whereas Phillips (1984) reported a maximum depth limit of -30 m and an optimal tidal range for vegetative growth of 0.0 m to -6.6 m. Mean density values we observed (142-510 stems/m2) are below or at the lower end of observations at Izembek Lagoon, Alaska, the largest seagrass bed along the Pacific coast of North America (740 stems/m2; Phillips et al. 1983) and at several locations in southeastern Alaska (336-1,544 stems/m2; Johnson and Thedinga 2005). Biomass values that we observed (35-69 g/m2) are also below ranges observed at Izembek Lagoon (186-1,840 g/m2; Phillips et al. 1983), but similar to ranges in southeastern Alaska (36-71 g/m2; Johnson and Thedinga 2005). Limited distribution of eelgrass in the optimum tidal range as well as glacial turbidity at some locations in our study may have contributed to the overall lower density and biomass observations. In addition, mean seawater temperatures in our study were only in the optimum growing range for eelgrass (10° C to 20° C; Phillips 1984) from June through September.
Fauna
A diverse assemblage of fish species utilized the CBJ eelgrass beds, underscoring the importance of eelgrass beds as important fishery habitat. Of the 42 species that we identified, twenty-nine are included in a fishery management plan (FMP) for the Gulf of Alaska, Bering Sea, and Aleutian Islands (North Pacific Fishery Management Council 2006; Table 2) and 32 were captured in other eelgrass studies throughout southeastern Alaska (Murphy et al. 2000, Johnson et al. 2003, Harris et al. 2005, Johnson and Thedinga 2005). Some species that are common in eelgrass habitat in other areas of southeastern Alaska, however, were notably absent (e.g., rockfish, Sebastes spp.; shiner perch, Cymatogaster aggregata) or present in low numbers (e.g., bay pipefish, Syngnathus leptorhynchus) in the CBJ. Juvenile rockfish are common inhabitants of eelgrass habitat on or near the outer coast of southeastern Alaska but are nearly absent in more protected inside waters near Juneau (Johnson et al. 2005). Differences in water
8
temperature, salinity, and turbidity between inside and outside waters of southeastern Alaska likely influence the different distribution patterns of species.
Seasonality and aggregating behavior of some species (e.g., Pacific herring) can also influence distribution patterns. For example, at Bridget Cove, abundance of herring varied between the three Bridget Cove seine sites on the same day of sampling in June 2005; 437 fish were captured at the central location and 2 or fewer fish at the north and south locations. While differences in individual eelgrass beds could explain this variability in catch, it is more likely a result of the aggregating behavior of herring (Carlson 1980). Further, we did not capture any herring in Bridget Cove in 2004. Johnson and Thedinga (2005) also reported “hit or miss” catches of several species in eelgrass. Similarly, seasonal use patterns were evident for some species. At Bridget Cove, 5,722 chum salmon fry were captured in June 2004, 142 in July 2005, and zero in August 2006. From mid-April to mid-June, chum salmon fry are abundant in nearshore waters of Alaska (Celewycz et al. 1994) and then move offshore to deeper waters by mid-summer.
The dominance of relatively few species at any eelgrass location in the CBJ is similar to many other nearshore studies. Three species accounted for greater than 68% of the total catch in southeastern Alaska (Johnson and Thedinga 2005), and five or fewer species accounted for greater than 98% of the individuals captured in central and southern California (Allen and Horn 1975, Allen 1982). Two of the most ubiquitous species in our study, crescent gunnel and Pacific staghorn sculpin, were captured at every eelgrass location reported in Johnson et al. (2005). Juvenile fish dominated our catches, indicating that eelgrass may be important nursery habitat in the CBJ for some species. Worldwide, the importance of seagrasses as nursery areas has been well documented (Thayer et al. 1978, Macdonald and Chang 1993, Laur and Haldorson 1996). We cannot assess the nursery value of eelgrass, however, because we did not sample adjacent habitat types, and we sampled only in late spring and summer. We do know from this study and others in southeastern Alaska (Murphy et al. 2000, Johnson et al. 2003, Harris et al. 2005, Johnson and Thedinga 2005), however, that juveniles of many commercially important and forage fish species utilize eelgrass habitat. Historically, Pacific herring utilized the near shore for spawning and rearing in the CBJ; herring use of these areas has declined since the 1970s, however, likely from habitat alteration and degradation, especially in Auke Bay (Williams et al. 2004). The invertebrate community we observed in eelgrass (e.g., mussels, barnacles, shrimps, snails, and crabs) is similar to that reported by other studies in the Pacific Northwest (Phillips 1984). For commercially important species such as Dungeness crabs, eelgrass provides valuable nursery habitat for juveniles (Thayer and Phillips 1977, McMillan et al. 1995). The abundance and diversity of invertebrates in eelgrass provides a food source for many predators and contributes to the overall productivity of eelgrass.
Water Temperature and Salinity Annual seawater surface temperatures and pattern of minimum and maximum
temperatures at our thermograph sites were similar to ranges reported for Auke Bay (Wing et al. 2006) and for other locations in northern southeastern Alaska (Johnson et al. 2003, Johnson and Thedinga 2005). In all studies, mean monthly water temperatures were usually lowest in February or March and highest in July or August. Salinities in our study were sometimes lower
9
than those reported by Johnson et al. (2003) and Johnson and Thedinga (2005) because all CBJ sites were on the mainland and more influenced by freshwater input and seasonal water stratification.
Monitoring The baseline information provided by this study establishes monitoring sites to track
changes in eelgrass communities in the CBJ. The best monitoring locations would be those that we sampled most consistently for both eelgrass characteristics and faunal assemblages (Echo Cove, Bridget Cove central, Auke Nu Cove, Bay Creek, and Peterson Creek). These five locations are widely distributed geographically and represent a gradient of development. Auke Nu Cove and Bay Creek continue to be developed as recreational and commercial harbors; future recreational developments may impact the Echo Cove and Peterson Creek beds. Bridget Cove central is a mariculture site, but as a CBJ natural area park, it is least likely to experience commercial or residential development and could serve as a control site to monitor impacts in the other beds.
Eelgrass community response to environmental change may vary both temporally and spatially. Immediate changes could be expected in a local bed from physical damage resulting from filling, dredging, or vessel grounding. An immediate response could be reduction in bed area. Shading by overwater structures (e.g., docks) may have a more delayed impact such as reduced percent cover or stem density. Regional, long-term changes could be expected from isostatic rebound or increases in sea water temperatures, sea level, or glacial runoff. Possible indicators of regional change include the consistent increase or decrease of a specific eelgrass characteristic (e.g., bed size, depth distribution) at several monitored locations. A change in bed size would likely have to be large to indicate change, however, because of occasional large annual fluctuations in bed area (Johnson and Thedinga 2005). For faunal assemblages, shifts in the composition of the most abundant species or the appearance of a new species may also indicate environmental change.
A reasonable approach for monitoring would be to resample our five eelgrass locations every 5 years to track changes in bed area, stem density, and faunal assemblages–characteristics shown to be responsive to environmental change (Hauxwell et al. 2003, Jenkins et al. 1993). If a location undergoes major development, however, more frequent monitoring would be necessary to document immediate impacts and suggest possible mitigation. Periodic monitoring would allow a comparison of eelgrass characteristics and faunal assemblages in each location relative to overall trends, to a control site (Bridget Cove central), or to other areas monitored in northern southeastern Alaska (Johnson and Thedinga 2005). To reduce temporal variability, monitoring should occur at the same time of year; the last low tide series in July would be preferable since we have the most baseline data for this period. In addition, eelgrass bed area and growth are at their annual maxima in July and faunal assemblages are no longer inundated by hatchery salmon. In the City and Borough of Juneau coastal areas, continuing development threatens to reduce eelgrass bed size and productivity. Further harbor development, a second Gastineau Channel crossing, expansion of transportation corridors, and increased shoreline development are possible in the next decade. The limited distribution of eelgrass and its vulnerability to shoreline development warrant the periodic monitoring, and protection of this important coastal habitat.

10
ACKNOWLEDGMENTS This study was funded by NOAA Fisheries (National Marine Fisheries Service) Essential
Fish Habitat Program. We thank Sara Roa, Sarah Lyn McConahay, Fletcher Sewall, Elizabeth Siddon, Dugan Greenwell, John Hudson, John Hill, Brian VanWinkle, Cedar Stark, Cadie Buckley, Gabrielle Vance, Clay Wertheimer, Josh Fillible, Neal Muirhead, Troy Martin, Kyle Russell, Michael Kohan, Marie Larsen, Josie Lunasin, Bonnie Herbold, Cindy Hartmann, Katharine Miller, Susan Walker, and Amy Lortie for assistance in sampling. We also thank Michelle Masuda and Jacek Maselko for statistical support and Dr. Stanley “Jeep” Rice, Dr. Adam Moles, Susan Walker, and Teri Camery for manuscript review.

11
CITATIONS Alaska Department of Transportation (ADOT). 1996. Auke Bay ferry terminal upgrade
environmental assessment. State Project #75227. Available from Alaska Department of Transportation and Public Facilities, P.O. Box 112500, Juneau, AK 99811-2500.
Allen, L. G., and M. H. Horn. 1975. Abundance, diversity and seasonality of fishes in Colorado Lagoon, Alamitos Bay, California. Est. Coast. Shelf Sci. 3:371-380.
Allen, L. G. 1982. Seasonal abundance, composition, and productivity of the littoral fish assemblage in upper Newport Bay, California. Fish. Bull., U.S. 80:769-789.
Blankenbeckler, D., and R. Larson. 1982. Pacific herring (Clupea harengus pallasii) spawning ground research in southeastern Alaska, 1978, 1979, and 1980. ADF&G Technical Data Report 69. Alaska Department of Fish and Game, Juneau, AK.
Carlson, H. R. 1980. Seasonal distribution and environment of Pacific herring near Auke Bay, Lynn Canal, southeastern Alaska. Trans. Amer. Fish. Soc. 109:71-78.
Celewycz, A. G., A. C. Wertheimer, J. A. Orsi, and J. L. Lum. 1994. Nearshore distribution and residency of pink salmon (Oncorhynchus gorbuscha) and chum salmon (O. keta) fry and their predators in Auke Bay and Gastineau Channel, Southeast Alaska. AFSC Processed. Rep. 94-05, 39 p. Alaska. Fish. Sci. Cent., Natl. Mar. Fish. Serv., NOAA, Auke Bay Laboratory, 11305 Glacier Highway, Juneau, AK 99801-8626.
Constanza, R., R. d’Arge, R. de Groot, S. Farber, M. Grasso, B. Hannon, K. Limburg, S. Naeem, R. V. O’Neill, J. Paruelo, R. G. Raskin, P. Sutton, and M. van den Belt. 1997. The value of the world’s ecosystem services and natural capital. Nature 387:253-260.
FishBase. 2008. Frose, R. and D. Pauly (editors). World Wide Web electronic publication. Retrieved 29 December 2008 from http://fishbase.org.
Duarte, C. M., and H. Kirkman. 2001. Methods for the measurement of seagrass abundance and depth distribution, p. 142-153. In Short, F. T. and R. G. Coles (editors), Global seagrass research methods. Elsevier Science B.V. Amsterdam.
Harris, P. M., S. W. Johnson, L. G. Holland, A. D. Neff, J. F. Thedinga, and S. D. Rice. 2005. Hydrocarbons and fisheries habitat in Berners Bay, Alaska: Baseline monitoring associated with the Kensington Gold Mine. AFSC Processed Rep. 2005-06, 44 p. Alaska Fish. Sci. Cent., Natl. Mar. Fish. Serv., NOAA, Auke Bay Laboratory, 17109 Pt. Lena Loop Road, Juneau, AK 99801.
Hauxwell, J., J. Cebrian, and I. Valiela. 2003. Eelgrass Zostera marina loss in temperate estuaries: Relationship to land-derived nitrogen loads and effect of light limitation imposed by algae. Mar. Ecol. Prog. Ser. 247:59-73.
Jenkins, G. P., G. J. Edgar, H. M. A. May, and C. Shaw. 1993. Ecological bases for parallel declines in seagrass habitat and catches of commercial fish in Western Port Bay, Victoria, p. 124-136. In D. A. Hancock (editor), Sustainable fisheries through sustaining fish habitat. Australian Society of Fish Biology Workshop, Victor Harbour, South Australia. AGPS.
Johnson, S. W., M. L. Murphy, D. J. Csepp, P. M. Harris, and J. F. Thedinga. 2003. A survey of fish assemblages in eelgrass and kelp habitats of southeastern Alaska. U.S. Dep. Commer., NOAA Tech. Memo.NMFS-AFSC-139, 39 p.

12
Johnson, S. W., and J. F. Thedinga. 2005. Fish use and size of eelgrass meadows in southeastern Alaska: A baseline for long-term assessment of biotic change. Northwest Sci. 79:141-155.
Johnson, S. W., A. D. Neff, and J. F. Thedinga. 2005. An atlas on the distribution and habitat of common fishes in shallow nearshore waters of southeastern Alaska. U.S. Dep. Commer. NOAA Tech. Memo. NMFS-AFSC-157, 89 p.
Laur, D., and L. Haldorson. 1996. Coastal habitat studies: The effect of the Exxon Valdez oil spill on shallow subtidal fishes in Prince William Sound, p. 659-670. In S. D. Rice, R. B. Spies, D. A. Wolfe, and B. A. Wright (editors), Proceedings of the Exxon Valdez oil spill symposium. American Fisheries Society Symposium 18, Bethesda, MD.
Macdonald, J. S., and B. D. Chang. 1993. Seasonal use by fish of nearshore areas in an urbanized coastal inlet in southwestern British Columbia. Northwest Sci. 67:63-77.
McMillan, R. O., D. A. Armstrong, and P. A. Dinnel. 1995. Comparison of intertidal habitat use and growth rates of two northern Puget Sound cohorts of 0+ age Dungeness crab, Cancer magister. Estuaries 18:390-398.
McRoy, C. P. 1968. The distribution and biogeography of Zostera marina (eelgrass) in Alaska. Pac. Sci. 22:507-513.
Murphy, M. L., S. W. Johnson, and D. J. Csepp. 2000. A comparison of fish assemblages in eelgrass and adjacent subtidal habitats near Craig, Alaska. Alaska Fish. Res. Bull. 7:11-21.
National Marine Fisheries Service. 2005. Non-fishing impacts to essential fish habitat and recommended conservation measures, Appendix G. In Final environmental impact statement for essential fish habitat identification and conservation in Alaska. National Marine Fisheries Service, 709 W 9th St, Juneau, AK, 94 p. Retrieved 29 February 2008 from http://www.fakr.noaa.gov/habitat/seis/final/Volume_II/Appendix_G.pdf.
North Pacific Fishery Management Council. 2006. Fishery management plan for groundfish of the Gulf of Alaska. North Pacific Fishery Management Council, 605 West 4th Ave., Suite 306, Anchorage AK, 134 p. Retrieved 29 February 2008 from http://www.fakr.noaa.gov/npfmc/.
Orth, R. J., T. J. B. Carruthers, W. C. Dennison, C. M. Duarte, J. W. Fourqurean, K. L. Heck Jr., A. R. Hughes, G. A. Kendrick, W. J. Kenworthy, S. Olyarnik, F. T. Short, M. Waycott, and S. Williams. 2006. A global crisis for seagrass ecosystems. BioScience 56:(12) 987-996.
Phillips, R. C., W. S. Grant, C. P. McRoy. 1983. Reproductive strategies of eelgrass (Zostera marina L.). Aquat. Bot. 16:1-20.
Phillips, R. C. 1984. The ecology of eelgrass meadows in the Pacific Northwest: A community profile. U.S. Department of the Interior, FWS/OBS-84/24. U.S. Fish and Wildlife Service, Portland, OR.
SigmaStat. 1997. SigmaStat statistical software. SPSS Inc., Chicago, IL 60611. Short, F. T., L. J. McKenzie, R. G. Coles, and J. L. Gaeckle. 2004. SeagrassNet manual for
scientific monitoring of seagrass habitat- western Pacific edition. University of New Hampshire, USA; QDPI, Northern Fisheries Centre, Australia. 71 p.

13
Spalding, M., M. Taylor, C. Ravilious, F. Short, and E. Green. 2003. The distribution and status of seagrasses, p. 5-26. In E. P. Green, and F. T. Short (editors), World atlas of seagrasses. UNEP World Conservation Monitoring Center, University of California Press, Berkeley, CA.
Thayer, G. W., and R. C. Phillips. 1977. Importance of eelgrass beds in Puget Sound. Mar. Fish. Rev. 39(11):18-22
Thayer, G. W., H. H. Stuart, W. J. Kenworthy, J. F. Ustach, and A. B. Hall. 1978. Habitat values of salt marshes, mangroves, and seagrasses for aquatic organisms, p. 235-247. In P. E. Greeson, J. R. Clark, and J. E. Clark (editors), Wetland functions and values: The state of our understanding. American Water Resources Association, Minneapolis, MN.
United States Army Corps of Engineers (USCOE). Alaska District. 1984. Juneau, Alaska boat harbor improvements, final detailed project report and environmental impact statement. 85 p. and appendices. Available from U.S. Army Engineer District, Alaska, ATTN: Records Manager, PO Box 6898, Elmendorf AFB, Alaska 99506-0898.
United States Army Corps of Engineers. (USCOE). Alaska District. 1985. Auke Bay breakwater and related marina developments, final environmental impact statement. Vol. 1. Available from U.S. Army Engineer District, Alaska, ATTN: Records Manager, PO Box 6898, Elmendorf AFB, Alaska 99506-0898.
Williams, G. D., L. K. O’Rourke, and W. H. Pearson. 2004. Reconnaissance evaluation of ecological effects to forage fish populations associated with the Juneau access improvements project. Battelle Marine Sciences Laboratory. Draft report prepared for National Marine Fisheries Service. 50 p.
Wing, B. L., M. M. Masuda, and S. G. Taylor. 2006. Time series analyses of physical environmental data records from Auke Bay, Alaska. U.S. Dep. Commer. NOAA Tech. Memo. NMFS-AFSC-166, 75 p.
Wyllie-Echeverria, S., and J. D. Ackerman. 2003. The seagrasses of the Pacific coast of North America, p. 199-206. In E. P. Green, and F. T. Short (editors), World atlas of seagrasses. UNEP World Conservation Monitoring Center, University of California Press, Berkeley, CA.

14
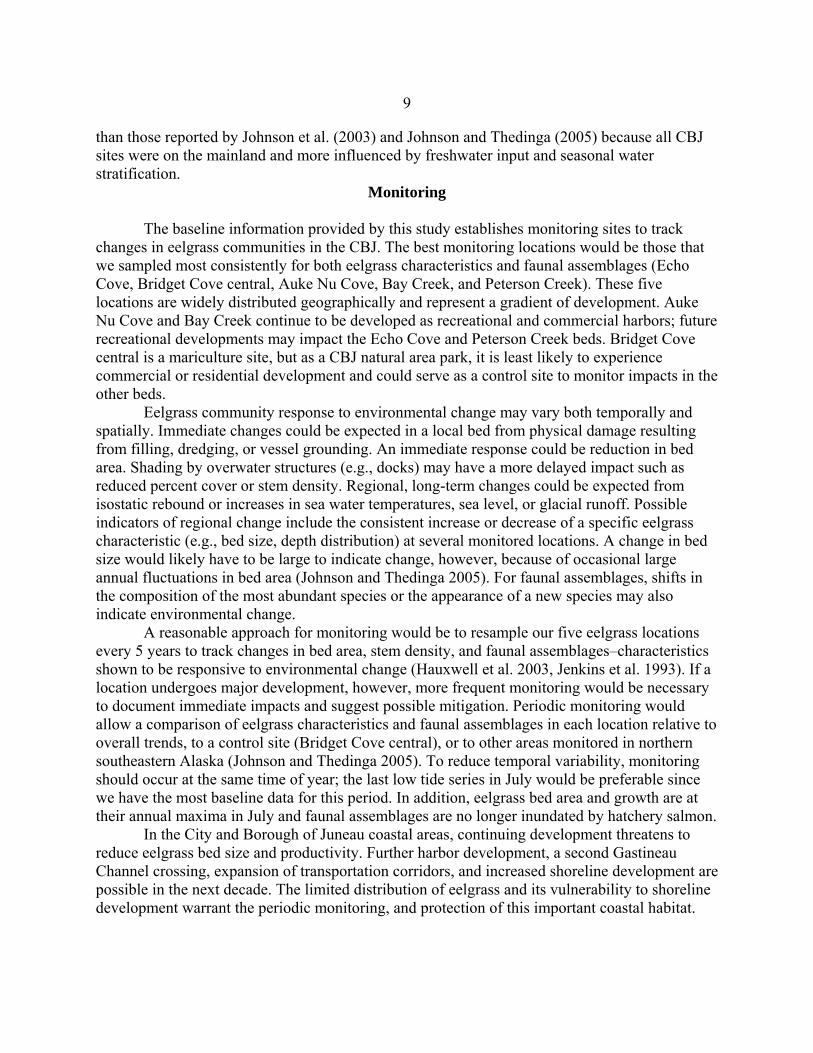
Table 1.-- Locations of transects, thermographs, and seine sites sampled in eelgrass (Zostera marina) beds in the City and Borough of Juneau, Alaska, 2004 to 2007. Eelgrass characteristics (e.g., stem density) were measured along transects, thermographs measured daily water temperature, and a beach seine was used to sample faunal assemblages. Also shown are dates that eelgrass beds were mapped with global positioning system technology. Latitude and longitude are in decimal degrees. Eelgrass locations shown in Figure 1; individual sampling sites in Figures 2-16.
Location Sampling date
sample site Latitude (N) Longitude (W) 2004 2005 2006 2007Echo Cove
mapped 7/1 7/20 8/28 transect 1 58.6686 134.9121 7/1 7/21 8/9 transect 2 58.6605 134.9112 7/20 8/8 thermograph 1 58.6605 134.9106 6/3a 4/12b 5/30b thermograph 2 58.6680 134.9200 6/2a nr nr seine 1 58.6719 134.9148 6/2 7/6 8/9 seine 2 58.6693 134.9127 6/2 7/6 8/9 seine 3 58.6686 134.9121 6/2 7/6 8/9 Camping Cove 58.6476 134.9658
mapped 7/2 Bridget Cove north
mapped 7/5 7/23 transect 3 58.6400 134.9556 8/4 7/23 thermograph 3 58.6405 134.9552 6/1a 4/12b 5/30b thermograph 4 58.6418 134.9575 6/3a 4/12b 5/30b seine 4 58.6400 134.9556 6/3 7/7 8/10 Bridget Cove central
mapped 7/3 7/22 8/29 transect 4 58.6300 134.9480 7/5 7/22 8/10 seine 5 58.6300 134.9480 6/4 7/7 8/10 Bridget Cove south
mapped 7/2 7/23 transect 5 58.6300 134.9449 7/23 8/11 seine 6 58.6300 134.9449 6/4 7/7 8/10

15 Table 1.-- Continued.
Location Sampling date sample site Latitude (N) Longitude (W) 2004 2005 2006 2007
Sunshine Cove 58.6084 134.9326 mapped 9/1
Tee Harbor mapped 6/26
transect 6 58.4309 134.7648 6/26 7/27 seine 7 58.4309 134.7648 7/18 7/27 Auke Village
mapped 8/3 6/8 transect 7 58.3757 134.7256 8/3 6/8 Indian Cove
mapped 7/30 6/6 transect 8 58.3774 134.7009 7/30 6/6 Auke Nu Cove
mapped 8/1 6/22 8/14 transect 9 58.3811 134.6924 8/1 6/22 7/25 thermograph 5 58.3800 134.6911 6/29a 6/27b nr thermograph 6 58.3792 134.6898 6/29a 6/27b nr 4/18 b
seine 8 58.3808 134.6917 6/24 8/24 7/31 seine 9 58.3780 134.6919 8/23 7/31Waydelich Creek
mapped 8/2 transect 10 58.3819 134.6603 8/3 seine 10 58.3819 134.6603 6/23 8/24 Bay Creek
mapped 6/17 6/21 8/13 transect 11 58.3857 134.6490 8/2 7/24 seine 11 58.3853 134.6517 6/27 7/24 8/2 Mendenhall Peninsula 58.3603 134.6462
mapped 3/22Fish Creek 58.3315 134.6080
mapped 7/25 5/3
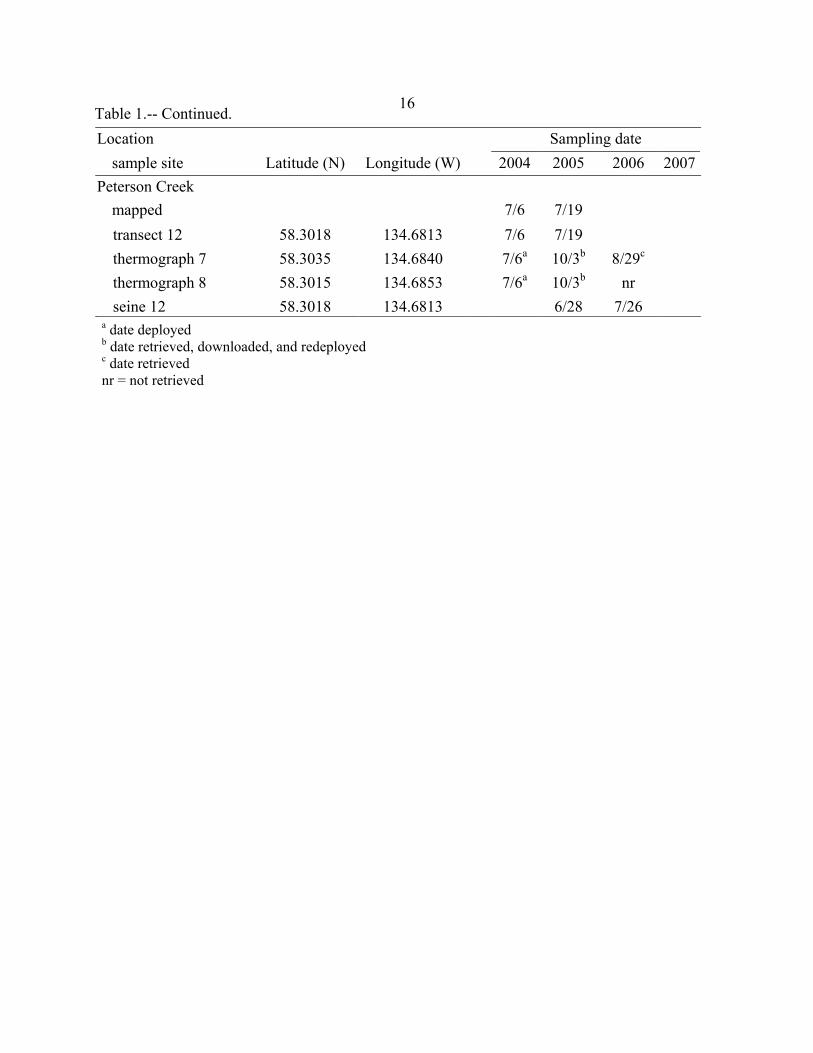
Table 1.-- Continued. 16
Location Sampling date sample site Latitude (N) Longitude (W) 2004 2005 2006 2007
Peterson Creek mapped 7/6 7/19
transect 12 58.3018 134.6813 7/6 7/19 thermograph 7 58.3035 134.6840 7/6a 10/3b 8/29c thermograph 8 58.3015 134.6853 7/6a 10/3b nr seine 12 58.3018 134.6813 6/28 7/26
a date deployed
b date retrieved, downloaded, and redeployed
c date retrieved
nr = not retrieved
Table 2.-- Fish catch by species at 12 seine sites (Figs. 2-16) in eelgrass (Zostera marina) in the City and Borough of Juneau,
Alaska, 2004 to 2007. Mean catch = total catch of each species divided by the total number of beach seine hauls (n = 33). Percent frequency of occurrence (FO) = number of seine hauls in which a species was captured divided by the total number of seine hauls multiplied by 100. Species are listed in decreasing order of abundance based on total catch. Asterisk denotes species included in a Fishery Management Plan. A blank indicates no fish were caught. Scientific names are shown in Table 3.
Eelgrass seine sites Common name 1 2 3 4 5 6 7 8 9 10 11 12
Total catch
Mean catch FO
Chum salmon* 1 177 340 2,270 474 3,120 18 6,400 193.9 33.3Tubesnout 12 8 5 85 468 98 1,283 625 505 1,271 99 4,459 135.1 78.8Crescent gunnel* 469 61 125 512 258 129 96 164 47 57 302 76 2,296 69.6 97.0Threespine stickleback 33 18 24 8 18 4 203 130 183 22 529 65 1,237 37.5 78.8Pacific herring 12 2 2 438 73 1 10 607 1,145 34.7 30.3Walleye pollock* 12 1 4 148 475 14 1 655 19.8 27.3Coho salmon* 75 74 25 105 49 98 4 1 5 436 13.2 54.5Tubenose poacher 8 1 4 109 69 15 37 21 7 8 279 8.5 51.5Pacific staghorn sculpin* 6 2 2 22 22 1 30 53 11 20 37 54 260 7.9 78.8Pacific cod* 104 53 11 1 169 5.1 15.2Pink salmon* 54 23 42 1 120 3.6 15.2Snake prickleback* 7 19 20 10 3 1 5 1 45 3 114 3.5 48.5Frog sculpin* 5 1 3 1 18 2 5 22 8 3 3 7 78 2.4 54.5Dolly Varden 1 4 4 53 1 63 1.9 18.2Starry flounder* 1 1 1 6 2 1 16 1 14 5 6 54 1.6 54.5Rock sole* 2 2 25 13 1 1 7 51 1.5 30.3Silverspotted sculpin* 1 3 2 6 8 22 2 1 1 46 1.4 42.4Juvenile greenling 5 7 2 12 15 1 1 3 46 1.4 24.2
17

Eelgrass seine sites Common name 1 2 3 4 5 6 7 8 9 10 11 12
Total catch
Mean catch FO
Juvenile sculpin 5 1 1 3 2 12 5 10 39 1.2 30.3Bay pipefish 1 7 16 1 1 1 27 0.8 24.2Northern sculpin 2 5 3 4 2 5 1 3 25 0.8 27.3Padded sculpin 7 2 14 23 0.7 9.1Surf smelt* 23 23 0.7 3.0Buffalo sculpin* 9 2 4 15 0.5 12.1Whitespotted greenling 4 6 1 2 13 0.4 21.2Great sculpin* 1 1 2 1 5 10 0.3 15.2Cutthroat trout 1 1 1 1 3 7 0.2 15.2Tidepool sculpin* 4 1 1 1 7 0.2 12.1Pacific sand lance* 3 2 1 6 0.2 9.1Yellowfin sole* 5 1 6 0.2 6.1English sole* 1 2 3 0.1 6.1Arctic shanny* 1 1 2 0.1 6.1Chinook salmon* 2 2 0.1 3.0Pacific sandfish* 2 2 0.1 3.0Pacific spiny lumpsucker 1 1 2 0.1 6.1Steelhead trout 1 1 2 0.1 6.1Juvenile flatfish 1 1 2 0.1 6.1Alaska plaice* 1 1 0.0 3.0Capelin* 1 1 0.0 3.0Crested sculpin* 1 1 0.0 3.0Manacled sculpin* 1 1 0.0 3.0Penpoint gunnel* 1 1 0.0 3.0
18Table 2. -- Continued.

19
Eelgrass seine sites Common name 1 2 3 4 5 6 7 8 9 10 11 12
Total catch
Mean catch FO
Red Irish lord* 1 1 0.0 3.0Sockeye salmon* 1 1 0.0 3.0Juvenile cod 1 1 0.0 3.0Juvenile gunnel* 1 1 0.0 3.0Juvenile snailfish 1 1 0.0 3.0
Total catch 663 434 596 3,439 2,495 3,584 1,752 1,072 800 2,097 982 220 18,134Number of hauls 3 3 3 3 3 3 2 3 2 2 3 3 33Species richness 18 18 22 20 31 23 13 18 19 18 10 7 42
550733271,049400357 8761,1958321,146199145221 Mean catch per haul
Table 2. -- Continued.
20
Table 3.-- Length (fork length or total length) of fish species captured with a beach seine at 12 eelgrass (Zostera marina) sites (see Table 1 and Figure 1) in the City and Borough of Juneau, Alaska, 2004 to 2007. Species are listed in decreasing order of abundance based on total catch.
Length (mm)
Common name Scientific name n Avg. SE
Oncorhynchus keta Chum salmon 255 68.2 7.7
Aulorhynchus flavidus Tubesnout 387 66.0 33.4
Pholis laeta Crescent gunnel 130 120.5 61.8
Gasterosteus aculeatus Threespine stickleback 473 29.1 14.1
Clupea pallasii Pacific herring 147 34.7 3.3
Theragra chalcogramma Walleye pollock 97 63.9 11.8
Oncorhynchus kisutch Coho salmon 183 85.9 21.0
Pallasina barbata Tubenose poacher 129 65.7 20.2
Leptocottus armatus Pacific staghorn sculpin 199 166.9 63.7
Gadus macrocephalus Pacific cod 92 89.1 11.6
Oncorhynchus gorbuscha Pink salmon 48 60.4 6.7
Lumpenus sagitta Snake prickleback 72 138.4 81.7
Myoxocephalus stelleri Frog sculpin 72 122.7 79.0
Salvelinus malma Dolly Varden 10 159.7 23.8
Platichthys stellatus Starry flounder 54 219.3 130.0 Lepidopsetta spp. Rock sole 26 80.3 26.5
Blepsias cirrhosus Silverspotted sculpin 21 65.9 10.3 Juvenile greenling Hexagrammidae 10 69.8 11.2
Cottidae Juvenile sculpin 26 34.2 12.1
Syngnathus leptorhynchus Bay pipefish 26 178.4 25.9
Icelinus borealis Northern sculpin 12 92.5 22.5
Artedius fenestralis Padded sculpin 23 81.2 24.4
Hypomesus pretiosus Surf smelt 23 116.7 10.4
Enophrys bison Buffalo sculpin 13 73.5 55.2
Hexagrammos stelleri Whitespotted greenling 12 195.6 66.7
Myoxocephalus polyacanthocephalus Great sculpin 1 172.0
Oncorhynchus clarkii Cutthroat trout 4 189.0 46.7
Oligocottus maculosus Tidepool sculpin 7 62.1 8.1
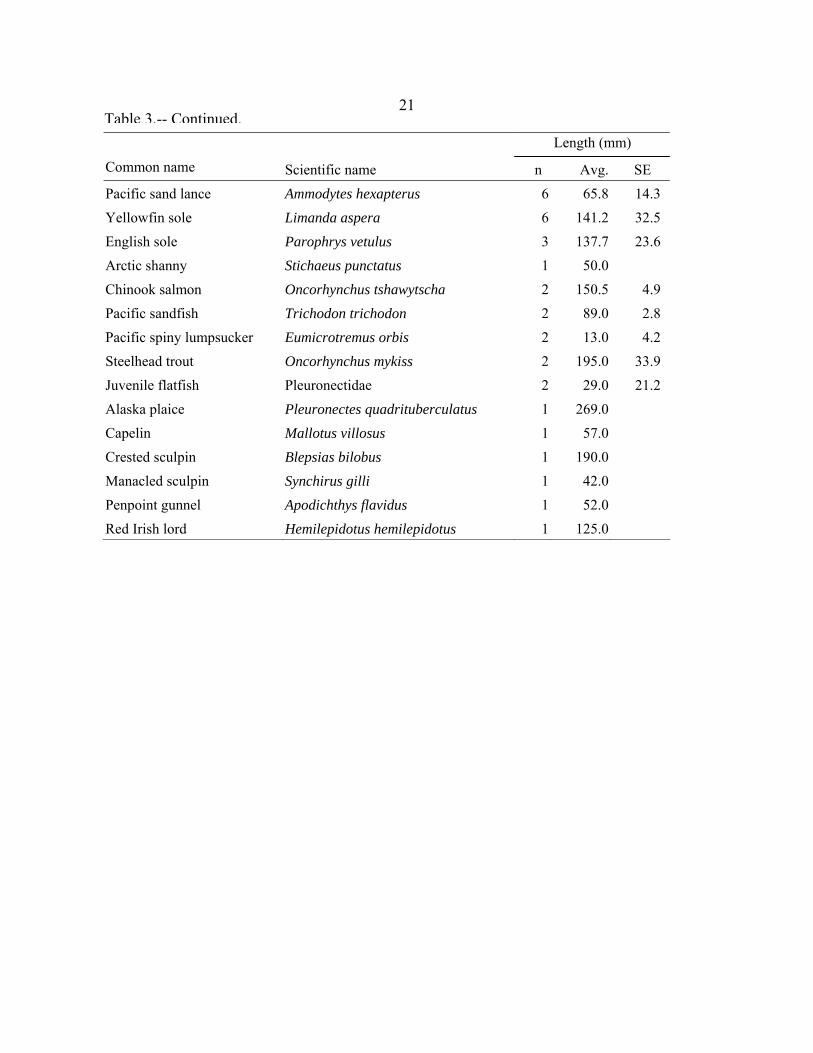
21 Table 3.-- Continued.
Length (mm)
Common name Scientific name n Avg. SE
Ammodytes hexapterus Pacific sand lance 65.8 14.3 6
Limanda aspera Yellowfin sole 141.2 32.5 6
Parophrys vetulus English sole 137.7 23.6 3Arctic shanny 50.0 Stichaeus punctatus 1
Oncorhynchus tshawytscha Chinook salmon 150.5 4.9 2
Trichodon trichodon Pacific sandfish 89.0 2.8 2
Eumicrotremus orbis Pacific spiny lumpsucker 13.0 4.2 2
Oncorhynchus mykiss Steelhead trout 195.0 33.9 2Pleuronectidae Juvenile flatfish 29.0 21.2 2
Pleuronectes quadrituberculatus Alaska plaice 269.0 1
Mallotus villosus Capelin 57.0 1
Blepsias bilobus Crested sculpin 190.0 1
Synchirus gilli Manacled sculpin 42.0 1
Apodichthys flavidus Penpoint gunnel 52.0 1
Hemilepidotus hemilepidotus Red Irish lord 125.0 1

22
Table 4.-- Invertebrates observed or captured at 11 eelgrass (Zostera marina) locations (see Table 1) in the City and Borough of Juneau, Alaska, 2004 to 2007. Observations were recorded along eelgrass transects and from beach seine hauls. Epiphytic animals were identified from subquadrat eelgrass clippings collected for above-ground biomass determination.
Common name Scientific name Variegated chink snail Lacuna variegata Pacific blue mussel Mytilus trossulus Acorn barnacle Balanus glandula Northern rock barnacle Semibalanus balanoides Amphipods Gammarus spp. Bryozoans Membraniporeae Limpets Lottidae Rockweed isopod Idotea wosnesenskii Polychaete Eteone spp. Pile worm Nereis vexillosa False white sea cucumber Eupentacta pseudoquinquesemita Mottled sea star Evasterias troschelii Spot shrimp Pandalus platyceras D ock shrimp
Pandalus danae
Opossum mysid Neomysis mercedes Alaskan crangon Crangon alaskensis Long-clawed crangon Crangon franciscorum angustimana H ermit crab
Pagurus spp.
Dungeness crab Cancer magister Tuskworm Pectinaria granulata Featherduster worm Schizobranchia insignis Burrowing green anemone Anthopleura artemisia Six-arm seastar Leptasterias epichlora Littleneck clam Protothaca staminea Heart cockle Clinocardium nuttalii Jellyfish Hydrozoa Green sea urchin Strongylocentrotus droebachiensis Broken back shrimp Hippolytidae
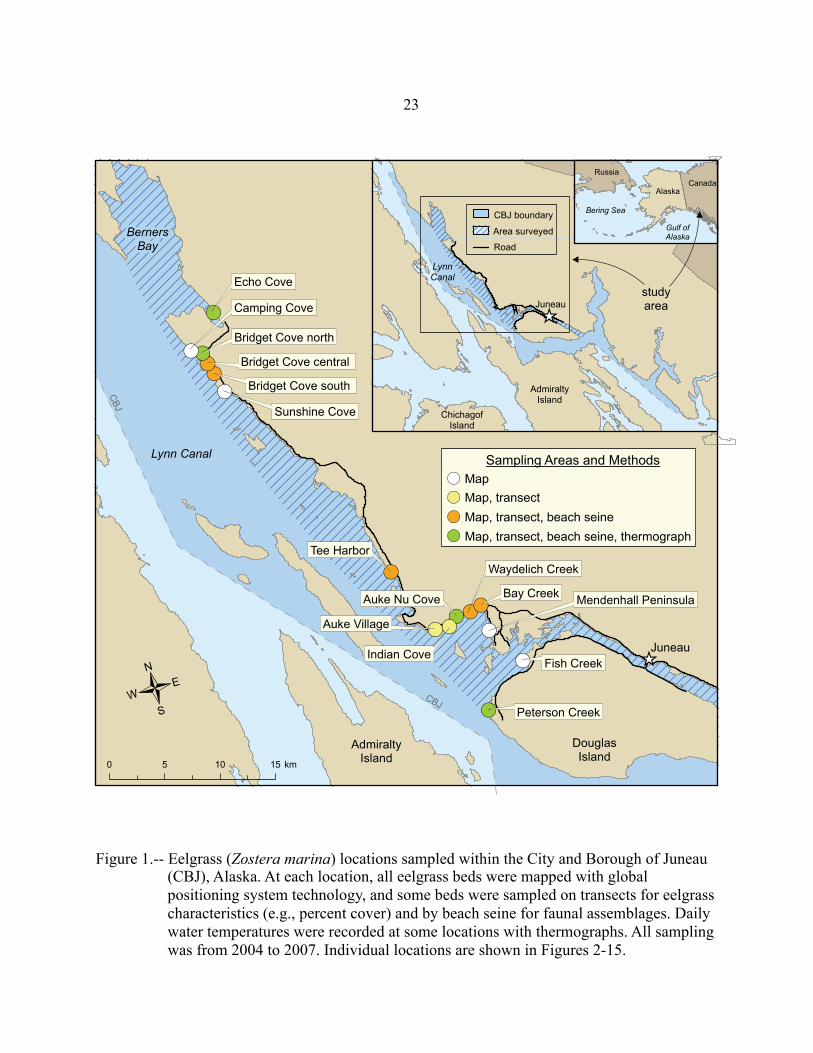
Figure 1.-- Eelgrass (Zostera marina) locations sampled within the City and Borough of Juneau (CBJ), Alaska. At each location, all eelgrass beds were mapped with global positioning system technology, and some beds were sampled on transects for eelgrass characteristics (e.g., percent cover) and by beach seine for faunal assemblages. Daily water temperatures were recorded at some locations with thermographs. All sampling was from 2004 to 2007. Individual locations are shown in Figures 2-15.
23
!(
!(!(!(
!(
!(!(!(
!(
!(
!(
!(!(
!(
!(
Lynn Canal
BernersBay
[_Juneau
DouglasIsland
AdmiraltyIsland
CBJCBJ/
0 5 10 15 km
[_Juneau
AdmiraltyIsland
ChichagofIsland
LynnCanal
studyarea
CBJ boundary
Area surveyed
Road
AlaskaCanada
Russia
Bering Sea
Gulf ofAlaska
Echo Cove
Bridget Cove north
Bridget Cove central
Bridget Cove south
Sunshine Cove
Tee Harbor
Auke Village
Auke Nu Cove
Waydelich Creek
Bay Creek Mendenhall Peninsula
Fish Creek
Peterson Creek
Indian Cove
Camping Cove
Sampling Areas and MethodsMapMap, transectMap, transect, beach seineMap, transect, beach seine, thermograph
!(
!(
!(
!(
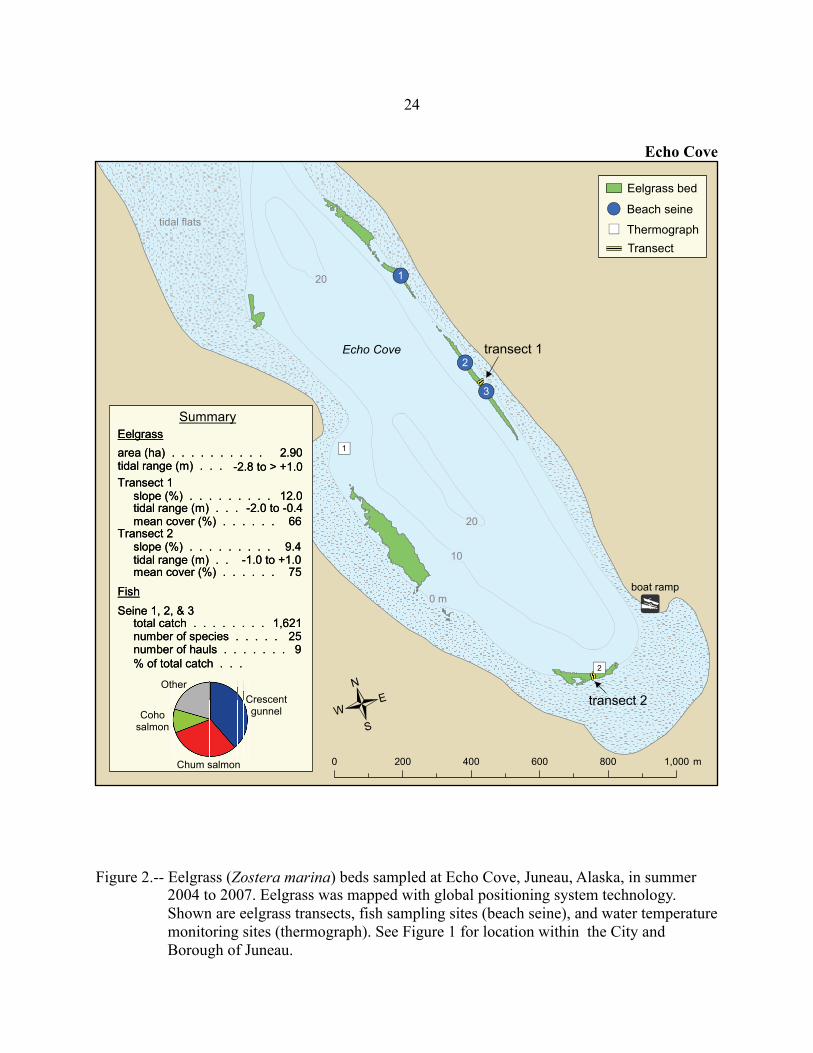
Figure 2.-- Eelgrass (Zostera marina) beds sampled at Echo Cove, Juneau, Alaska, in summer 2004 to 2007. Eelgrass was mapped with global positioning system technology. Shown are eelgrass transects, fish sampling sites (beach seine), and water temperature monitoring sites (thermograph). See Figure 1 for location within the City and Borough of Juneau.
24
Echo Cove
")
")
!(
!(
!(
Echo Cove transect 1
transect 2
tidal flats
20
10
0 m
20
2
1
1
2
3
0 200 400 600 800 1,000 m
/
!yboat ramp
Transect
Beach seine!(Thermograph")
Eelgrass bed
Summary
Other
Cohosalmon
Chum salmon
Crescentgunnel
2.90tidal range (m) . . .
slope (%) . . . . . . . . . 12.0tidal range (m) . . . -2.0 to -0.4mean cover (%) . . . . . . 66
Transect 2slope (%) . . . . . . . . . 9.4tidal range (m) . . -1.0 to +1.0mean cover (%) . . . . . . 75
Seine 1, 2, & 3total catch . . . . . . . . 1,621number of species . . . . . 25number of hauls . . . . . . . 9
area (ha) . . . . . . . . . .
Transect 1
Eelgrass
Fish
% of total catch . . .
-2.8 to > +1.02.90
tidal range (m) . . .
slope (%) . . . . . . . . . 12.0tidal range (m) . . . -2.0 to -0.4mean cover (%) . . . . . . 66
Transect 2slope (%) . . . . . . . . . 9.4tidal range (m) . . -1.0 to +1.0mean cover (%) . . . . . . 75
Seine 1, 2, & 3total catch . . . . . . . . 1,621number of species . . . . . 25number of hauls . . . . . . . 9
area (ha) . . . . . . . . . .
Transect 1
Eelgrass
Fish
% of total catch . . .
-2.8 to > +1.0
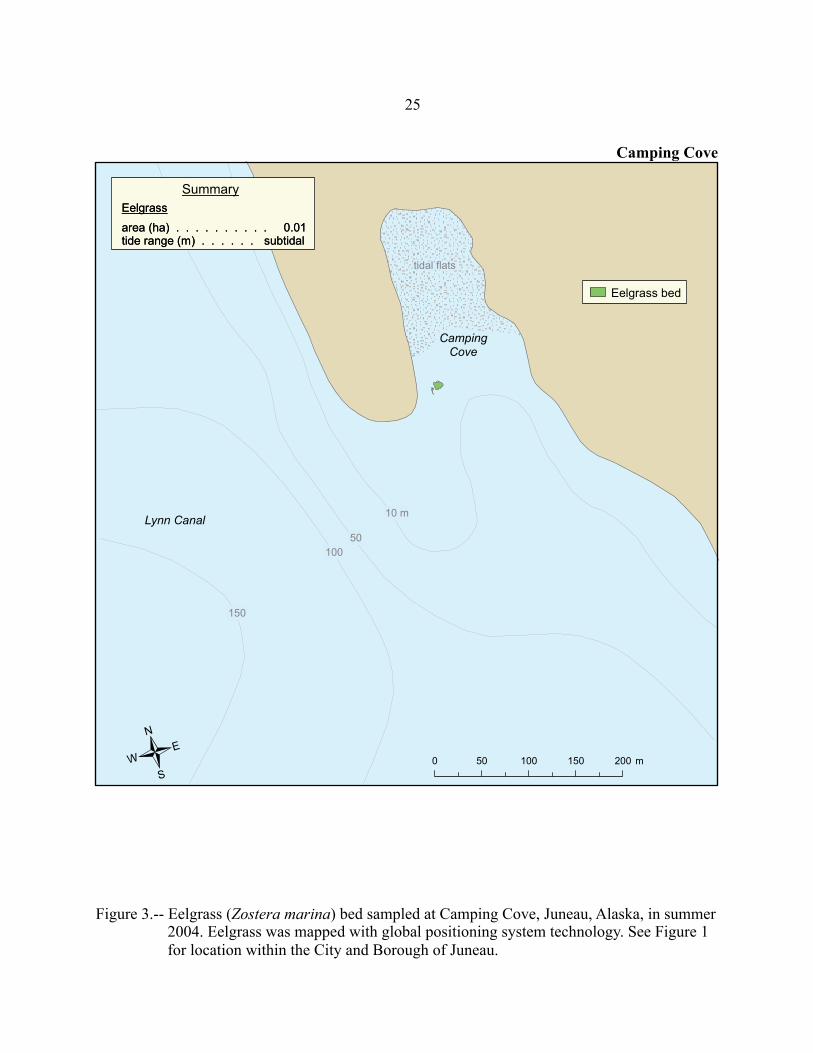
Figure 3.-- Eelgrass (Zostera marina) bed sampled at Camping Cove, Juneau, Alaska, in summer 2004. Eelgrass was mapped with global positioning system technology. See Figure 1 for location within the City and Borough of Juneau.
25
Camping Cove
Lynn Canal
CampingCove
tidal flats
10050
10 m
150
0 50 100 150 200 m/
Eelgrass bed
Summary
area (ha) . . . . . . . . . . 0.01tide range (m) . . . . . . subtidal
Eelgrass
area (ha) . . . . . . . . . . 0.01tide range (m) . . . . . . subtidal
Eelgrass
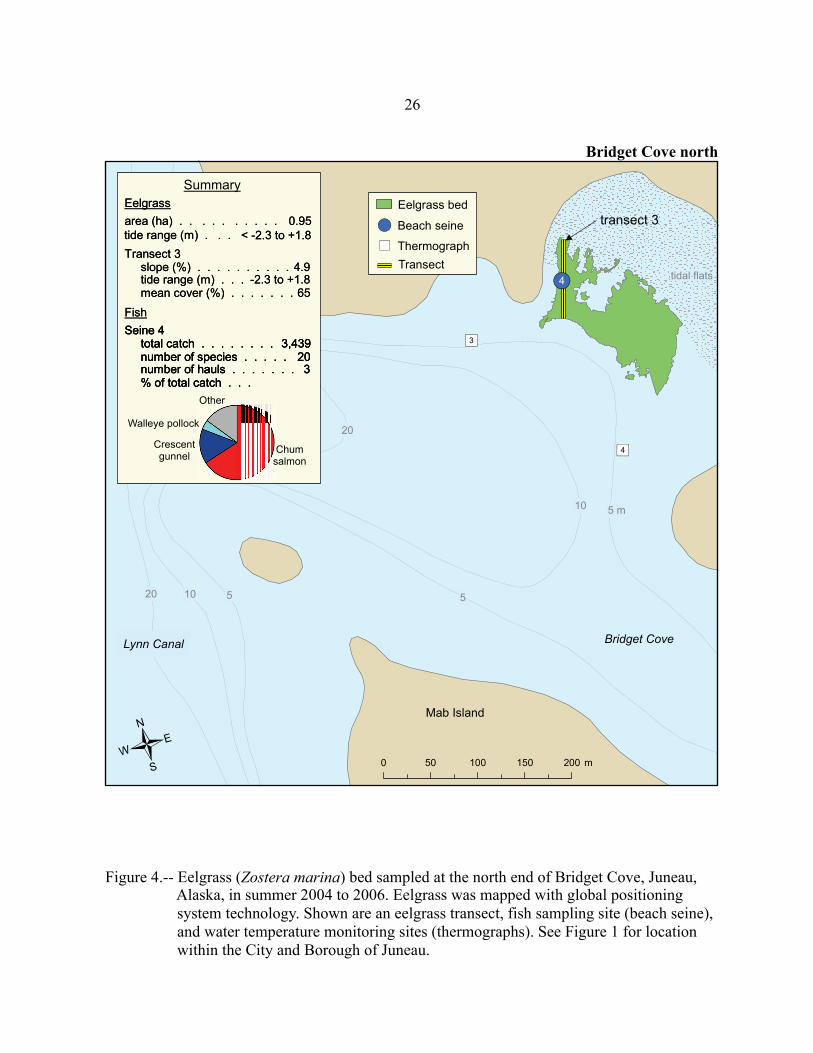
Figure 4.-- Eelgrass (Zostera marina) bed sampled at the north end of Bridget Cove, Juneau, Alaska, in summer 2004 to 2006. Eelgrass was mapped with global positioning system technology. Shown are an eelgrass transect, fish sampling site (beach seine), and water temperature monitoring sites (thermographs). See Figure 1 for location within the City and Borough of Juneau.
26
Bridget Cove north
")
")
!(
transect 3
Bridget Cove
Mab Island
Lynn Canal
10
5
20
5 m
20
tidal flats
10 5
4
3
4
0 50 100 150 200 m/
Transect
Beach seine!(Thermograph")
Eelgrass bedSummary
area (ha) . . . . . . . . . . 0.95
Transect 3slope (%) . . . . . . . . . . 4.9tide range (m) . . . -2.3 to +1.8mean cover (%) . . . . . . . 65
Seine 4total catch . . . . . . . . 3,439number of species . . . . . 20number of hauls . . . . . . . 3% of total catch . . .
Eelgrass
Fish
tide range (m) . . . < -2.3 to +1.8area (ha) . . . . . . . . . . 0.95
Transect 3slope (%) . . . . . . . . . . 4.9tide range (m) . . . -2.3 to +1.8mean cover (%) . . . . . . . 65
Seine 4total catch . . . . . . . . 3,439number of species . . . . . 20number of hauls . . . . . . . 3% of total catch . . .
Seine 4total catch . . . . . . . . 3,439number of species . . . . . 20number of hauls . . . . . . . 3% of total catch . . .
Eelgrass
Fish
tide range (m) . . . < -2.3 to +1.8
Other
Walleye pollock
Chumsalmon
Crescentgunnel

Figure 5.-- Eelgrass (Zostera marina) beds sampled at the central area of Bridget Cove, Juneau, Alaska, in summer 2004 to 2007. Eelgrass was mapped with global positioning system technology. Shown are an eelgrass transect, fish sampling site (beach seine), and private clam farm. See Figure 1 for location within the City and Borough of Juneau.
27
Bridget Cove central
!(
transect 4
Bridget Cove
tidal flats
Mab Island
5
20
10
5
0 0 m
5
0 50 100 150 200 m
/
TransectBeach seine!(
Clam farm
Eelgrass bed
Summary
Tubesnout
Walleye pollock
Chumsalmon
Other
area (ha) . . . . . . . . . . 0.90
Transect 4slope (%) . . . . . . . . . 5.9tidal range (m) . . -1.2 to +1.5mean cover (%) . . . . . . 45
Seine 5total catch . . . . . . . . 2,495number of species . . . . . 34number of hauls . . . . . . . 3
Eelgrass
Fish
% of total catch . . .
tidal range (m) . . < -2.0 to > +1.5area (ha) . . . . . . . . . . 0.90
Transect 4slope (%) . . . . . . . . . 5.9tidal range (m) . . -1.2 to +1.5mean cover (%) . . . . . . 45
Seine 5total catch . . . . . . . . 2,495number of species . . . . . 34number of hauls . . . . . . . 3
Eelgrass
Fish
% of total catch . . .
tidal range (m) . . < -2.0 to > +1.5

Figure 6.-- Eelgrass (Zostera marina) beds sampled at the south end of Bridget Cove, Juneau, Alaska, in summer 2004 to 2006. Eelgrass was mapped with global positioning system technology. Shown are an eelgrass transect and fish sampling site (beach seine). See Figure 1 for location within the City and Borough of Juneau.
28
Bridget Cove south
!(
transect 5
10 5
20
tidal flats
0 m
6
0 50 100 150 200 m
/Bridget Cove
Bridget Creek
TransectBeach seine!(
Eelgrass bed
Summary
area (ha) . . . . . . . . . . . 5.8tide range (m) . . subtidal to +2.0
Transect 5slope (%) . . . . . . . . . 2.8tide range (m) . . -1.0 to +0.3mean cover (%) . . . . . . 33
Seine 6total catch . . . . . . . . 3,584number of species . . . . . 25number of hauls . . . . . . . 3
Eelgrass
Fish
% of total catch . . .
Chumsalmon
Crescent gunnel
OtherCoho salmon

Figure 7.-- Eelgrass (Zostera marina) bed sampled at Sunshine Cove, Juneau, Alaska, in summer 2004. Eelgrass was mapped with global positioning system technology. See Figure 1 for location within the City and Borough of Juneau.
29
Sunshine Cove
Sunshine Cove
Lynn Canal
10
5
10
20
5 m
50
tidal flats
0 50 100 150 200 m/
Eelgrass bed
Summary
area (ha) . . . . . . . . . . 0.17tide range (m) . . . subtidal to -0.5
Eelgrassarea (ha) . . . . . . . . . . 0.17tide range (m) . . . subtidal to -0.5
Eelgrass

Figure 8.-- Eelgrass (Zostera marina) bed sampled at Tee Harbor, Juneau, Alaska, in summer 2005 and 2006. Eelgrass was mapped with global positioning system technology. Shown are an eelgrass transect and fish sampling site (beach seine). See Figure 1 for location within the City and Borough of Juneau.
30
Tee Harbor
!(
transect 6
Favorite Channel
Tee Harbor
dock
tidal flats
5 m20
7050
205
7
/ 0 50 100 150 200 m
TransectBeach seine!(
Creek
Eelgrass bed
Summary
area (ha) . . . . . . . . . . 1.25
Transect 6slope (%) . . . . . . . . . 2.5tide range (m) . . -1.2 to +1.4mean cover (%) . . . . . . 58
Seine 7total catch . . . . . . . . 1,752number of species . . . . . 12number of hauls . . . . . . . 2
Eelgrass
Fish
% of total catch . . .
tide range (m) . . < -1.2 to > +1.4area (ha) . . . . . . . . . . 1.25
Transect 6slope (%) . . . . . . . . . 2.5tide range (m) . . -1.2 to +1.4mean cover (%) . . . . . . 58
Seine 7total catch . . . . . . . . 1,752number of species . . . . . 12number of hauls . . . . . . . 2
Eelgrass
Fish
% of total catch . . .
tide range (m) . . < -1.2 to > +1.4
Crescent gunnelOther
Tubesnout
Threespinestickleback

Figure 9.-- Eelgrass (Zostera marina) beds sampled at Auke Village, Juneau, Alaska, in summer 2004 and 2005. Eelgrass was mapped with global positioning system technology. Shown is an eelgrass transect. See Figure 1 for location within the City and Borough of Juneau.
31
Auke Village
transect 7
PointLouisa
tidal flats
10
5
40
30
20
0 m
0 50 100 150 200 m/
Transect
Eelgrass bedarea (ha) . . . . . . . . . . 0.33
Transect 7slope (%) . . . . . . . . . 4.4tide range (m) . . -1.1 to +0.5mean cover (%) . . . . . . 13
Eelgrass
tide range (m) . . . -2.5 to > +0.5area (ha) . . . . . . . . . . 0.33
Transect 7slope (%) . . . . . . . . . 4.4tide range (m) . . -1.1 to +0.5mean cover (%) . . . . . . 13
Eelgrass
tide range (m) . . . -2.5 to > +0.5
Summary
area (ha) . . . . . . . . . . 0.33
Transect 7slope (%) . . . . . . . . . 4.4tide range (m) . . -1.1 to +0.5mean cover (%) . . . . . . 13
Eelgrass
tide range (m) . . . -2.5 to > +0.5area (ha) . . . . . . . . . . 0.33
Transect 7slope (%) . . . . . . . . . 4.4tide range (m) . . -1.1 to +0.5mean cover (%) . . . . . . 13
Eelgrass
tide range (m) . . . -2.5 to > +0.5

Figure 10.-- Eelgrass (Zostera marina) bed sampled at Indian Cove, Juneau, Alaska, in summer 2004 and 2005. Eelgrass was mapped with global positioning system technology. Shown is an eelgrass transect. See Figure 1 for location within the City and Borough of Juneau.
32
Indian Cove
Indian Cove
transect 8
dock
tidal flats
5
10
3020
10
5
0 m
0 50 100 150 200 m/
Transect
Eelgrass bed
Summary
area (ha) . . . . . . . . . . 0.92
Transect 8slope (%) . . . . . . . . . 3.9tide range (m) . . -1.0 to +1.5mean cover (%) . . . . . . 44
Eelgrass
tide range (m) . . < -1.0 to > +1.5area (ha) . . . . . . . . . . 0.92
Transect 8slope (%) . . . . . . . . . 3.9tide range (m) . . -1.0 to +1.5mean cover (%) . . . . . . 44
Eelgrass
tide range (m) . . < -1.0 to > +1.5

Figure 11.-- Eelgrass (Zostera marina) beds sampled at Auke Nu Cove, Juneau, Alaska, in summer 2004 to 2007. Eelgrass was mapped with global positioning system technology. Shown are an eelgrass transect, fish sampling sites (beach seine), and water temperature monitoring sites (thermographs). See Figure 1 for location within the City and Borough of Juneau.
33
")
")
!(
!(
Auke Nu Cove
tidal flats 0 m
10
5
6
5
9
8
Auke Nu Cove
0 50 100 150 200 m/
transect 9
Seafoodprocessor
Alaska stateferry terminal
CreekTransect
Beach seine!(
Thermograph")
Eelgrass bed
Summary
area (ha) . . . . . . . . . . . 1.87
Transect 9slope (%) . . . . . . . . . 1.9tidal range (m) . . -1.4 to +1.0mean cover (%) . . . . . . 63
Seine 8 & 9total catch . . . . . . . . 1,872number of species . . . . . 23number of hauls . . . . . . . 6
Eelgrass
Fish
% of total catch . . .
tidal range (m) . . < -2.4 to > +2.0area (ha) . . . . . . . . . . . 1.87
Transect 9slope (%) . . . . . . . . . 1.9tidal range (m) . . -1.4 to +1.0mean cover (%) . . . . . . 63
Seine 8 & 9total catch . . . . . . . . 1,872number of species . . . . . 23number of hauls . . . . . . . 6
Eelgrass
Fish
% of total catch . . .
tidal range (m) . . < -2.4 to > +2.0
Tubesnout
Other
Threespine stickleback
Crescentgunnel
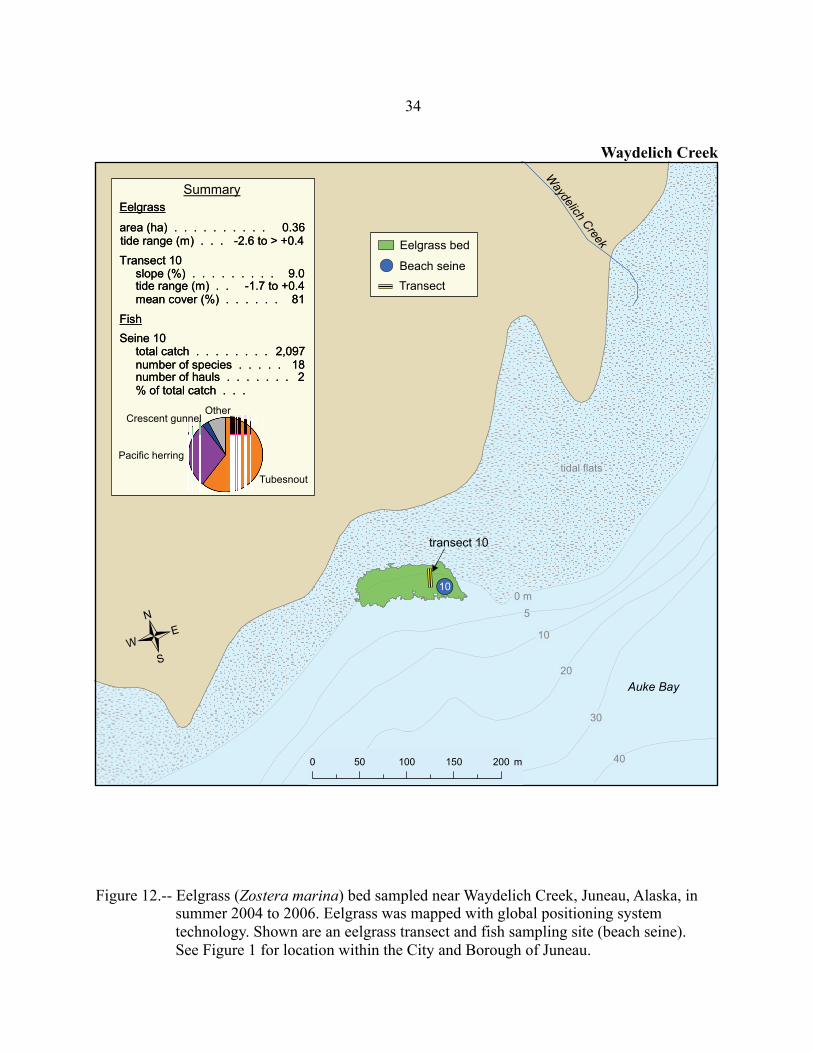
Figure 12.-- Eelgrass (Zostera marina) bed sampled near Waydelich Creek, Juneau, Alaska, in summer 2004 to 2006. Eelgrass was mapped with global positioning system technology. Shown are an eelgrass transect and fish sampling site (beach seine). See Figure 1 for location within the City and Borough of Juneau.
34
Waydelich Creek
!(
Auke Bay
transect 10
Waydelich Creek
tidal flats
0 m
20
5
30
40
10
10
0 50 100 150 200 m
/
TransectBeach seine!(
Eelgrass bed
Summary
area (ha) . . . . . . . . . . 0.36
Transect 10slope (%) . . . . . . . . . 9.0tide range (m) . . -1.7 to +0.4mean cover (%) . . . . . . 81
Seine 10total catch . . . . . . . . 2,097number of species . . . . . 18number of hauls . . . . . . . 2
Eelgrass
Fish
% of total catch . . .
tide range (m) . . . -2.6 to > +0.4area (ha) . . . . . . . . . . 0.36
Transect 10slope (%) . . . . . . . . . 9.0tide range (m) . . -1.7 to +0.4mean cover (%) . . . . . . 81
Seine 10total catch . . . . . . . . 2,097number of species . . . . . 18number of hauls . . . . . . . 2
Eelgrass
Fish
% of total catch . . .
tide range (m) . . . -2.6 to > +0.4
Crescent gunnelOther
Tubesnout
Pacific herring

Figure 13.-- Eelgrass (Zostera marina) beds sampled near Bay Creek, Juneau, Alaska, in summer 2004 to 2007. Eelgrass was mapped with global positioning system technology. Shown are an eelgrass transect, fish sampling site (beach seine), and private and public docks. See Figure 1 for location within the City and Borough of Juneau.
35
Bay Creek
!(
transect 11
Bay Creek
0 m
510
20
30
11
0 50 100 150 200 m
/Auke Bay
!y
boatramp
Beach seine!(
DockTransect
Eelgrass bed
Summary
Other
Threespinestickleback
Crescentgunnel
Tubesnout
area (ha) . . . . . . . . . . 0.97
Transect 11slope (%) . . . . . . . . . 3.4tidal range (m) . . -1.7 to +1.9mean cover (%) . . . . . . 63
Seine 11total catch . . . . . . . . . 982number of species . . . . . 10number of hauls . . . . . . . 3
Eelgrass
Fish
% of total catch . . .
tidal range (m) . . < -1.7 to > +1.9area (ha) . . . . . . . . . . 0.97
Transect 11slope (%) . . . . . . . . . 3.4tidal range (m) . . -1.7 to +1.9mean cover (%) . . . . . . 63
Seine 11total catch . . . . . . . . . 982number of species . . . . . 10number of hauls . . . . . . . 3
Eelgrass
Fish
% of total catch . . .
tidal range (m) . . < -1.7 to > +1.9
tidal flats
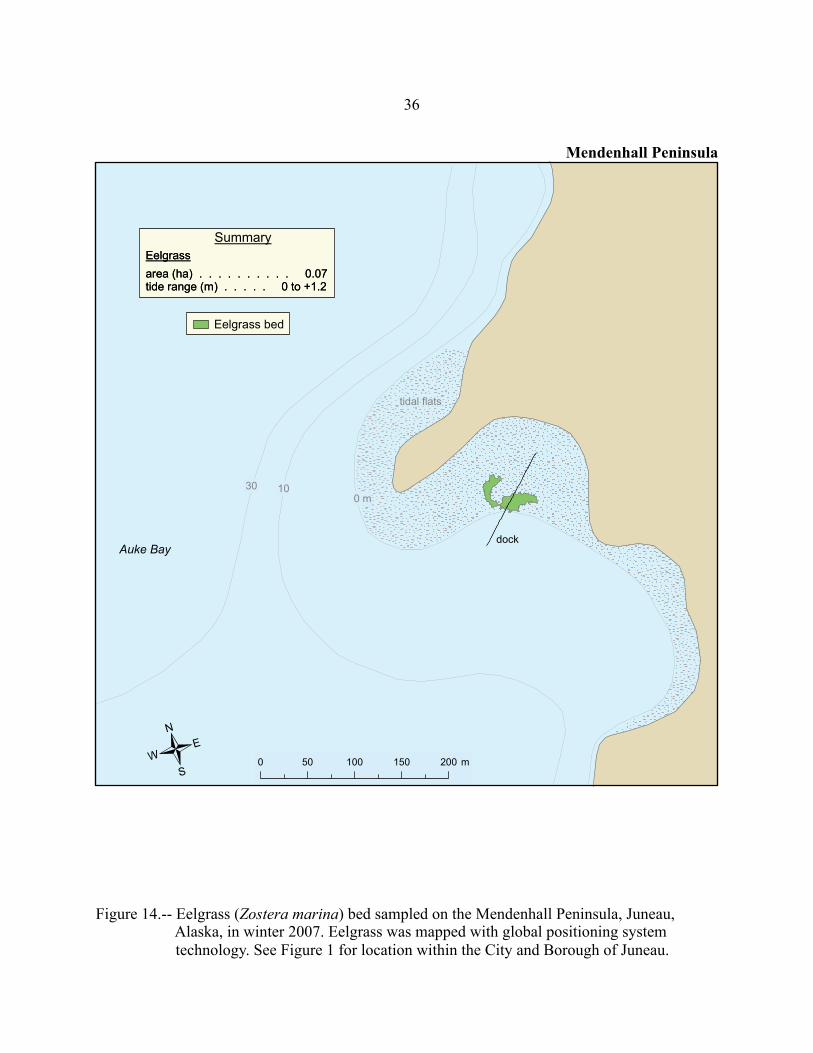
Figure 14.-- Eelgrass (Zostera marina) bed sampled on the Mendenhall Peninsula, Juneau, Alaska, in winter 2007. Eelgrass was mapped with global positioning system technology. See Figure 1 for location within the City and Borough of Juneau.
36
Mendenhall Peninsula
tidal flats
0 m1030
dock
0 50 100 150 200 m/
Auke Bay
Eelgrass bed
Summary
area (ha) . . . . . . . . . . 0.07tide range (m) . . . . . 0 to +1.2
Eelgrassarea (ha) . . . . . . . . . . 0.07tide range (m) . . . . . 0 to +1.2
Eelgrass

Figure 15.-- Eelgrass (Zostera marina) beds sampled near Fish Creek, Juneau, Alaska, in summer 2005 and spring 2007. Eelgrass was mapped with global positioning system technology. Small eelgrass patches (≤ 0.002 ha) were mapped, but are not visible at a 1:7,000 scale. These patches, however, are included in area calculations. See Figure 1 for location within the City and Borough of Juneau.
37
Fish Creek
Fish Creek
tidal flats
40
1020
30
0 m
DouglasIsland
EntrancePoint
Gastineau Channel
FritzCove 0 100 200 300 400 500 m
/
Eelgrass bed
Summary
area (ha) . . . . . . . . . . . 1.18tide range (m) . . . .
Eelgrass
-0.2 to +2.0 area (ha) . . . . . . . . . . . 1.18tide range (m) . . . .
Eelgrass
-0.2 to +2.0

Figure 16.-- Eelgrass (Zostera marina) beds sampled near Peterson Creek, Juneau, Alaska, in summer 2004 to 2007. Eelgrass was mapped with global positioning system technology. Shown are an eelgrass transect, fish sampling site (beach seine), and water temperature monitoring sites (thermographs). See Figure 1 for location within the City and Borough of Juneau.
38
/
Peterson Creek
")
")
!(
ShamanIsland
DouglasIsland
transect 12
Peterson Creek
tidal flats
0 m
10
5
510
8
7
12
0 50 100 150 200 m
Transect
Beach seine!(
Thermograph")
Eelgrass bed
Summary
Crescentgunnel
Other
Threespine stickleback
Pacificstaghornsculpin
area (ha) . . . . . . . . . . 2.80
Transect 12slope (%) . . . . . . . . . 1.0tidal range (m) . . -0.5 to +1.3mean cover (%) . . . . . . 34
Seine 12total catch . . . . . . . . . 220number of species . . . . . . 7number of hauls . . . . . . . 3
Fish
Eelgrass
% of total catch . . .
tidal range (m) . . -0.5 to > +1.3area (ha) . . . . . . . . . . 2.80
Transect 12slope (%) . . . . . . . . . 1.0tidal range (m) . . -0.5 to +1.3mean cover (%) . . . . . . 34
Seine 12total catch . . . . . . . . . 220number of species . . . . . . 7number of hauls . . . . . . . 3
Fish
Eelgrass
% of total catch . . .
tidal range (m) . . -0.5 to > +1.3

39
100
0
20
40
60
80
100
%Cover
(16) (36)
(41)
(39)
(22)
0
200
400
600
800
mm
Canopy height(16)
(41)
(36) (36)
(21)
0
200
400
600
800
no./m
2
Stem density
(16)
(41)(36)
(22)
EchoCovea
Bridget Covecentral
Auke NuCove
Bay Creek Peterson Creek
0
20
40
60
80
Dry
wt.
g/m
2
Biomass
(14) (35)
(33)(34)
(17)
(36)
100
0
20
40
60
80
100
%Cover
(16) (36)
(41)
(39)
(22)
0
200
400
600
800
mm
Canopy height(16)
(41)
(36) (36)
(21)
0
200
400
600
800
no./m
2
Stem density
(16)
(41)(36)
(22)
EchoCovea
Bridget Covecentral
Auke NuCove
Bay Creek Peterson Creek
0
20
40
60
80
Dry
wt.
g/m
2
Biomass
(14) (35)
(33)(34)
(17)
(36)
Figure 17.-- Eelgrass (Zostera marina) characteristics at five locations sampled in the City and
Borough of Juneau, Alaska. Data are means (+ SE) from three summers (2004 to 2006) and three tidal blocks (-1.0 m to -0.5 m, -0.5 m +0.0 m, and 0.0 m to 0.5 m) relative to mean lower low water. Stem density and biomass were above-ground measurements. Sample size in parentheses. (a = transect 1)
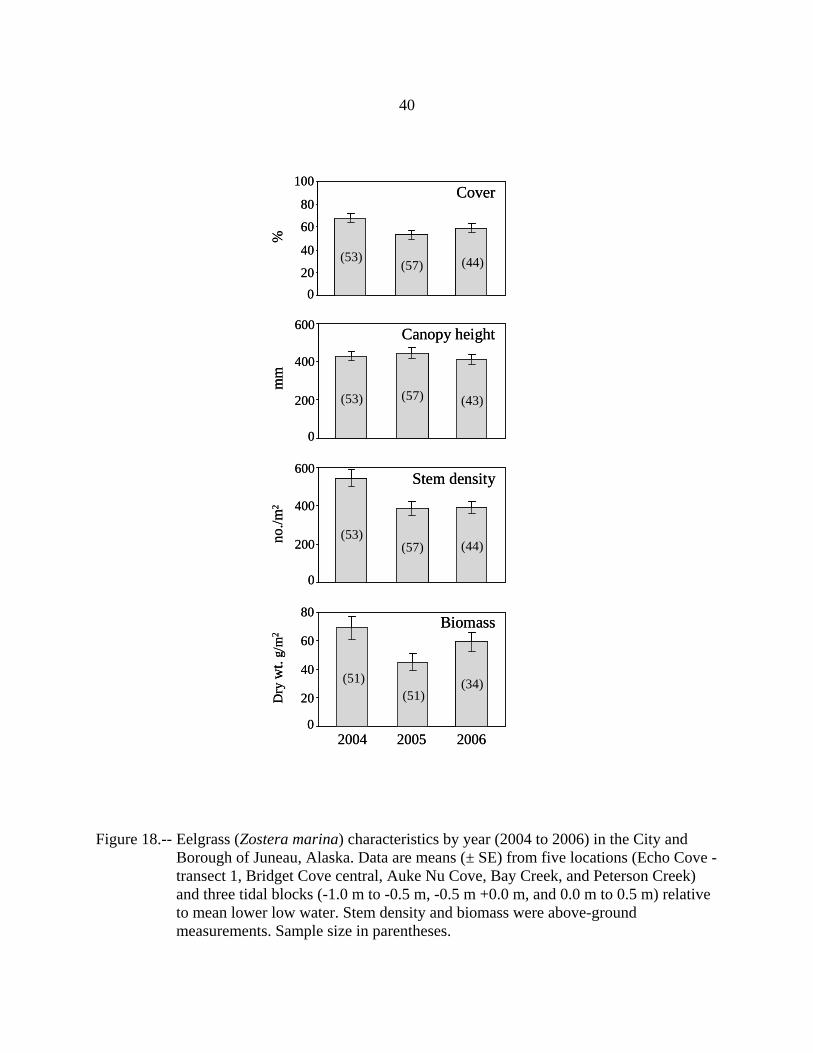
40
Cover
020
40
60
80
100
Canopy height
0
200
400
600
Stem density
0
200
400
600
no./m
2m
m%
Biomass
0
20
40
60
80
Dry
wt.
g/m
2
2004 2005 2006
(53) (57) (44)
(53) (57) (43)
(53)(57) (44)
(51)(51)
(34)
Cover
020
40
60
80
100
Canopy height
0
200
400
600
Stem density
0
200
400
600
no./m
2m
m%
Biomass
0
20
40
60
80
Dry
wt.
g/m
2
2004 2005 2006
(53) (57) (44)
(53) (57) (43)
(53)(57) (44)
(51)(51)
(34)
Figure 18.-- Eelgrass (Zostera marina) characteristics by year (2004 to 2006) in the City and
Borough of Juneau, Alaska. Data are means (± SE) from five locations (Echo Cove - transect 1, Bridget Cove central, Auke Nu Cove, Bay Creek, and Peterson Creek) and three tidal blocks (-1.0 m to -0.5 m, -0.5 m +0.0 m, and 0.0 m to 0.5 m) relative to mean lower low water. Stem density and biomass were above-ground measurements. Sample size in parentheses.
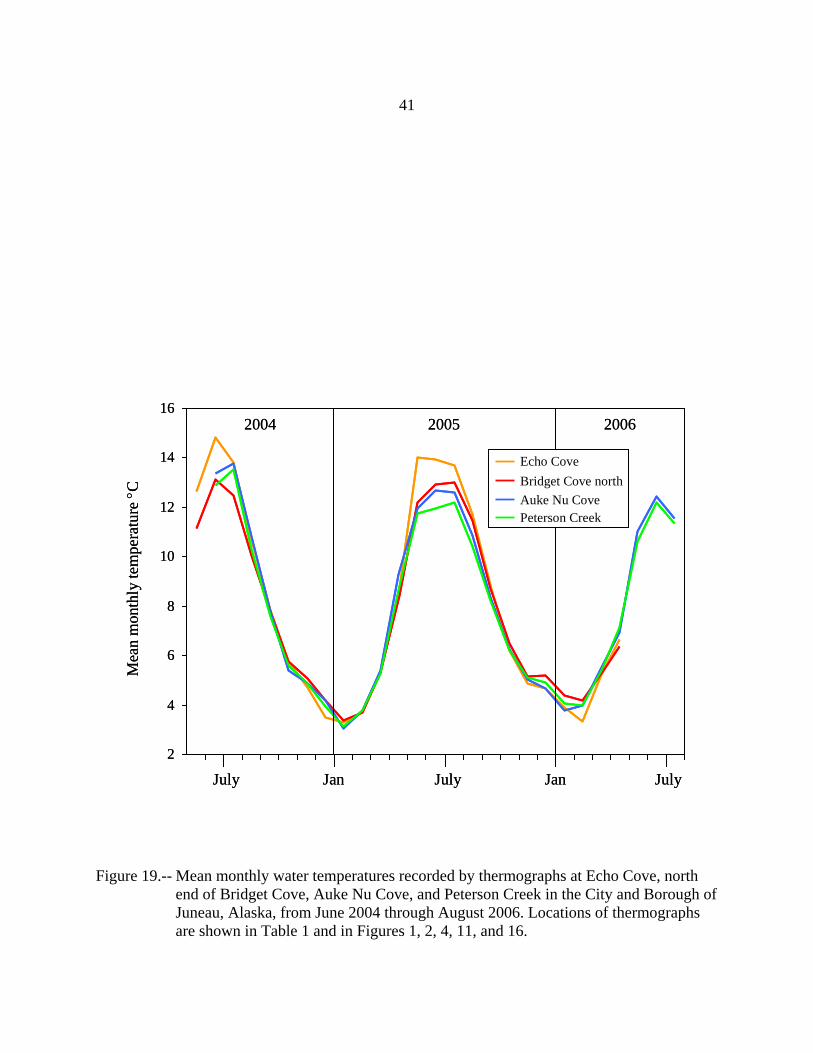
41
2
4
6
8
10
12
14
16
July Jan July Jan July
Mea
n m
onth
ly te
mpe
ratu
re °C
Echo CoveBridget Cove northAuke Nu CovePeterson Creek
2004 2005 2006
2
4
6
8
10
12
14
16
July Jan July Jan July
Mea
n m
onth
ly te
mpe
ratu
re °C
Echo CoveBridget Cove northAuke Nu CovePeterson Creek
2004 2005 2006
Figure 19.-- Mean monthly water temperatures recorded by thermographs at Echo Cove, north
end of Bridget Cove, Auke Nu Cove, and Peterson Creek in the City and Borough of Juneau, Alaska, from June 2004 through August 2006. Locations of thermographs are shown in Table 1 and in Figures 1, 2, 4, 11, and 16.

A
ppen
dix
1.--
Eel
gras
s (Zo
ster
a m
arin
a) p
erce
nt c
over
, can
opy
heig
ht (m
m),
abov
e-gr
ound
stem
den
sity
(num
ber s
hoot
s/m
2 ), an
d ab
ove-
grou
nd b
iom
ass (
gram
s/m
2 ) by
trans
ect,
year
, and
tida
l blo
ck a
t sev
en lo
catio
ns in
the
City
and
B
orou
gh o
f Jun
eau,
Ala
ska.
Eel
gras
s cha
ract
eris
tics a
re m
eans
(± S
E). T
rans
ects
wer
e sa
mpl
ed in
July
and
A
ugus
t 200
4, 2
005,
and
200
6. T
idal
blo
cks a
re re
lativ
e to
mea
n lo
wer
low
wat
er: 1
= -1
.0 m
to -0
.5 m
, 2 =
-0.5
m
to 0
.0 m
, 3 =
0.0
m to
+0.
5 m
, 4 =
+0.
5 m
to +
1.0
m, 5
= +
1.0
m to
+1.
5 m
.
Loca
tion
Figu
re T
rans
ect
Yea
r B
lock
C
over
SE
Can
opy
SE
D
ensi
ty S
E
Bio
mas
sSE
Ec
ho C
ove
2 1
2004
1
63
3
69
7 10
214.
438
.730
.81
12.2
4
20
05
1
11
73
770
52
16
3.2
45.7
26.9
4 10
.80
20
06
1
63
10
650
32
16
5.3
12.2
650.
00
74.5
9
2 20
05
1
74
9
550
32
14
0.8
35.6
39.2
6 6.
81
20
06
1
48
18
620
11
136.
062
.835
.52
23.4
4
20
05
2
50
48
475
43
16
8.0
48.2
49.7
9 29
.00
20
06
2
90
5
660
70
18
8.8
43.9
72.4
2 8.
82
Brid
get C
ove
cent
ral
5 4
2004
1
73
9
44
8 41
480.
077
.349
.74
6.11
20
05
1
53
11
390
10
400.
011
0.7
53.2
8 18
.30
20
06
1
66
9
550
61
52
0.0
40.5
104.
68
10.4
1
20
04
2
16
4
374
32
26
2.4
69.9
33.5
6 12
.39
20
05
2
88
13
460
51
70
4.0
135.
288
.20
16.5
0
20
06
2
53
14
260
43
50
0.0
41.0
59.2
0 14
.12
20
04
3
59
17
306
10
528.
013
2.0
48.1
0 21
.30
20
05
3
15
5
245
38
25
2.0
82.
7
13.0
6 5.
91
20
06
3
53
16
190
15
540.
012
9.4
41.9
9 10
.14
42

Lo
catio
n Fi
gure
Tra
nsec
tY
ear
Blo
ck
Cov
erSE
C
anop
y SE
Den
sity
SE
B
iom
ass
SE
20
04
4
42
19
316
39
29
7.6
33.8
30.7
9 11
.59
20
05
4
24
6
260
47
18
4.0
43.0
14.0
8 4.
84
20
06
4
37
15
240
43
24
6.4
88.3
30.0
2 16
.87
Brid
get C
ove
sout
h 6
5 20
04
1
19
8
298
63
18
5.6
38.4
16.7
6 4.
51
2005
1
5
2
345
68
16
0.0
56.9
8.14
3.
74
20
06
1
56
14
460
46
36
8.0
48.0
66.9
4 18
.34
20
04
2
99
1
532
20
46
9.3
117.
788
.75
19.3
0
20
05
2
26
15
260
65
20
4.8
65.1
18.3
8 9.
00
20
06
2
41
13
170
40
59
2.0
180.
057
.18
25.2
9
20
04
3
78
15
476
35
46
7.2
73.9
82.4
6 15
.30
Tee
Har
bor
8 6
2006
2
77
8
47
0 25
528.
054
.356
.83
4.39
20
06
3
60
10
420
32
44
8.0
67.3
36.8
3 12
.70
20
06
4
15
4
300
32
26
4.0
47.3
20.6
0 2.
46
20
06
5
18
11
190
24
14
8.0
49.0
4.70
0.
25
20
04
4
7 3
25
4 38
88.0
11
.010
.91
4.89
Auk
e N
u C
ove
11
9 20
04
1
98
2
767
33
61
3.3
129.
419
7.62
58
.43
20
05
1
90
12
470
12
329.
612
8.6
90.0
2 45
.70
20
04
2
97
2
700
10
650.
783
.812
7.53
15
.70
20
05
2
13
50
388
31
29
6.0
66.8
30.0
4 13
.39
43A
ppen
dix
1.--
Con
tinue
d.

A
ppen
dix
1.--
Con
tinue
d.
Loca
tion
Figu
re T
rans
ect
Yea
r B
lock
C
over
SE
Can
opy
SE
D
ensi
ty S
E
Bio
mas
sSE
2006
2
80
9
46
0 99
518.
470
.696
.04
29.4
5
20
04
3
85
12
352
45
97
2.8
144.
096
.38
21.8
0
20
05
3
25
77
370
26
25
6.0
77.2
25.3
8 13
.10
20
06
3
55
10
370
28
41
9.2
41.2
41.7
9 10
.33
20
05
4
28
12
210
19
27
8.4
81.2
18.3
6 6.
11
20
06
4
69
13
390
31
53
7.6
113.
645
.90
26.7
5
Bay
Cre
ek
13
11
2004
1
82
3
52
0 37
416.
065
.690
.52
24.2
4
20
05
1
92
3
800
76
37
7.6
21.2
65.6
2 9.
39
20
04
2
90
3
390
37
78
7.2
101.
989
.58
9.37
20
05
2
56
11
540
56
48
3.2
117.
456
.36
12.1
0
20
06
2
73
6
470
37
41
2.8
49.4
40.4
3 13
.48
20
04
3
90
4
296
16
85
7.6
127.
756
.61
7.51
20
05
3
41
77
325
48
73
2.0
77.7
40.9
0 10
.40
20
06
3
64
11
360
12
46
0.8
63.0
41.1
7 10
.83
20
04
4
73
8
324
19
64
3.2
120.
149
.39
9.16
20
05
4
18
17
230
26
35
5.2
178.
018
.44
10.9
0
20
06
4
71
13
320
25
60
0.0
86.3
50.6
1 12
.65
20
04
5
33
10
246
28
51
2.0
154.
235
.42
11.4
7
20
05
5
27
7
200
25
27
2.0
107.
18.
50
3.70
44
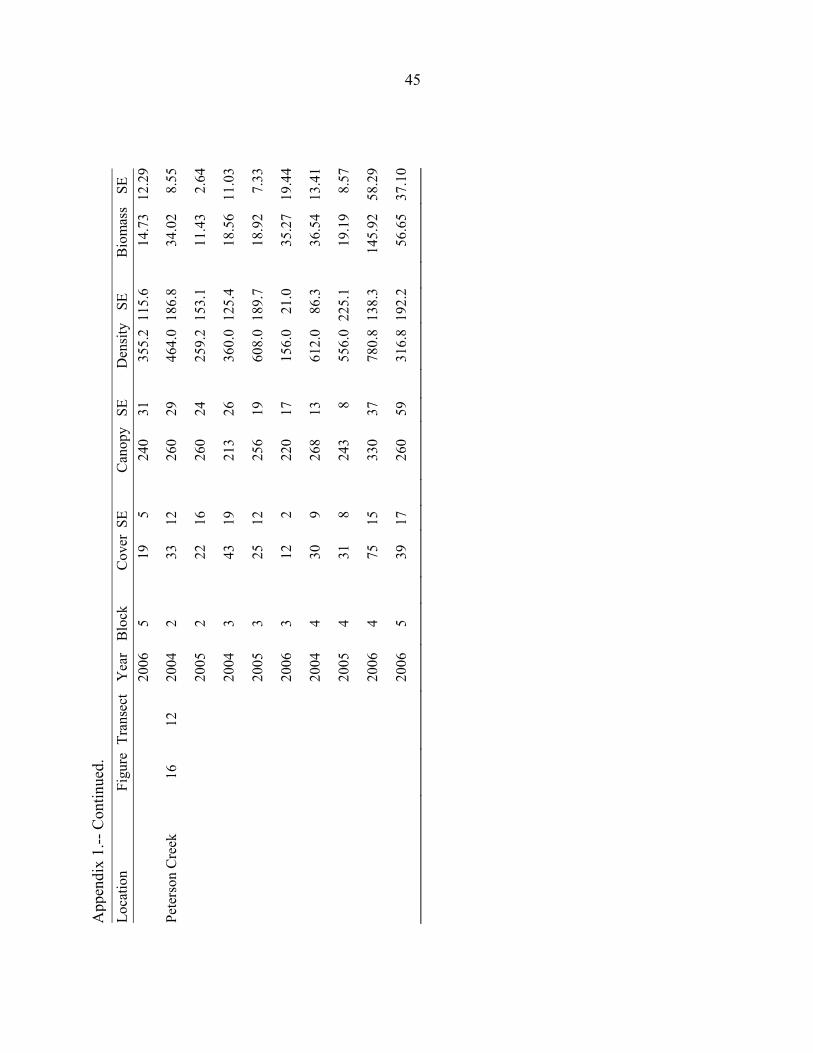
A
ppen
dix
1.--
Con
tinue
d.
Loca
tion
Figu
re T
rans
ect
Yea
r B
lock
C
over
SE
Can
opy
SE
D
ensi
ty S
E
Bio
mas
sSE
2006
5
19
5
24
0 31
355.
211
5.6
14.7
3 12
.29
Pete
rson
Cre
ek
16
12
2004
2
33
12
26
0 29
464.
018
6.8
34.0
2 8.
55
20
05
2
22
16
260
24
25
9.2
153.
111
.43
2.64
20
04
3
43
19
213
26
36
0.0
125.
418
.56
11.0
3
20
05
3
25
12
256
19
60
8.0
189.
718
.92
7.33
20
06
3
12
2
220
17
15
6.0
21.0
35.2
7 19
.44
20
04
4
30
9
268
13
61
2.0
86.3
36.5
4 13
.41
20
05
4
31
8
243
8
556.
022
5.1
19.1
9 8.
57
20
06
4
75
15
330
37
78
0.8
138.
314
5.92
58
.29
20
06
5
39
17
260
59
31
6.8
192.
256
.65
37.1
0
45
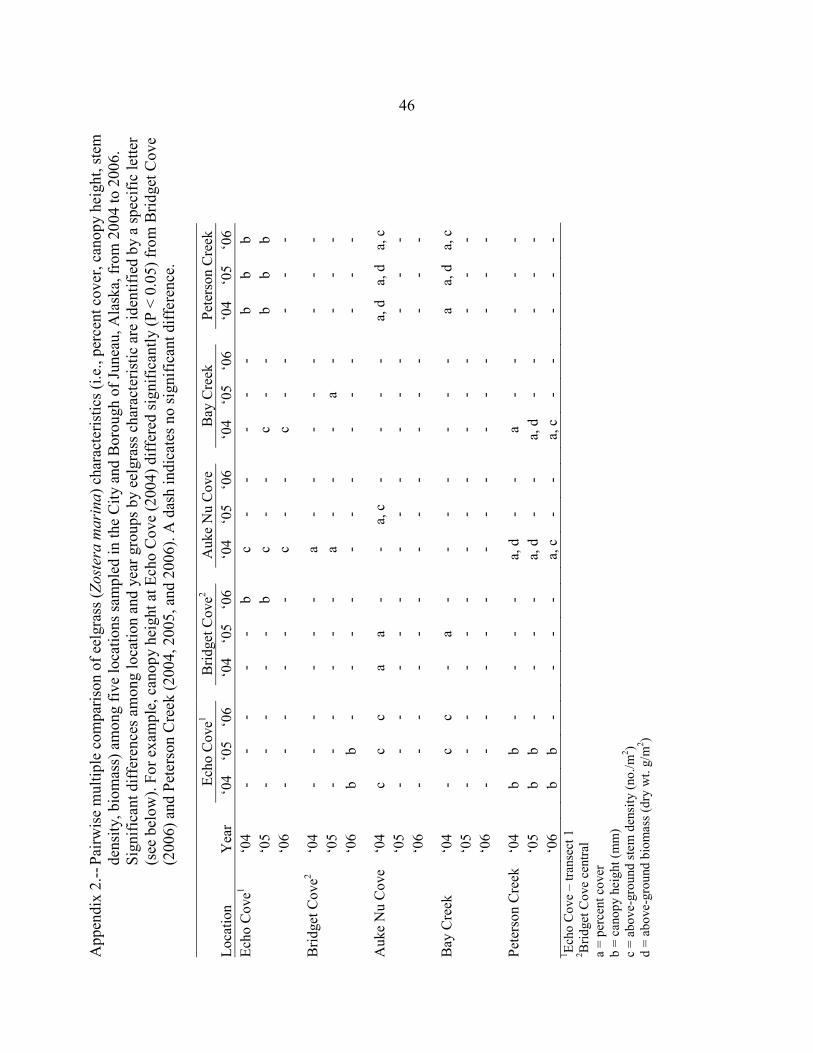
46A
ppen
dix
2.--
Pai
rwis
e m
ultip
le c
ompa
rison
of e
elgr
ass (
Zost
era
mar
ina)
cha
ract
eris
tics (
i.e.,
perc
ent c
over
, can
opy
heig
ht, s
tem
de
nsity
, bio
mas
s) a
mon
g fiv
e lo
catio
ns sa
mpl
ed in
the
City
and
Bor
ough
of J
unea
u, A
lask
a, fr
om 2
004
to 2
006.
Si
gnifi
cant
diff
eren
ces a
mon
g lo
catio
n an
d ye
ar g
roup
s by
eelg
rass
cha
ract
eris
tic a
re id
entif
ied
by a
spec
ific
lette
r (s
ee b
elow
). Fo
r exa
mpl
e, c
anop
y he
ight
at E
cho
Cov
e (2
004)
diff
ered
sign
ifica
ntly
(P <
0.0
5) fr
om B
ridge
t Cov
e (2
006)
and
Pet
erso
n C
reek
(200
4, 2
005,
and
200
6). A
das
h in
dica
tes n
o si
gnifi
cant
diff
eren
ce.
Ec
ho C
ove1
B
ridge
t Cov
e2
Auk
e N
u C
ove
B
ay C
reek
Pete
rson
Cre
ek
Loca
tion
Yea
r
‘04
‘05
‘06
‘0
4 ‘0
5 ‘0
6
‘04
‘05
‘06
‘0
4 ‘0
5 ‘0
6
‘04
‘05
‘06
Echo
Cov
e1 ‘0
4
- -
-
- -
b
c -
-
- -
-
b b
b
‘05
-
- -
-
- b
c
- -
c
- -
b
b b
‘0
6
- -
-
- -
-
c -
-
c -
-
- -
-
Brid
get C
ove2
‘04
-
- -
-
- -
a
- -
-
- -
-
- -
‘0
5
- -
-
- -
-
a -
-
- a
-
- -
-
‘06
b
b -
-
- -
-
- -
-
- -
-
- -
Auk
e N
u C
ove
‘04
c
c c
a
a -
-
a, c
-
-
- -
a,
d
a, d
a,
c
‘0
5
- -
-
- -
-
- -
-
- -
-
- -
-
‘06
-
- -
-
- -
-
- -
-
- -
-
- -
Bay
Cre
ek
‘04
-
c c
-
a -
-
- -
-
- -
a
a, d
a,
c
‘0
5
- -
-
- -
-
- -
-
- -
-
- -
-
‘06
-
- -
-
- -
-
- -
-
- -
-
- -
Pete
rson
Cre
ek
‘04
b
b -
-
- -
a,
d
- -
a
- -
-
- -
‘0
5
b b
-
- -
-
a, d
-
-
a, d
-
-
- -
-
‘06
b
b -
-
- -
a,
c
- -
a,
c
- -
-
- -
1 Echo
Cov
e –
trans
ect 1
2 B
ridge
t Cov
e ce
ntra
l a
= pe
rcen
t cov
er
b =
cano
py h
eigh
t (m
m)
c =
abov
e-gr
ound
stem
den
sity
(no.
/m2 )
d =
abov
e-gr
ound
bio
mas
s (dr
y w
t. g/
m2 )

RECENT TECHNICAL MEMORANDUMS
Copies of this and other NOAA Technical Memorandums are available from the National Technical Information Service, 5285 Port Royal Road, Springfield, VA 22167 (web site: www.ntis.gov). Paper and microfiche copies vary in price.
AFSC
181 ACUNA, E., and R. R. LAUTH. 2008. Results of the 2007 Eastern Bering Sea continental shelf bottom trawl survey of groundfish and invertebrate resources, 195 p.
180 ANGLISS, R. P., and R. B. OUTLAW. 2008. Alaska marine mammal stock assessments, 2007, 252 p. NTIS number pending.
179 ROOPER, C. N. 2008. Data report: 2006 Aleutian Islands bottom trawl survey, 237 p. NTIS number pending.
178 AYDIN, K., S. GAICHAS, I. ORTIZ, D. KINZEY, and N. FRIDAY. 2007. A comparison of the Bering Sea, Gulf of Alaska, and Aleutian Islands large marine ecosystems through food web modeling, 298 p. NTIS No. PB2008-107111.
177 YANG, M-S. 2007. Food habits and diet overlap of seven skate species in the Aleutian Islands,46 p. NTIS No. PB2008-102387.
176 LAUTH, R. R., and E. ACUNA. 2007. Results of the 2006 eastern Bering Sea continental shelf bottom trawl survey of groundfish and invertebrate resources, 175 p. NTIS PB2008-100452.
175 IVASHCHENKO,Y. V., P. J. CLAPHAM, and R. L. BROWNELL JR. (editors). 2007. Scientific reports of Soviet whaling expeditions in the North Pacific, 1955-1978, 34 p. [Translation: Y. V. Ivashchenko] + Appendix. NTIS No. PB2007112474.
174 TESTA, J. W. (editor). 2007. Fur seal investigations, 2004-2005, 76 p. NTIS No. PB2007-112500.
173 SIGLER, M. F., D. FALVEY, C. R. LUNSFORD, K. BARKHAU, and L. BEHNKEN. 2007. Product recovery rates for bled sablefish, 14 p. NTIS No. PB2007-112003.
172 MALECHA, P. W., D. H. HANSELMAN, and J. HEIFETZ. 2007. Growth and mortality of rockfishes (Scorpaenidae) from Alaska waters, 61 p. NTIS No. PB2007-112002.
171 HJELLVIK, V., and A. De ROBERTIS. 2007. Vessel comparison on the seabed echo: Influence of vessel attitude, 34 p. NTIS No. PB2007-111255.
170 RODGVELLER, C. J., J. H. MOSS, and A. M. FELDMANN. 2007. The influence of sampling location, timing, and hatching origin on the prediction of energy density in juvenile pink salmon, 27 p. NTIS No. PB2007-110270.
169 PELLA, J., and J. MASELKO. 2007. Probability sampling and estimation of the oil remaining in 2001 from the Exxon Valdez oil spill in Prince William Sound, 58 p. NTIS No. PB2007-110269.
168 ANGLISS, R. P., and R. B. OUTLAW. 2007. Alaska marine mammal stock assessments, 2006, 244 p. NTIS No. PB 2007-106476.
167 PEREZ, M. A. 2006. Analysis of marine mammal bycatch data from the trawl, longline, and pot groundfish fisheries of Alaska,1998-2004, defined by geographic area, gear type, and catch target groundfish species, 194 p. NTIS No. PB2007-106475.
166 WING, B. L, M. M. MASUDA, and S. G. TAYLOR. 2006. Time series analyses of physical environmental data records from Auke Bay, Alaska, 75 p. NTIS No. PB2007-101890.