eeg frequency bands in psychiatric disorders: a review of
TRANSCRIPT

REVIEWpublished: 09 January 2019
doi: 10.3389/fnhum.2018.00521
EEG Frequency Bands in PsychiatricDisorders: A Review of Resting StateStudiesJennifer J. Newson and Tara C. Thiagarajan*
Sapien Labs, Arlington, VA, United States
Edited by:Tamer Demiralp,
Istanbul University, Turkey
Reviewed by:Madhavi Rangaswamy,Christ University, India
Antonio Ivano Triggiani,University of Foggia, Italy
*Correspondence:Tara C. Thiagarajan
Received: 05 September 2018Accepted: 11 December 2018Published: 09 January 2019
Citation:Newson JJ and Thiagarajan TC(2019) EEG Frequency Bands in
Psychiatric Disorders: A Review ofResting State Studies.
Front. Hum. Neurosci. 12:521.doi: 10.3389/fnhum.2018.00521
A significant proportion of the electroencephalography (EEG) literature focuses ondifferences in historically pre-defined frequency bands in the power spectrum thatare typically referred to as alpha, beta, gamma, theta and delta waves. Here, wereview 184 EEG studies that report differences in frequency bands in the resting statecondition (eyes open and closed) across a spectrum of psychiatric disorders includingdepression, attention deficit-hyperactivity disorder (ADHD), autism, addiction, bipolardisorder, anxiety, panic disorder, post-traumatic stress disorder (PTSD), obsessivecompulsive disorder (OCD) and schizophrenia to determine patterns across disorders.Aggregating across all reported results we demonstrate that characteristic patternsof power change within specific frequency bands are not necessarily unique to anyone disorder but show substantial overlap across disorders as well as variabilitywithin disorders. In particular, we show that the most dominant pattern of change,across several disorder types including ADHD, schizophrenia and OCD, is powerincreases across lower frequencies (delta and theta) and decreases across higherfrequencies (alpha, beta and gamma). However, a considerable number of disorders,such as PTSD, addiction and autism show no dominant trend for spectral changein any direction. We report consistency and validation scores across the disordersand conditions showing that the dominant result across all disorders is typically only2.2 times as likely to occur in the literature as alternate results, and typically withless than 250 study participants when summed across all studies reporting this result.Furthermore, the magnitudes of the results were infrequently reported and were typicallysmall at between 20% and 30% and correlated weakly with symptom severity scores.Finally, we discuss the many methodological challenges and limitations relating to suchfrequency band analysis across the literature. These results caution any interpretationof results from studies that consider only one disorder in isolation, and for theoverall potential of this approach for delivering valuable insights in the field of mentalhealth.
Keywords: EEG, electroencephalography, resting-state, power spectrum, psychiatric, ADHD, schizophrenia,depression
Frontiers in Human Neuroscience | www.frontiersin.org 1 January 2019 | Volume 12 | Article 521

Newson and Thiagarajan Frequency Bands in Psychiatric Disorders
INTRODUCTION
In 2001 the World Health Organization1 (WHO) reported thatabout 450 million people worldwide suffer from some form ofmental disorder or brain condition, and that 1 in 4 people willmeet this criteria at some point in their life (Sayers, 2001). Morerecent statistics2 suggest that globally, 300 million people areaffected by depression, 60 million people suffer from bipolardisorder, 23 million people are affected by schizophrenia, 1 in160 children has autism spectrum disorder3 and between 5%and 7% of children and adolescents suffer from attention deficit-hyperactivity disorder (ADHD; Polanczyk et al., 2007). Diagnosisof these psychiatric disorders is typically carried out usingclinical interviews structured around the diagnosis classificationsystems of DSM-5 and ICD-11. These diagnostic criteria arebased on self-reported symptom clusters, with each disordertype having its own group of symptoms which can includebehavioral, cognitive, affective or physical disturbances. Forexample, ADHD diagnosis primarily focuses on cognitive andbehavioral complaints by the child or adult, whilst diagnosisof depressive disorders typically focuses on disruptions to anindividual’s affective and physical functioning.
However, the reliance on a subjective assessment approachwhich can be prone to patient and expert bias means thatresearchers have been trying to develop new ways to informclinical diagnosis and treatment effectiveness using objectivesymptom biomarkers, with electroencephalography (EEG) beingone method of interest (McLoughlin et al., 2014; Jeste et al.,2015; Olbrich et al., 2015). The approach that dominates theliterature focuses on analyzing broad frequency bands in theEEG power spectrum termed delta, theta, alpha, beta, andgamma (Berger, 1929; Jasper and Andrews, 1936; Hoaglandet al., 1937a,b; Dustman et al., 1962). This interpretation ofthe EEG signal in terms of spectral bands has its origins inthe technical limitations of the pre-computer era of the 1930sand ‘40s when few other analytical options were available.However, this approach results in a reduction in the richtemporal information available within the EEG and was, evenat that time, acknowledged to be sub-optimal (Walter, 1938).Yet, despite the tremendous progress in computing power andavailable algorithms, the spectral band approach continues topersist as the dominant approach to EEG analysis, including inthe development of clinical biomarkers. A recent example ofthis is the approval by the FDA4 of the use of the theta/betaratio as a biomarker for ADHD diagnosis (Saad et al., 2015;Gloss et al., 2016) whilst others are exploring the applicationof alpha-asymmetry as a potential marker for depression (vander Vinne et al., 2017; Kaiser et al., 2018). One question,therefore, is whether the approach of splicing the power spectruminto bands has persisted because it offers a superior approachin terms of research insight, methodological standardization,and reliability of results across studies, or whether it is
1http://www.who.int/2http://www.who.int/en/news-room/fact-sheets/detail/mental-disorders3http://www.who.int/en/news-room/fact-sheets/detail/autism-spectrum-disorders4https://www.accessdata.fda.gov/cdrh_docs/reviews/K112711.pdf
because researchers have simply kept with the status quo of80 years ago.
To explore the degree to which spectral band analysis of theEEG offers a reliable and useful approach for understandingdifferent psychiatric disorders, we have reviewed the methodsand results from 184 resting-state EEG studies across a hostof psychiatric disorders that report differences (or lack thereof)in the various frequency bands within the power spectrum.The objectives of this review are therefore threefold. First, todetermine the dominant patterns of results and reveal similaritiesand dissimilarities in the spectral trends both between andwithin different brain disorders during resting-state; second, toreport the reliability and consistency of results across disordertypes to determine the validity of applying power spectralanalyses to inform on individual psychiatric disorders; andthirdly to review the methodological and analytical approachesacross all studies to determine the degree to which theycan be compared and contrasted to draw reliable conclusionswithin the field. In this respect, we provide an objective viewof the literature along numerous methodological dimensionsfrom sample size and choice of demographic (e.g., age,gender) to method of clinical diagnosis and parameters ofEEG recording (e.g., reference type) and analysis (e.g., artifactremoval, Fourier transform algorithm) used both within andacross disorder types. We note that we restrict our focus toanalysis of frequency bands at the level of single channels oraveraged across channels and do not cover derivative analysisof these spectral bands such as their spatial coherence orasymmetry.
Such a cross disorder view is particularly warranted since themajority of clinical resting-state EEG studies focus primarily onone clinical disorder at a time, and do not offer a perspectiveacross a broader range of psychiatric disorders. Therefore, whilsta study may report changes in particular frequency bands forone disorder type, it is not always obvious whether this isunique to this particular disorder, or whether similar patternsof change are found across other psychiatric disorders. In otherwords, are there unique EEG signatures which differentiate onedisorder from another, or do the macro-level changes observed instudies employing a frequency band approach overlap with otherdisorders, therefore being more limited in their clinical diagnosispotential.
MATERIALS AND METHODS
Studies Identified and ReportingCharacteristicsWe present a review of studies published over the last25 years that report spectral power in different bands duringresting state conditions (eyes open and/or closed) across10 mental health disorders. These include depression, bipolardisorder, addiction, autism, ADHD, anxiety, panic disorder,obsessive compulsive disorder (OCD), post-traumatic stressdisorder (PTSD) and schizophrenia, allowing us to compareboth within and across disorders. We limit our review tostudies with an N of at least 20 participants that reported
Frontiers in Human Neuroscience | www.frontiersin.org 2 January 2019 | Volume 12 | Article 521

Newson and Thiagarajan Frequency Bands in Psychiatric Disorders
quantifiable results in at least one frequency band. Our intentionwas not to perform a full-scale meta-analysis but rather acomprehensive review of the state of recent literature. To doso we conducted a search of PubMed5 in May 2018 usingcombinations of the following keywords in the title or abstract:quantitative OR qEEG OR ongoing/on-going OR spontaneousOR resting/rest, combined with EEG and the key terms foreach of the disorders of interest. Only studies that examinedEEG spectral differences in at least one frequency band(exclusively or alongside other EEG metrics) between a clinicaland a control group were included. Studies whose researchfocus was on other aspects of mental health or cognition,or whose analysis focused exclusively on other EEG metrics(e.g., asymmetry, coherence, microstates, entropy etc.) wereexcluded. No study was excluded due to methodologicallimitations, but rather because it missed the proposed researchtopic. This enabled a comprehensive review of the variabilityof experimental and clinical parameters across the publishedliterature, rather than restricting it to a particular subset ofstudies.
As a next step, various methodological parameters werecollated including sampling characteristics, EEG recordingparameters and power spectrum computation. Samplingcharacteristics included sample size, demographic data (age,gender), medication status and diagnostic screening method.Key EEG parameters (where available) included referencingstyle, and recording length, and power spectrum computationincluded FFT method (windowing function, overlap, epochlength), frequency bands (and frequency window) and whetherabsolute and/or relative power differences were analyzed withineach band. We then noted any reported significant difference(increase or decrease) or lack of significant difference inpower/amplitude across each spectral band (delta, theta, alpha,beta, gamma where analyzed) for each study. In addition, tostandardize across studies, frequency bands which had been splitinto sub-bands (e.g., beta1/beta2) were collapsed for all analyses,and where results differed across sub bands (e.g., beta1 showedsignificance, beta2 showed no significance) we considered thesignificant finding as the primary result. In addition, in one study(Hong et al., 2012) the theta and alpha bands were collapsedtogether and in this instance we allocated the result to bothbands individually.
Where reported in text or figures, the magnitude of changewas also calculated (as a % increase or decrease). Any reportedcorrelations between individual spectral bands and clinicalsymptoms were also recorded when reported. All collected datawere consolidated in a spreadsheet for review and analysis.
Consistency and Reliability ScoresTo determine the dominant result for each band within eachdisorder group and recording condition we first identified themost frequently occurring (i.e., dominant) result (significantincrease, significant decrease or no significant difference). Forexample, for ADHD in children in the eyes closed condition therewere 13 studies reporting a significant increase in the absolute
5https://www.ncbi.nlm.nih.gov/pubmed/
power of the delta band, one study reporting no difference andthree studies reporting a significant decrease. In this case thedominant result is a significant increase. When the number ofstudies showing either a significant increase or decrease wasthe same as the number showing no difference, the dominantresult was considered no difference. When an equal number ofstudies showed an increase and a decrease (and the number washigher than those showing no significant difference) the resultwas marked as ‘‘opposing.’’
We then created a consistency score computed as the ratioof the number of studies reporting the dominant result (e.g.,no significant difference) to the number of studies reporting adifferent result (e.g., significant increase or decrease); essentiallyhow much more frequently the dominant result was reported inthe literature compared to some other result. When all studiesagreed (i.e., the divisor was zero) we used the number of studiesas the consistency score. When the studies were evenly dividedbetween any two results, we computed the consistency score as 1.
We next created a validation score by first computing theaverage N for the studies showing the dominant result in eachband and multiplying this by the number of studies showing thedominant result. We then averaged these values across all thebands (excluding the gamma band which was sparsely reported).The validation score is therefore an indication of the size of thepopulation from which the dominant result was obtained.
RESULTS
A total of 184 publications published between 1993 and 2018,found using the above search criteria in PubMed, matchedour inclusion criteria. A detailed list of studies with key studyparameters can be found in Supplementary Table S1. whiletrends in results are summarized below.
Overview of StudiesSample CharacteristicsA summary of the number of studies across disorders andtheir corresponding sample characteristics is shown in Table 1.Some disorders such as ADHD and schizophrenia were widelystudied (65 and 37 articles, respectively) while others such asdepression and autism were also popular, though less so (18 and16 studies respectively). In contrast, some disorders such asbipolar, generalized anxiety and panic disorder were very poorlyrepresented in the literature (six or fewer studies each). Themedian sample size across the studies was 60, with roughly equalnumbers of patients and controls in the majority of studies.Seventy-three percent of studies had sample sizes less than100 whilst only 10 studies (Clarke et al., 2001d; Wuebben andWinterer, 2001; Rangaswamy et al., 2002, 2006; Magee et al.,2005; McFarlane et al., 2005; Grin-Yatsenko et al., 2009; Kamet al., 2013; Narayanan et al., 2014; Arns et al., 2015) had samplesizes greater than 250 and only one of these (Arns et al., 2015) hada sample size greater than 1,000 (N = 1,344; depression; Figure 1).Participants were generally adults with an average age between30 and 40 except for ADHD and autism where studies largelyfocused on children and the average age ranged from 5 to 11 years
Frontiers in Human Neuroscience | www.frontiersin.org 3 January 2019 | Volume 12 | Article 521

Newson and Thiagarajan Frequency Bands in Psychiatric Disorders
TABLE 1 | Overview of studies.
No. of studies∗ Median N % Controls Average age (years) % Females % Eyes closed$
ADHD (children) 56# 76 45 11 25 75ADHD (adults) 14# 55.5 50 33 43 54Schizophrenia 37 63 54 31 33 92ASD/Autism& 16 56 52 8.5 21 33Depression 18 55 44 39 57 86OCD 10 61.5 49 32 56 100PTSD 13 74 50 40 37 67Addiction 16 45 49 33 30 88Panic disorder 4 79 44 35 69 50Bipolar disorder 6 99.5 55 30 55 50Anxiety 3 50 50 31 76 50
∗ Includes five joint studies: (1) depression/post-traumatic stress disorder (PTSD); (2) schizophrenia/bipolar; and (3) schizophrenia/depression. $ Includes studies which had only eyesclosed as well as studies which included both eyes closed and eyes open. &Excludes the one adult ASD/autism study. # Includes five studies with both children and adult participantgroups.
FIGURE 1 | Distribution of sample size across 184 studies in this review.Sample size includes both patients and controls. Median sample size was 60.One study, with a sample size of 1,344, was beyond the scale of this graph.
old. Furthermore, samples were typically skewed towards malesubjects (64%).
Each study compared a group with a diagnosed disorderto a control group. The majority of studies report on onlyone disorder, although a minority compare two disorders, e.g.,bipolar disorder and schizophrenia (Clementz et al., 1994; Kamet al., 2013; Narayanan et al., 2014), depression and schizophrenia(Begic et al., 2011), depression and PTSD (Kemp et al., 2010),alcohol and internet addiction (Son et al., 2015). In each case, thedisorder group(s) were determined using common psychiatricquestionnaires as described in Supplementary Table S2. In themajority of studies (70%), patients were unmedicated which wasdefined as being medication naive or having abstained fromtaking medication for a predefined period of time (ranging from12 h to 3 months).
Reported MetricsThe majority of studies reported resting state EEG with eyesclosed recordings (66% of studies). However, a minority ofstudies reported results for eyes open (19% of studies) orboth eyes open and closed (15%), analyzed either combined orseparately. While some studies reported all frequency bands,many were selective in reporting only one or two bands. Across
the studies, the alpha and theta bands were the most frequentlyreported (in 85/84% of studies), followed by beta (80%) anddelta (70%). Gamma is the least frequently reported (only 18% ofstudies). Given this pattern of reporting, it is sometimes unclearwhen a study reported on only one or two bands, whether it wasbecause the other bands were not analyzed, or whether they wereexcluded on account of negative or null results. Underreportingof negative or null results may therefore bias this review towardsthe positive results. It is also important to note that while moststudies followed a typical definition for the theta and alpha bands,there was wide variation in the definitions of other bands (see‘‘Methodological Challenges and Limitations’’ section).
For each band, studies most often reported differences inthe absolute power between control and disorder groups (61%of studies). Some of these studies additionally reported relativepower (28%) while a few reported differences in relative poweronly (10%). Relative power is typically calculated by computingthe power of each given band divided by the sum of poweracross all bands. Surprisingly, 29% of studies did not explicitlyindicate the method of reporting and required some inference.Where a study did not mention whether it reported absoluteor relative data, it was generally assumed that it was absolutein the absence of any evidence to the contrary. Most studiesreported aggregated results for broad cortical or source localizedregions (60%) while others reported results for individualchannels (32%). A small minority provided results aggregatedacross all recorded channels (8%). Given these differences inreporting we computed the magnitude of difference betweenthe control and disorder groups as percentages, where theinformation was available (in 40% of cases), averaging acrossbroad regions in all studies. Where there was a regional splitbetween increases and decreases across the scalp (e.g., frontalincreases and posterior decreases) the regional magnitudes wereallocated to their respective increase and decrease groupings(rather than being averaged together). Finally, a proportionof studies (27%) additionally reported correlations (significantor non-significant) between individual bands and disorderseverity.
It is also important to note that although some of the studiesreported here exclusively focused on the analysis of the powerspectrum, many of them additionally reported on other metrics
Frontiers in Human Neuroscience | www.frontiersin.org 4 January 2019 | Volume 12 | Article 521

Newson and Thiagarajan Frequency Bands in Psychiatric Disorders
including coherence analysis and asymmetries which are notreported here.
Aggregate Trends Across FrequencyBands and DisordersA trend analysis was performed for both absolute and relativepower differences reported between the disorder and controlgroup in each band (definitional and other methodologicaldifferences notwithstanding) for each disorder. To standardizeacross studies, we collapsed across any bands which had beensplit into sub-bands (e.g., beta1/beta2). Where results differedacross bands (e.g., beta1 showed significance, beta2 showed nosignificance) we considered the significant result as the primaryresult. Furthermore, results are shown separately for the eyesclosed and eyes open conditions. A small number of studies thatcombined eyes open and closed (for opioid addiction, depression,panic disorder, anxiety) are excluded from the trend analysisbut displayed in the tables for completeness. In addition, in theminority of cases where there was only a single study condition(i.e., eye open/closed, absolute/relative) for a particular disorder,the study was not included in the summary table or trendanalysis.
Dominant Results Across DisordersThe number of studies reporting either a significant increase, asignificant decrease, or no significant difference in the power ineach of the frequency bands relative to control for each disorderare shown in Supplementary Tables S3, S4 for absolute andrelative power respectively. The dominant result for each bandwithin each disorder group and recording condition (significant
increase, significant decrease or no significant difference) wasdetermined based on the result reported by the greatest numberof studies as described in the methods section ‘‘Consistency andReliability Scores.’’
Altogether we found that the most common result across alldisorders and bands combined was an absence of any significantdifference in both the eyes closed (53% absolute power, 63%relative power) and relative eyes open conditions (83%), whilstthere were similar levels of significant increase (46%) andno significant difference (39%) for absolute eyes open. Thedominant results for each band aggregated across all distinctdisorders and conditions are shown in Figure 2 for absolutepower (Figure 2A) and relative power (Figure 2B).
When restricting our view to the smaller proportion ofdisorders/conditions where the dominant result was a significantincrease or decrease, the general pattern that emerged was thatincreases dominated in the lower frequency delta and thetabands (86% for absolute and relative power) while decreasesdominated in the alpha band (67% absolute, 100% relative). Incontrast decreases were roughly as likely as increases in the betaband depending on the condition (37.5% absolute, 50% relative).The gamma band was excluded from analysis due to the smallnumber of studies, although here again, decreases were morecommon.
Examining this general effect at the level of the individualdisorder types, the results showed that there was an increasein absolute power for both delta and theta in the eyes closedcondition for ADHD (in children), schizophrenia, OCD anddepression, while ADHD (in adults) and alcohol addictionshowed an increase only in the theta band (Figure 3A). In
FIGURE 2 | Dominant result aggregated across all disorders and bands. (A) Number of disorders with no difference in absolute power relative to controls (white), anincrease (black), a decrease (gray) or opposing results (hashed) for eyes closed (top) and eyes open (bottom) conditions. Increases are more common for lowerfrequency bands (delta and theta) whilst decreases or no significant difference are more common for higher frequency bands (alpha and beta). (B) Same as (A) forrelative power. Legends and axis labels are common.
Frontiers in Human Neuroscience | www.frontiersin.org 5 January 2019 | Volume 12 | Article 521

Newson and Thiagarajan Frequency Bands in Psychiatric Disorders
the eyes open condition, an increase was dominant in bothdelta and theta for depression, ADHD (in children) and bipolardisorder but only in the delta band for ADHD (adults) andonly in the theta band for schizophrenia. However, even acrossthose disorders where an increase dominated these bands, therewere nonetheless a minority of studies reporting the oppositeeffect (e.g., three studies of ADHD in children, Dupuy et al.,2014a; Giertuga et al., 2017; Shephard et al., 2018, two studiesof schizophrenia Pascual-Marqui et al., 1999; Knyazeva et al.,2008 and one of OCD, Bucci et al., 2004). The only cases in the
FIGURE 3 | Dominant results for each individual disorder and band.(A) Differences in absolute power for each disorder (relative to control) for eyesclosed condition (top), eyes open (middle) and eyes open and closedcombined (bottom). White boxes indicate no change, black indicates anincrease, and gray indicates a decrease. Opposing results are shown byhashed boxes. (B) Difference in results between absolute power and relativepower for the same disorders. White indicates no difference, gray indicates asignificant increase or decrease in one but no significant difference in theother, while a hashed box indicates opposite results.
lower frequency bands where the dominant result was a decrease,rather than an increase, was in the delta band for autism (eyesclosed, Coben et al., 2008) and in the theta and delta bandsfor PTSD/early life stress (eyes open, McFarlane et al., 2005;Veltmeyer et al., 2006).
Significant decreases in absolute power were dominant in thealpha band for schizophrenia and OCD (eyes closed ), autism andPTSD (eyes open), and in the beta band for ADHD (children),autism and internet addiction (all eyes closed; Figure 3A). Incontrast, significant increases were dominant in a handful ofdisorders, most frequently when participants had their eyes open,including depression (beta, eyes open and closed), bipolar (alphaand beta, eyes open), schizophrenia (alpha and beta, eyes open)and alcohol addiction (beta, eyes closed ).
In two cases (OCD, eyes closed beta band and alcoholaddiction, eyes closed delta band) there was no dominant resultbut rather an equal number of studies showing increases anddecreases. These are shown as hash marked in Figure 3A.
In Figure 3B we show the differences between the dominantresult for absolute and relative power differences. Overall thedominant result for relative power was the same as for absolutepower in 62% of experimental comparisons (white squares)where each comparison is one band within one disorder andcondition. Results were most similar across relative and absolutefor the theta band (73% of disorders/conditions). Cases wherethere was a significant difference in one method but not theother are indicated as gray (36% of disorders/conditions), which,when examined in more detail, was the case for 50% of thedisorders and conditions in the beta band and 40% in the deltaband. There was a greater proportion of disorders/conditionswith no significant difference for relative power compared toabsolute power. This was particularly true for the delta band. Theonly case where the dominant result was diametrically opposedfor absolute power vs. relative power was in the delta band forADHD in children (eyes closed) where there was an increase inthe absolute power and decrease in the relative power (Figure 3B,hashed box).
Given the overall pattern of a greater likelihood of increasesin the lower frequencies and no change or decreases in higherfrequencies, it is important to note that, with the exception ofADHD, the same disorders that were dominated by increases intheta were not the ones dominated by decreases in beta. However,the overall trend across disorders would be for a decreasedtheta/beta ratio either due to an increase in theta and decreasein beta, an increase in theta and no change in beta, or no changein theta and a decrease in beta.
Consistency of ResultsWe next report analysis of consistency of the results forthose disorders/conditions where there were at least twostudies reporting on any particular band (Figures 4, 5).Consistency scores were calculated as described in methodssection ‘‘Consistency and Reliability Scores’’ and can be read ashow much more frequently the dominant result occurred in theliterature compared to any other result.
Figure 4 shows the average consistency scores across alldisorders for each band for the eyes closed (solid bars) and eyes
Frontiers in Human Neuroscience | www.frontiersin.org 6 January 2019 | Volume 12 | Article 521

Newson and Thiagarajan Frequency Bands in Psychiatric Disorders
open conditions (hashed bars), for both absolute and relativepower (gray and black bars respectively). Overall, the highestconsistency score, aggregated across all disorders and bands wasfor relative power with eyes closed (3.0) followed by absolutepower with eyes closed (2.2). Eyes open had lower consistencywith 2.0 and 1.5 for absolute and relative power respectively.When calculated separately for each band, a similar pattern wasobserved, though scores were slightly lower overall for delta andalpha. Taken together this suggests that eyes open is a much morevariable condition and that relative power estimates are morereliable.
Analysis of individual disorders/conditions, aggregated acrossbands (Figure 5A), revealed that the highest consistency scorewas for relative power comparisons of controls to ADHD inchildren with eyes closed (7.0) followed by internet addictionwith eyes closed (4). The highest consistency scores for absolutepower with eyes closed was for OCD (3.3), internet addiction(2.8) and ADHD in children (2.8). Autism and ADHD in adultshad generally the lowest consistency across all conditions. It issignificant, however, that the literature for two disorders withthe highest consistency scores, ADHD in children and internetaddiction, were each dominated by a single research group (47%of the articles for ADHD, 100% for internet addiction) which wasnot the case for other disorders with multiple studies. This hasthe advantage of a consistent methodology but also risks bias. Wethus point out the consistency score for ADHD in children whenthe dominant group is removed with an asterisk (Figure 5A).
We next report validation scores, computed as described inmethods sections ‘‘Consistency and Reliability Scores,’’ that areessentially the total number (N) of study participants across allthe studies reporting the dominant result (Figure 5B). ADHDin children with eyes closed had the highest number of studiesshowing the dominant result (8–25 per band) and with anaverage N of 129 the validation scores were the highest with2,516 for relative power (beyond the scale of the graph) and1,563 for absolute power. We note however that this more thanhalves for relative power when the dominant research group isexcluded. Also high was schizophrenia with 1,446 for absolutepower followed by depression (absolute, eyes closed) with 880.
FIGURE 4 | Consistency scores aggregated across disorders for each bandand condition. Consistency scores (frequency of dominant result relative toother results) were between 2 and 3 for absolute power in the eyes closedcondition for all bands (gray bars), between 2 and 4 for relative power eyesclosed (black bars) and typically between 1 and 2 for eyes open (absolute andrelative, gray and black hashed bars, except beta eyes open absolute power).
Nineteen percentage of disorders/conditions had scores less than100 and 47% had less than 200 indicating that they involved fewstudies and participants and therefore cannot be considered to besufficiently validated results.
Magnitude of ResultsWe next considered the reported magnitudes of difference (in %)for absolute and relative power, averaged across only thosestudies where a significant difference was reported, and whereaccurate information was available in the text, tables or figuresof the publication (shown in detail in Supplementary Table S5).On average, 40% of study comparisons reported magnitude data,although this varied across disorder types and ranged from 68%,67% and 58% for ADHD (adults), ASD/Autism and bipolardisorder respectively at the upper end, through to 26% for ADHD(children) and 29% for OCD at the lower end (in addition, noanxiety studies identified for this review included magnitudedata).
Across all disorders/conditions, the reported magnitude ofdifference (mean ± SD) was 34 ± 13% for absolute powerand 26 ± 14% for relative power, irrespective of whether thereported result was the dominant one or not. The distributionof magnitudes is shown in Figure 6A. Overall the magnitudeof increases (vs. decreases) were higher on average for absolutepower (gray bars) but not relative power (black bars). Given thatmagnitude data was not consistently reported across bands andconditions, no disorder or band specific trend can be reliablyinferred. We therefore do not report any trends. However, we donote that reported magnitudes were highest for schizophrenia,depression and bipolar disorder (∼44% on average for eyesclosed and ∼48% on average for eyes open across all bands)and lowest for opioid, internet addiction, ADHD in childrenwith eyes open and PTSD with eyes open (all 21%–22%). Overallmagnitudes were also highest for the alpha band, particularly fordecreases reported with eyes closed (46% on average) while otherbands were similarly lower.
We note that in many cases where different studiesreported opposing results, the magnitudes reported were notvery different. For example, although the dominant result forschizophrenia was a decrease in alpha (on average 58%), thosestudies that reported an increase in alpha (Hong et al., 2012; Kimet al., 2015) reported a similar magnitude (64%).
Correlation With Disorder SeverityWe also looked at reported correlations between individualbands and disorder severity, as rated by the clinical diagnosisand symptom questionnaire (Supplementary Table S6).Twenty-seven percent of studies reported multiple suchcorrelations for different bands and brain regions. We includedall reported correlations regardless of the specific brain region orband or symptom subset for which the correlation was reported.The distribution of these correlations is shown in Figure 6B. Thecorrelations generally ranged from 0.2 to 0.5 with an averagearound 0.4 (positive or negative) while a fraction of instancesreported no significant correlation (shown as 0). It is highlylikely that the nonsignificant correlations are underreported.Higher correlations of 0.6–0.8 were reported in some studiesshowing a second peak in the distribution. However, these
Frontiers in Human Neuroscience | www.frontiersin.org 7 January 2019 | Volume 12 | Article 521

Newson and Thiagarajan Frequency Bands in Psychiatric Disorders
FIGURE 5 | Consistency and validation scores by disorders. (A) Consistency scores for each disorder for relative power (top) with eyes closed (black bars) and eyesopen (black hashed bars) and absolute power (bottom) with eyes closed (gray bars), eyes open (gray hashed bars) and eyes closed and open combined (hatchedbars). Asterisk marks for attention deficit-hyperactivity disorder (ADHD) indicate consistency scores when the dominant research group is excluded. (B) Validationscores for each disorder. Order and legend are as in (A). Validation score for ADHD in children, relative power with eyes closed goes beyond the scale of this graph(2,516).
were disproportionately from two studies (Pogarell et al., 2006;Roh et al., 2015) with a very small number of participants(less than 40). When these were excluded, the peak at 0.7 wasmuch reduced (shown by the dotted line). Further, there wereno notable differences in the correlations for any individualdisorder or band. In addition, some studies reported regressioncoefficients rather than correlations which were generally lower(between 0.2 and 0.3) and are not included in the distribution.Thus, as an overall conclusion, it appears that correlations ofband power to symptom scores are generally weak and notspecific to any band or disorder.
We note that some studies included correlations to otherfactors such as a particular task performance, demographicvariables or age of onset that are not reported here. In
addition, a handful of studies performed other types of diagnosisclassification modeling to distinguish and predict differencesbetween the two study groups (Kim et al., 2015: schizophrenia;Knott et al., 2001b; Deldin and Chiu, 2005: depression; Chan andLeung, 2006; Chan et al., 2007; Sheikhani et al., 2012: autism;Kim et al., 2017: internet addiction; Ogrim et al., 2012; Buyck andWiersema, 2014a; Poil et al., 2014; Markovska-Simoska and Pop-Jordanova, 2017: ADHD). Again, these are not reported here.
Individual Psychiatric DisordersADHDThis review identified 65 ADHD studies with a median samplesize of 76 (children) and 55.5 (adults; range 23–378). Ofthese, 56 studied children and adolescents (average age of
Frontiers in Human Neuroscience | www.frontiersin.org 8 January 2019 | Volume 12 | Article 521

Newson and Thiagarajan Frequency Bands in Psychiatric Disorders
FIGURE 6 | Histograms of magnitudes of differences and correlations. (A) All reported magnitudes for differences between disorder groups and controls across allbands for absolute (gray bars) and relative power (black bars). Increases are shown as positive and decreases are negative. Reported increases for absolute poweroutnumbered reported decreases, although were similar in magnitude (35% and 34% respectively). Relative power was relatively symmetric with average magnitudeincreases of 22% and decreases of 31%. (B) Histogram of all reported correlations of band increases or decreases with symptom severity scores (all results wereincluded even if not the dominant result). Reports of “no significant correlation” are shown as 0. Positive and negative correlations were typically between 0.2 and0.5 although positive correlations were higher on average. High correlations (>0.6) were only found in two small studies (N < 40). Dotted line shows histogramexcluding these two studies.
11 years; Kuperman et al., 1996; Clarke et al., 1998, 2001a,b,c,d,2002a,b,c,d,e,f, 2003, 2006, 2007, 2008b, 2011, 2013, 2016;Bresnahan et al., 1999; Swartwood et al., 2003; Hermens et al.,2005a,b,c; Magee et al., 2005; Hobbs et al., 2007; Fonseca et al.,2008, 2013; Barry et al., 2009a,b, 2010; Sohn et al., 2010; Dupuyet al., 2011, 2013, 2014a,b; Lansbergen et al., 2011; Ogrim et al.,2012; Shi et al., 2012; Liechti et al., 2013; Buyck and Wiersema,2014a,b, 2015; Poil et al., 2014; Tye et al., 2014; Kitsune et al.,2015; Roh et al., 2015; Kamida et al., 2016; Kim et al., 2016;Thomas and Viljoen, 2016; Giertuga et al., 2017; Jarrett et al.,2017; Markovska-Simoska and Pop-Jordanova, 2017; Park et al.,2017; Rommel et al., 2017; Shephard et al., 2018) and 14 studiedadults (average age of 33 years; Bresnahan et al., 1999, 2006;Bresnahan and Barry, 2002; Hermens et al., 2004; Clarke et al.,2008a; Koehler et al., 2009; van Dongen-Boomsma et al., 2010;Woltering et al., 2012; Liechti et al., 2013; Buyck and Wiersema,2014a; Poil et al., 2014; Rommel et al., 2016; Markovska-Simoskaand Pop-Jordanova, 2017; Tombor et al., 2018). Five of thesestudies included both adults and children as participant groups(Bresnahan et al., 1999; Liechti et al., 2013; Buyck and Wiersema,2014a; Poil et al., 2014; Markovska-Simoska and Pop-Jordanova,2017). Above and beyond DSM or ICD in these studies, diagnosis
for ADHD was most typically performed using the Conners’Parent Rating Scale (CPRS; Conners et al., 1998), the ChildBehavior Checklist (CBCL; Achenbach and Rescorla, 2001), theWender Utah Rating Scale (WURS; Ward et al., 1993), Conners’Adult ADHD Rating Scales (CAARS; Conners and Sparrow,1999) and Barkley’s Semi-structured Interview for Adults withADHD (Barkley, 2011; Supplementary Table S2).
The dominant results for all age groups and conditions areshown in Figure 7A. Overall as described above, the resultsfor relative power in ADHD in children with eyes closedhad very high consistency (7.0) and validation (2,516) scores.Absolute power for eyes closed was still reliable but less so,with a consistency score of 2.8 and validation score of 1,563.The eyes open condition had a consistency score of 2.8 andvalidation score of 460. On the other hand, studies in adultswere substantially less consistent (consistency scores of 2.1 foreyes open and 1.1 for eyes closed for absolute power, and 2 foreyes open and 1.5 for eyes closed for relative power) and poorlyvalidated (75–201 depending on condition). However, giventhat nearly half the studies reported for ADHD, particularlyfor children, came from a single research group (31 out of65), we also show here the results when excluding this group
Frontiers in Human Neuroscience | www.frontiersin.org 9 January 2019 | Volume 12 | Article 521

Newson and Thiagarajan Frequency Bands in Psychiatric Disorders
FIGURE 7 | Dominant results across conditions for specific disorders.(A) Dominant result for each band for ADHD for each of various conditionsand age groups for both relative (rel) and absolute (abs) power and for eyesclosed (EC) and eyes open (EO), including all studies (top) and excluding thedominant research group (bottom). White boxes indicate no change, blackindicates an increase, and gray indicates a decrease. Opposing results areshown by hashed boxes. (B) Dominant result for each band for each type ofaddiction and condition. Legend as in (A). (C) Dominant result for each bandfor autism for each condition. Legend as in (A).
(Figure 7A, bottom). As can be seen, in the absence of thisgroup the dominant result for both delta and theta increases forchildren remains, as does the decrease in beta activity for relativeeyes closed for children, but there is a greater number of ‘‘no-significant difference’’ results overall for children. For adults,theta increases persist for absolute and relative eyes closed, butdifferences are observed for the other conditions and bands.
The following nine ADHD studies in children (absolutepower; eyes closed) failed to see the decrease in the beta band(Clarke et al., 2001d; Hobbs et al., 2007; Fonseca et al., 2008;Liechti et al., 2013; Buyck and Wiersema, 2014b, 2015; Dupuyet al., 2014a; Kamida et al., 2016; Kim et al., 2016) whilst threefurther ADHD studies reported a decrease in beta in posteriorregions but an increase in frontal regions (Clarke et al., 2002a,
2011; Hermens et al., 2005a). These inconsistencies could bedue to differences in the methodological approach (see below)or demographic or clinical differences within the participantgroups.
Overall, considering all studies, there is a reasonableconfidence in the general trend reported in the results forchildren but not adults, particularly for relative power eyesclosed. However, in all cases the magnitudes of differencewere modest (∼28% for both absolute and relative power) andcorrelations with symptom severity were typically in the orderof 0.3–0.4 for all bands (with the exception of Roh et al., 2015)which reported correlations between 0.6 and 0.7 across all bandsand brain regions for a very small sample set). This indicates thatoverall results pertaining to frequency bands are not sufficientlydiscriminatory nor predictive of symptoms.
Given the reliable increase in theta and concomitant decreasein beta reported in children under the eyes closed condition,the theta/beta ratio had been proposed and approved by theFDA as a diagnostic biomarker for ADHD. However, the lackof consistency in adults suggests that these findings are likelyage dependent and can perhaps not be extrapolated beyondthe narrow age group studied. Furthermore, the general patternof either an increase in theta or a decrease in beta is sharedby a number of other disorders including OCD, schizophreniaand internet addiction suggesting that a reduced theta/beta ratiois a general marker for shared symptoms across a numberof disorders rather than specific to the diagnosis of ADHD.However, we acknowledge that there are some studies whichspecifically examine the theta/beta ratio, without reportingresults from individual spectral bands and therefore did not meetthe inclusion criteria for this review (e.g., see Arns et al., 2013).Reported results relating to the theta/beta ratio may therefore beunderreported in this review. For this we point the reader to anumber of recent reviews and meta-analyses of EEG and ADHD,which have tried to detangle the pattern of EEG frequency bandchanges across studies (Barry et al., 2003; Snyder and Hall, 2006;Loo and Makeig, 2012).
SchizophreniaA number of resting-state EEG studies have been conductedon patients with schizophrenia (vs. healthy controls) most oftenwith eyes closed (although see Venables et al., 2009; Hanslmayret al., 2013; Narayanan et al., 2014 for three eyes open studies).In total, 37 schizophrenia studies were identified for this review(Clementz et al., 1994; Sponheim et al., 1994; Wada et al., 1994;Omori et al., 1995; Pascual-Marqui et al., 1999; Begic et al., 2000;Harris et al., 2001; Knott et al., 2001a; Wuebben and Winterer,2001; Mientus et al., 2002; Veiga et al., 2003; Kirino, 2004; Harriset al., 2006; Kirino, 2007; Knyazeva et al., 2008; Tislerova et al.,2008; John et al., 2009; Venables et al., 2009; Bandyopadhyayaet al., 2011; Begic et al., 2011; Itoh et al., 2011; Schug et al.,2011; Hong et al., 2012; Hanslmayr et al., 2013; Kam et al.,2013; Narayanan et al., 2014; Ranlund et al., 2014; Tikka et al.,2014; Andreou et al., 2015; Garakh et al., 2015; Goldstein et al.,2015; Kim et al., 2015; Mitra et al., 2015; Shreekantiah Umeshet al., 2016; Mitra et al., 2017; Moeini et al., 2017; Baraditset al., 2018). The median sample size was 63 (range 26–425),
Frontiers in Human Neuroscience | www.frontiersin.org 10 January 2019 | Volume 12 | Article 521

Newson and Thiagarajan Frequency Bands in Psychiatric Disorders
with the average age of participants being 31 years old. Aswell as more conventional DSM/ICD measures, schizophreniadiagnosis and severity was typically assessed using the Positiveand Negative Syndrome Scale (PANSS; Kay et al., 1987) and theBrief Psychiatric Rating Scale (BPRS; Overall and Gorham, 1962).
Schizophrenia showed consistent and reliable increases inthe absolute delta and theta band power and decreases in theabsolute alpha band power compared to controls with eyes closed(consistency scores of 2.2, reliability score 1,446). Furthermore,these differences were higher in magnitude relative to differencesreported for other disorders (average theta increase of 50%,alpha decrease of 58%). The net result would be a highertheta/beta ratio compared to controls, very similar to ADHD inchildren. However, the three eyes open studies (Venables et al.,2009; Hanslmayr et al., 2013; Narayanan et al., 2014) showeda completely different pattern—an increase in theta, alpha andbeta activity. Regional differences were also observed in a handfulof studies in the delta (Begic et al., 2000) and alpha (Omoriet al., 1995; Kim et al., 2015) bands where there was a frontal-posterior split with frontal increases and posterior decreases foralpha and the opposite pattern in the delta band. In addition,we found only three studies (Kirino, 2004, 2007; John et al.,2009) which measured relative changes in spectral power, themajority of which showed non-significant differences across allbands (although see John et al., 2009).
DepressionEighteen depression studies were identified for this review (Kwonet al., 1996; Bruder et al., 1997; Bell et al., 1998; Debener et al.,2000; Knott et al., 2001b; Pizzagalli et al., 2002; Deldin and Chiu,2005; Morgan et al., 2005; Bruder et al., 2008; Korb et al., 2008;Price et al., 2008; Grin-Yatsenko et al., 2009; Kemp et al., 2010;Begic et al., 2011; Jaworska et al., 2012; Cook et al., 2014; Arnset al., 2015; Slobodskoy-Plusnin, 2018). The median sample sizewas 55 (range 21–1344) with the average age of participants being39 years old. Beyond more conventional DSM/ICD measures,depression diagnosis and severity was most typically measuredusing the Hamilton Rating Scale for Depression (HAM-D;Hamilton, 1960).
The dominant result for depression was an increase in theabsolute power in both theta and beta bands for both eyesopen and eyes closed conditions (eyes closed consistency 1.8,validation 880; eyes open consistency 2.0, validation 337) withaverage magnitudes of 48%. However, these increases wereno longer visible when considering relative power where moststudies failed to find any significant differences across any band(Knott et al., 2001b; Morgan et al., 2005; Korb et al., 2008; Cooket al., 2014). The largest study (Arns et al., 2015) consisting of1,344 participants showed increases in theta power across frontalregions of the brain using the eLORETA source localized signalwhich is methodologically different from most other depressionstudies identified for this review which perform their analysis inelectrode space.
AddictionHere, we focus on three major types of addiction: opioids,alcohol and the internet and identified 16 addiction studies in
this review. The median sample size was 45 (range 28–614),with the average age of participants being 33 years old. Beyondmore conventional DSM/ICD measures, diagnosis and severityof internet addiction was most typically performed using theYoung’s Internet Addiction Test (IAT; Young, 1998), whilstalcohol and opioid addiction were assessed using a variable setof questionnaires depending on the study.
Surprisingly, despite the enormous attention to opioidaddiction by both media and government, particularly in theUnited States, only four resting-state EEG studies (Wang et al.,2015b, 2016; Motlagh et al., 2017; Zhao et al., 2017) wereidentified for this review based on our inclusion criteria (forother reviews, see Wang et al., 2015a; Ieong and Yuan, 2017).In addition, nine alcohol addiction (Günther et al., 1997; Bauer,2001; Rangaswamy et al., 2002, 2006; Saletu-Zyhlarz et al., 2004;Fein and Allen, 2006; Andrew and Fein, 2010; Son et al., 2015;Herrera-Díaz et al., 2016) and four internet addiction (Choiet al., 2013; Lee et al., 2014; Son et al., 2015; Kim et al., 2017)studies were identified for this review (includes one publicationwhich examined both alcohol and internet addiction in thesame study). It is important to acknowledge that addictionis a heterogeneous label encompassing multiple ‘‘types’’ ofaddictive disorder, and that the similarities and differencesin the underlying etiologies between substance addiction andinternet addiction are still not well defined. However, withthe recent inclusion of gaming addiction in the 11th Revisionof the International Classification of Diseases (ICD-11)6, wehave included internet addiction alongside substance addictiondisorders for interest and comparison.
The dominant result across all addictions and conditionswas one of no significant difference in all bands of the powerspectrum except beta which showed an increase for opioidand alcohol addiction and a decrease for internet addiction(Figure 7B). In addition, there was an increase in theta powerfor alcohol addiction, and a decrease in alpha power for opioidaddiction. Even where significant differences were reported, themagnitudes were small (15%–27%). While internet addictionhad a high consistency score of 4, all four studies came fromthe same research group. Alcohol addiction had a consistencyscore of 2.25 while the studies for opioid addiction were toofew in each condition to calculate a consistency score. Overall,across all addictions, the validation scores ranged (from 35 to753 depending on addiction type and condition). Given thesmall number of studies and high methodological variability,dependable conclusions cannot yet be drawn. However, as itstands, other than for the beta band, the power spectrum appearsessentially unaffected in any consistent and reliable way byaddiction.
OCDTen OCD studies were identified (all eyes closed) for this review(Molina et al., 1995; Tot et al., 2002; Karadag et al., 2003;Bucci et al., 2004; Pogarell et al., 2006; Velikova et al., 2010;Koprivová et al., 2011, 2013; Olbrich et al., 2013; Kamaradovaet al., 2016) with an median sample size of 61.5 (range 26–100).
6http://www.who.int/features/qa/gaming-disorder/en/
Frontiers in Human Neuroscience | www.frontiersin.org 11 January 2019 | Volume 12 | Article 521

Newson and Thiagarajan Frequency Bands in Psychiatric Disorders
The average age of participants was 32 years old. Five of thesestudies analyzed spectral power in the source localized signal(Velikova et al., 2010; Koprivová et al., 2011, 2013; Olbrichet al., 2013; Kamaradova et al., 2016), however source localizedresults were not substantially different from non-source localizedstudies. Beyond more conventional DSM/ICD measures, OCDdiagnosis and severity was typically performed using theYale-Brown Obsessive Compulsive Scale (Y-BOCS; Goodmanet al., 1989).
Like ADHD (in children) and schizophrenia, the dominantpattern was an increase in the delta and theta bands (averageincreases of ∼27 and 36% for absolute and relative powerrespectively) and a decrease in the alpha band (average decreaseof 41%). Further this pattern had a high consistency score of3.3 and a validation score of 231 for absolute power. On the otherhand, relative power was highly inconsistent (score 2) and poorlyvalidated (score 104).
OCD is often comorbid with other mental disorders andtherefore the pattern of EEG frequency band differences isunlikely to reflect changes that are purely attributable toOCD. There may also be overlap in symptoms with ADHD(Abramovitch et al., 2015) and schizophrenia (Cunill et al., 2009).
PTSDThirteen studies with patients with PTSD (Begic et al., 2001;Jokic-Begic and Begic, 2003; Ehlers et al., 2006; Rabe et al.,2006; Veltmeyer et al., 2006; Falconer et al., 2008; Shankmanet al., 2008; Kemp et al., 2010; Todder et al., 2012; Wahbeh andOken, 2013; Imperatori et al., 2014; Clancy et al., 2017), andwith individuals who have suffered significant early life stress(McFarlane et al., 2005), were identified for this review. Themedian sample size was 74 (range 20–407), with the average ageof participants being 40 years old. In addition to conventionalDSM/ICD measures, PTSD diagnosis and severity was mosttypically performed using the Clinician-Administered PTSDScale (CAPS; Blake et al., 1995).
The majority of eyes closed studies indicate no significantdifferences in spectral bands between PTSD patients and controlswith a reasonable consistency score of 2.4 for absolute power.When differences were reported, they suggest a decrease in allbands in the disorder group for eyes open conditions, and bothincreases and decreases for eyes closed conditions. However, inmost of these studies while ‘‘significant’’ effects are stated, specificnumbers pertaining to the magnitude are not reported making itdifficult to evaluate.
AutismSeventeen studies with patients with autism or ASD wereidentified for this review (Dawson et al., 1995; Sutton et al., 2004;Chan and Leung, 2006; Chan et al., 2007; Orekhova et al., 2007;Stroganova et al., 2007; Coben et al., 2008; Burnette et al., 2011;Mathewson et al., 2012; Sheikhani et al., 2012; Tierney et al., 2012;Machado et al., 2015; Maxwell et al., 2015; van Diessen et al.,2015; Jaime et al., 2016; Kozhushko et al., 2018; Lefebvre et al.,2018). These have primarily been conducted with children withthe average age of participants (children) being 8.5 years old (butsee Mathewson et al., 2012 for an example of a study with adults,and not included in the trend analysis). The median sample size
was 56 (range 25–156). Beyond more conventional DSM/ICDmeasures, autism diagnosis and severity was typically performedusing Autism Diagnostic Interview-Revised (ADI-R; Lord et al.,1994), the Autism Diagnostic Observation Schedule (ADOS;Lord et al., 1989) and the Social Communication Questionnaire(SCQ; Rutter and Lord, 2003).
Overall autism showed little or no significant difference inthe majority of bands (with the exception of delta and beta eyesclosed and alpha eyes open; Figure 7C). However, the results forautism are highly inconsistent (consistency scores all below 2),and no general pattern can be inferred.
Other DisordersOther disorders such as bipolar disorder (Clementz et al., 1994;El-Badri et al., 2001; Bas ar et al., 2012; Kam et al., 2013;Narayanan et al., 2014; Moeini et al., 2015), anxiety (Sachset al., 2004; Oathes et al., 2008; Xing et al., 2017) and panicdisorder (Knott et al., 1996; Gordeev, 2008; Wise et al., 2011;de Carvalho et al., 2015) are included here for completeness.However generally there was no more than one or two studiesfor any one condition (eyes closed, eyes open, relative power,absolute power), which was too few for the inference of anytrends or for the calculation of consistency scores. Nonethelesswe show these results as part of our table with the caveat thatthey are generally poorly validated.
SummaryIn summary, differences reported for ADHD in children stoodout as being the most consistent and validated, althoughpublished results were dominated by a single research group. Thetrends for schizophrenia could be considered as the next mostreliable with a trend similar to ADHD in children. Others such asOCD, depression and internet addiction are moderately reliablewhile the results for other disorders or conditions are either toosparse or inconsistent to be considered reliable.
Methodological Challenges andLimitationsOne considerable challenge when reviewing the literature isthe range of methodologies employed that result in difficultiescomparing one study to another. Here, we outline the differencesin participant selection, EEG recording and analysis that couldimpact the results reported in this review.
Several sets of EEG guidelines have been published overthe years, including guidelines from the American ClinicalNeurophysiological Society7 as well as from other publishedstudies (e.g., Pivik et al., 1993; Roach and Mathalon, 2008;Keil et al., 2013; Webb et al., 2015). These discuss thevarious factors that need to be considered when choosingwhich EEG parameters to use. For example, Keil et al. (2013),emphasize the multitude of parameters which can influencethe transformation of the power spectrum and highlight theimportance of noting the parameters that influence the finalreported outcome. For example, in relation to the Fouriertransform, they state that ‘‘Researchers. . . should indicate the
7https://www.acns.org/practice/guidelines
Frontiers in Human Neuroscience | www.frontiersin.org 12 January 2019 | Volume 12 | Article 521

Newson and Thiagarajan Frequency Bands in Psychiatric Disorders
type, size, and overlap of the window functions used,’’ remindingresearchers that ‘‘When using commercial software, it is notsufficient to indicate that the spectrum was calculated usinga particular software package.’’ However, when looking acrossthe 184 resting-state EEG studies identified for this review it isapparent that there is very poor compliance to many of thesestandardization recommendations. For example, several studiesin this review, simply state that the data was transformed byFFT without providing any further details of the parametersused. This lack of standards presents a general confound forthe field that extends beyond the implications for this particularreview.
Study Size, Composition and ControlsThe sample size of studies varies between n = 20 andn = 1,344 with three quarters of studies based on less than100 participants. The median is 60 (Figure 1) with similarnumbers of controls and patients in the majority of studies. Formost studies the age of participants were adults in the range of25–45.
Interestingly most of the studies in this review were skewedtowards male participants (64% compared to 36% female). Thispattern is found for all disorders except for depression, bipolardisorder, panic disorder, anxiety and OCD (where the % offemales ranged from 55% to 68%). The largest gender disparityis seen for ADHD (72% M/28% F), schizophrenia (67% M/33%F), autism (78% M/22% F) and addiction (70% M/30% F). Inaddition, it was more common to study all-male participantgroups (20% of studies) compared to all-female participants(4% of studies). In some instances, the ratio of males tofemales was intentionally designed to reflect the relativeproportions of sufferers in the general population, but at othertimes was a reflection of participant availability, limiting thegeneralizability of these results, especially towards the femalepopulation.
There is substantial variability in the EEG both acrossand within normal individuals that has been reported in theliterature (Haegens et al., 2014) that can relate to various factorsfrom task performance (Arazi et al., 2017a,b) to age (Voyteket al., 2015; Hashemi et al., 2016) and socioeconomic factors(Parameshwaran and Thiagarajan, 2017a,b,c). Furthermore,there is a great deal of intra person variability that can ariseboth naturally and with ingestion of common substances suchas caffeine (Kelly et al., 2008; Foxe et al., 2012; Gonen-Yaacoviet al., 2016) and alcohol (Korucuoglu et al., 2016). Only a handfulof studies considered inter person variability, relationship to ageor intra person variability in their analysis (e.g., see Debeneret al., 2000; Chan and Leung, 2006). One study (autism) whichdid monitor intrapersonal variability by conducting two testingsessions 3 months apart found that amplitudes of theta, alpha andbeta significantly differed for patients (but not controls) betweenthe two sessions, although only alpha, and the theta/beta ratioremained significantly different after correction for familywiseerrors (Chan and Leung, 2006). In addition, the small samplesizes make it challenging to tease out effects of age andnormal individual variability from those related to psychiatricsymptoms.
ADHD provides an example of studies focused separately onadults and children. The stark difference between the resultsof these two groups points to changes over the lifespan and itis conceivable that similar studies in the elderly may producedifferent results still. Without controlling for normal variabilityand change across the lifespan, it is difficult to know whetherthese changes are due to the clinical evolution of ADHD, orreflect independent age-related maturation of the EEG.
Clinical Groups and AssessmentTen different disorder types were included in this review.These were selected as being the most dominant mental healthdisorders in the population. Due to the wide scope of our review,we acknowledge that we may have missed some studies for thedisorder types of interest. Age-related disorders such as dementiawere not included in this review as they were considered to reflecta different aspect of brain health.
From a clinical perspective, participants were typicallyrecruited based on screening with DSM or ICD criteria fordiagnosis, complemented by additional screening questionnaires.However, a handful of studies relied purely on screeningquestionnaires. The study participants also varied according towhether the clinical group was unmedicated (70%), definedas naïve or temporarily abstaining from taking medicationfor a variable length of time (12 h to 3 months) dependingon the type of drug, medicated (5%) or included a mixof medicated and unmedicated patients (25%). Furthermore,although the majority of studies had specific inclusion andexclusion criteria, only a minority of studies specifically mentionthat they excluded patients with comorbidities, or specificallyoutlined the comorbidities in their patient group. The resultsfrom a particular disorder may therefore be influenced by otherclinical comorbidities. Finally, the studies typically only reporton spectral differences between groups and only 27% of studiesprovide insight into the relationship between the severity ofthe symptom score from the diagnosis questionnaires and thespectral bands.
Recording ConfigurationA significant confound in the EEG space is the lack ofstandardization of hardware configurations and, in particular,the wide variety of different reference types used. Most commonare linked ears (34%), average referencing (23%) and mastoids(15%). However, earlobes (14%), Cz (4%) and the nose (4%) arealso used. The type of referencing used has a significant impacton the reported results, from the PSD and source localization(Trujillo et al., 2017) to functional connectivity (Huang et al.,2017) and various other aspects (e.g., Qin et al., 2010; Lei andLiao, 2017).
In addition, although the majority of studies covered theentire scalp, some studies chose to focus on midline sites. Only aproportion of studies reported results from individual electrodes(32%), with the majority choosing to focus on broad scalp regions(60%). In addition, some studies calculated the power spectrumusing source localization techniques (e.g., LORETA) which mayhave resulted in a different regional profile from those studiesfocusing on the location of the electrodes on the scalp.
Frontiers in Human Neuroscience | www.frontiersin.org 13 January 2019 | Volume 12 | Article 521
Newson and Thiagarajan Frequency Bands in Psychiatric Disorders
TABLE 2 | Summary of frequency band parameters.
% of Publications Typical range (Hz) Minimum start value (Hz) Maximum end value (Hz)
Delta 70 1.3–3.5 0 6Theta 84 4–7.5 2.5 8Alpha 85 8–13 6 14Beta 80 12.5–30 12 50Gamma 18 30–40 20 100
Processing of the SignalThe length of recordings was fairly consistent with a median of5 min. However, often this entire recording window is not usedbut is divided up into artifact free segments that are epochedbefore the FFT computation is applied. The epoch length used forthe FFT transform displays considerable variability (from 0.5 s to600 s) with a median of 2.5 s. This variability is of concern as thiscan impact the window length utilized in the FFT algorithm andtherefore the spreading or leakage across frequencies.
There are also inconsistencies in the methods used foridentification of artifacts. This is sometimes done with methodssuch as Independent Component Analysis (ICA; Makeiget al., 1996; Vigário, 1997; Vigário et al., 2000; Jung et al.,2003) but many other techniques exist and many still usea manual or visually determined approach which can behighly inconsistent from ‘‘expert’’ to ‘‘expert’’ (see Urigüen andGarcia-Zapirain, 2015; Islam et al., 2016). These can result insubstantial differences in the signal and therefore the spectralresults.
The method used to determine the spectrum and differentnormalizations are another aspect of variability that can impactthe magnitude of differences. There are presently a wide varietyof software packages, algorithms and parameters used forcomputing the power spectrum. Software packages and functionsinclude MATLAB/EEGLab Brainwave, Cadwell, sLORETA,eLORETA, RHYTHM, Neuroscan, Neuroguide, NXLink, BrainVision Analyzer, Neurospeed, Persyst. While the FFT functionsin these packages are roughly similar they do have differencesin their default settings, and in some software the parametersused in the algorithm are not exposed and therefore not reported.Each function (for example spectrogram; pwelch algorithm;psd function; FFT function in MATLAB) further differ intheir default settings with respect to the way the windowlength is selected, the overlap (here the studies range from0 to 80%) and averaging (e.g., Bartlett or Welch method),and the windowing function used (e.g., Hamming or HanningWindow). All of these can make the difference between asmall ‘‘significant’’ difference vs. a negative result (Keil et al.,2013). In addition, several studies did not provide any detailsabout the parameters used, making it difficult to make acomplete assessment of the consistency of methods in thefield.
Finally, some studies report the differences in the absolutepower and others report relative power which can also resultin different outcomes, as we have seen above. However, as notall studies specifically mentioned whether they used absolute orrelative power, for 29% of studies we had to infer which onewas used.
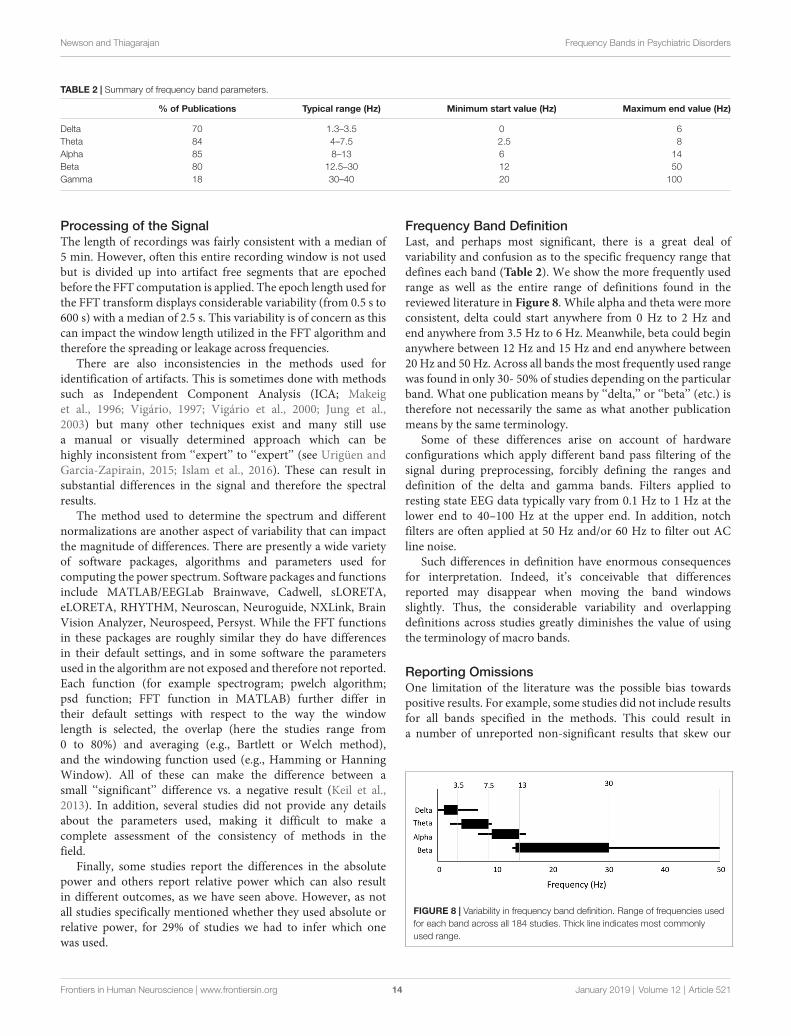
Frequency Band DefinitionLast, and perhaps most significant, there is a great deal ofvariability and confusion as to the specific frequency range thatdefines each band (Table 2). We show the more frequently usedrange as well as the entire range of definitions found in thereviewed literature in Figure 8. While alpha and theta were moreconsistent, delta could start anywhere from 0 Hz to 2 Hz andend anywhere from 3.5 Hz to 6 Hz. Meanwhile, beta could beginanywhere between 12 Hz and 15 Hz and end anywhere between20 Hz and 50 Hz. Across all bands the most frequently used rangewas found in only 30- 50% of studies depending on the particularband. What one publication means by ‘‘delta,’’ or ‘‘beta’’ (etc.) istherefore not necessarily the same as what another publicationmeans by the same terminology.
Some of these differences arise on account of hardwareconfigurations which apply different band pass filtering of thesignal during preprocessing, forcibly defining the ranges anddefinition of the delta and gamma bands. Filters applied toresting state EEG data typically vary from 0.1 Hz to 1 Hz at thelower end to 40–100 Hz at the upper end. In addition, notchfilters are often applied at 50 Hz and/or 60 Hz to filter out ACline noise.
Such differences in definition have enormous consequencesfor interpretation. Indeed, it’s conceivable that differencesreported may disappear when moving the band windowsslightly. Thus, the considerable variability and overlappingdefinitions across studies greatly diminishes the value of usingthe terminology of macro bands.
Reporting OmissionsOne limitation of the literature was the possible bias towardspositive results. For example, some studies did not include resultsfor all bands specified in the methods. This could result ina number of unreported non-significant results that skew our
FIGURE 8 | Variability in frequency band definition. Range of frequencies usedfor each band across all 184 studies. Thick line indicates most commonlyused range.
Frontiers in Human Neuroscience | www.frontiersin.org 14 January 2019 | Volume 12 | Article 521

Newson and Thiagarajan Frequency Bands in Psychiatric Disorders
analysis, particularly in the less frequently reported delta and betabands.
Another inadequacy of this review relates to the sparsereporting of magnitudes of power change. Magnitude changeswere calculated where the information was readily available,which was only in 40% of studies. The consequence of this isthat the magnitude estimations are only based on a subset ofstudies, and do not necessarily reflect the complete picture. Thisis especially the case for ADHD (children) and OCD wherethe availability of magnitude data was considerably lower. Inaddition, this incomplete reporting of magnitudes across studies,and across individual electrodes also makes it challenging tostudy regional differences in spectral power in a consistentmanner.
In summary, there are a number of dimensions ofmethodological variability and omissions that form limitationsfor this review and the field in general.
DISCUSSION
Our review describes reported differences in bands of theEEG power spectrum between controls and those withvarious psychiatric disorders including ADHD, schizophrenia,depression, bipolar disorder, anxiety, panic disorder, autism,PTSD, OCD and addiction. Across all disorders and conditionshowever, there was a wide range of often contradictory resultsfor each frequency band (delta, theta, alpha, beta, gamma),although one result typically dominated. When considering thedominant results, the pattern that emerged is a tendency forhigher levels in the low frequency bands (delta and theta) coupledwith lower levels in the higher frequency bands (alpha, beta,gamma) across one group of disorders (ADHD, schizophreniaand OCD) relative to controls, and little to no difference inthe power spectrum for others (addiction, PTSD and autism).Significant differences in this second set, when reported, weremost often decreases in the higher frequency bands. Depressionstood out as having a different pattern—an increase across theentire spectrum.
Across all disorders and conditions, the number of studiesreporting the dominant result was on average 2.2 times thenumber of studies reporting other results and was similaracross bands. In general, the eyes closed condition deliveredmore consistent results than the eyes open. Furthermore, whileabsolute power was most commonly reported, results were moreconsistent across studies for relative power. Across disordersand conditions, the validation score, a measure of how manyparticipants and studies, on average, delivered the dominantresult, was less than 250 for the majority of disorders. ADHDin children with eyes closed stood out as being by far the moststudied and consistent in result, while schizophrenia, alcoholaddiction, depression and PTSD with eyes closed followed by asubstantial lag in being the next most reported and consistent inthe literature. However, it is important to note that the majorityof the ADHD (children) studies identified for this review weregenerated from a relatively small group of researchers (from theUniversity of Wollongong) and the results from other researchgroups for ADHD are more variable. Other disorders and
conditions were either too inconsistent or sparsely reported.The magnitude of significant results, when reported, was onaverage 34% across all bands and disorders for absolute power,and somewhat lower for relative power differences. Interestinglythe magnitude of reported results was highest for schizophrenia(46%–53%) and lower than average for ADHD (11%–36%) andautism (11%–33%). Finally, the correlations between symptomseverity and the power in any particular band was low forany brain regions reported and generally in the range of0.3–0.5.
Implications of These ResultsThe extreme lack of standardization across the field raises astrong caution to any clinical interpretation or application ofcurrent findings. From a purely methodological perspective,it is important that standards are imposed and adhered toin the research community. Particularly, we emphasize theneed to use a standardized definition for each frequency band,based on the most commonly used non-overlapping frequencies:(delta: <4 Hz; theta: 4–7.5 Hz; alpha: 7.5–12.5 Hz; beta:12.5–30 Hz; gamma: 30–40 Hz). Standardization of powerspectrum computation, and the comparison of relative as well asabsolute power are also essential. Absolute power, which relatesto amplitude or magnitude of the signal, is more influenced byfactors such as skull thickness and head geometry which varyconsiderably across people (Hagemann et al., 2008). These factorsmay be mitigated by the normalization used for relative power.Second, the eyes open paradigm is highly variable as visual inputand attention can vary across subjects during the course of theexperiment, pointing to eyes closed as a more uniform condition.
However, the generally common pattern across multipledisorders is an indication that individual frequency bands oreven a pattern across frequency bands does not serve as auseful measure of distinction between disorders. It also stronglymakes the case that studying individual disorders in isolationcan be very misleading. For instance, a higher theta/beta ratio isconsidered an indicator of ADHD in children and even approvedas a diagnostic marker by the FDA8. However, a similarlyhigher theta/beta ratio would be likely for schizophrenia andOCD as well. Psychiatric disorders are generally a loose set ofsymptoms that may overlap across disorders and there may beadditional symptom comorbidities that are not accounted forin studies. Consequently, analysis based on specific symptomsand symptom clusters may yield more specific insights. This isparticularly important to consider in the context of biomarkersbased on the power spectrum.
It is also important to note that the patterns described acrossdisorders are at a group level. For example, theta power wason average 27% higher in children diagnosed with ADHD vs.a control group. However, there was still substantial overlapin values between the groups. Further, the correlation valuesbetween symptom severity and power were typically around0.4. This means that differences in frequency bands are notparticularly useful for diagnosis at an individual level. With thewide variation in the power spectrum across normal populations
8https://www.accessdata.fda.gov/cdrh_docs/reviews/K112711.pdf
Frontiers in Human Neuroscience | www.frontiersin.org 15 January 2019 | Volume 12 | Article 521

Newson and Thiagarajan Frequency Bands in Psychiatric Disorders
and the lifespan (Haegens et al., 2014; Voytek et al., 2015;Hashemi et al., 2016; Arazi et al., 2017a,b; Parameshwaranand Thiagarajan, 2017a,b,c), it would be essential to look atlarger sample sizes across multiple disorders, and with repeatedrecording sessions to control for both inter and intra personvariability and parse out relationships to particular symptoms.
That said, in our view, these results along with the associatedmethodological concerns and limitations call for a new approachthat goes beyond frequency bands to take into consideration newadvances in our understanding of the power spectrum and newtools available for analysis.
From Frequency Bands to IntegratedViews: A Way Forward?The Fourier transform which is used to describe the powerspectrum was invented as a method of resolving sinusoidsof different frequencies—an application of tremendous valuein radio transmission. The EEG however is not a simplesuperposition of sinusoids of various frequencies. The powerspectrum therefore should not be interpreted as such.
The dominant structure of the EEG power spectrum has beenshown to be a decreasing function with lower power at higherfrequencies that approximates a 1/fγ pattern (Pritchard, 1992;Voytek et al., 2015). This is seen at various levels from surfacemeasurements with microelectrodes (local field potentials orLFPs; Thiagarajan et al., 2010) and surface electrocorticographsor ECoG (Gao, 2016). The implication is that there is aninverse relationship between frequency and power across themeasurable range and as the frequency increases, the powerdecreases. The steepness with which the power drops off as thefrequency gets higher is represented by the exponent γ. This1/fγ structure has an important implication—that there is anunderlying relationship or temporal correlations between thefrequencies such that individual frequencies are not independentof one another (Milotti, 2002). We note however, that theorigin and mechanisms of this structure is still very mucha subject of debate as a frequency dependent filtering effectarising from the measurement cannot be ruled out (Bédardet al., 2006, 2017). Thus, if the spectrum best fits a 1/ffunction, the power of any individual frequency or range offrequency can be estimated if the exponent of the decay isknown.
That said, there can be deviations from the 1/f spectrum. Themost common such deviation are peaks that rises above the 1/fenvelope, particularly with the eyes closed. The harmonic around10 Hz (in the alpha range) is most commonly encountered,although it can sometimes occur at other frequencies and canbe visualized in the autocorrelation of the signal. The presenceof an alpha oscillation or harmonic peak is a feature that isdistinct from the underlying 1/f envelope and should thereforebe considered separately from the underlying envelope.
Specifically, we suggest reporting of metrics relating to thepower spectrum in its entirety and identifying ways of identifyingand separating periodicity from the 1/f background. There are anumber of ways in which this can be done. The most obviouslyuseful metric is estimation of the 1/f exponent γ (Voytek et al.,2015). This provides a consolidated view of the differences across
bands and can be used to compute the difference betweenany two frequencies if desired. The 1/f decay exponent is bestestimated in the range of 2–30 Hz where baseline drifts, linenoise and distortions introduced by band pass filters have theleast impact. Second, goodness of fit or other metrics that provideinsight into deviations from the 1/f structure would also beinformative. Recently new metrics have been proposed to providea view into the degree of periodicity in different bands (Halleret al., 2018) and the harmonic component of the alpha bandseparately from the background envelope (Parameshwaran andThiagarajan, 2017c). However, even while deeper views of thepower spectrum could potentially provide better discriminationbetween disorders, this does not negate the impact of a lackof standardization in EEG measurement and methods used forsignal preprocessing and computation of the power spectrumitself.
Beyond the Power SpectrumWhile there are ways to substantially improve our understandingof spectral properties in the context of psychiatric disorders, itis important to acknowledge that the power spectrum itself is avery general feature of the signal with few degrees of freedom.As we have seen it does not show significant difference acrossseveral disorders (autism, addiction, PTSD) and is not a reliablepredictor of outcomes on an individual level (as shown bysimilarities of change across multiple disorders). Thus, on itsown, it is not likely to provide fundamental discriminatory powerbetween disorder types. Spatial views such as spectral coherenceand hemispheric asymmetry can extend the scope of the spectralapproach. However, spectral decomposition and spectral filteringby definition disregard relative phase information which mayprovide important discriminatory perspective.
The power spectrum might be thought of as analogous todescribing a picture in terms of its color spectrum, or therelative distribution of red, blue and green pixels. While the colorspectrum of an image can provide some general suggestion of thecontent of a picture (for example, higher blue on average meansmore sky, an increase in green means more nature), it loses allthe relative spatial information that tells you what the pictureactually is. The EEG power spectrum similarly loses relativetemporal information, which at a more general level is one of themain advantages of EEG signal processing over other methodssuch as fMRI. Further, given that spectral decomposition is notinstantaneous and utilized blocks of signal, and spectral filteringcan distort the signal (Vanrullen, 2011; Acunzo et al., 2012;Rousselet, 2012; Widmann and Schröger, 2012), views such asspatial coherence are also limited in terms of their temporalresolution and insight into relative phase information. Usingthe same analogy of color, one might think of coherence, forexample, as analogous to comparing the spatial positions of pixelsin one narrow range of colors between successive image framesafter some spatial blurring, while disregarding all the others.
We therefore suggest that more discriminating insights intodifferences between disorders are likely to be found in metricsthat probe the temporal structure of the EEG signal as well asin novel connectivity measures. Numerous metrics have beenproposed including various methods of assessing the entropy of
Frontiers in Human Neuroscience | www.frontiersin.org 16 January 2019 | Volume 12 | Article 521

Newson and Thiagarajan Frequency Bands in Psychiatric Disorders
the signal (Sabeti et al., 2009; Liang et al., 2015) and temporalmemory (Jospin et al., 2007; Hardstone et al., 2012; Mártonet al., 2014). However, this is a continually evolving field wherenew analytical tools are regularly being trialed. These should beincreasingly embraced by EEG researchers involved in resting-state research who are looking to shift their approach away fromspectral bands towards other potential methods which may offergreater clinical opportunities, applying these tools to their futureand past datasets.
A Call for Data Sharing and SharableAnalytical PipelinesFinally, whether performing spectral analysis or exploringthe signal using other methodologies, the primary issues arecommon. First, a lack of standardization of preprocessingsteps and parameter choices within algorithms can result in adiversity of results that preclude easy comparison, and evenappear contradictory. Second, small datasets limit the ability todetermine meaningful results given the large diversity of humanEEG dynamics. Consequently, we call for a concerted effort bythe field to participate in open data efforts by sharing their rawdata, and for those with analytical toolkits and analysis pipelinesto make them available for the community. We emphasize theimportance of sharing raw rather than preprocessed data giventhe numerous differences in preprocessing methodologies. Wealso emphasize the need for providing clear descriptions of therecording parameters such as the referencing, sampling rate andelectrode characteristics.
While well-established databases specific for EEG are notyet available as they are for fMRI (e.g., openNeuro) someoptions presently exist and new ones are in development. For
example, data can be shared in public repositories such asthe National Institute of Mental Health Data Archive (NDA)9,Physionet10 and Zenodo11 or in the open EEG-specific databaseBrainbase which is presently in development (Thiagarajan,2017). Similarly, open toolkits such as EEGLAB (MATLAB)and MNE (Python) are already available but complete pipelinesare only now being established or are in development. In themeantime, tools can be shared on Github and other repositoriesand this should be made known through clear referencing inpublications.
AUTHOR CONTRIBUTIONS
JN performed the literature search and discussed the resultswith TT. TT drafted the manuscript. TT and JN revisedthe manuscript, approved the final version, and agreed to beaccountable for all aspects of the work.
FUNDING
This work was supported by internal funding from Sapien Labs.
SUPPLEMENTARY MATERIAL
The Supplementary Material for this article can be foundonline at: https://www.frontiersin.org/articles/10.3389/fnhum.2018.00521/full#supplementary-material
9https://data-archive.nimh.nih.gov/10https://www.physionet.org/11https://zenodo.org/
REFERENCES
Abramovitch, A., Dar, R., Mittelman, A., and Wilhelm, S. (2015). Comorbiditybetween attention deficit/hyperactivity disorder and obsessive-compulsivedisorder across the lifespan: a systematic and critical review. Harv. Rev.Psychiatry 23, 245–262. doi: 10.1097/HRP.0000000000000050
Achenbach, T. M., and Rescorla, L. A. (2001). Manual for the ASEBA School-AgeForms and Profiles: An Integrated System of Mult-Informant Assessment.Burlington: University of Vermont, Research Center for Children, Youth andFamilies.
Acunzo, D. J., MacKenzie, G., and van Rossum, M. C. W. (2012). Systematic biasesin early ERP and ERF components as a result of high-pass filtering. J. Neurosci.Methods 209, 212–218. doi: 10.1016/j.jneumeth.2012.06.011
Andreou, C., Nolte, G., Leicht, G., Polomac, N., Hanganu-Opatz, I. L.,Lambert, M., et al. (2015). Increased resting-state Gamma-band connectivity infirst-episode schizophrenia. Schizophr. Bull. 41, 930–939. doi: 10.1093/schbul/sbu121
Andrew, C., and Fein, G. (2010). Induced theta oscillations as biomarkersfor alcoholism. Clin. Neurophysiol. 121, 350–358. doi: 10.1016/j.clinph.2009.11.080
Arazi, A., Censor, N., and Dinstein, I. (2017a). Neural variability quenchingpredicts individual perceptual abilities. J. Neurosci. 37, 97–109. doi: 10.1523/JNEUROSCI.1671-16.2016
Arazi, A., Gonen-Yaacovi, G., and Dinstein, I. (2017b). The magnitude of trial-by-trial neural variability is reproducible over time and across tasks in humans.eneuro 4:ENEURO.0292-17.2017. doi: 10.1523/ENEURO.0292-17.2017
Arns, M., Conners, C. K., and Kraemer, H. C. (2013). A decade of EEG theta/Betaratio research in ADHD: a meta-analysis. J. Atten. Disord. 17, 374–383.doi: 10.1177/1087054712460087
Arns, M., Etkin, A., Hegerl, U., Williams, L. M., DeBattista, C., Palmer, D. M.,et al. (2015). Frontal and rostral anterior cingulate (rACC) theta EEG indepression: implications for treatment outcome? Eur. Neuropsychopharmacol.25, 1190–1200. doi: 10.1016/j.euroneuro.2015.03.007
Bandyopadhyaya, D., Nizamie, S. H., Pradhan, N., and Bandyopadhyaya, A.(2011). Spontaneous γ coherence as a possible trait marker ofschizophrenia—An explorative study. Asian J. Psychiatr. 4, 172–177.doi: 10.1016/j.ajp.2011.06.006
Baradits, M., Kakuszi, B., Bálint, S., Fullajtár, M., Mód, L., Bitter, I.,et al. (2018). Alterations in resting-state γ activity in patients withschizophrenia: a high-density EEG study. Eur. Arch. Psychiatry Clin. Neurosci.doi: 10.1007/s00406-018-0889-z [Epub ahead of print].
Barkley, R. A. (2011). Barkley Adult ADHD Rating Scale-IV (BAARS-IV).New York, NY: Guilford Press.
Barry, R. J., Clarke, A. R., Hajos, M., McCarthy, R., Selikowitz, M., andBruggemann, J. M. (2009a). Acute atomoxetine effects on the EEG ofchildren with Attention-Deficit/Hyperactivity Disorder. Neuropharmacology57, 702–707. doi: 10.1016/j.neuropharm.2009.08.003
Barry, R. J., Clarke, A. R., Johnstone, S. J., McCarthy, R., andSelikowitz, M. (2009b). Electroencephalogram θ/β ratio and arousalin attention-deficit/hyperactivity disorder: evidence of independentprocesses. Biol. Psychiatry 66, 398–401. doi: 10.1016/j.biopsych.2009.04.027
Barry, R. J., Clarke, A. R., Hajos, M., McCarthy, R., Selikowitz, M., andDupuy, F. E. (2010). Resting-state EEG gamma activity in children withAttention-Deficit/Hyperactivity Disorder. Clin. Neurophysiol. 121, 1871–1877.doi: 10.1016/j.clinph.2010.04.022
Barry, R. J., Clarke, A. R., and Johnstone, S. J. (2003). A review of electrophysiologyin attention-deficit/hyperactivity disorder: I. Qualitative and quantitative
Frontiers in Human Neuroscience | www.frontiersin.org 17 January 2019 | Volume 12 | Article 521

Newson and Thiagarajan Frequency Bands in Psychiatric Disorders
electroencephalography. Clin. Neurophysiol. 114, 171–183. doi: 10.1016/s1388-2457(02)00362-0
Basar, E., Güntekin, B., Atagün, I., Turp Gölbası, B., Tülay, E., andÖzerdem, A. (2012). Brain’s alpha activity is highly reduced in euthymicbipolar disorder patients. Cogn. Neurodyn. 6, 11–20. doi: 10.1007/s11571-011-9172-y
Bauer, L. (2001). Predicting relapse to alcohol and drug abuse viaquantitative electroencephalography. Neuropsychopharmacology 25, 332–340.doi: 10.1016/S0893-133X(01)00236-6
Bédard, C., Gomes, J.-M., Bal, T., and Destexhe, A. (2017). A framework toreconcile frequency scaling measurements, from intracellular recordings, local-field potentials, up to EEG and MEG signals. J. Integr. Neurosci. 16, 3–18.doi: 10.3233/JIN-160001
Bédard, C., Kröger, H., and Destexhe, A. (2006). Does the 1/f frequency scalingof brain signals reflect self-organized critical states? Phys. Rev. Lett. 97:118102.doi: 10.1103/PhysRevLett.97.118102
Begic, D., Hotujac, L., and Jokic-Begic, N. (2000). Quantitative EEG in‘‘positive’’ and ‘‘negative’’ schizophrenia. Acta Psychiatr. Scand. 101, 307–311.doi: 10.1111/j.1600-0447.2000.tb10930.x
Begic, D., Hotujac, L., and Jokic-Begic, N. (2001). Electroencephalographiccomparison of veterans with combat-related post-traumatic stress disorderand healthy subjects. Int. J. Psychophysiol. 40, 167–172. doi: 10.1016/s0167-8760(00)00153-7
Begic, D., Popovic-Knapic, V., Grubišin, J., Kosanovic-Rajacic, B., Filipcic, I.,Telarovic, I., et al. (2011). Quantitative electroencephalography inschizophrenia and depression. Psychiatr. Danub. 23, 355–362.
Bell, I. R., Schwartz, G. E., Hardin, E. E., Baldwin, C. M., and Kline, J. P.(1998). Differential resting quantitative electroencephalographic—patterns inwomen with environmental chemical intolerance, depressives and normals.Biol. Psychiatry 43, 376–388. doi: 10.1016/s0006-3223(97)00245-x
Berger, H. (1929). Über das elektrenkephalogramm des menschen. Arch. F.Psychiat. 87, 527–570. doi: 10.1007/BF01797193
Blake, D. D., Weathers, F. W., Nagy, L. M., Kaloupek, D. G., Gusman, F. D.,Charney, D. S., et al. (1995). The development of a clinician-administeredPTSD scale. J. Trauma. Stress 8, 75–90. doi: 10.1002/jts.2490080106
Bresnahan, S. M., and Barry, R. J. (2002). Specificity of quantitative EEG analysisin adults with attention deficit hyperactivity disorder. Psychiatry Res. 112,133–144. doi: 10.1016/s0165-1781(02)00190-7
Bresnahan, S. M., Anderson, J. W., and Barry, R. J. (1999). Age-related changes inquantitative EEG in attention- deficit/hyperactivity disorder. Biol. Psychiatry46, 1690–1697. doi: 10.1016/s0006-3223(99)00042-6
Bresnahan, S. M., Barry, R. J., Clarke, A. R., and Johnstone, S. J. (2006).Quantitative EEG analysis in dexamphetamine-responsive adults withattention-deficit/hyperactivity disorder. Psychiatry Res. 141, 151–159.doi: 10.1016/j.psychres.2005.09.002
Bruder, G. E., Fong, R., Tenke, C. E., Leite, P., Towey, J. P., Stewart, J. E., et al.(1997). Regional brain asymmetries in major depression with or without ananxiety disorder: a quantitative electroencephalographic study. Biol. Psychiatry41, 939–948. doi: 10.1016/S0006-3223(96)00260-0
Bruder, G. E., Sedoruk, J. P., Stewart, J. W., McGrath, P. J., Quitkin, F. M.,and Tenke, C. E. (2008). Electroencephalographic alpha measures predicttherapeutic response to a selective serotonin reuptake inhibitor antidepressant:pre- and post-treatment findings. Biol. Psychiatry 63, 1171–1177. doi: 10.1016/j.biopsych.2007.10.009
Bucci, P., Mucci, A., Volpe, U., Merlotti, E., Galderisi, S., and Maj, M. (2004).Executive hypercontrol in obsessive-compulsive disorder: electrophysiologicaland neuropsychological indices. Clin. Neurophysiol. 115, 1340–1348.doi: 10.1016/j.clinph.2003.12.031
Burnette, C. P., Henderson, H. A., Inge, A. P., Zahka, N. E., Schwartz, C. B.,and Mundy, P. C. (2011). Anterior EEG asymmetry and the modifier modelof autism. J. Autism Dev. Disord. 41, 1113–1124. doi: 10.1007/s10803-010-1138-0
Buyck, I., and Wiersema, J. R. (2014a). Resting electroencephalogram in attentiondeficit hyperactivity disorder: developmental course and diagnostic value.Psychiatry Res. 216, 391–397. doi: 10.1016/j.psychres.2013.12.055
Buyck, I., and Wiersema, J. R. (2014b). State-related electroencephalographicdeviances in attention deficit hyperactivity disorder. Res. Dev. Disabil. 35,3217–3225. doi: 10.1016/j.ridd.2014.08.003
Buyck, I., and Wiersema, J. R. (2015). Electroencephalographic activity before andafter cognitive effort in children with attention deficit/hyperactivity disorder.Clin. EEG Neurosci. 46, 88–93. doi: 10.1177/1550059414553244
Chan, A. S., and Leung, W. W. M. (2006). Differentiating autistic children withquantitative encephalography: a 3-month longitudinal study. J. Child Neurol.21, 391–399. doi: 10.1177/08830738060210050501
Chan, A. S., Sze, S. L., and Cheung, M.-C. (2007). Quantitativeelectroencephalographic profiles for children with autistic spectrum disorder.Neuropsychology 21, 74–81. doi: 10.1037/0894-4105.21.1.74
Choi, J.-S., Park, S. M., Lee, J., Hwang, J. Y., Jung, H. Y., Choi, S.-W., et al.(2013). Resting-state beta and gamma activity in Internet addiction. Int.J. Psychophysiol. 89, 328–333. doi: 10.1016/j.ijpsycho.2013.06.007
Clancy, K., Ding, M., Bernat, E., Schmidt, N. B., and Li, W. (2017). Restless‘rest’: intrinsic sensory hyperactivity and disinhibition in post-traumatic stressdisorder. Brain 140, 2041–2050. doi: 10.1093/brain/awx116
Clarke, A. R., Barry, R. J., Baker, I. E., McCarthy, R., and Selikowitz, M.(2016). An investigation of stimulant effects on the EEG of children withattention-deficit/hyperactivity disorder. Clin. EEG Neurosci. 48, 235–242.doi: 10.1177/1550059416664657
Clarke, A., Barry, R., Bond, D., McCarthy, R., and Selikowitz, M. (2002a).Effects of stimulant medications on the EEG of children with attention-deficit/hyperactivity disorder. Psychopharmacology 164, 277–284.doi: 10.1007/s00213-002-1205-0
Clarke, A. R., Barry, R. J., McCarthy, R., and Selikowitz, M. (2002b). Children withattention-deficit/hyperactivity disorder and comorbid oppositional defiantdisorder: an EEG analysis. Psychiatry Res. 111, 181–190. doi: 10.1016/s0165-1781(02)00137-3
Clarke, A. R., Barry, R. J., McCarthy, R., and Selikowitz, M. (2002c). EEG analysisof children with attention-deficit/hyperactivity disorder and comorbid readingdisabilities. J. Learn. Disabil. 35, 276–285. doi: 10.1177/002221940203500309
Clarke, A. R., Barry, R. J., McCarthy, R., and Selikowitz, M. (2002d). EEGdifferences between good and poor responders to methylphenidate anddexamphetamine in children with attention-deficit/hyperactivity disorder.Clinical Neurophysiol. 113, 194–205. doi: 10.1016/s1388-2457(01)00736-2
Clarke, A., Barry, R. J., McCarthy, R., Selikowitz, M., and Brown, C. R.(2002e). EEG evidence for a new conceptualisation of attention deficithyperactivity disorder. Clin. Neurophysiol. 113, 1036–1044. doi: 10.1016/s1388-2457(02)00115-3
Clarke, A. R., Barry, R. J., McCarthy, R., Selikowitz, M., and Croft, R. J. (2002f).EEG differences between good and poor responders to methylphenidate in boyswith the inattentive type of attention-deficit/hyperactivity disorder. ClinicalNeurophysiol. 113, 1191–1198. doi: 10.1016/s1388-2457(02)00147-5
Clarke, A., Barry, R., Dupuy, F., McCarthy, R., Selikowitz, M., and Johnstone, S.(2013). Excess beta activity in the EEG of children with attention-deficit/hyperactivity disorder: a disorder of arousal? Int. J. Psychophysiol. 89,314–319. doi: 10.1016/j.ijpsycho.2013.04.009
Clarke, A. R., Barry, R. J., Dupuy, F. E., McCarthy, R., Selikowitz, M., andHeaven, P. C. L. (2011). Childhood EEG as a predictor of adult attention-deficit/hyperactivity disorder. Clin. Neurophysiol. 122, 73–80. doi: 10.1016/j.clinph.2010.05.032
Clarke, A. R., Barry, R. J., Heaven, P. C. L., McCarthy, R., Selikowitz, M., andByrne, M. K. (2008a). EEG in adults with Attention-Deficit/HyperactivityDisorder. Int. J. Psychophysiol. 70, 176–183. doi: 10.1016/j.ijpsycho.2008.07.001
Clarke, A. R., Barry, R. J., McCarthy, R., Selikowitz, M., and Johnstone, S. J.(2008b). Effects of imipramine hydrochloride on the EEG of childrenwith Attention-Deficit/Hyperactivity Disorder who are non-responsive tostimulants. Int. J. Psychophysiol. 68, 186–192. doi: 10.1016/j.ijpsycho.2008.01.007
Clarke, A. R., Barry, R. J., McCarthy, R., and Selikowitz, M. (1998). EEG analysis inAttention-deficit/Hyperactivity Disorder: a comparative study of two subtypes.Psychiatry Res. 81, 19–29. doi: 10.1016/s0165-1781(98)00072-9
Clarke, A. R., Barry, R. J., McCarthy, R., and Selikowitz, M. (2001a). Age and sexeffects in the EEG: differences in two subtypes of attention-deficit/hyperactivitydisorder. Clin. Neurophysiol. 112, 815–826. doi: 10.1016/s1388-2457(01)00487-4
Clarke, A. R., Barry, R. J., McCarthy, R., and Selikowitz, M. (2001b). EEG-defined subtypes of children with attention-deficit/hyperactivity disorder. Clin.Neurophysiol. 112, 2098–2105. doi: 10.1016/s1388-2457(01)00668-x
Frontiers in Human Neuroscience | www.frontiersin.org 18 January 2019 | Volume 12 | Article 521

Newson and Thiagarajan Frequency Bands in Psychiatric Disorders
Clarke, A. R., Barry, R. J., McCarthy, R., and Selikowitz, M. (2001c).Electroencephalogram differences in two subtypes of Attention-Deficit/Hyperactivity Disorder. Psychophysiology 38, 212–221. doi: 10.1111/1469-8986.3820212
Clarke, A. R., Barry, R. J., McCarthy, R., and Selikowitz, M. (2001d). Excess betaactivity in children with attention-deficit/hyperactivity disorder: an atypicalelectrophysiological group. Psychiatry Res. 103, 205–218. doi: 10.1016/s0165-1781(01)00277-3
Clarke, A. R., Barry, R. J., McCarthy, R., Selikowitz, M., Clarke, D. C., andCroft, R. J. (2003). EEG activity in girls with attention-deficit/hyperactivitydisorder. Clin. Neurophysiol. 114, 319–328. doi: 10.1016/s1388-2457(02)00364-4
Clarke, A. R., Barry, R. J., McCarthy, R., Selikowitz, M., and Johnstone, S. J.(2007). Effects of stimulant medications on the EEG of girls withAttention-Deficit/Hyperactivity Disorder. Clin. Neurophysiol. 118, 2700–2708.doi: 10.1016/j.clinph.2007.08.020
Clarke, A. R., Barry, R. J., McCarthy, R., Selikowitz, M., Magee, C. A.,Johnstone, S. J., et al. (2006). Quantitative EEG in low-IQ children withattention-deficit/hyperactivity disorder. Clin. Neurophysiol. 117, 1708–1714.doi: 10.1016/j.clinph.2006.04.015
Clementz, B. A., Sponheim, S. R., Iacono, W. G., and Beiser, M. (1994). RestingEEG in first-episode schizophrenia patients, bipolar psychosis patients andtheir first-degree relatives. Psychophysiology 31, 486–494. doi: 10.1111/j.1469-8986.1994.tb01052.x
Coben, R., Clarke, A. R., Hudspeth, W., and Barry, R. J. (2008). EEG power andcoherence in autistic spectrum disorder. Clin. Neurophysiol. 119, 1002–1009.doi: 10.1016/j.clinph.2008.01.013
Conners, C. K., Sitarenios, G., and Parker, J. D. (1998). The revised conners’parent rating scale (CPRS-R): factor structure, reliability, and criterion Validity.J. Abnorm. Child Psychol. 26, 257–268. doi: 10.1023/A:1022602400621
Conners, C. K. E., and Sparrow, M. A. (1999). Conners’ Adult ADHD Rating Scales(CAARS). New York, NY: Multihealth Systems, Inc.
Cook, I. A., Hunter, A. M., Korb, A. S., and Leuchter, A. F. (2014). Do prefrontalmidline electrodes provide unique neurophysiologic information in MajorDepressive Disorder? J. Psychiatr. Res. 53, 69–75. doi: 10.1016/j.jpsychires.2014.01.018
Cunill, R., Castells, X., and Simeon, D. (2009). Relationships between obsessive-compulsive symptomatology and severity of psychosis in schizophrenia:a systematic review and meta-analysis. J. Clin. Psychiatry 70, 70–82.doi: 10.4088/jcp.07r03618
Dawson, G., Klinger, L. G., Panagiotides, H., Lewy, A., and Castelloe, P.(1995). Subgroups of autistic children based on social behavior displaydistinct patterns of brain activity. J. Abnorm. Child Psychol. 23, 569–583.doi: 10.1007/bf01447662
de Carvalho, M. R., Velasques, B. B., Freire, R. C., Cagy, M., Marques, J. B.,Teixeira, S., et al. (2015). Frontal cortex absolute beta power measurementin Panic Disorder with Agoraphobia patients. J. Affect. Disord. 184, 176–181.doi: 10.1016/j.jad.2015.05.055
Debener, S., Beauducel, A., Nessler, D., Brocke, B., Heilemann, H., and Kayser, J.(2000). Is resting anterior EEG 003B1 asymmetry a trait marker for depression?Neuropsychobiology 41, 31–37. doi: 10.1159/000026630
Deldin, P. J., and Chiu, P. (2005). Cognitive restructuring and EEG inmajor depression. Biol. Psychol. 70, 141–151. doi: 10.1016/j.biopsycho.2005.01.003
Dupuy, F. E., Clarke, A. R., Barry, R. J., McCarthy, R., and Selikowitz, M.(2014a). EEG differences between the combined and inattentive types ofattention-deficit/hyperactivity disorder in girls: a further investigation. Clin.EEG Neurosci. 45, 231–237. doi: 10.1177/1550059413501162
Dupuy, F. E., Clarke, A. R., Barry, R. J., Selikowitz, M., and McCarthy, R. (2014b).EEG and electrodermal activity in girls with Attention-Deficit/HyperactivityDisorder. Clin. Neurophysiol. 125, 491–499. doi: 10.1016/j.clinph.2013.09.007
Dupuy, F. E., Barry, R. J., Clarke, A. R., McCarthy, R., and Selikowitz, M. (2013).Sex differences between the combined and inattentive types of attention-deficit/hyperactivity disorder: an EEG perspective. Int. J. Psychophysiol. 89,320–327. doi: 10.1016/j.ijpsycho.2013.04.004
Dupuy, F. E., Clarke, A. R., Barry, R. J., McCarthy, R., and Selikowitz, M. (2011).Girls with attention-deficit/hyperactivity disorder: EEG differences between
DSM-IV types. Clin. EEG Neurosci. 42, 1–5. doi: 10.1177/155005941104200104
Dustman, R. E., Boswell, R. S., and Porter, P. B. (1962). Beta brain wavesas an index of alertness. Science 137, 533–534. doi: 10.1126/science.137.3529.533
Ehlers, C. L., Hurst, S., Phillips, E., Gilder, D. A., Dixon, M., Gross, A., et al.(2006). Electrophysiological responses to affective stimuli in american indiansexperiencing trauma with and without PTSD. Ann. N Y Acad. Sci. 1071,125–136. doi: 10.1196/annals.1364.011
El-Badri, S. M., Ashton, C. H., Moore, P. B., Marsh, V. R., and Ferrier, I. N. (2001).Electrophysiological and cognitive function in young euthymic patients withbipolar affective disorder. Bipolar Disord. 3, 79–87. doi: 10.1034/j.1399-5618.2001.030206.x
Falconer, E. M., Felmingham, K. L., Allen, A., Clark, C. R., McFarlane, A. C.,Williams, L. M., et al. (2008). Developing an integrated brain, behavior andbiological response profile in posttraumatic stress disorder (PTSD). J. Integr.Neurosci. 7, 439–456. doi: 10.1142/s0219635208001873
Fein, G., and Allen, J. (2006). EEG spectral changes in treatment-naive, activelydrinking alcoholics. Alcohol. Clin. Exp. Res. 29, 538–546. doi: 10.1097/01.alc.0000159107.08471.97
Fonseca, L. C., Tedrus, G. M., Bianchini, M. C., and Silva, T. F. (2013).Electroencephalographic α reactivity on opening the eyes in children withattention-deficit hyperactivity disorder. Clin. EEG Neurosci. 44, 53–57.doi: 10.1177/1550059412445659
Fonseca, L. C., Tedrus, G. M. A. S., de Moraes, C., de Vicente Machado, A.,de Almeida, M. P., and de Oliveira, D. O. F. (2008). Epileptiform abnormalitiesand quantitative EEG in children with attention-deficit/hyperactivitydisorder. Arquivos de Neuro-Psiquiatria 66, 462–467. doi: 10.1590/s0004-282x2008000400004
Foxe, J. J., Morie, K. P., Laud, P. J., Rowson, M. J., de Bruin, E. A., and Kelly, S.P. (2012). Assessing the effects of caffeine and theanine on the maintenance ofvigilance during a sustained attention task. Neuropharmacology 62, 2320–2327.doi: 10.1016/j.neuropharm.2012.01.020
Gao, R. (2016). Interpreting the electrophysiological power spectrum.J. Neurophysiol. 115, 628–630. doi: 10.1152/jn.00722.2015
Garakh, Z., Zaytseva, Y., Kapranova, A., Fiala, O., Horacek, J., Shmukler, A.,et al. (2015). EEG correlates of a mental arithmetic task in patients with firstepisode schizophrenia and schizoaffective disorder. Clin. Neurophysiol. 126,2090–2098. doi: 10.1016/j.clinph.2014.12.031
Giertuga, K., Zakrzewska, M. Z., Bielecki, M., Racicka-Pawlukiewicz, E.,Kossut, M., and Cybulska-Klosowicz, A. (2017). Age-related changes inresting-state EEG activity in attention deficit/hyperactivity disorder: a cross-sectional study. Front. Hum. Neurosci. 11:285. doi: 10.3389/fnhum.2017.00285
Gloss, D., Varma, J. K., Pringsheim, T., and Nuwer, M. R. (2016). Practiceadvisory: the utility of EEG theta/beta power ratio in ADHD diagnosis:report of the guideline development, dissemination, and implementationsubcommittee of the american academy of neurology. Neurology 87,2375–2379. doi: 10.1212/WNL.0000000000003265
Goldstein, M. R., Peterson, M. J., Sanguinetti, J. L., Tononi, G., and Ferrarelli, F.(2015). Topographic deficits in α-range resting EEG activity and steadystate visual evoked responses in schizophrenia. Schizophr. Res. 168, 145–152.doi: 10.1016/j.schres.2015.06.012
Gonen-Yaacovi, G., Arazi, A., Shahar, N., Karmon, A., Haar, S., Meiran, N.,et al. (2016). Increased ongoing neural variability in ADHD. Cortex 81, 50–63.doi: 10.1016/j.cortex.2016.04.010
Goodman, W. K., Price, L. H., Rasmussen, S. A., Mazure, C., Fleischmann, R. L.,Hill, C. L., et al. (1989). The yale-brown obsessive compulsive scale: I.development, use, and reliability. Arch. Gen. Psychiatry 46, 1006–1011.doi: 10.1001/archpsyc.1989.01810110048007
Gordeev, S. A. (2008). Clinical-psychophysiological studies of patients with panicattacks with and without agoraphobic disorders. Neurosci. Behav. Physiol. 38,633–637. doi: 10.1007/s11055-008-9016-3
Grin-Yatsenko, V. A., Baas, I., Ponomarev, V. A., and Kropotov, J. D. (2009). EEGpower spectra at early stages of depressive disorders. J. Clin. Neurophysiol. 26,401–406. doi: 10.1097/WNP.0b013e3181c298fe
Günther, W., Müller, N., Knesewitsch, P., Haag, C., Trapp, W., Banquet, J.-P., et al.(1997). Functional EEG mapping and SPECT in detoxified male alcoholics.
Frontiers in Human Neuroscience | www.frontiersin.org 19 January 2019 | Volume 12 | Article 521

Newson and Thiagarajan Frequency Bands in Psychiatric Disorders
Eur. Arch. Psychiatry Clin. Neurosci. 247, 128–136. doi: 10.1007/bf03033066
Haegens, S., Cousijn, H., Wallis, G., Harrison, P. J., and Nobre, A. C. (2014). Inter-and intra-individual variability in alpha peak frequency. Neuroimage 92, 46–55.doi: 10.1016/j.neuroimage.2014.01.049
Hagemann, D., Hewig, J., Walter, C., and Naumann, E. (2008). Skull thicknessand magnitude of EEG alpha activity. Clin. Neurophysiol. 119, 1271–1280.doi: 10.1016/j.clinph.2008.02.010
Haller, M., Donoghue, T., Peterson, E., Varma, P., Sebastian, P., Gao, R.,et al. (2018). Parameterizing neural power spectra. bioRxiv [Preprint].doi: 10.1101/299859
Hamilton, M. (1960). A rating scale for depression. J. Neurol. Neurosurg. Psychiatry23:56. doi: 10.1136/jnnp.23.1.56
Hanslmayr, S., Backes, H., Straub, S., Popov, T., Langguth, B., Hajak, G., et al.(2013). Enhanced resting-state oscillations in schizophrenia are associatedwith decreased synchronization during inattentional blindness: schizophreniaand abnormal resting-state activity. Hum. Brain Mapp. 34, 2266–2275.doi: 10.1002/hbm.22064
Hardstone, R., Poil, S.-S., Schiavone, G., Jansen, R., Nikulin, V., Mansvelder, H.,et al. (2012). Detrended fluctuation analysis: a scale-free view on neuronaloscillations. Front. Physiol. 3:450. doi: 10.3389/fphys.2012.00450
Harris, A. W. F., Bahramali, H., Slewa-Younan, S., Gordon, E., Williams, L.,and Li, W. M. (2001). The topography of quantified electroencephalographyin three syndromes of schizophrenia. Int. J. Neurosci. 107, 265–278.doi: 10.3109/00207450109150689
Harris, A., Melkonian, D., Williams, L., and Gordon, E. (2006). Dynamic spectralanalysis findings in first episode and chronic schizophrenia. Int. J. Neurosci.116, 223–246. doi: 10.1080/00207450500402977
Hashemi, A., Pino, L. J., Moffat, G., Mathewson, K. J., Aimone, C., Bennett, P. J.,et al. (2016). Characterizing population EEG dynamics throughoutadulthood. eNeuro 3:ENEURO.0275-16.2016. doi: 10.1523/ENEURO.0275-16.2016
Hermens, D. F., Kohn, M. R., Clarke, S. D., Gordon, E., and Williams, L. M.(2005a). Sex differences in adolescent ADHD: findings from concurrent EEGand EDA. Clin. Neurophysiol. 116, 1455–1463. doi: 10.1016/j.clinph.2005.02.012
Hermens, D. F., Soei, E. X. C., Clarke, S. D., Kohn, M. R., Gordon, E.,and Williams, L. M. (2005b). Resting EEG theta activity predicts cognitiveperformance in attention-deficit hyperactivity disorder. Pediatr. Neurol. 32,248–256. doi: 10.1016/j.pediatrneurol.2004.11.009
Hermens, D. F., Williams, L. M., Clarke, S., Kohn, M., Cooper, N., and Gordon, E.(2005c). Responses to methylphenidate in adolescent AD/HD: evidence fromconcurrently recorded autonomic (EDA) and central (EEG and ERP) measures.Int. J. Psychophysiol. 58, 21–33. doi: 10.1016/j.ijpsycho.2005.03.006
Hermens, D. F., Williams, L. M., Lazzaro, I., Whitmont, S., Melkonian, D., andGordon, E. (2004). Sex differences in adult ADHD: a double dissociation inbrain activity and autonomic arousal. Biol. Psychol. 66, 221–233. doi: 10.1016/j.biopsycho.2003.10.006
Herrera-Díaz, A., Mendoza-Quiiñones, R., Melie-Garcia, L., Martínez-Montes, E.,Sanabria-Diaz, G., Romero-Quintana, Y., et al. (2016). Functional connectivityand quantitative EEG in women with alcohol use disorders: a resting-statestudy. Brain Topogr. 29, 368–381. doi: 10.1007/s10548-015-0467-x
Hoagland, H., Cameron, D. E., and Rubin, M. A. (1937a). The ‘‘delta index’’ ofthe electrencephalogram in relation to insulin treatments of Schizophrenia.Psychol. Rec. 1, 196–202.doi: 10.1007/bf03393201
Hoagland, H., Rubin, M. A., and Cameron, D. E. (1937b). Electrical brainwaves in schizophrenics during insulin treatments. J. Psychol. 3, 513–519.doi: 10.1080/00223980.1937.9917518
Hobbs, M. J., Clarke, A. R., Barry, R. J., McCarthy, R., and Selikowitz, M. (2007).EEG abnormalities in adolescent males with AD/HD. Clin. Neurophysiol. 118,363–371. doi: 10.1016/j.clinph.2006.10.013
Hong, L. E., Summerfelt, A., Mitchell, B. D., O’Donnell, P., and Thaker, G.K. (2012). A shared low-frequency oscillatory rhythm abnormality in restingand sensory gating in schizophrenia. Clin. Neurophysiol. 123, 285–292.doi: 10.1016/j.clinph.2011.07.025
Huang, Y., Zhang, J., Cui, Y., Yang, G., He, L., Liu, Q., et al. (2017). How differentEEG references influence sensor level functional connectivity graphs. Front.Neurosci. 11:368. doi: 10.3389/fnins.2017.00368
Ieong, H. F.-H., and Yuan, Z. (2017). Resting-state neuroimaging andneuropsychological findings in opioid use disorder during abstinence:a review. Front. Hum. Neurosci. 11:169. doi: 10.3389/fnhum.2017.00169
Imperatori, C., Farina, B., Quintiliani, M. I., Onofri, A., Castelli Gattinara, P.,Lepore, M., et al. (2014). Aberrant EEG functional connectivity and EEG powerspectra in resting state post-traumatic stress disorder: a sLORETA study. Biol.Psychol. 102, 10–17. doi: 10.1016/j.biopsycho.2014.07.011
Islam, M. K., Rastegarnia, A., and Yang, Z. (2016). Methods for artifact detectionand removal from scalp EEG: a review. Neurophysiol. Clin. 46, 287–305.doi: 10.1016/j.neucli.2016.07.002
Itoh, T., Sumiyoshi, T., Higuchi, Y., Suzuki, M., and Kawasaki, Y. (2011).LORETA analysis of three-dimensional distribution of delta band activity inschizophrenia: relation to negative symptoms. Neurosci. Res. 70, 442–448.doi: 10.1016/j.neures.2011.05.003
Jaime, M., McMahon, C. M., Davidson, B. C., Newell, L. C., Mundy, P. C.,and Henderson, H. A. (2016). Brief report: reduced temporal-central EEGalpha coherence during joint attention perception in adolescents with autismspectrum disorder. J. Autism Dev. Disord. 46, 1477–1489. doi: 10.1007/s10803-015-2667-3
Jarrett, M., Gable, P., Rondon, A., Neal, L., Price, L., and Hilton, D. (2017). AnEEG study of children with and without ADHD symptoms: between-groupdifferences and associations with sluggish cognitive tempo symptoms. J. Atten.Disord. doi: 10.1177/1087054717723986 [Epub ahead of print].
Jasper, H. H., and Andrews, H. L. (1936). Human brain rhythms: I.Recording techniques and preliminary results. J. Gen. Psychol. 14, 98–126.doi: 10.1080/00221309.1936.9713141
Jaworska, N., Blier, P., Fusee, W., and Knott, V. (2012). Alpha power, alphaasymmetry and anterior cingulate cortex activity in depressed males andfemales. J. Psychiatr. Res. 46, 1483–1491. doi: 10.1016/j.jpsychires.2012.08.003
Jeste, S. S., Frohlich, J., and Loo, S. K. (2015). Electrophysiological biomarkers ofdiagnosis and outcome in neurodevelopmental disorders. Curr. Opin. Neurol.28, 110–116. doi: 10.1097/WCO.0000000000000181
John, J. P., Rangaswamy, M., Thennarasu, K., Khanna, S., Nagaraj, R. B.,Mukundan, C. R., et al. (2009). EEG power spectra differentiate positiveand negative subgroups in neuroleptic-naive schizophrenia patients.J. Neuropsychiatry Clin. Neurosci. 21, 160–172. doi: 10.1176/appi.neuropsych.21.2.160
Jokic-Begic, N., and Begic, D. (2003). Quantitative electroencephalogram (qEEG)in combat veterans with post-traumatic stress disorder (PTSD). Nord.J. Psychiatry 57, 351–355. doi: 10.1080/08039480310002688
Jospin, M., Caminal, P., Jensen, E. W., Litvan, H., Vallverdü, M.,Struys, M. M. R. F., et al. (2007). Detrended fluctuation analysis of EEGas a measure of depth of anesthesia. IEEE Trans. Biomed. Eng. 54, 840–846.doi: 10.1109/tbme.2007.893453
Jung, T.-P., Makeig, S., Humphries, C., Lee, T.-W., McKeown, M. J.,Iragui, V., et al. (2003). Removing electroencephalographic artifacts by blindsource separation. Psychophysiology 37, 163–178. doi: 10.1111/1469-8986.3720163
Kaiser, A. K., Gnjezda, M. T., Knasmüller, S., and Aichhorn, W. (2018).Electroencephalogram alpha asymmetry in patients with depressivedisorders: current perspectives. Neuropsychiatr. Dis. Treat. 14, 1493–1504.doi: 10.2147/NDT.S137776
Kam, J. W. Y., Bolbecker, A. R., O’Donnell, B. F., Hetrick, W. P., and Brenner, C. A.(2013). Resting state EEG power and coherence abnormalities in bipolardisorder and schizophrenia. J. Psychiatr. Res. 47, 1893–1901. doi: 10.1016/j.jpsychires.2013.09.009
Kamaradova, D., Prasko, J., Taborsky, J., Grambal, A., Latalova, K., Hajda, M.,et al. (2016). Cognitive deficits in patients with obsessive–compulsivedisorder–electroencephalography correlates. Neuropsychiatr. Dis. Treat. 12,1119–1125. doi: 10.2147/NDT.S93040
Kamida, A., Shimabayashi, K., Oguri, M., Takamori, T., Ueda, N., Koyanagi, Y.,et al. (2016). EEG power spectrum analysis in children with ADHD. YonagoActa Med. 59, 169–173.
Karadag, F., Oguzhanoglu, N. K., Kurt, T., Oguzhanoglu, A., Atesci, F., andöZdel, O. (2003). Quantitative EEG analysis in obsessive compulsivedisorder. Int. J. Neurosci. 113, 833–847. doi: 10.1080/00207450390200963
Frontiers in Human Neuroscience | www.frontiersin.org 20 January 2019 | Volume 12 | Article 521

Newson and Thiagarajan Frequency Bands in Psychiatric Disorders
Kay, S. R., Fiszbein, A., and Opler, L. A. (1987). The positive and negativesyndrome scale (PANSS) for schizophrenia. Schizophr. Bull. 13, 261–276.doi: 10.1093/schbul/13.2.261
Keil, A., Debener, S., Gratton, G., Junghöfer, M., Kappenman, E. S., Luck, S. J.,et al. (2013). Committee report: publication guidelines and recommendationsfor studies using electroencephalography and magnetoencephalography.Psychophysiology 51, 1–21. doi: 10.1111/psyp.12147
Kelly, S. P., Gomez-Ramirez, M., Montesi, J. L., and Foxe, J. J. (2008). L-theanineand caffeine in combination affect human cognition as evidenced by oscillatoryα-band activity and attention task performance. J. Nutr. 138, 1572S–1577S.doi: 10.1093/jn/138.8.1572S
Kemp, A. H., Griffiths, K., Felmingham, K. L., Shankman, S. A., Drinkenburg, W.,Arns, M., et al. (2010). Disorder specificity despite comorbidity: resting EEGα asymmetry in major depressive disorder and post-traumatic stress disorder.Biol. Psychol. 85, 350–354. doi: 10.1016/j.biopsycho.2010.08.001
Kim, J. W., Kim, B.-N., Lee, J., Na, C., Kee, B. S., Min, K. J., et al. (2016).Desynchronization of theta-phase gamma-amplitude coupling during a mentalarithmetic task in children with attention deficit/hyperactivity disorder. PLoSOne 11:e0145288. doi: 10.1371/journal.pone.0145288
Kim, J. W., Lee, Y. S., Han, D. H., Min, K. J., Lee, J., and Lee, K. (2015). Diagnosticutility of quantitative EEG in un-medicated schizophrenia. Neurosci. Lett. 589,126–131. doi: 10.1016/j.neulet.2014.12.064
Kim, Y. J., Lee, J.-Y., Oh, S., Park, M., Jung, H. Y., Sohn, B. K., et al. (2017).Associations between prospective symptom changes and slow-wave activity inpatients with Internet gaming disorder: a resting-state EEG study. Medicine96:e6178. doi: 10.1097/MD.0000000000006178
Kirino, E. (2004). Correlation between P300 and EEG rhythm in schizophrenia.Clin. EEG Neurosci. 35, 137–146. doi: 10.1177/155005940403500306
Kirino, E. (2007). Mismatch negativity correlates with delta and thetaEEG power in schizophrenia. Int. J. Neurosci. 117, 1257–1279.doi: 10.1080/00207450600936635
Kitsune, G. L., Cheung, C. H. M., Brandeis, D., Banaschewski, T., Asherson, P.,McLoughlin, G., et al. (2015). A matter of time: the influence of recordingcontext on EEG spectral power in adolescents and young adults with ADHD.Brain Topogr. 28, 580–590. doi: 10.1007/s10548-014-0395-1
Knott, V. J., Bakish, D., Lusk, S., Barkely, J., and Perugini, M. (1996). QuantitativeEEG correlates of panic disorder. Psychiatry Res. 68, 31–39. doi: 10.1016/s0925-4927(96)02962-9
Knott, V., Labelle, A., Jones, B., and Mahoney, C. (2001a). Quantitative EEGin schizophrenia and in response to acute and chronic clozapine treatment.Schizophr. Res. 50, 41–53. doi: 10.1016/s0920-9964(00)00165-1
Knott, V., Mahoney, C., Kennedy, S., and Evans, K. (2001b). EEG power,frequency, asymmetry and coherence in male depression. Psychiatry Res. 106,123–140. doi: 10.1016/s0925-4927(00)00080-9
Knyazeva, M. G., Jalili, M., Meuli, R., Hasler, M., De Feo, O., and Do, K. Q. (2008).Alpha rhythm and hypofrontality in schizophrenia. Acta Psychiatr. Scand. 118,188–199. doi: 10.1111/j.1600-0447.2008.01227.x
Koehler, S., Lauer, P., Schreppel, T., Jacob, C., Heine, M., Boreatti-Hümmer, A.,et al. (2009). Increased EEG power density in alpha and theta bands in adultADHD patients. J. Neural Transm. 116, 97–104. doi: 10.1007/s00702-008-0157-x
Koprivová, J., Congedo, M., Horácek, J., Praško, J., Raszka, M., Brunovský, M.,et al. (2011). EEG source analysis in obsessive-compulsive disorder. Clin.Neurophysiol. 122, 1735–1743. doi: 10.1016/j.clinph.2011.01.051
Koprivová, J., Horácek, J., Raszka, M., Brunovský, M., and Praško, J.(2013). Standardized low-resolution electromagnetic tomography in obsessive-compulsive disorder—a replication study. Neurosci. Lett. 548, 185–189.doi: 10.1016/j.neulet.2013.05.015
Korb, A. S., Cook, I. A., Hunter, A. M., and Leuchter, A. F. (2008). Brain electricalsource differences between depressed subjects and healthy controls. BrainTopogr. 21, 138–146. doi: 10.1007/s10548-008-0070-5
Korucuoglu, O., Gladwin, T. E., and Wiers, R. W. (2016). The effect of acutealcohol on motor-related EEG asymmetries during preparation of approachor avoid alcohol responses. Biol. Psychol. 114, 81–92. doi: 10.1016/j.biopsycho.2015.12.012
Kozhushko, N. J., Nagornova, Z. V., Evdokimov, S. A., Shemyakina, N. V.,Ponomarev, V. A., Tereshchenko, E. P., et al. (2018). Specificity of spontaneousEEG associated with different levels of cognitive and communicative
dysfunctions in children. Int. J. Psychophysiol. 128, 22–30. doi: 10.1016/j.ijpsycho.2018.03.013
Kuperman, S., Johnson, B., Arndt, S., Lindgren, S., and Wolraich, M. (1996).Quantitative EEG differences in a nonclinical sample of children withADHD and undifferentiated ADD. J. Am. Acad. Child Adolesc. Psychiatry 35,1009–1017. doi: 10.1097/00004583-199608000-00011
Kwon, J. S., Youn, T., and Jung, H. Y. (1996). Right hemisphere abnormalitiesin major depression: quantitative electroencephalographic findings beforeand after treatment. J. Affect. Disord. 40, 169–173. doi: 10.1016/0165-0327(96)00057-2
Lansbergen, M. M., Arns, M., van Dongen-Boomsma, M., Spronk, D., andBuitelaar, J. K. (2011). The increase in theta/beta ratio on resting-state EEGin boys with attention-deficit/hyperactivity disorder is mediated by slowalpha peak frequency. Prog. Neuropsychopharmacol. Biol. Psychiatry 35, 47–52.doi: 10.1016/j.pnpbp.2010.08.004
Lee, J., Hwang, J. Y., Park, S. M., Jung, H. Y., Choi, S.-W., Kim, D. J., et al. (2014).Differential resting-state EEG patterns associated with comorbid depressionin Internet addiction. Prog. Neuropsychopharmacol. Biol. Psychiatry 50, 21–26.doi: 10.1016/j.pnpbp.2013.11.016
Lefebvre, A., Delorme, R., Delanoë, C., Amsellem, F., Beggiato, A., Germanaud, D.,et al. (2018). Alpha waves as a neuromarker of autism spectrum disorder:the challenge of reproducibility and heterogeneity. Front. Neurosci. 12:662.doi: 10.3389/fnins.2018.00662
Lei, X., and Liao, K. (2017). Understanding the influences of EEG reference:a large-scale brain network perspective. Front. Neurosci. 11:205.doi: 10.3389/fnins.2017.00205
Liang, Z., Wang, Y., Sun, X., Li, D., Voss, L. J., Sleigh, J. W., et al.(2015). EEG entropy measures in anesthesia. Front. Comput. Neurosci. 9:16.doi: 10.3389/fncom.2015.00016
Liechti, M. D., Valko, L., Müller, U. C., Döhnert, M., Drechsler, R.,Steinhausen, H.-C., et al. (2013). Diagnostic value of restingelectroencephalogram in attention-deficit/hyperactivity disorder acrossthe lifespan. Brain Topogr. 26, 135–151. doi: 10.1007/s10548-012-0258-6
Loo, S. K., and Makeig, S. (2012). Clinical utility of EEG in attention-deficit/hyperactivity disorder: a research update. Neurotherapeutics 9, 569–587.doi: 10.1007/s13311-012-0131-z
Lord, C., Rutter, M., and Couteur, L. A. (1994). Autism diagnostic interview-revised: a revised version of a diagnostic interview for caregivers of individualswith possible pervasive developmental disorders. J. Autism Dev. Disord. 24,659–685. doi: 10.1007/bf02172145
Lord, C., Rutter, M., and Goode, S. (1989). Austism diagnostic observationschedule: a standardized observation of communicative and social behavior.J. Autism Dev. Disord. 19, 185–212. doi: 10.1007/bf02211841
Machado, C., Estévez, M., Leisman, G., Melillo, R., Rodríguez, R., DeFina, P.,et al. (2015). QEEG spectral and coherence assessment of autistic children inthree different experimental conditions. J. Autism Dev. Disord. 45, 406–424.doi: 10.1007/s10803-013-1909-5
Magee, C. A., Clarke, A. R., Barry, R. J., McCarthy, R., and Selikowitz, M. (2005).Examining the diagnostic utility of EEG power measures in children withattention deficit/hyperactivity disorder. Clin. Neurophysiol. 116, 1033–1040.doi: 10.1016/j.clinph.2004.12.007
Makeig, S., Bell, A. J., Jung, T.-P., and Sejnowski, T. J. (1996). ‘‘Advances inneural information processing systems 8,’’ in Independent Component Analysisof Electroencephalographic Data, eds D. Touretzky, M. Mozer and M. Hasselmo(Cambridge, MA: MIT Press), 145–151.
Markovska-Simoska, S., and Pop-Jordanova, N. (2017). Quantitative EEG inchildren and adults with attention deficit hyperactivity disorder: comparisonof absolute and relative power spectra and theta/Beta ratio. Clin. EEG Neurosci.48, 20–32. doi: 10.1177/1550059416643824
Márton, L. F., Brassai, S. T., Bako, L., and Losonczi, L. (2014). Detrendedfluctuation analysis of EEG signals. Procedia Technol. 12, 125–132.doi: 10.1016/j.protcy.2013.12.465
Mathewson, K. J., Jetha, M. K., Drmic, I. E., Bryson, S. E., Goldberg, J. O.,and Schmidt, L. A. (2012). Regional EEG alpha power, coherence, andbehavioral symptomatology in autism spectrum disorder. Clin. Neurophysiol.123, 1798–1809. doi: 10.1016/j.clinph.2012.02.061
Maxwell, C. R., Villalobos, M. E., Schultz, R. T., Herpertz-Dahlmann, B.,Konrad, K., and Kohls, G. (2015). Atypical laterality of resting gamma
Frontiers in Human Neuroscience | www.frontiersin.org 21 January 2019 | Volume 12 | Article 521

Newson and Thiagarajan Frequency Bands in Psychiatric Disorders
oscillations in autism spectrum disorders. J. Autism Dev. Disord. 45, 292–297.doi: 10.1007/s10803-013-1842-7
McFarlane, A., Clark, C. R., Bryant, R. A., Williams, L. M., Niaura, R., Paul, R. H.,et al. (2005). The impact of early life stress on psycholphysiological, personalityand behavoral measure in 740 non-clinical subjects. J. Integr. Neurosci. 4,27–40. doi: 10.1142/s0219635205000689
McLoughlin, G., Makeig, S., and Tsuang, M. T. (2014). In search of biomarkersin psychiatry: EEG-based measures of brain function. Am. J. Med. Genet. BNeuropsychiatr. Genet. 165, 111–121. doi: 10.1002/ajmg.b.32208
Mientus, S., Gallinat, J., Wuebben, Y., Pascual-Marqui, R. D., Mulert, C.,Frick, K., et al. (2002). Cortical hypoactivation during resting EEG inschizophrenics but not in depressives and schizotypal subjects as revealed bylow resolution electromagnetic tomography (LORETA). Psychiatry Res. 116,95–111. doi: 10.1016/s0925-4927(02)00043-4
Milotti, E. (2002). 1/f noise: a pedagogical review. arXiv:physics/0204033[physics.class-ph] [Preprint].
Mitra, S., Nizamie, S. H., Goyal, N., and Tikka, S. K. (2015). Evaluation of restingstate gamma power as a response marker in schizophrenia. Psychiatry Clin.Neurosci. 69, 630–639. doi: 10.1111/pcn.12301
Mitra, S., Nizamie, S. H., Goyal, N., and Tikka, S. K. (2017). Electroencephalogramalpha-to-theta ratio over left fronto-temporal region correlates with negativesymptoms in schizophrenia. Asian J. Psychiatr. 26, 70–76. doi: 10.1016/j.ajp.2017.01.013
Moeini, M., Khaleghi, A., and Mohammadi, M. R. (2015). Characteristics of alphaband frequency in adolescents with bipolar II disorder: a resting-state QEEGstudy. Iran. J. Psychiatry 10, 8–12.
Moeini, M., Khaleghi, A., Mohammadi, M. R., Zarafshan, H., Fazio, R. L., andMajidi, H. (2017). Cortical alpha activity in schizoaffective patients. Iran.J. Psychiatry 12, 1–7.
Molina, V., Montz, R., Pérez-Castejon, M. J., Martín-Loeches, M., Carreras, J. L.,Calcedo, A., et al. (1995). Cerebral perfusion, electrical activity and effects ofserotonergic treatment in obsessive-compulsive disorder. A preliminary study.Neuropsychobiology 32, 139–148. doi: 10.1159/000119227
Morgan, M. L., Witte, E. A., Cook, I. A., Leuchter, A. F., Abrams, M., andSiegman, B. (2005). Influence of age, gender, health status, and depressionon quantitative EEG. Neuropsychobiology 52, 71–76. doi: 10.1159/000086608
Motlagh, F., Ibrahim, F., Rashid, R., Seghatoleslam, T., and Habil, H. (2017).Investigation of brain electrophysiological properties among heroin addicts:quantitative EEG and event-related potentials. J. Neurosci. Res. 95, 1633–1646.doi: 10.1002/jnr.23988
Narayanan, B., O’Neil, K., Berwise, C., Stevens, M. C., Calhoun, V. D.,Clementz, B. A., et al. (2014). Resting state electroencephalogram oscillatoryabnormalities in schizophrenia and psychotic bipolar patients and theirrelatives from the bipolar and schizophrenia network on intermediatephenotypes study. Biol. Psychiatry 76, 456–465. doi: 10.1016/j.biopsych.2013.12.008
Oathes, D. J., Ray, W. J., Yamasaki, A. S., Borkovec, T. D., Castonguay, L. G.,Newman, M. G., et al. (2008). Worry, generalized anxiety disorder, andemotion: evidence from the EEG gamma band. Biol. Psychol. 79, 165–170.doi: 10.1016/j.biopsycho.2008.04.005
Ogrim, G., Kropotov, J., and Hestad, K. (2012). The quantitative EEGtheta/beta ratio in attention deficit/hyperactivity disorder and normal controls:sensitivity, specificity, and behavioral correlates. Psychiatry Res. 198, 482–488.doi: 10.1016/j.psychres.2011.12.041
Olbrich, S., Olbrich, H., Adamaszek, M., Jahn, I., Hegerl, U., and Stengler, K.(2013). Altered EEG lagged coherence during rest in obsessive-compulsivedisorder. Clin. Neurophysiol. 124, 2421–2430. doi: 10.1016/j.clinph.2013.05.031
Olbrich, S., van Dinteren, R., and Arns, M. (2015). Personalized medicine: reviewand perspectives of promising baseline EEG biomarkers in major depressivedisorder and attention deficit hyperactivity disorder. Neuropsychobiology 72,229–240. doi: 10.1159/000437435
Omori, M., Koshino, Y., Murata, T., Murata, I., Nishio, M., Sakamoto, K.,et al. (1995). Quantitative EEG in never-treated schizophrenic patients. Biol.Psychiatry 38, 303–309. doi: 10.1016/0006-3223(95)00300-6
Orekhova, E. V., Stroganova, T. A., Nygren, G., Tsetlin, M. M., Posikera, I. N.,Gillberg, C., et al. (2007). Excess of high frequency electroencephalogram
oscillations in boys with autism. Biol. Psychiatry 62, 1022–1029. doi: 10.1016/j.biopsych.2006.12.029
Overall, J. E., and Gorham, D. R. (1962). The brief psychiatric rating scale. Psychol.Rep. 10, 799–812. doi: 10.2466/pr0.10.3.799-812
Parameshwaran, D., and Thiagarajan, T. C. (2017a). Complexity of EEG reflectssocioeconomic context and geofootprint. bioRxiv [Preprint]. doi: 10.1101/125872
Parameshwaran, D., and Thiagarajan, T. C. (2017b). Dynamical featuresof human EEG scale systematically with life context. bioRxiv [Preprint].doi: 10.1101/125906
Parameshwaran, D., and Thiagarajan, T. C. (2017c). Modernization, wealth andthe emergence of strong α oscillations in the human EEG. bioRxiv [Preprint].doi: 10.1101/125898
Park, J. H., Hong, J. S., Han, D. H., Min, K. J., Lee, Y. S., Kee, B. S., et al.(2017). Comparison of QEEG findings between adolescents with attentiondeficit hyperactivity disorder (ADHD) without comorbidity and ADHDcomorbid with internet gaming disorder. J. Korean Med. Sci. 32, 514–521.doi: 10.3346/jkms.2017.32.3.514
Pascual-Marqui, R. D., Lehmann, D., Koenig, T., Kochi, K., Merlo, M. C. G.,Hell, D., et al. (1999). Low resolution brain electromagnetic tomography(LORETA) functional imaging in acute, neuroleptic-naive, first-episode,productive schizophrenia. Psychiatry Res. 90, 169–179. doi: 10.1016/s0925-4927(99)00013-x
Pivik, R. T., Broughton, R. J., Coppola, R., Davidson, R. J., Fox, N., andNuwer, M. R. (1993). Guidelines for the recording and quantitative analysisof electroencephalographic activity in research contexts. Psychophysiology 30,547–558. doi: 10.1111/j.1469-8986.1993.tb02081.x
Pizzagalli, D. A., Nitschke, J. B., Oakes, T. R., Hendrick, A. M., Horras, K. A.,Larson, C. L., et al. (2002). Brain electrical tomography in depression: theimportance of symptom severity, anxiety, and melancholic features. Biol.Psychiatry 52, 73–85. doi: 10.1016/s0006-3223(02)01313-6
Pogarell, O., Juckel, G., Mavrogiorgou, P., Mulert, C., Folkerts, M., Hauke, W.,et al. (2006). Symptom-specific EEG power correlations in patients withobsessive-compulsive disorder. Int. J. Psychophysiol. 62, 87–92. doi: 10.1016/j.ijpsycho.2006.02.002
Poil, S. S., Bollmann, S., Ghisleni, C., O’Gorman, R. L., Klaver, P., Ball, J.,et al. (2014). Age dependent electroencephalographic changes in attention-deficit/hyperactivity disorder (ADHD). Clin. Neurophysiol. 125, 1626–1638.doi: 10.1016/j.clinph.2013.12.118
Polanczyk, G., de Lima, M. S., Horta, B. L., Biederman, J., and Rohde, L. A.(2007). The worldwide prevalence of ADHD: a systematic review andmetaregression analysis. Am. J. Psychiatry 164, 942–948. doi: 10.1176/ajp.2007.164.6.942
Price, G. W., Lee, J. W., Garvey, C., and Gibson, N. (2008). Appraisal of sessionalEEG features as a correlate of clinical changes in an rTMS treatment ofdepression. Clin. EEG Neurosci. 39, 131–138. doi: 10.1177/155005940803900307
Pritchard, W. S. (1992). The brain in fractal time: 1/f-like power spectrumscaling of the human electroencephalogram. Int. J. Neurosci. 66, 119–129.doi: 10.3109/00207459208999796
Qin, Y., Xu, P., and Yao, D. (2010). A comparative study of different references forEEG default mode network: the use of the infinity reference. Clin. Neurophysiol.121, 1981–1991. doi: 10.1016/j.clinph.2010.03.056
Rabe, S., Beauducel, A., Zöllner, T., Maercker, A., and Karl, A. (2006).Regional brain electrical activity in posttraumatic stress disorder after motorvehicle accident. J. Abnorm. Psychol. 115, 687–698. doi: 10.1037/0021-843X.115.4.687
Rangaswamy, M., Porjesz, B., Chorlian, D. B., Choi, K., Jones, K. A., Wang, K.,et al. (2006). Theta power in the EEG of alcoholics. Alcohol. Clin. Exp. Res. 27,607–615. doi: 10.1097/01.ALC.0000060523.95470.8F
Rangaswamy, M., Porjesz, B., Chorlian, D. B., Wang, K., Jones, K. A., Bauer, L. O.,et al. (2002). Beta power in the EEG of alcoholics. Biol. Psychiatry 52, 831–842.doi: 10.1016/s0006-3223(02)01362-8
Ranlund, S., Nottage, J., Shaikh, M., Dutt, A., Constante, M., Walshe, M.,et al. (2014). Resting EEG in psychosis and at-risk populations—a possibleendophenotype? Schizophr. Res. 153, 96–102. doi: 10.1016/j.schres.2013.12.017
Roach, B. J., and Mathalon, D. H. (2008). Event-related EEG time-frequencyanalysis: an overview of measures and an analysis of early gamma band phase
Frontiers in Human Neuroscience | www.frontiersin.org 22 January 2019 | Volume 12 | Article 521

Newson and Thiagarajan Frequency Bands in Psychiatric Disorders
locking in schizophrenia. Schizophr. Bull. 34, 907–926. doi: 10.1093/schbul/sbn093
Roh, S.-C., Park, E.-J., Park, Y.-C., Yoon, S.-K., Kang, J.-G., Kim, D.-W.,et al. (2015). Quantitative electroencephalography reflects inattention, visualerror responses and reaction times in male patients with attentiondeficit hyperactivity disorder. Clin. Psychopharmacol. Neurosci. 13, 180–187.doi: 10.9758/cpn.2015.13.2.180
Rommel, A.-S., James, S.-N., McLoughlin, G., Brandeis, D., Banaschewski, T.,Asherson, P., et al. (2017). Altered EEG spectral power during restand cognitive performance: a comparison of preterm-born adolescents toadolescents with ADHD. Eur. Child Adolesc. Psychiatry 26, 1511–1522.doi: 10.1007/s00787-017-1010-2
Rommel, A.-S., Kitsune, G. L., Michelini, G., Hosang, G. M., Asherson, P.,McLoughlin, G., et al. (2016). Commonalities in EEG spectral powerabnormalities between women with ADHD and women with bipolardisorder during rest and cognitive performance. Brain Topogr. 29, 856–866.doi: 10.1007/s10548-016-0508-0
Rousselet, G. (2012). Does filtering preclude us from studying ERP time-courses?Front. Psychol. 3:131. doi: 10.3389/fpsyg.2012.00131
Rutter, M. B. A., and Lord, C. (2003). The Social Communication Questionnaire:Manual. Los Angeles, CA: Western Psychological Services.
Saad, J. F., Kohn, M. R., Clarke, S., Lagopoulos, J., and Hermens, D. F. (2015).Is the theta/β EEG Marker for ADHD inherently flawed? J. Atten. Disord. 22,815–826. doi: 10.1177/1087054715578270
Sabeti, M., Katebi, S., and Boostani, R. (2009). Entropy and complexity measuresfor EEG signal classification of schizophrenic and control participants. Artif.Intell. Med. 47, 263–274. doi: 10.1016/j.artmed.2009.03.003
Sachs, G., Anderer, P., Dantendorfer, K., and Saletu, B. (2004). EEG mappingin patients with social phobia. Psychiatry Res. 131, 237–247. doi: 10.1016/j.pscychresns.2003.08.007
Saletu-Zyhlarz, G. M., Arnold, O., Anderer, P., Oberndorfer, S., Walter, H.,Lesch, O. M., et al. (2004). Differences in brain function between relapsingand abstaining alcohol-dependent patients, evaluated by EEG mapping.AlcoholAlcohol. 39, 233–240. doi: 10.1093/alcalc/agh041
Sayers, J. (2001). The world health report 2001—Mental health: newunderstanding, new hope. Bull. World Health Organ. 79, 1085–1085.
Schug, R. A., Yang, Y., Raine, A., Han, C., Liu, J., and Li, L. (2011). Resting EEGdeficits in accused murderers with schizophrenia. Psychiatry Res. 194, 85–94.doi: 10.1016/j.pscychresns.2010.12.017
Shankman, S. A., Silverstein, S. M., Williams, L. M., Hopkinson, P. J., Kemp, A. H.,Felmingham, K. L., et al. (2008). Resting electroencephalogram asymmetry andposttraumatic stress disorder. J. Trauma. Stress 21, 190–198. doi: 10.1002/jts.20319
Sheikhani, A., Behnam, H., Mohammadi, M. R., Noroozian, M., andMohammadi, M. (2012). Detection of abnormalities for diagnosing ofchildren with autism disorders using of quantitative electroencephalographyanalysis. J. Med. Syst. 36, 957–963. doi: 10.1007/s10916-010-9560-6
Shephard, E., Tye, C., Ashwood, K. L., Azadi, B., Asherson, P., Bolton, P. F.,et al. (2018). Resting-state neurophysiological activity patterns in young peoplewith ASD, ADHD and ASD + ADHD. J. Autism Dev. Disord. 48, 110–122.doi: 10.1007/s10803-017-3300-4
Shi, T., Li, X., Song, J., Zhao, N., Sun, C., Xia, W., et al. (2012). EEG characteristicsand visual cognitive function of children with attention deficit hyperactivitydisorder (ADHD). Brain Dev. 34, 806–811. doi: 10.1016/j.braindev.2012.02.013
Shreekantiah Umesh, D., Tikka, S. K., Goyal, N., Nizamie, S. H., and Sinha, V. K.(2016). Resting state theta band source distribution and functional connectivityin remitted schizophrenia. Neurosci. Lett. 630, 199–202. doi: 10.1016/j.neulet.2016.07.055
Slobodskoy-Plusnin, J. (2018). Behavioral and brain oscillatory correlates ofaffective processing in subclinical depression. J. Clin. Exp. Neuropsychol. 40,437–448. doi: 10.1080/13803395.2017.1371281
Snyder, S. M., and Hall, J. R. (2006). A meta-analysis of quantitative EEG powerassociated with attention-deficit hyperactivity disorder. J. Clin. Neurophysiol.23, 441–456. doi: 10.1097/01.wnp.0000221363.12503.78
Sohn, H., Kim, I., Lee, W., Peterson, B. S., Hong, H., Chae, J.-H., et al.(2010). Linear and non-linear EEG analysis of adolescents with attention-deficit/hyperactivity disorder during a cognitive task. Clin. Neurophysiol. 121,1863–1870. doi: 10.1016/j.clinph.2010.04.007
Son, K.-L., Choi, J.-S., Lee, J., Park, S. M., Lim, J.-A., Lee, J. Y., et al. (2015).Neurophysiological features of Internet gaming disorder and alcohol usedisorder: a resting-state EEG study. Transl. Psychiatry 5:e628. doi: 10.1038/tp.2015.124
Sponheim, S. R. C., Clementz, B. A., Iacono, W. G., and Beiser, M. (1994). RestingEEG in first-episode and chronic schizophrenia. Psychophysiology 31, 37–43.doi: 10.1111/j.1469-8986.1994.tb01023.x
Stroganova, T. A., Nygren, G., Tsetlin, M. M., Posikera, I. N., Gillberg, C.,Elam, M., et al. (2007). Abnormal EEG lateralization in boys with autism. Clin.Neurophysiol. 118, 1842–1854. doi: 10.1016/j.clinph.2007.05.005
Sutton, S. K., Burnette, C. P., Mundy, P. C., Meyer, J., Vaughan, A., Sanders, C.,et al. (2004). Resting cortical brain activity and social behavior in higherfunctioning children with autism. J. Child Psychol. Psychiatry 46, 211–222.doi: 10.1111/j.1469-7610.2004.00341.x
Swartwood, J. N., Swartwood, M. O., Lubar, J. F., and Timmermann, D. L. (2003).EEG differences in ADHD-combined type during baseline and cognitive tasks.Pediatr. Neurol. 28, 199–204. doi: 10.1016/s0887-8994(02)00514-3
Thiagarajan, T. (2017). ‘‘Brainbase: a research and data management platformfor human EEG,’’ in 2017 IEEE Signal Processing in Medicine and BiologySymposium (SPMB) (Philadelphia, PA: IEEE), 1–5.
Thiagarajan, T. C., Lebedev, M. A., Nicolelis, M. A., and Plenz, D. (2010).Coherence potentials: loss-less, all-or-none network events in the cortex. PLoSBiol. 8:e1000278. doi: 10.1371/journal.pbio.1000278
Thomas, B. L., and Viljoen, M. (2016). EEG brain wave activity at restand during evoked attention in children with attention-deficit/hyperactivitydisorder and effects of methylphenidate. Neuropsychobiology 73, 16–22.doi: 10.1159/000441523
Tierney, A. L., Gabard-Durnam, L., Vogel-Farley, V., Tager-Flusberg, H.,and Nelson, C. A. (2012). Developmental trajectories of resting EEGpower: an endophenotype of autism spectrum disorder. PLoS One 7:e39127.doi: 10.1371/journal.pone.0039127
Tikka, S. K., Yadav, S., Nizamie, S. H., Das, B., Tikka, D. L., and Goyal, N. (2014).Schneiderian first rank symptoms and gamma oscillatory activity in neurolepticnaïve first episode schizophrenia: a 192 channel EEG study. Psychiatry Investig.11:467. doi: 10.4306/pi.2014.11.4.467
Tislerova, B., Brunovsky, M., Horacek, J., Novak, T., Kopecek, M., Mohr, P.,et al. (2008). LORETA functional imaging in antipsychotic-naive andolanzapine-, clozapine- and risperidone-treated patients with schizophrenia.Neuropsychobiology 58, 1–10. doi: 10.1159/000154474
Todder, D., Levine, J., Abujumah, A., Mater, M., Cohen, H., and Kaplan, Z. (2012).The quantitative electroencephalogram and the low-resolution electricaltomographic analysis in posttraumatic stress disorder. Clin. EEG Neurosci. 43,48–53. doi: 10.1177/1550059411428716
Tombor, L., Kakuszi, B., Papp, S., Réthelyi, J., Bitter, I., and Czobor, P. (2018).Decreased resting gamma activity in adult attention deficit/hyperactivitydisorder. World J. Biol. Psychiatry doi: 10.1080/15622975.2018.1441547 [Epubahead of print].
Tot, S., Özge, A., Cömelekoglu, Ü., Yazici, K., and Bal, N. (2002). Associationof QEEG findings with clinical characteristics of OCD: evidence of leftfrontotemporal dysfunction. Can. J. Psychiatry 47, 538–545. doi: 10.1177/070674370204700605
Trujillo, L. T., Stanfield, C. T., and Vela, R. D. (2017). The effect ofelectroencephalogram (EEG) reference choice on information-theoreticmeasures of the complexity and integration of EEG signals. Front. Neurosci.11:425. doi: 10.3389/fnins.2017.00425
Tye, C., Rijsdijk, F., and McLoughlin, G. (2014). Genetic overlap between ADHDsymptoms and EEG theta power. Brain Cogn. 87, 168–172. doi: 10.1016/j.bandc.2014.03.010
Urigüen, J. A., and Garcia-Zapirain, B. (2015). EEG artifact removal-state-of-the-art and guidelines. J. Neural Eng. 12:031001. doi: 10.1088/1741-2560/12/3/031001
van der Vinne, N., Vollebregt, M. A., van Putten, M. J. A. M., and Arns, M. (2017).Frontal α asymmetry as a diagnostic marker in depression: fact or fiction? Ameta-analysis. Neuroimage Clin. 16, 79–87. doi: 10.1016/j.nicl.2017.07.006
van Diessen, E., Senders, J., Jansen, F. E., Boersma, M., and Bruining, H.(2015). Increased power of resting-state gamma oscillations in autism spectrumdisorder detected by routine electroencephalography. Eur. Arch. PsychiatryClin. Neurosci. 265, 537–540. doi: 10.1007/s00406-014-0527-3
Frontiers in Human Neuroscience | www.frontiersin.org 23 January 2019 | Volume 12 | Article 521

Newson and Thiagarajan Frequency Bands in Psychiatric Disorders
van Dongen-Boomsma, M., Lansbergen, M. M., Bekker, E. M., Sandra Kooij, J. J.,van der Molen, M., Kenemans, J. L., et al. (2010). Relation between restingEEG to cognitive performance and clinical symptoms in adults with attention-deficit/hyperactivity disorder. Neurosci. Lett. 469, 102–106. doi: 10.1016/j.neulet.2009.11.053
Vanrullen, R. (2011). Four common conceptual fallacies in mapping thetime course of recognition. Front. Psychol. 2:365. doi: 10.3389/fpsyg.2011.00365
Veiga, H., Deslandes, A., Cagy, M., Fiszman, A., Piedade, R. A. M., and Ribeiro, P.(2003). Neurocortical electrical activity tomography in chronic schizophrenics.Arq. Neuropsiquiatr. 61, 712–717. doi: 10.1590/s0004-282x2003000500002
Velikova, S., Locatelli, M., Insacco, C., Smeraldi, E., Comi, G., and Leocani, L.(2010). Dysfunctional brain circuitry in obsessive-compulsive disorder:source and coherence analysis of EEG rhythms. Neuroimage 49, 977–983.doi: 10.1016/j.neuroimage.2009.08.015
Veltmeyer, M. D., McFarlane, A. C., Bryant, R. A., Mayo, T., Gordon, E.,and Clark, C. R. (2006). Integrative assessment of brain function inPTSD: brain stability and working memory. J. Integr. Neurosci. 5, 123–138.doi: 10.1142/s0219635206001057
Venables, N. C., Bernat, E. M., and Sponheim, S. R. (2009). Genetic and disorder-specific aspects of resting state EEG abnormalities in schizophrenia. Schizophr.Bull. 35, 826–839. doi: 10.1093/schbul/sbn021
Vigário, R. N. (1997). Extraction of ocular artefacts from EEG using independentcomponent analysis. Electroencephalogr. Clin. Neurophysiol. 103, 395–404.doi: 10.1016/s0013-4694(97)00042-8
Vigário, R., Särelä, J., Jousmäki, V., Hämäläinen, M., and Oja, E. (2000).Independent component approach to the analysis of EEG and MEG recordings.IEEE Trans. Biomed. Eng. 47, 589–593. doi: 10.1109/10.841330
Voytek, B., Kramer, M. A., Case, J., Lepage, K. Q., Tempesta, Z. R., Knight, R.T., et al. (2015). Age-related changes in 1/f neural electrophysiological noise.J. Neurosci. 35, 13257–13265. doi: 10.1523/JNEUROSCI.2332-14.2015
Wada, Y., Takizawa, Y., Kitazawa, S., Zheng-Yan, J., and Yamaguchi, N. (1994).Quantitative EEG analysis at rest and during photic stimulation in drug-naivepatients with first-episode paranoid schizophrenia. Eur. Arch. Psychiatry Clin.Neurosci. 244, 247–251. doi: 10.1007/bf02190377
Wahbeh, H., and Oken, B. S. (2013). Peak high-frequency HRV and peakα frequency higher in PTSD. Appl. Psychophysiol. Biofeedback 38, 57–69.doi: 10.1007/s10484-012-9208-z
Walter, W. G. (1938). Critical review: the technique and application of electro-encephalography. J. Neurol. Psychiatry 1, 359–385. doi: 10.1136/jnnp.1.4.359
Wang, G. Y., Kydd, R., and Russell, B. R. (2015a). Resting EEG and ERPsfindings in methadone-substituted opiate users: a review. Acta Neurol. Belg.115, 539–546. doi: 10.1007/s13760-015-0476-2
Wang, G. Y., Kydd, R., Wouldes, T. A., Jensen, M., and Russell, B. R. (2015b).Changes in resting EEG following methadone treatment in opiate addicts. Clin.Neurophysiol. 126, 943–950. doi: 10.1016/j.clinph.2014.08.021
Wang, G. Y., Kydd, R. R., and Russell, B. R. (2016). Quantitative EEG andlow-resolution electromagnetic tomography (LORETA) imaging of patientsundergoing methadone treatment for opiate addiction. Clin. EEG Neurosci. 47,180–187. doi: 10.1177/1550059415586705
Ward, M. F., Wender, P. H., and Reimherr, F. W. (1993). The wender utahrating scale: an aid in the retrospective diagnosis of childhood attentiondeficit hyperactivity disorder [published erratum appears in Am J Psychiatry1993 Aug;150(8):1280] . Am. J. Psychiatry 150, 885–890. doi: 10.1176/ajp.150.6.885
Webb, S. J., Bernier, R., Henderson, H. A., Johnson, M. H., Jones, E. J. H.,Lerner, M. D., et al. (2015). Guidelines and best practices forelectrophysiological data collection, analysis and reporting in autism.J. Autism Dev. Disord. 45, 425–443. doi: 10.1007/s10803-013-1916-6
Widmann, A., and Schröger, E. (2012). Filter effects and filter artifacts in theanalysis of electrophysiological data. Front. Psychol. 3:233. doi: 10.3389/fpsyg.2012.00233
Wise, V., McFarlane, A. C., Clark, C. R., and Battersby, M. (2011). An integrativeassessment of brain and body function ‘at rest’ in panic disorder: a combinedquantitative EEG/autonomic function study. Int. J. Psychophysiol. 79, 155–165.doi: 10.1016/j.ijpsycho.2010.10.002
Woltering, S., Jung, J., Liu, Z., and Tannock, R. (2012). Resting state EEGoscillatory power differences in ADHD college students and their peers. Behav.Brain Funct. 8:60. doi: 10.1186/1744-9081-8-60
Wuebben, Y., and Winterer, G. (2001). Hypofrontality—a risk-markerrelated to schizophrenia? Schizophr. Res. 48, 207–217. doi: 10.1016/s0920-9964(00)00047-5
Xing, M., Tadayonnejad, R., MacNamara, A., Ajilore, O., DiGangi, J., Phan, K. L.,et al. (2017). Resting-state theta band connectivity and graph analysis ingeneralized social anxiety disorder. Neuroimage Clin. 13, 24–32. doi: 10.1016/j.nicl.2016.11.009
Young, K. S. (1998). Internet Addiction: the emergence of a new clinical disorder.CyberPsychol. Behav. 1, 237–244. doi: 10.1089/cpb.1998.1.237
Zhao, Q., Jiang, H., Hu, B., Li, Y., Zhong, N., Li, M., et al. (2017). Nonlineardynamic complexity and sources of resting-state EEG in abstinent heroinaddicts. IEEE Trans. Nanobioscience 16, 349–355. doi: 10.1109/TNB.2017.2705689
Conflict of Interest Statement: The authors declare that the research wasconducted in the absence of any commercial or financial relationships that couldbe construed as a potential conflict of interest.
Copyright © 2019 Newson and Thiagarajan. This is an open-access articledistributed under the terms of the Creative Commons Attribution License (CC BY).The use, distribution or reproduction in other forums is permitted, provided theoriginal author(s) and the copyright owner(s) are credited and that the originalpublication in this journal is cited, in accordance with accepted academic practice.No use, distribution or reproduction is permitted which does not comply with theseterms.
Frontiers in Human Neuroscience | www.frontiersin.org 24 January 2019 | Volume 12 | Article 521