eeg activity during mental influence on a random signal
TRANSCRIPT

Journal of Scientific Exploration, Vol. 35, No. 2, pp. 267–286, 2021 0892-3310/21
RESEARCH ARTICLE
EEG Activity During Mental Influence on a Random Signal Generator
William GiroldiniThe Italian Association for Psychical Research (AISM), Milan, Italy
Luciano PederzoliEVANLAB, Florence, Italy
Submitted July 24, 2020; Accepted December 23, 2020; Published June 15, 2021
https://10.31275/20211909 Creative Commons License CC-BY-NC
Abstract—This preliminary study is based on 38 experimental sittings in which 22 participants attempted to mentally influence an electronic cir-cuit called RSG (Random Signal Generator), while their cerebral activity was recorded by a 14-channel EEG. Subject to sampling, signal peaks with an absolute value greater than a predetermined threshold were selected from the analogical RSG output by a computer program. Whenever a signal exceeded the threshold, an audible ‘beep’ sounded and the par-ticipant was asked to mentally increase the frequency of these beeps as much as possible, because a higher beep rate meant a successful mental influence attempt on the RSG. An important objective was to verify the existence of any relationship between a successful mental influence on the RSG and cerebral activity in the participant attempting the influence. Compared with an equal number of ‘inactive’ sittings made without any-one attempting mental action, the ‘active’ sittings show a small increase in the average number of beeps/minute, but in particular a significant increase in the emitted beeps within 1.5 s of the previous beep (p < 0.025). The experimental sittings were divided into two groups (with about 50% of participants in each), of which the first had better results, and only the frontal and fronto–temporal symmetrical EEG locations (AF3, AF4, F7, F8, F3, F4, Fc5, Fc6) were examined. The better-performing group showed a significant reduction in Brain Synchrony (p < 0.03) together with an equally significant increase in Beta and Gamma 15–42 Hz activity (p < 0.03). These differences were interpreted as an effect of greater mental work performed by the better-performing group during mental influ-

268 W i l l i a m G i r o l d i n i a n d L u c i a n o P e d e r z o l i
ence on the RSG. This study contributes to investigating the relationship between EEG activity and mind–matter (PK) interaction at a distance, in order to find, if any, a significant relationship between PK effects and brain waves.
Keywords: mind–matter Interaction, psychokinesis, entanglement, EEG, ERP, RNG, brain–computer interface, random signal genera-tor, mentally controlled devices
INTRODUCTION
This study presents the results of a series of experimental sittings aimed at investigating the mind–matter (PK) interaction by means of the mental influence on a Random Signal Generator (RSG) with a simultaneous recording of the electroencephalogram (EEG) of the subject attempting the mental influence. This procedure represents an interesting innovation with respect to previous studies, in which the PK influence effect on an electronic device usually involved a Random Number Generator (RNG) of which the output was simply a sequence of zeros and ones. One of the most ambitious objectives of RNG (and similar) studies is in fact to verify the possibility of distantly activating electronic devices at will simply by using “mind force.”
Even though, given the current state, this possibility of at-will activation is still far removed from present abilities, many studies—beginning in the 1970s by R. G. Stanford (1977), H. Schmidt (1987), and then by R. Jahn et al. (1997) under the scope of PEAR lab (Princeton Engineering Anomalies Research)—have produced to date hundreds of studies overall highlighting a weak but significant PK interaction effect (Bösch et al., 2006). Moreover, examples of previous RNG–PK studies considering EEG correlates include Heseltine (1977), Heseltine and Mayer-Oakes (1978), Schmidt and Terry (1976), and Radin et al. (2012, 2015).
Despite the still-common skepticism, it seems important to continue this type of research by integrating data obtained from the electronic device under examination with the simultaneous recording of mental activity via EEG—as in this case—or with other more sophis-ticated techniques. A better knowledge of mental states during PK action is of fundamental importance to demonstrate the reality of PK as well as understanding which traits of brain activity correlate with PK.
E E G A c t i v i ty W h e n I n f l u e n c i n g a n R S G 269
MATERIALS AND METHODS
Participants
22 people ranging in age from 30 to 70 years, 10 males and 12 females, took part voluntarily in the experiment, carried out in the AISM Laboratory (Milan, Italy).
The criteria used for participant selection were the following:
— interest in the experiment itself, — convinced of the existence of psi, and — having presumed personal experience of psi events.
Some participants who had particularly good results in PK action took part in more sittings, thus favoring a contribution by subjects who are more gifted in PK.
Ethics Declaration
The use of participants is in accordance with the ethical guidelines of the Declaration of Helsinki, and the study was approved by the AISM Ethics Committee. Before taking part in the experiment, all participants were informed of the study’s objectives and gave their written consent to participate.
Equipment
In this study the traditional RNG (Random Number Generator)—currently also available as a USB—was substituted with an electronic circuit called a Random Signal Generator (RSG). The reason for this stems from the theory, confirmed by a previous study (Giroldini, 1991), that an RSG circuit could be more sensitive to PK than an RNG. Both types of circuits are based on white noise generated by low voltage Zener diodes when, for a quantum tunnel effect, they are given a small continuous current.
Conceptually, the RNG is based on only one Zener diode, the signal of which is amplified and then immediately split and thereafter digitalized (Pederzoli et al., 2017) and processed, and on its emergence gives a regular temporal sequence of absolutely random 1 and 0 states.

2 7 0 W i l l i a m G i r o l d i n i a n d L u c i a n o P e d e r z o l i
This process could, however, hinder sensitivity to PK, since in a post-digitalization stage the 1 and 0 states are further processed, causing the loss of a good chunk of the possible relationship with mental influence on the tunnel effect.
The RSG circuit used in this study is instead composed of 16 identical generators/amplifiers of white noise each using a Zener diode and an operational amplifier. Their output signals are then added and amplified by another operational amplifier, producing the RSG’s final output signal. The signal produced by individual generators is totally random; therefore the sum of the 16 signals is also random with respect to noise, increasing the output voltage as the square root of the number of generators (following the sum of their powers, not voltages).
We assume, though, that PK acts simultaneously and in the same manner on all 16 white noise generators, so that all their voltage contributions are added together at the output: We therefore expect that the signal/noise ratio relative to the PK of the whole circuit improves by a factor equal to the square root of the number of generators, in this case 4 times with respect to a single generator. The circuit diagram of the RSG is shown in Figure 1.
Figure 1. Circuit diagram of the Random Signal Generator. There are 16 equal white noise generators, like that on the left. The circuit on the right adds together all their signals, amplifies them, and produces the RSG’s output signal.

E E G A c t i v i ty W h e n I n f l u e n c i n g a n R S G 2 7 1
In this study the RSG circuit was battery-operated with a stabilized voltage and enclosed inside a shielded metal box. During the session the ambient temperature was set at 23.5 +/– 0.5 °C, giving the RSG time to thermally stabilize. The RSG circuit’s output signal was lastly AC-amplified by a second battery-powered device with a 1–40 Hz bandwidth (Brain Monitor, Elemaya, Milan, Italy). The RSG signal at this stage is then a typical AC (alternate current) signal with average value Mv experimentally adjusted about half-scale of the ADC output. This constant value Mv was used successively for all the experiments in order to determinate peaks of RSG activity. The RSG signal was then sampled at 128 samples/s and 8 bits/sample, and then sent in digital form to the processing computer through an RS232 serial port.
The EEG was an Emotiv Epoc model modified to connect (via a multi-contact connector) to a Bionen (Florence, Italy) professional headset so that high-quality EEG signals could be detected.
The entire system was carefully checked for accuracy and quality of recorded signals. Sampling frequency was 128 samples/s over 14 channels connected to the following location points: AF3, F7, F3, Fc5, T7, P7, O1, O2, P8, T8, Fc6, F4, F8, AF4. All electrodes referred to two interconnected aural electrodes (A1 and A2).
The Emotiv Epoc was equipped with a fifth-order, synchronous, low-pass digital filter (band 0.2–45 Hz) and also two notch filters at 50 and 60 Hz, respectively, to protect against disturbances from the local electricity network; it also had its own wireless connection to the computer, at a frequency of 2.4 GHz, so as to totally isolate the acquisition electronics.
A special computer program also was created, dedicated to simultaneous acquisition of both EEG and RSG signals, all at the sampling frequency of 128 samples/second. Additionally, the program managed the emission of a short beep (500 Hz, 60 ms duration) that was given to the participant through headphones with a 32 Ohm impedance each time the RSG signal exceeded a certain threshold ‘Th’, the value of which was determined so that a statistical average of 30 beeps/minute would be a baseline activity in the absence of mental influence attempts on the RSG.
Each time the threshold was exceeded, the program prevented the emission of other beeps (even if successive signals exceeded the
2 7 2 W i l l i a m G i r o l d i n i a n d L u c i a n o P e d e r z o l i
Procedure
To stabilize temperature, all the equipment was placed in the laboratory where the experiments would take place and turned on at least one hour before each sitting; the ambient temperature was set to between 23°C and 24°C.
threshold) for a duration equal to 100 samples (0.78 sec), but the entire RSG signal continued to be recorded together with EEG signals. An excessive number of beeps within too short a time interval would have prevented the clear distinction between normal EEG responses to a brief audio or visual stimulus, which are defined as ERPs and described in more detail below.
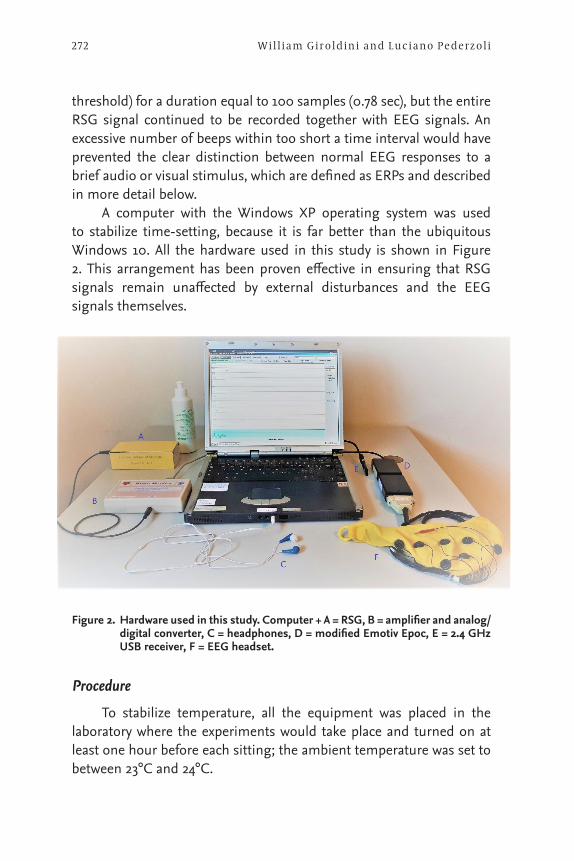
A computer with the Windows XP operating system was used to stabilize time-setting, because it is far better than the ubiquitous Windows 10. All the hardware used in this study is shown in Figure 2. This arrangement has been proven effective in ensuring that RSG signals remain unaffected by external disturbances and the EEG signals themselves.
Figure 2. Hardware used in this study. Computer + A = RSG, B = amplifier and analog/digital converter, C = headphones, D = modified Emotiv Epoc, E = 2.4 GHz USB receiver, F = EEG headset.

E E G A c t i v i ty W h e n I n f l u e n c i n g a n R S G 2 7 3
After fitting the headset on the participant’s head, applying conducting gel to the electrodes, and carefully checking the quality of all signals, the participant was instructed to try to listen for as many generated beeps/min as possible, because a higher beep frequency indicated a more effective mental influence on the RSG. The experi-ments were in fact conducted based on the theory that feedback in real time would have enhanced the effectiveness of voluntary mental action.
The participants, who were usually relaxed, very motivated, and sitting on a comfortable chair, were instructed to keep their eyes closed and to limit physical movements during the test, so as to obtain the best possible EEG signal quality.
At this point the test began, lasting around 16 minutes, with the computer program signaling its end. For each session a control test was undertaken immediately after, or sometimes shortly before the session, with nobody in the laboratory. Obviously in these control tests the only channel recorded for 16 minutes, with the same program, was that relative to RSG output. The 38 experimental sittings, together with 38 controls, were achieved over 3 months of work, and, as already stated, some subjects who obtained good results were invited to take part in more sessions.
RESULTSData Analysis
Each session produced a total of three files: one with EEG data, one with RSG activity, and also, during the control phase (CT), a file with the recording of the RSG’s activity. Each output signal of the recorded RSG was then subjected to a series of statistical processes, among which was a calculation of the average amplitude of the RSG signals during the PK and CT phases, the statistical distributions of their sample values, as well as their frequency distributions via FFT. There was no significant difference between the PK and CT data. Each ‘beep’ perceived by a participant originated from an RSG activity peak: Henceforth, this peak will be defined simply as “Peak.” Peaks generated by the RSG were ascertained by calculating the absolute value of the RSG’s signal after subtraction of its average value and checking to see if it exceeded the pre-determined Th threshold. A Peak occurred

2 74 W i l l i a m G i r o l d i n i a n d L u c i a n o P e d e r z o l i
The average number of Peaks/minute during the PK phase was slightly higher with respect to the control phase: 31.125 Peak/minute (SD = 2.316) compared with 30.636 Peak/minute (SD = 2.03), N = 38. This difference cannot be considered significant; however, some participants reported having had the sensation of beeps in very close succession followed by longer than normal pauses. Consequently, instead of limiting the study to simply counting Peaks/min, we analyzed the distribution of Peaks over time in order to find asymmetries between the PK and CT phases. The difference in time ΔTx between the two Peaks is defined by the equation:
ΔTx(i) = Tx(i) – Tx(i–1)
where Tx(i) is the absolute time of each Peak (expressed as seconds or as samples).
During a 16-minute test, there are about 500 Peaks, corresponding to 500 values of ΔTx. This set of ΔTx values can be distributed as small intervals of time, denoted ‘bins’, each being 10 sample durations (0.781 s) such that each single ΔTx must fall within a bin. For example, bin number 30 contains the ΔTx values from 2.343 s to 2.422 s inclusive, or between 300 and 310 samples (of the RSG signal).
In this way we can create a group of bins (k), each of which contains the number of ΔTx falling within a certain time interval. It is
when Abs[RSG(t) – Mv] > Th, with Mv = average value of RSG signal as described previously. Figure 3 shows the absolute value of the RSG signal as a function of time, and the horizontal grey line represents the threshold Th.
Figure 3. Graphic example of the RSG (full wave rectified signal via computer program). When the RSG signal exceeded (Peak) the established threshold (horizontal grey line), a short beep was emitted (red curve), after which, for 0.78 s and despite the possible presence of other Peaks, no other beeps were emitted.

E E G A c t i v i ty W h e n I n f l u e n c i n g a n R S G 2 7 5
then possible to acquire the statistical distribution of times between two successive Peaks and compare the distribution of PK and CT bins, as shown in Figure 4, which illustrates the global average of bin distributions from all tests.
We see that the PK line is mostly above the CT line until about 1.5 s, while the average lag between Peaks is around 2 s.
In consonance with bins < 0.781 s, the program does not emit any beeps; however, even in bins lower than 0.78 s we see an excess of Peaks. The excess Peaks during the PK attempts with respect to controls (CT) seems more evident in the lower graph, which represents the difference between the two curves. To statistically evaluate excess bins
Figure 4. Final average distribution of bins between PK and CT. Included are bins corresponding to times < 0.781 s, which do not cause emission of a beep.

2 76 W i l l i a m G i r o l d i n i a n d L u c i a n o P e d e r z o l i
up to around the 1.5-s mark, it was decided to calculate (for each of the 38 PK and CT files) the ratio between the sum of all bins between 0 and 1.5 s inclusive and the sum of all bins between 1.5 s and 4.0 s inclusive.
The ratio is an adimensional number pertaining only to the temporal distribution of Peaks and not their absolute number; furthermore, from specific tests carried out, it has been shown to be indifferent to variations in the RSG signal caused by ambient temperature in the range between 18 and 30 °C. The average value of these ratios, for all the PK and CT tests, was calculated in two time intervals (A & B), as shown in Table 1.
The differences between PK and CT are important for both data
including audio feedback (for t > 0.781 s) and data without feedback. The sensation reported by some participants who reported hearing rapid sequences of beeps was thus shown to be correct and statistically significant.
We also note that the standard deviation of the PK data is decidedly higher than the CT control data. It’s highly probable, in some subjects, that this can be attributed to the presence of flurries of Peaks in rapid succession caused by PK mental action on the RSG.
Henceforth, the value of the “PK ratio A/B” (shown in Table 1, line 1) will be called “PK effect.” The value of the PK effect will be used to divide the trials into two groups, as described in the following paragraph.
TABLE 1Significance of Ratio between Two Time Intervals A and B Including and
Excluding Bins < 0.78 s (SD = standard deviation of 38 results)
Intervals PK ratio A/B CT ratio A/B Student’s t Probability
A = 0–1.5 sB = 1.5–4.0 s
5.45 SD = 1.54 4.84 SD = 1.07 2.00 p < 0.025
A = 0.78–1.5 sB = 1.5–4.0 s
3.77 SD = 0.88 3.43 SD = 0.59 1.92 p < 0.03

E E G A c t i v i ty W h e n I n f l u e n c i n g a n R S G 2 7 7
DISCUSSION
Analysis of EEG Signals
EEG signals were subjected to a pre-processing stage comprising high-pass filtering at 0.8 Hz, followed by signal normalization and their filtration in the 1–42 Hz band, followed by storage of these EEG files for further analysis. Normalization of EEG signals was necessary in that the signals can vary in amplitude by as much as a factor of 3 between subjects and must be made uniform as much as possible for ease of processing.
After carrying out the above pre-processing, the signals were analyzed using the Fourier transform (FFT) on contiguous intervals of 1 s, with a rectangular window and no overlap, to define their frequency distribution between 1 and 42 Hz with a resolution of 1 Hz. These procedures were performed for each session, and the FFT overall average of all sessions also was calculated.
Moreover, to evaluate the degree of correlation—or ‘synchrony’—between the different areas of the cerebral cortex, another parameter was defined and calculated and was called “Brain Synchrony.” In the literature, many different methods can be found to calculate such ‘synchrony’, and often the results cannot be directly compared because of the different logical–mathematical procedures used. We can for example cite Perez et al. (2017), Thatcher et al. (2008), and Diwaker et al. (2016), who used methods based on a calculation of the Pearson correlation between two rough signals, or even between the envelope of frequencies of two signals given by the FFT, and so on, including more complex variations.
In this work the chosen procedure was the following: From the 14 EEG recordings of the 14 channels (Nc = 14), the Pearson linear correlation was calculated (for each 1-s interval), for a total of 91 correlations between all possible pairs of signals, as obtained from the following expression:
Number of Correlations = (Nc2 – Nc) / 2 = 91
Using the PK effect defined above, the trials were divided into two groups. The first group contained 18 trials—called “PKgood”—who had obtained a PKeffect > 5.40, while the second group had 20

2 7 8 W i l l i a m G i r o l d i n i a n d L u c i a n o P e d e r z o l i
trials—called “PKbad”—with a PKeffect < 5.40. Then the two groups were compared using the average values of their Fourier analyses and the Brain Synchrony calculation of each of their 91 correlations.
Results are shown in Figure 5.
Figure 5. The top graph shows the Fourier analysis of two groups (PKgood & PKbad): We see that the PKgood group shows more intense Beta and Gamma activity (from 15 to 42 Hz). The bottom graph shows, in decreasing order, the 91 Brain Synchrony values of the two groups: We see that the PKgood group has a lower average value.

E E G A c t i v i ty W h e n I n f l u e n c i n g a n R S G 2 7 9
The graph relative to the Fourier analysis (top graph) shows that the PKgood group displays, in a statistically significant way (see Table 2), a more intense Alpha, Beta, and Gamma (15–42 Hz) activity compared with PKbad. The PKgood group also shows an average Brain Synchrony value (of correlations between all 91 electrode pairs) that is lower than that of the PKbad group. Furthermore, when Brain Synchrony was calculated only on the eight fronto–temporal EEG locations, the difference became statistically significant with p < 0.025 (Figure 6).
TABLE 2Results from the PKgood and PKbad Groups in the Different EEG Bands
and the Two Types of Synchrony
Frequency Band PKgood PKbad Student’s t Probability (one-tail)
Delta (1–4 Hz) 27.2 SD = 3.2 28.22 SD = 3.5 t = 0.92 n.s.Theta (4–8 Hz) 19.5 SD = 2.4 18.3 SD = 2.8 t = 1.42 n.s.Alpha (8–12 Hz) 20.8 SD = 2.9 18.9 SD = 3.6 t = 1.80 p < 0.05Beta & Gamma (15–42 Hz) 9.3 SD = 1.7 8.1 SD = 1.9 t = 2.05 p < 0.025General Synchrony 37.9 SD = 7.3 43.2 SD = 11.5 t = 1.71 p < 0.05Frontal Synchrony 41.1 SD = 7.3 47.1 SD = 10.2 t = 2.10 p < 0.025
Figure 6. The PKgood group displays a lower Synchrony value compared with the PKbad group, especially in the fronto–temporal locations (AF3, AF4, F7, F8, F3, F4, Fc5, Fc6).

28 0 W i l l i a m G i r o l d i n i a n d L u c i a n o P e d e r z o l i
Neurophysiological Interpretation of Observed Differences
Generally, in the literature, for example in Adewale and Panoutsos (2019) and Roy et al. (2016), the increase in EEG activity in Theta, Beta, and Gamma ranges is associated with an increase in mental workload, while Alpha activity depends on circumstances. The observed decrease in the PKgood group’s Brain Synchrony can also be associated with an increase in mental workload, in other words more intense attention and effort toward a mental task, in this case being the attempts at influence on the RSG to obtain more frequent beeps. As mentioned above, it is difficult, if not impossible, to compare Brain Synchrony (or Coherence) data in the literature because of the logical–mathematical methods used, which strongly differ among studies; however, it seems reasonable to conclude that the PKgood group obtained better results because the participants put in greater mental effort in the influence attempt on the RSG, producing greater mental work.
Also, in a study by W. Giroldini (2020) dedicated to NeuroMarket-ing and titled “EEG global response to videoclips and NeuroMarketing,” which is based on the same analysis methods used in this work, the EEG activity of many subjects was recorded both before and while watching videos, requiring attention and mental effort: The results were perfectly commensurate with those presented in this work. It was found that during the viewing of these videos there was a reduction in Brain Synchrony and a significant increase in activity within the Theta and Gamma ranges, while activity in the Alpha range decreased a little. In particular, if subjects have their eyes closed (such as in this study’s PK tests), the Alpha signal may increase, whereas when watching a video with eyes open the signal in the Alpha band normally decreases.
Analysis of the ERPs (Event Related Potentials)
Participants in the study would hear a short beep each time the RSG’s output signal exceeded, in absolute value, the pre-determined threshold. Each short auditory stimulus, like a beep, had a corresponding characteristic ERP (Event Related Potential) well-known and described in the scientific literature and commonly used in Neurology. The EEG signals were filtered in the Alpha band (8–12 Hz) and therefore the time-locked epochs corresponding to the beeps were mediated according to
E E G A c t i v i ty W h e n I n f l u e n c i n g a n R S G 28 1
the standard procedure for obtaining participants’ ERPs. To then obtain the average ERP of many participants, instead of
just calculating the simple average of EEG signals (using the stimulus start as a reference point)—with its resulting effect of partial reciprocal cancellation due to time lags between the ERPs of different subjects—we preferred to use signal power (which does not have this disadvantage) according to the following formula:
ERP= ∑i= 1
N
S ( x )2
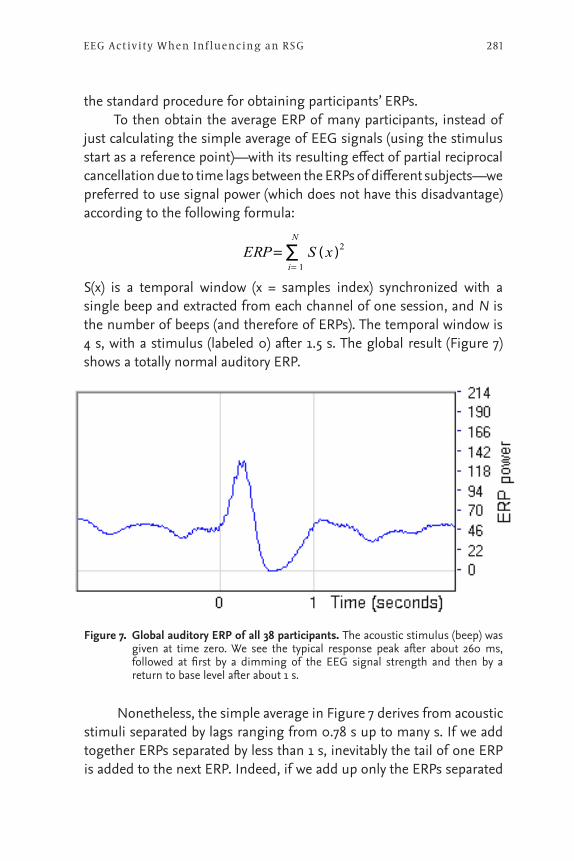
S(x) is a temporal window (x = samples index) synchronized with a single beep and extracted from each channel of one session, and N is the number of beeps (and therefore of ERPs). The temporal window is 4 s, with a stimulus (labeled 0) after 1.5 s. The global result (Figure 7) shows a totally normal auditory ERP.
Figure 7. Global auditory ERP of all 38 participants. The acoustic stimulus (beep) was given at time zero. We see the typical response peak after about 260 ms, followed at first by a dimming of the EEG signal strength and then by a return to base level after about 1 s.
Nonetheless, the simple average in Figure 7 derives from acoustic stimuli separated by lags ranging from 0.78 s up to many s. If we add together ERPs separated by less than 1 s, inevitably the tail of one ERP is added to the next ERP. Indeed, if we add up only the ERPs separated

282 W i l l i a m G i r o l d i n i a n d L u c i a n o P e d e r z o l i
from each other by less than 1 s, we get the graph in Figure 8.
If instead we add together all the ERPs with separation > 1.2 s, we get the graph in Figure 9.
Figure 8. Adding up ERPs separated from each other by less than 1 s, we clearly see the preceding ERP during the pre-stimulus phase.
Figure 9. Graph obtained by adding together ERPs separated by at least 1.2 s. Immediately before the stimulus, we see a peak, indicated by the arrow.
In this graph, in the pre-stimulus period just before the stimulus itself, we see a peak (indicated by an arrow) which remains even when the stimuli are separated by more than 2 s. We see this pre-stimulus
E E G A c t i v i ty W h e n I n f l u e n c i n g a n R S G 28 3
peak by filtering the EEG signals in the 8–12 Hz band (Alpha) and 12–15 Hz band (called Sensory–Motor).
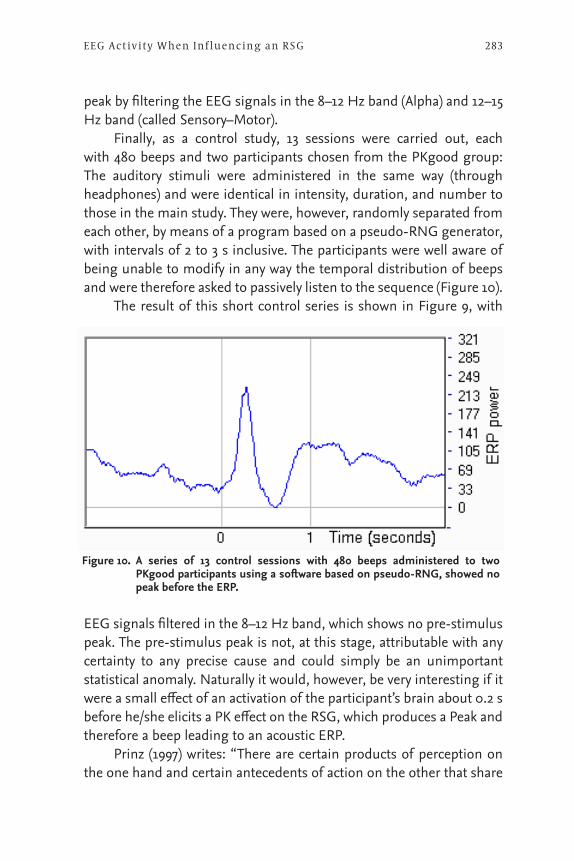
Finally, as a control study, 13 sessions were carried out, each with 480 beeps and two participants chosen from the PKgood group: The auditory stimuli were administered in the same way (through headphones) and were identical in intensity, duration, and number to those in the main study. They were, however, randomly separated from each other, by means of a program based on a pseudo-RNG generator, with intervals of 2 to 3 s inclusive. The participants were well aware of being unable to modify in any way the temporal distribution of beeps and were therefore asked to passively listen to the sequence (Figure 10).
The result of this short control series is shown in Figure 9, with
Figure 10. A series of 13 control sessions with 480 beeps administered to two PKgood participants using a software based on pseudo-RNG, showed no peak before the ERP.
EEG signals filtered in the 8–12 Hz band, which shows no pre-stimulus peak. The pre-stimulus peak is not, at this stage, attributable with any certainty to any precise cause and could simply be an unimportant statistical anomaly. Naturally it would, however, be very interesting if it were a small effect of an activation of the participant’s brain about 0.2 s before he/she elicits a PK effect on the RSG, which produces a Peak and therefore a beep leading to an acoustic ERP.
Prinz (1997) writes: “There are certain products of perception on the one hand and certain antecedents of action on the other that share

284 W i l l i a m G i r o l d i n i a n d L u c i a n o P e d e r z o l i
a common representational domain” (see also Melnik et al., 2017). We could perhaps theorize that the desire to ‘hear more beeps’ generates neural activity similar to that associated with a voluntary action (e.g., muscular), but prior to it. This effect that precedes voluntary action usually occurs exactly within the 8–15-Hz range, i.e., in the Alpha and Sensory–Motor range. On the other hand, if we filter EEG signals from this study in a range like the Delta–Theta (between 1 and 8 Hz, and with ERPs separation > 1.2 s), we don’t see any pre-stimulus peak, only the normal ERP.
CONCLUSIONS
This exploratory study suggests that when the cerebral activity (via EEG) of a person attempting to mentally influence a random signal generator, and the RSG’s signal itself, were simultaneously recorded, we see not only that the PK effect on an RSG is possible, but also that it could be associated with specific cerebral psychophysiological variations. Of special interest is the emergence of EEG characteristics consistent with substantial mental effort during the intent to influence the RSG. The potential for this new research field is broad and is worth independent replication.
Finally, it is worth highlighting the, for now, only circumstantial existence of cerebral activation preceding the post-beep resulting ERP. If this cerebral activation before a Peak generated by mental action on the RSG were to be confirmed, it would be an important step forward in the understanding of mind–matter interaction.
REFERENCESAdewale, Q., Panoutsos, G. (2019). Mental workload estimation using wireless EEG
signals. bioRxiv preprint. https://www.biorxiv.org/content/10.1101/755033v1 https://doi.org/10.1101/755033Bösch, H., Steinkamp, F., & Boller, E. (2006). Examining psychokinesis: The
interaction of human intention with random number generators—A meta-analysis. Psychological Bulletin, 132(4), 497–523. https://doi.org/10.1037/0033-2909.132.4.497
Diwaker, S., Gupta, S. K., & Gupta, N. (2016). Classification of EEG signals using corre-lation coefficient among channels as features extraction method. Indian Journal of Science and Technology, 9(32). htpps://doi.org/10.17485/ijst/2016/v9i32/100742

E E G A c t i v i ty W h e n I n f l u e n c i n g a n R S G 28 5
https://www.researchgate.net/publication/308127706_Classification_of_EEG_Signal_using_Correlation_Coefficient_among_Channels_as_Features_Extraction_Method
Giroldini, W. (1991). Eccles’s model of mind–brain interaction and psychokinesis: A preliminary study. Journal of Scientific Exploration, 5(2), 145–161.
Giroldini, W. (2020). EEG global response to videoclip and Neuromarketing. (Submitted paper.) https://www.researchgate.net/publication/342779717_EEG_global_response_to_videclip_and_NeuroMarketing
Heseltine, G. L. (1977). Electronic random number generator operation associated with EEG activity. Journal of Parapsychology, 41, 103–118.
Heseltine, G. L., & Mayer-Oakes, S. A. (1978). Electronic random generator opera-tion and EEG activity: Further studies. Journal of Parapsychology, 42, 123–136.
Jahn, R. G., Dunne, B. J., Nelson, R. G., Dobyns, Y. H., & Bradish, G. J. (1997). Correlations of random binary sequences with pre-stated operator intention: A review of a 12-year program. Journal of Scientific Exploration, 11(3), 345–367.
Melnik, A., Hairston, W. D., Ferris, D. P., & König, P. (2017). EEG correlates of sensorimotor processing: Independent components involved in sensory and motor processing. Scientific Reports, 7, 4461. https://www.nature.com/articles/s41598-017-04757-8
Pederzoli, L., Giroldini, W., Prati, E., & Tressoldi P. (2017). The physics of mind–matter interaction at a distance. NeuroQuantology, 15(3), 114–119.
https://www.researchgate.net/publication/327614649_The_Physics_of_Mind-Matter_Interaction_at_a_Distance
https://doi.org/10.2139/ssrn.2968430 https://doi.org/10.14704/nq.2017.15.3.1063Perez A., Carreiras, M., & Andoni Duñabeitia, J. A. (2017). Brain-to-brain entrain-
ment: EEG interbrain synchronization while speaking and listening. Scientific Reports, 7, 4190. https://www.nature.com/articles/s41598-017-04464-4
Prinz, W. (1997). Perception and action planning. European Journal of Cognitive Psychology, 9(3), 129–154.
Radin, D. I., Michel, L., Galdamez, K., Wendland, P., Rickenbach, R., & Delorme, A. (2012). Consciousness and the double-slit interference pattern: Six experiments. Physics Essays, 25(2), 157–171.
Radin, D., Michel, L., Pierce, A., & Delorme, A. (2015). Psychophysical interactions with a single-photon double-slit optical system. Quantum Biosystems, 6(1), 82–98. https://doi.org/10.4006/0836-1398-25.2.157
Roy, R. N., Charbonnier, S., Campagne, A., & Bonnet, S. (2016, April). Efficient mental workload estimation using task-independent EEG features. Journal of Neural Engineering 13(2), 1–10. https://pubmed.ncbi.nlm.nih.gov/26877162/
https://doi.org/10/1088/1741-2560/13/2/026019

286 W i l l i a m G i r o l d i n i a n d L u c i a n o P e d e r z o l i
Schmidt, H. (1987). The strange properties of psychokinesis. Journal of Scientific Exploration, 1(2), 103–118.
Schmidt, H., & Terry, J. C. (1976). Search for a relationship between brainwaves and PK performance. In W. G. Roll (Ed.), Research in parapsychology (pp. 30–32). Scarecrow Press.
Stanford, R. G. (1977). Experimental psychokinesis: A review from diverse per-spectives. In B. B. Wolman (Ed.), Handbook of parapsychology. Van Nostrand.
Thatcher R. W., North, D. M., & Biver C. J. (2008, December). Development of cortical connections as measured by EEG coherence and phase delays. Human Brain Mapping, 29(12), 1400–1415. https://doi.org/10.1002/hbm.20474
https://www.researchgate.net/publication/5887520_Development_of_Cortical_Connections_as_Measured_by_EEG_Coherence_and_Phase_Delays