eecs.ucf.edueecs.ucf.edu/.../fa2010sp2011/g05/senior_design_ii_fin… · web viewalthough we are...
TRANSCRIPT

The Electric Golf CartGroup Members:
Patrick TaylorAndrew Bridges
Nick PapernoDavid Yeung
Sponsors:Progress Energy

Table of Contents1 Introduction 1
1.1 Executive Summary 11.2 Initial Proposal 2
2 Research 92.1 Golf Cart 9
2.1.1 Golf Cart 92.1.1.1 Basic Golf Cart 92.1.1.2 Rough Terrain Utility Vehicle 102.1.1.3 Burden Carrier 10
2.1.2 Motor 102.1.2.1 Series wound DC motor 112.1.2.2 Shunt wound DC motor 122.1.2.3 Compound DC motor 132.1.2.4 Motor efficiency 13
2.1.3 Batteries 142.1.3.1 Golf Cart Battery 152.1.3.2 Lead Acid Battery 162.1.3.3 Capacity of a battery 172.1.3.4 Battery Charging 19
2.1.4 Battery charging techniques 212.1.4.1 Constant Voltage charging 212.1.4.2 Constant Current charging 222.1.4.3 IU charging 232.1.4.4 IUI charging 24
2.1.5 Motor speed control 252.1.5.1 Resistor controller 252.1.5.2 PWM controller 272.1.5.3 PWM regen controller 30
2.2 Human Interactive Display 312.2.1 CFAG160128B-TMI-TZ Monitor with
T6963CFG Controller Overview 332.2.2 CFAF320240F-T-TS Touch Screen with
SSD2119 Controller Overview 372.2.3 EA EDIP320J-8LWTP Touch Screen Overview 39
2.2.4 NHD-3.5-320240MF-ATXL#T-1 Touch Panel with Associated Driver and Controller Overview 40
2.2.5 NT39016D Driver Overview 412.2.6 LCD Controllers Overview 44
2.2.6.1 HD44780U Display Controller 442.2.6.2 SED 1335 LCD controller 472.2.6.3 S1D15G00 LCD Controller 48
2.2.7 Nios II 3C25 Microprocessor with LCD Controller Overview 50
2.2.7.1 Nios II 3C25 Microprocessor with LCD Controller 50
i
2.2.8 Arduino Uno Overview 512.3 Control Systems 52
2.3.1 Spartan 6 522.3.2 ATmega644 532.3.3 ATtiny44A 552.3.4 PIC 18F4610 562.3.5 Programming 592.3.6 Xilinx ISE 592.3.7 AVR Studios 4/BASIC Platform 59
2.4 Sensors 602.4.1 Speed Sensors 602.4.2 Voltage Sensors 612.4.3 Current Sensors 61
2.4.3.1 Open and Closed Loop Hall-effect 612.4.3.2 IC Board Mount Current Sensor 622.4.3.3 CSLT6B100 62
2.4.4 Printed Circuit Board 632.5 Solar panels 64
2.5.1 Batteries for Solar Panel System 642.5.1.1 Deep Cycle Golf Cart Battery 652.5.1.2 Sealed Marine Battery 652.5.1.3 Absorbed Glass Mats Battery 662.5.1.4 Gel Battery 66
2.5.2 Solar Cells 662.5.2.1 Mono-Crystalline Silicon Solar Cells 682.5.2.2 Polycrystalline Silicon Solar Cells 692.5.2.3 Thin Film 702.5.2.4 Amorphous Silicon Solar Cells 72
2.5.3 Damaged and Tabbed Solar Cells 732.5.4 Solar Panel Battery Charge Controller 74
2.5.4.1 Pulse Width Modulation Controller 752.5.4.2 Maximum Power Point Tracking Controller 76
2.6 Power allocation 782.6.1 Voltage Regulators 78
2.6.1.1 Linear Voltage Regulators 782.6.2 Switching Regulators 80
3 Design 823.1 Solar Panel System Design 82
3.1.1 Solar Panel 833.1.2 Solar Charge Controllers 893.1.3 Wires 91
3.2 HUD Design 923.3 Power Allocation 93
3.3.1 Voltage Regulator Design 933.4 Sensor Design 953.5 Microcontroller design 96
ii

3.6 Printed Circuit Board Design 983.7 Battery 993.8 Speed Controller 1003.9 Explicit Design Summary 101
4 Build 1034.1 Build Plan 1034.2 Initial Golf Cart Testing 1034.3 Solar Panel Installation 1044.4 Speed Controller Installation 1044.5 Sensor Installation 1064.6 Display Installation 1064.7 PCB 107
5 Prototype 1095.1 Prototype 109
6 Testing 1116.1 Battery Testing 1116.2 Display Testing 1126.3 Performance Testing 1126.4 Sensor Testing 113
6.4.1 Current Sensor 1136.4.2 Speed Sensor 1146.4.3 Voltage Sensor 115
6.5 Voltage Regulator Testing 1156.5.1 Basic function test 1166.5.2 Circuit Function Test 116
6.6 Solar Panel Test 1176 Project Summary 118
8.1 Summary 1188.2 Final Budget and Financing 1188.3 Project Operations 119
6 Personnel 1216.1 Suppliers 1216.2 Consultants 121
iii

1 Introduction1.1 Executive SummaryIn recent years, major industries throughout the world have been focused on saving nonrenewable resources. There are two main ways of accomplishing this. One way, is to use nonrenewable resources in a more efficient way. The other, is to simply stop using nonrenewable resources all together. This has sparked new life into the field of power engineering.
Our project focuses on making a more efficient, solar assisted, electric vehicle. Although we are implementing our design on a golf cart, our methods could be applied to almost any other electric vehicle. Our first design issue focuses on using a battery in a more efficient manner. Optimizing the use of a battery is possible because we do not need to draw the maximum energy at all times. The amount of energy that needs to be drawn depends on the driver's needs.
The goal of this project is to implement a design a more energy efficient golf cart that changes its energy consumption based on the driver's needs. The golf cart will have the capability to switch between three modes of operation that will be designed. In a high performance mode, the golf cart will draw maximum energy from the battery. Although this will result in the shortest battery life, the golf cart will accelerate much faster and have a higher top speed. In an efficient mode, the golf cart will focus on saving energy. This will significantly increase battery life, but will result in slower acceleration and lower top speed. In the last mode, standard mode, the golf cart will have a balance between energy consumption and performance.
Although these modes could be implemented based on how much battery life is remaining, the driver will be the one controlling which mode of operation he or she wants to use. There will be a monitor to display what mode of operation the golf cart is currently in and buttons to allow the driver to change between modes of operation. If the driver knows he will making a short distance drive and wants to get there as fast as possible, he or she will simply touch a button to switch into high performance mode. This way he or she can get there as fast as possible and still not have to worry about the battery running out of energy. If the driver is planning on a long trip and is worried about the battery possibly running low, then the user can hit the button to switch into efficient mode. Otherwise, the typical mode of operation will be standard mode.
In order to help the driver make a decision on what mode of operation to use. The monitor in the golf cart will display information such as battery life remaining and speed. The driver will be able to see the differences in speed in each of the modes of operation. The speed and the battery life remaining will allow the driver to act accordingly.
1
A main goal of this project is to design a new method of controlling the speed of the golf cart. Typically, electric golf carts are controlled by using a variable resistor that is adjusted based on the accelerator pedal input. Simply altering this variable resistor system to change modes will not save energy. A new system must be implemented that has energy conservation as a top priority. A system will be designed that draws energy from the battery in small pulses. The smaller the pulses are, the more energy that will be saved. The larger the pulse, the faster the golf cart will go. In conclusion, the high performance mode will not need to use this pulsing system. It will constantly draw energy from the battery at a steady rate. Standard mode will use the pulsing system in a way that will increase battery life. Efficient mode will use even smaller pulses to save the most battery power. The tradeoff between energy and speed will be vital for designing an energy efficient pulsing system for the golf cart.
1.2 Initial Proposal
Project Narrative Description:
The goal of this project is to make an energy efficient electric golf cart. The motivation of this project is based off designing a more efficient golf cart. The golf cart will have 3 different modes of operation: efficient, high performance and power saving. Efficient mode will be the standard mode of operation. The goal of efficient mode is to be a balance between high performance mode and power saving mode. The indirect relationship between power and efficiency is the reason multiple modes are necessary. In high performance mode, the golf cart is not as concerned with energy consumption. Instead, the golf cart will pull more energy to accelerate faster and have a higher top speed. Efficient mode, on the other hand, will focus on conserving energy to maximize the time until the golf cart runs out of energy. This conservation will result in a lower acceleration and a lower top speed. Power saving mode is automatically turned on when the golf cart has less than 15 percent of its charge remaining. In power saving mode, power is greatly reduced to maximize efficiency.
The electric power for the golf cart will come from batteries and a solar panel. The batteries can be charged from a wall outlet and by the solar panel. The batteries will be able to charge in a timely manner and hold their charge long enough to power the golf cart for a reasonable time and distance. There will be a simple system to test the batteries to see if one has become defective. There will be a touch screen in the golf cart that will control what mode it is in and display information. It will accurately display power usage, charge remaining, speed, estimated time remaining, temperature, etc.
2

Project Specifications and Requirements:
The golf cart must meet the requirements listed below in the bulletin list labeled Project Specifications and Requirements. The main idea behind the golf cart is that it must completely electrical and be a more efficient with the batteries’ charged power. Though it is a scaled down, it has the same basic concept as an electric car. From that ideology, it must be able to drive like any other car. It must have a Human Display, or HUD. With this it will show all the information coming from the sensors and the golf cart. The accuracy from the HUD must be very high. Through the HUD, the idea of the 3 modes of operations can be acted upon. There are 3 modes. First mode is normal. This will allow the golf cart to act like it normally would. The next mode is power saving mode, which allows the golf cart to use the least amount of power, and this has to be switched to when the batteries reaches 15% of their charge. The next mode is high performance mode. This mode allows the batteries to be drained at a faster rate and allow everything to run with more power. In this mode the maximum speed, which has to reach at least at 20 miles per hour, can be achieved.
Project specifications and requirements Must implement a power control and saving system on an electric golf cart Must have 4 wheels Must have the ability to steer and move forwards and backwards Must have 6, 6V flooded lead acid batteries Will go into a power saving mode at 15% charge remaining Must have a power efficiency mode with a max speed of 10 mph Must have a high performance mode with max acceleration possible and a
top speed of at least 20 mph Must have a 4’by 5’ solar panel on the roof Must have a heads up display(HUD) The HUD must have a LCD display and at least 3 buttons to change into
modes or have a touch screen display The HUD must display the charge remaining within a 3% accuracy The HUD must display the range remaining within a 0.5 mile accuracy The HUD must display the power usage of all components in the vehicle
to a 3% accuracy
Milestones:
The bulleted list below is an initial proposed idea of what the project’s milestones will be. This was compiled by the amount of time left in the semester and how much work was thought would be needed to complete each task given in the milestones. Half go along with the writing of the initial research and design documentation. The other half of the milestones are what work will be needed completed on the actual physical golf cart during the spring semester. This shows what will be completely built and/or program hopefully by the end of the date specified.
3

Milestones October 18, 2010 – Table of Context completed October 18, 2010 – Proposal for Progress Energy completed November 15, 2010 – Design of HUD and Control Systems November 30, 2010 – Detailed design Completed December 2, 2010 – Report completed January 3, 2011 – Have a cart acquired January 10, 2011 – Begin building internal systems February 28, 2011 – Have control systems completed March 30, 2011 – HUD programming completed and battery & solar
panels integrated April 30, 2011 – All systems have been integrated and working together
Electric Golf Cart Block Diagram:
Now in Figure 1.2 1, the electric golf cart block is diagram is shown. Each individual part of the block diagram has been assigned to a certain group member due to their abilities and expertise. This shows a broad view on the project as a whole. It allows the main parts to be shown. It is mainly split into two sections, which are the primary and secondary systems. The primary and secondary systems are shown in greater detail in sections, which will be discussed in a following section. Now the primary system deals with the original and main functions of the golf cart. The steering, driving, and braking will be dealt with in the primary system. Now the outputs that will come from the primary system is the speed of the golf cart, speedometer for the golf cart, odometer of the golf cart, and the if the brakes are on or off for the golf cart.
4

Figure 1.2 1 – Electric Golf Cart Block Diagram
Primary System Block Diagram:
In Figure 1.2 2, the basic block diagram for the primary systems is shown. Now each part will be assign to a certain group members previously done in the main block diagram that is shown above. Now the heart of the primary systems is the microcontrollers. These will be designed by the group, unless it is deemed unnecessary, or too expensive to do. Now the microcontroller will assign tasks to each other part. It directly controls the current control. The current control then controls the engine. Now the engine will indirectly affect the speedometer, odometer, and the information for the HUD. The brake pedal is already a part of any given golf cart in a minimal running conditions. The brake pedal’s information is sent to the brakes as well as to the microcontroller and then throughout the system to slow down the golf cart. The accelerator, which again should be a part of the golf cart as long as the golf cart is in minimal working condition, will send it’s information to the microcontroller, and from there it will be sent to the rest of the diagram. Now the mode controller is a major part of the primary system. It limits or removes the limits on how the golf cart can drive. The mode controller will send to the microcontroller, which of the three modes will be in use. The user will choose which of the three modes the golf cart will be running in through the HUD. From there it will then send the information to the current controller and the engine. The information will tell the engine and current controller what speed to hit and how much power can be used in the process.
5

Figure 1.2 2 – Primary System Block Diagram
Secondary System Block Diagram:
In Figure 1.2 3, the secondary system’s block diagram is shown. This diagram mainly shows how the HUD operates by displaying the outputs on the screen to the user and gains the input from the users. It also shows that the HUD will deal with the lights on the golf cart. Now the display buttons will either be part of the screen, which the screen will be a touch screen at that point, or manual buttons that will be separate and run on its own controller. The display buttons’ information will be sent to the HUD and then sent to the necessary microcontrollers needed to complete the task. The display screen will get all the necessary information from the HUD. This can include but not limited to the speed of the golf cart, the distance it has gone, the charge left in the battery, and what mode the golf cart is currently in.
6
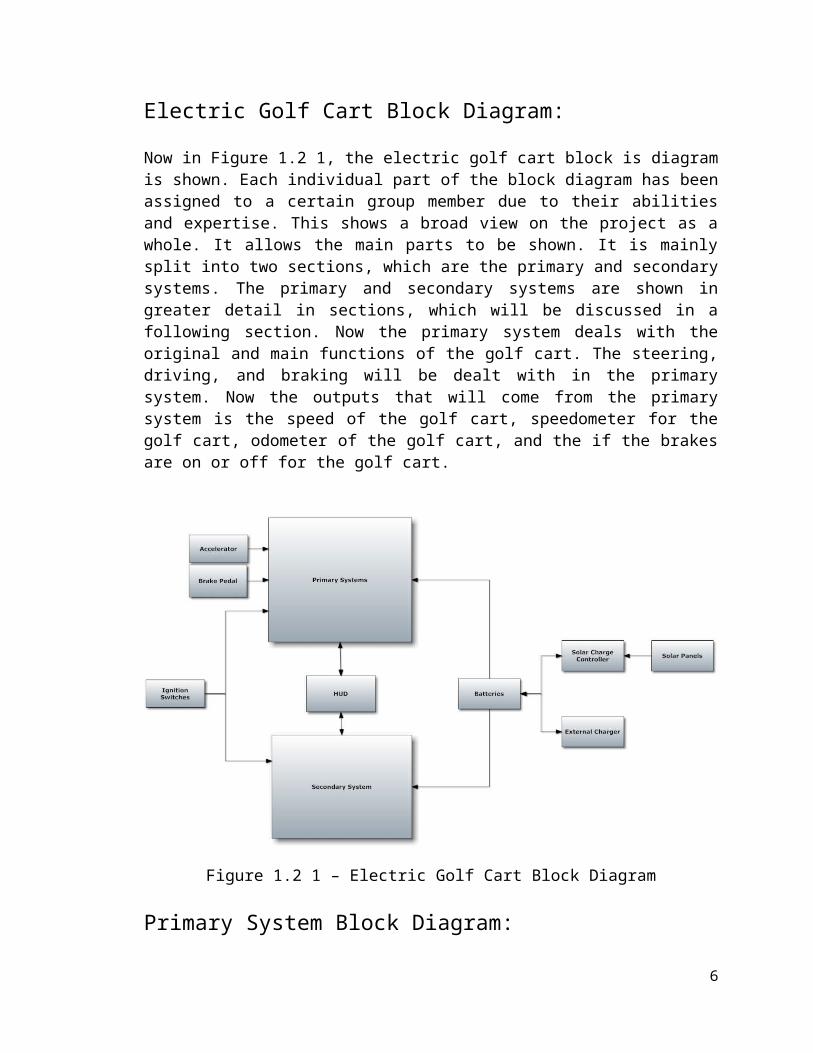
Figure 1.2 3 – Secondary System Block Diagram
Projected Budget:
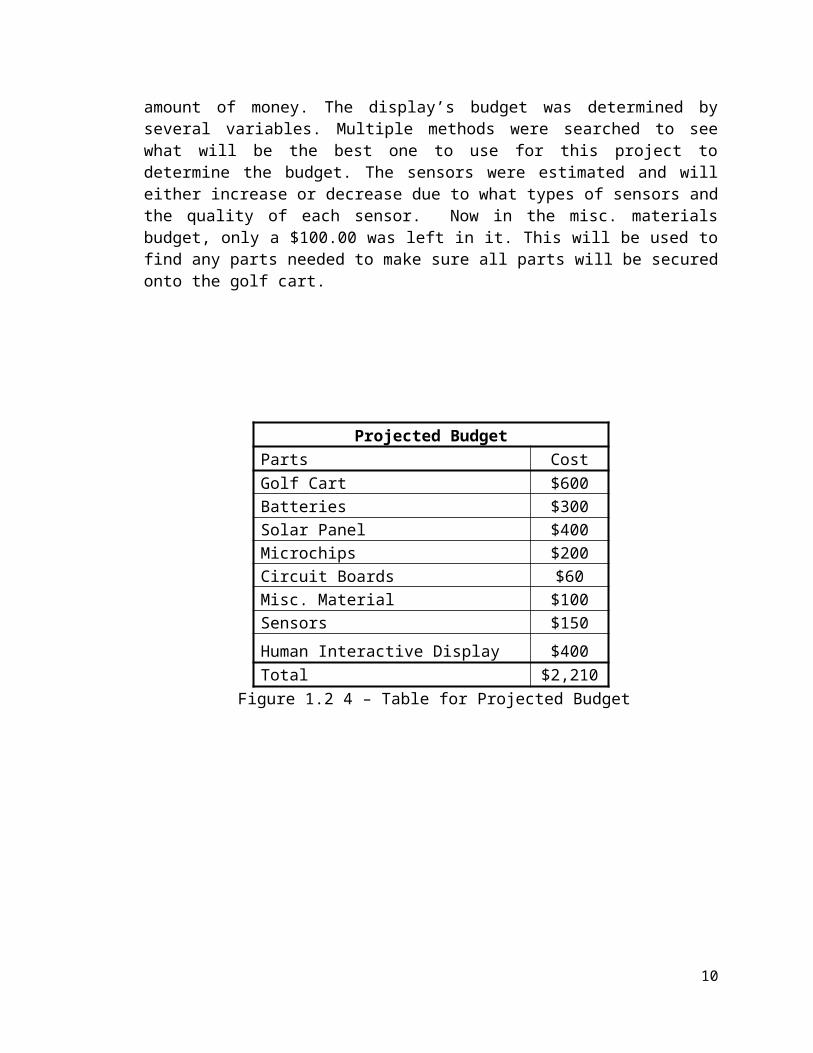
The projected budget is shown in Figure 1.2 4, which can be found below. The projected budget was initially done without deep and in great detail research. Hopefully the golf will be donated to the project; however, if not a used golf will be located with a price of hopefully $600.00. That price is a bit low even for most new golf carts. The batteries originally will be at least three standard 12 Volt car battery, which can be found anywhere. The solar panel will cost around $400.00 for only one panel. If necessary to get another solar panel for the project, the funds will be redistributed. The redistributed budget will make sure that the solar panels will have enough money to meet the amount needed to complete the project’s solar section. Microchips aren’t too expensive and research shows that they can be purchased in either kits or in individual chips. Thus only $200 dollars will be projected in the budget. Now the Human interactive display is our main part that will cost a decent amount of money. The display’s budget was determined by several variables. Multiple methods were searched to see what will be the best one to use for this project to determine the budget. The sensors were estimated and will either increase or decrease due to what types of sensors and the quality of each sensor. Now in the misc. materials budget, only a $100.00 was left in it. This will be used to find any parts needed to make sure all parts will be secured onto the golf cart.
7

Projected BudgetParts CostGolf Cart $600Batteries $300Solar Panel $400Microchips $200Circuit Boards $60Misc. Material $100Sensors $150
Human Interactive Display $400Total $2,210
Figure 1.2 4 – Table for Projected Budget
8

2 Research2.1 Golf Cart
The standard electric golf cart runs off of six 6V or six 8V deep-cycle DC batteries connected in series. The different type of batteries that can be used and their affects on performance is discussed further in the battery section of this research document. Depending on the batteries used the golf cart can have a 36V or 48V DC motor. The motor is discussed further in the motor section of this research document. Another component to the electric golf cart is the speed control board.
2.1.1 Golf CartWhile the general class of small, 4 wheeled, multi-passenger vehicles was invented for golf, they've been modified to take on all kinds of other roles. Depending on the needs, the preferred type of golf cart may become a specialized vehicle described below. There are several different types of golf carts available. Initially, golf carts used to be electrically powered, which required a charged battery. Electric carts produce lesser noise and produce very little pollution though they have a relatively low top speed. Pricing of the golf cart can vary widely due to type of carts and what kind of features are including in the golf cart. The terrain of the desired area of use becomes another factor in what kind of golf cart is needed. A cart, which is meant to be used on a flat surface, will have different design and specifications than one that is suitable for an area that is many hills and steep inclines. These are factors that are used to determine the price of the golf cart as well as the type of cart used. [1][2]
2.1.1.1 Basic Golf CartIn its most basic form, golf carts have a 2-person bench seat and a rack that is meant to hold a couple of golf bags. Most basic golf carts are upgraded either immediately or shortly after for comfort, safety, capacity, or performance. Some of the most popular upgrades and improvements to the golf cart are: more passengers seating, a top roof, sides for the driver and passenger, larger tires, improved suspension, windscreens, a sound system, and more comfortable seats and upholstery. The upside to the basic golf cart is that there are many upgrades available to it. Golf carts are not normally street-legal; however, there can be exceptions made. A golf cart can be outfitted with appropriate safety features that include turn signals, headlights, brake lights, a windshield, and seatbelts, When a golf carts has meet all of the requirements of the local authorities, it can become street legal. There is only one federal legislation that governs the use of golf carts that operate at less than 25 mph, so states, counties, cities, and towns can freely make their own regulations on the matter. Many communities encourage the use of golf carts as a mode of transportation.
9

In certain locations, golf carts may even qualify for a rebate or tax write off. A version of the basic golf cart is a personnel carrier. Personnel carriers are considered to be the buses of the golf cart fleet. They are typically used for transporting much more passengers than a normal golf cart. They normally can carry 6 or sometimes 8 passengers comfortably. [1][2]
2.1.1.2 Rough Terrain Utility VehicleRough terrain utility vehicles are considered to be the off-road version of the basic golf carts. They typically have larger and more powerful engines than the basic golf cart. They have the same basic features of golf carts, which are bench seats for 2 to 4 people and 4 wheels, but also have many other features that are more similar to an all terrain vehicles such as an ATVs. The tires are usually large knobby tires that have better traction in mud and loose gravel, have higher ground clearance, and stronger suspension for going off-road paths. These vehicles can carry a larger payload and more passengers than most ATVs and most golf carts. For carrying cargo, there are many choices to choose from that include flat platforms, beds with solid walls or rails, or hydraulic dump beds. A version of the rough terrain utility vehicle is the trail utility vehicle. Trail utility vehicles are used to carry hay, seed, and other essentials around large farms or ranches. Like the rough terrain utility vehicles, they can get around on the dirt tracks of the back woods. They, however, cannot normally go over 40 mph like most ATVs. They can normally carry two people and a large load. [1][2]
2.1.1.2 Burden CarrierHeavy utility vehicles called burden carriers can be used to complement other types of material handling equipment, like fork trucks. The largest models of the burden carrier can carry up to several thousand pounds of cargo and tow even more, yet they're small enough to go into spaces, which fork trucks can't. They are not designed for rough outdoor use like rough terrain utility vehicles, but they have the ability to carry considerably more weight than any basic golf carts and rough terrain utility vehicle. These are popular in manufacturing and other industrial companies, where they are used to carry around smaller items. [1][2]
2.1.2 MotorAn important part in maximizing the efficiency of our golf cart is making sure that we have the right motor for the job. For this the different technologies of electric motors must be analyzed. AC electric motors will be excluded from our comparison due to the nature of our power source. The batteries provide DC power and though it is possible to convert DC to AC, it will decrease efficiency.The next area of focus is how the magnetic field is generated within the motor. The magnetic field can be generated using permanent magnets or field windings.
10
Field windings are a type of electromagnet that can be used in place of a permanent magnet. Motors that use permanent magnets do not draw current from the power source to generate a magnetic field. This method uses less energy, however the magnetic field generated is constant and depends on the magnets used in the motor. This limits the overall power output of the motor and the speed control. Motors that use field windings have a greater degree of control over the magnetic field generated, and so have more control over the power output and speed. For these reasons motors that use permanent magnets will be excluded from the comparison.
The varying types of DC motors come from the different connections between the field windings and the armature windings. The field windings create the magnetic field within the motor and the armature windings are the windings that the work is done on. In a golf cart motor the field windings are found in the stator and the armature windings are found on the rotor. The four basic combinations are series-wound, shunt-wound, compound wound, and separately-excited. Separately-excited DC motors require an external power source to supply current to the field windings and are not commonly used in golf carts.
2.1.2.1 Series wound DC motorThe series-wound motor is when the field windings and the armature windings are connected in series. This makes it so the current though each winding is the same. Series wound motors generally have the most starting torque when compared to other connection types and have a good torque output per ampere ratio. They perform best when there are heavy loads and high speed is not necessary. Disadvantages of using series wound DC motors are that the speed control is more difficult, and when running under no load conditions they experience runaway. Runaway conditions are when the motor’s RPM exceeds the maximum rated speed of the motor. This may cause damage to the motor and in some cases case it to come apart. The series wound DC motor is also the most common motor used in golf carts. For the series would diagram and torque vs. speed curve refer to figure 2.1 1. [9]
11
Figure 2.1 1 - Speed vs. torque ratio for series wound motor
2.1.2.2 Shunt wound DC motorA shunt wound DC motor is when the field windings are connected in parallel with the armature windings. The shunt wound motor has less starting torque than the other motor connections, but offers more speed control over a wide range of loads. The torque of a shunt wound motor also decrease as speed increases. Shunt wound motors are also less prone to runaway conditions experienced by series wound motors. The shunt wound motor also allows for regenerative breaking which would increase the energy efficiency of the golf cart. The disadvantage of using a shunt wound motor is that they run at an almost constant speed regardless of the load. This would make variable speed control of the golf cart more difficult to attain. For the shunt wound diagram and torque vs. speed curve refer to figure 2.1 2. [9]
Figure 2.1 2 – Speed vs. torque ratio for a shunt wound motor
12

2.1.2.3 Compound DC motorThe compound wound DC motor is one that uses both series wound and shunt wound field windings. This offers a compromise of performance between the series and shunt wound motors. The compound wound motor offers good starting torque and speed stability over a wide range of loads. Compound wound motors are generally used in applications where series wound and shunt wound motors fail. The disadvantage of a compound wound DC motor is the same in a shunt wound motor. The speed stability makes variable speed control difficult to attain. For the compound wound configuration as well as the speed vs. torque curve refer to figure 2.1 3. [9]
Figure 2.1 3 Speed vs. torque ratio for a compound wound motor
2.1.2.4 Motor efficiencyTo determine the most efficient operating condition of the golf cart, the losses of power experienced by a series wound DC motor need to be identified. Within a DC electric motor energy is first converted from electrical energy to magnetic energy, then from magnetic energy to mechanical energy. With each conversion a portion of the input energy is lost. Refer to figure 2.1 4 to see where each conversion takes place, and what part of the motor it is associated with. The motor experiences electrical power losses in the copper wiring used to supply current to the field and armature windings. The motor experiences magnetic energy losses in the form of eddy current losses. Finally the motor experiences mechanical energy losses in the form of friction in the bearings, frictions in the brushes, and ventilation losses. The degree of control of these losses is determined by the control over the inputs into the motor. For this project we can control the current input to the motor and the rotational speed of the motor. With
13

control over these two inputs the only losses that can be affected are the electrical power losses in the copper wiring and the mechanical losses caused by the friction in the bearings. These losses can be modeled with the following equations. [48]
Ploss=R∗I2
Equation 2.1 1 - Copper power losses
Ploss=45∗(dg )3∗√n3∗10−6
Equation 2.1 2 – Slip ring bearing losses
Ploss=150∗(dg )3∗n∗10−6
Equation 2.1 3 – Roller bearing losses
Where: R = 1.68∗10−8Ω the resistivity of copper I is the current through the copper wiring d g is the diameter of the bearing in cm n is the speed of the motor in RPM
Each of these losses is relatively negligible when compared to the total output power of the motor. Also to reduce the copper losses the current supplied to the motor would have to be decreased. To reduce the friction of the bearings the speed of the motor would have to be decreased. Performing either of these actions would decrease the performance of the golf cart and prevent us from reaching the project specifications. The only option that reduces energy losses without decreasing performance is the use of roller bearings over slip bearings. [48]
2.1.3 BatteriesOne very important consideration while trying to increase the range and efficiency of our golf cart is the batteries used as our power source. The type of battery chosen will be determined based on how well it serves the needs of our golf cart. The batteries will have to meet the following criteria.
1) The main focus of the project is to increase the range and efficiency of the golf cart, so the batteries chosen must have the greatest energy density available to our budget.
2) The batteries will have to have an efficient charge to discharge ratio and be able to handle partial charging from the solar cells
3) Recharging should be possible from both a wall outlet and the solar cells placed on the golf cart.
4) Since efficiency is a factor in our project the charge to discharge ratio of the batteries must be considered to reduce energy lost in charging.
14

5) The lifetime of the golf cart is expected to reach 10 years so the batteries must be able to handle many cycles of charging and discharging.
6) In addition to providing the motor with the voltage and amperage needed, all of the other electronics added to the golf cart must also be powered.
To determine what type of battery will meet all of our needs and analysis of the batteries available to us must be conducted.
2.1.3.1 Golf Cart BatteriesThe only type of golf cart battery that is produced on a large scale is the lead acid battery, even though other technologies such as nickel cadmium and lithium ion batteries provide a higher energy density and greater efficiency. Figure 2.1 5 shows the ratio of energy density to power density for different battery technologies. [4]
Figure 2.1 5 – Energy Density vs. Power density for various battery technologies
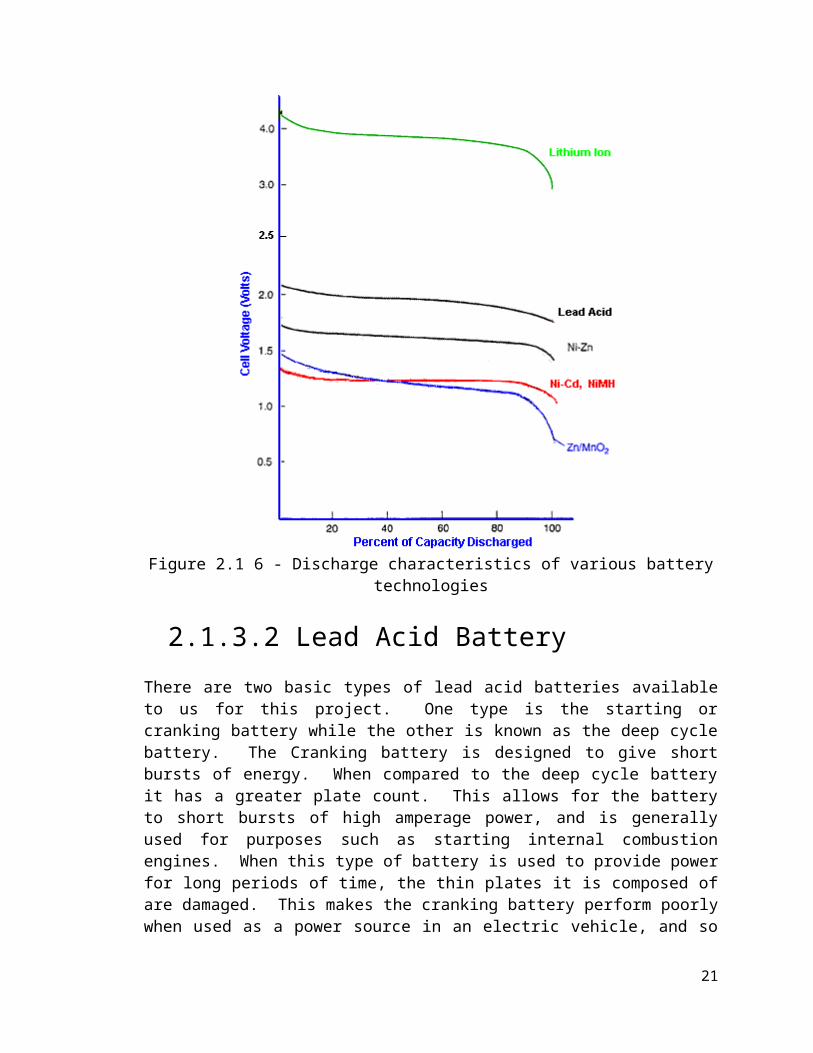
As shown in the diagram the lead acid battery provides the worst ratio of energy density and power density of the batteries compared. It is still the most commonly used battery technology due to its easy of production and the volts per cell it provides. Other advantages of using lead acid batteries include their ability to be charged and discharged many times, and a relatively stable discharge of the battery. For the discharge characteristics of varying lead acid batteries please refer to figure 2.1 6. [4]
15

Figure 2.1 6 - Discharge characteristics of various battery technologies
2.1.3.2 Lead Acid BatteryThere are two basic types of lead acid batteries available to us for this project. One type is the starting or cranking battery while the other is known as the deep cycle battery. The Cranking battery is designed to give short bursts of energy. When compared to the deep cycle battery it has a greater plate count. This allows for the battery to short bursts of high amperage power, and is generally used for purposes such as starting internal combustion engines. When this type of battery is used to provide power for long periods of time, the thin plates it is composed of are damaged. This makes the cranking battery perform poorly when used as a power source in an electric vehicle, and so is not a good choice for our golf cart. The second type of lead acid batter is called the deep cycle battery. The deep cycle battery provides less instant energy but has the capacity to deliver a steady amount of current over long periods of time. The deep cycle battery is also composed of thicker plates and can withstand many charging and discharging cycles. The best performance and lifespan of deep cycle batteries occurs when they are allowed to discharge between 20% and 50% of their total charge. It is possible to cycle down a deep cycle battery to 20% of its total charge but this degrades the life expectancy of the battery. [5]
16

There are 3 types of lead acid deep cycles batteries the wet cell, gel cell and absorbed glass matt (AGM). The wet cell battery is composed of lead plates saturated in a sulfuric acid and electrolyte solution. During discharge the sulfuric acid in the solution bonds to the lead plates releasing electrons in the process. These electrons then generate the current flow for the battery. During charging of the battery, current is supplied from an outside source. The electrons being added by the supplied current break the bonds of the sulfuric acid. The acid then mixes with the electrolyte solution and is ready to undergo the process again to create charge. The charging efficiency of a deep cycle wet cell battery is typically 85%. [5]
The 2nd type of lead acid battery is the gel cell. The gel cell lead acid battery is classified as a valve regulated lead acid battery (VRLA). To produce a gel cell battery the electrolyte solution found in a wet cell battery is mixed with a silica content which causes the solution to turn into a gel. The formation of a gel causes the once liquid solution to become immobile within the battery. This can provide many useful benefits because there is no risk in spilling the electrolyte solution as there is with a wet cell battery. Gel cell batteries do not have to be placed upright within the golf cart and allow for a different battery set up within the cart. Gel cell batteries are also more resistant to vibrations and spilling when the cart is driving in rough terrain. The negative effects of having gel cell batteries are that it is more sensitive to being overcharged and had a lower charging voltage than the wet cell battery. The charging efficiency of a deep cycle gel cell battery is typically 90%. [5]
The 3rd type of lead acid battery is the AGM, which is also a VRLA. The electrolyte solution within an AGM is held by a mat of glass fibers. With these fibers the lead plates within the battery are free of having to support their own weight. This aspect allows for a design that reduces the internal resistance of the battery. The AGM batteries can also be charged and discharged much faster than the other types of lead acid batteries. They are also able to withstand severe shock and vibration. The negative side to having AGM batteries is that they cost significantly more than wet cell or gel cell batteries. The charging efficiency of a deep cycle AGM battery is typically 95% and higher. [5]
2.1.3.3 Capacity of a batteryThe total capacity of a battery is generally referred to as C and is measured in amp-hours (Ah). This is a measurement of the amount of chemical energy a battery can store. To produce electricity a battery undergoes a chemical reaction that is not 100% efficient. The available capacity of a battery depends in part on how fast the battery is charged or discharged, and is always less than the total capacity. The available amp-hour capacity of a battery is usually measured at a discharge rate that will leave it depleted in 20 hours. This is known as the C20 rate of discharge. If the battery is discharged faster than the C20 rate then the
17

available capacity will be less. To determine the available capacity of a battery for current draws larger than the C20 rate Peukert’s equation is used. [5]
I n∗T=CEquation 2.1 4 – Peukert’s Equation
Where I is the current drawn of the battery n is the Peukert number for the battery T is the time over which the battery is discharged C is the available capacity of the battery
The specific Peukert number varies depending on the battery used, and can range from 1.05 for some AGM lead acid batteries up to 2 for some wet cell lead acid batteries. The typical Peukert number for lead acid batteries is 1.35. The effect of the current draw and Peukert number is shown in figure 2.1 7. [5]
Figure 2.1 7 – Nominal capacity vs. Current draw
Temperature is another factor that effects the chemical reaction a battery undergoes to produce electricity. For most lead acid batteries the available capacity is measured at 25. When the temperature is below 25 the viscosity of the electrolyte solution within the battery is higher. The increased viscosity decreases the diffusion of ions and so decreases the capacity of the battery. As the temperature increases above 25 the capacity of the battery will increase. However, the increased capacity at higher temperatures is a short term benefit. At higher temperatures the electrodes in the battery begin to corrode. This
18

decreases the electrode reactions in the battery and so decreases capacity. The effect of temperature on a batteries available capacity can be modeled with the following equation. [6]
C=C25∗(1−α∗(25−T ))Equation 2.1 5 – Temperature effects on battery capacitance
Where C = capacity at temperature T C25 = battery capacity at 25 α = the temperature coefficient T = Temperature of the battery.
The temperature coefficient α varies from battery to battery. The effect of temperature on available capacity is shown in figure 2.1 8. [6]
Figure 2.1 8 – Temperature effect on nominal battery capacity
2.1.3.4 Battery ChargingCharging the lead acid batteries can take up to 5 times longer than discharging them. Under normal operating conditions safe and efficient charging would take place overnight from a wall outlet. This method of charging would have no
19

impact on the use of the golf cart during the day. To meet one of the sustainability goals of this project, a different method of charging is being introduced. The golf cart must be able to be fully recharged using solar energy. The charging time required for a lead acid batter is shown below. This presents a problem in that the time available to charge the golf cart will coincide with the time it is being used. For example 4 hours of daytime use on the golf cart may require 20 hours of sunlight to recharge the batteries. There is not 20 hours of sunlight in a single day, and so the batteries would not be able to be fully charged. Partial charging of the batteries will cause damage to them and reduce their overall life expectancy. To reduce damage to the batteries and overall recharge time the charging requirements and most efficient method of charging must be determined. [7]
Amp-hour RatingContinuous Current (in amps)
Equation 2.1 6 - Charge/Discharge time (hours)
To avoid over-charge chemical reactions in a lead acid battery, it is important to supply each cell with the correct voltage and current. For a 6 volt battery there are 3 cells and for a 12 volt battery there are 6 cells. If the voltage per cell is too low the battery will not charge at all. If the voltage is too high there is the potential of reaching the batteries gassing voltage. The gassing voltage is when the battery produces an excess amount of hydrogen and oxygen gas. This will not only drain the water supply of the battery, but also increases the danger of explosion. The typical charging voltage for a lead acid battery is between 2.15V volts per cell and 2.35 volts per cell. The charging voltages will vary with temperature and the nominal charge of the battery. The charging voltage and current for a depleted lead acid battery can be much higher. This is because the charging chemical reaction well occur before the over-charge chemical reactions. For a list of charging voltages with varying temperature for cyclic use charging refer to the table in figure 2.1 9. For a list of charging voltages with varying temperature for standby use charging refer to the table in figure 2.1 10. [7]
Battery Temperature
Charge Voltage per cell
Charge Voltage for a 12 Volt battery
Gassing Voltage per cell
Gassing Voltage for a 12V battery
-20 °C * 2.67 to 2.76 16.02 to 16.56 2.97 17.82-10 °C * 2.61 to 2.70 15.66 to 16.2 2.65 15.90 ° C * 2.55 to 2.65 15.3 to 15.9 2.54 15.2410 °C 2.49 to 2.59 14.94 to 15.54 2.47 14.82
20

Battery Temperature
Charge Voltage per cell
Charge Voltage for a 12 Volt battery
Gassing Voltage per cell
Gassing Voltage for a 12V battery
20 °C 2.43 to 2.53 14.58 to 15.18 2.415 14.4925 °C 2.40 to 2.50 14.40 to 15.00 2.39 14.3430 °C 2.37 to 2.47 14.22 to 14.82 2.365 14.1940 °C 2.31 to 2.41 13.86 to 14.46 2.33 13.9850 °C 2.25 to 2.35 13.5 to 14.10 2.30 13.8
Figure 2.1 9 - Cyclic use charging
Battery Temperature
Charge Voltage per cell
Charge Voltage for 12V Battery
Gassing voltage
-30 °C * 2.7 16.2 -20 °C * 2.34 to 2.38 14.04 to 14.28 2.97-10 °C * 2.32 to 2.37 13.92 to 14.22 2.650 °C 2.30 to 2.35 13.8 to 14.1 2.5410 °C 2.28 to 2.33 13.68 to 13.98 2.4720 °C 2.26 to 2.31 13.56 to 13.86 2.41525 °C 2.25 to 2.30 13.5 to 13.8 2.3930 °C 2.24 to 2.29 13.44 to 13.74 2.36540 °C 2.22 to 2.27 13.32 to 13.62 2.3350 °C 2.20 to 2.25 13.2 to 13.5 2.30
Figure 2.1 10 Stand by use charging
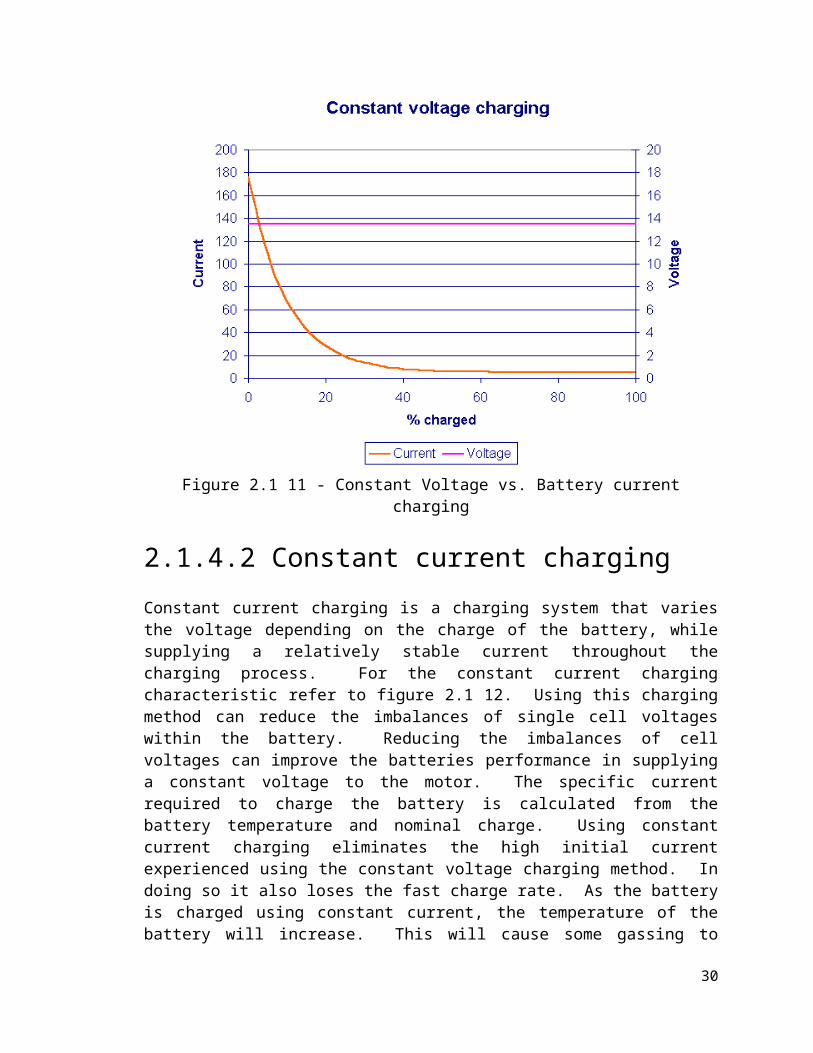
2.1.4 Battery charging techniques2.1.4.1 Constant Voltage chargingConstant voltage charging, also known as constant potential charging, supplies the batteries with a relatively constant voltage throughout the charging process. This method of charging supplies the batteries with a high initial current due the larger potential difference between the charger and the battery. The large flow of current causes the batteries to charge quickly at first. Under optimum conditions a constant voltage charging system can charge a battery with up to 70% of the amount depleted in as little as 30 minutes. As the battery charge increases the potential difference that has been driving the current decreases. This causes the overall charging speed to rapidly decrease as the battery approaches a full charge. The decreasing charge rate can be used to determine when the battery has approached a full charge. For the charging characteristic of a constant voltage charging system refer to figure 2.1 11. The difficulty with using the constant voltage charging system is that our solar panels can only handle an output current of approximately 8 amps. This would limit us to using this charging technique when the battery is approximately 50% depleted. As shown in the diagram this would restrict the charging of the battery to an inefficient
21
operating condition. Another problem with using the constant voltage charging method is that the voltage supplied by the solar cells depends on the light levels. Cloudy weather conditions can make constant voltage charging difficult to implement. [3]
Figure 2.1 11 - Constant Voltage vs. Battery current charging
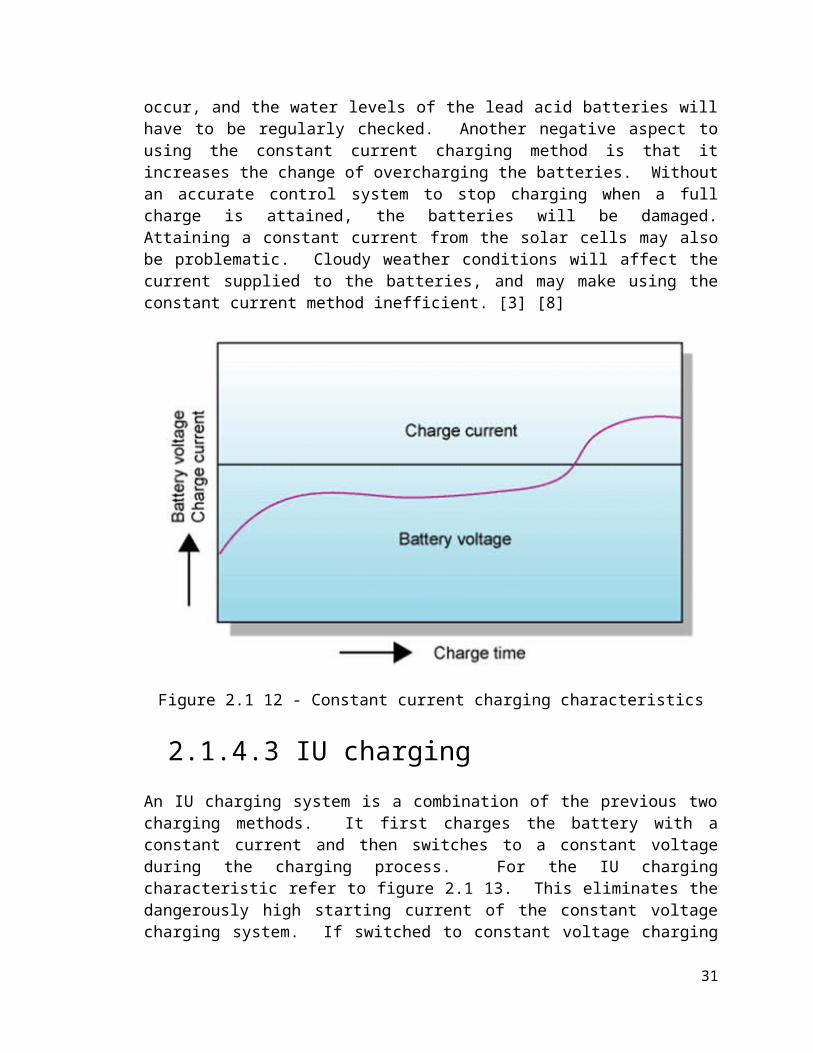
2.1.4.2 Constant current chargingConstant current charging is a charging system that varies the voltage depending on the charge of the battery, while supplying a relatively stable current throughout the charging process. For the constant current charging characteristic refer to figure 2.1 12. Using this charging method can reduce the imbalances of single cell voltages within the battery. Reducing the imbalances of cell voltages can improve the batteries performance in supplying a constant voltage to the motor. The specific current required to charge the battery is calculated from the battery temperature and nominal charge. Using constant current charging eliminates the high initial current experienced using the constant voltage charging method. In doing so it also loses the fast charge rate. As the battery is charged using constant current, the temperature of the battery will increase. This will cause some gassing to occur, and the water levels of the lead acid batteries will have to be regularly checked. Another negative aspect to using the constant current charging method is that it increases the change of overcharging the batteries. Without an accurate control system to stop charging when a full charge is attained, the batteries will be damaged. Attaining a
22

constant current from the solar cells may also be problematic. Cloudy weather conditions will affect the current supplied to the batteries, and may make using the constant current method inefficient. [3] [8]
Figure 2.1 12 - Constant current charging characteristics
2.1.4.3 IU chargingAn IU charging system is a combination of the previous two charging methods. It first charges the battery with a constant current and then switches to a constant voltage during the charging process. For the IU charging characteristic refer to figure 2.1 13. This eliminates the dangerously high starting current of the constant voltage charging system. If switched to constant voltage charging at the proper time, this method has the potential to take advantage of some of the high charge rates experienced in the beginning of the constant voltage system. It also reduces the chances of overcharging the battery near the end of the charging process. While eliminating the two major problems of the constant current and voltage systems, the IU charging method is less efficient. The overall charge time of the batteries will be increased, and so partial charging of the batteries may occur. [3]
23

Figure 2.1 13 - IU charging characteristic
2.1.4.4 IUI chargingAn IUI charging method is similar to the IU charging method and is a combination of constant current and constant voltage charging. For IUI charging characteristics refer to figure 2.1 14. The system begins with a constant current, then switches to a constant voltage, and ends by switching back to a constant current. This eliminates the extreme initial current experienced by the constant voltage charging. If switched to constant voltage charging at the proper time, this method has the potential to take advantage of some of the high charge rates experienced in the beginning of the constant voltage method. Near the end of charging the IUI system switches back to using a constant current to charge the batteries. This increases the efficiency of charging when the battery is near a full charge, and shortens the overall charge time. Switching to constant current when the battery nears a full charge increases the potential for gassing and overcharging the battery. An accurate charge controller is needed to prevent either of these problems from occurring. Due to the control of current in the beginning of the charging process, as well as taking advantage of the most efficient operating conditions of the constant current and voltage charging methods; the IUI charging method is the most efficient and safe choice for our project. [3]
24
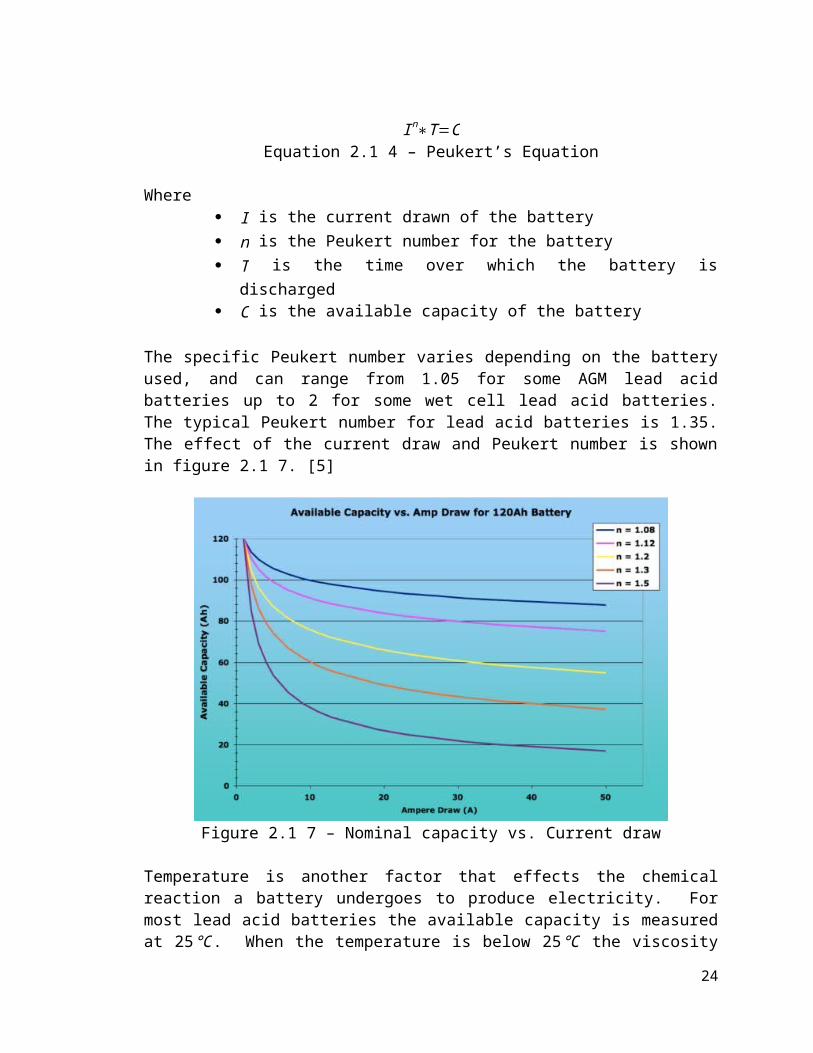
Figure 2.1 14 IUI charging characteristics
2.1.5 Motor speed control2.1.5.1 Resistor controller
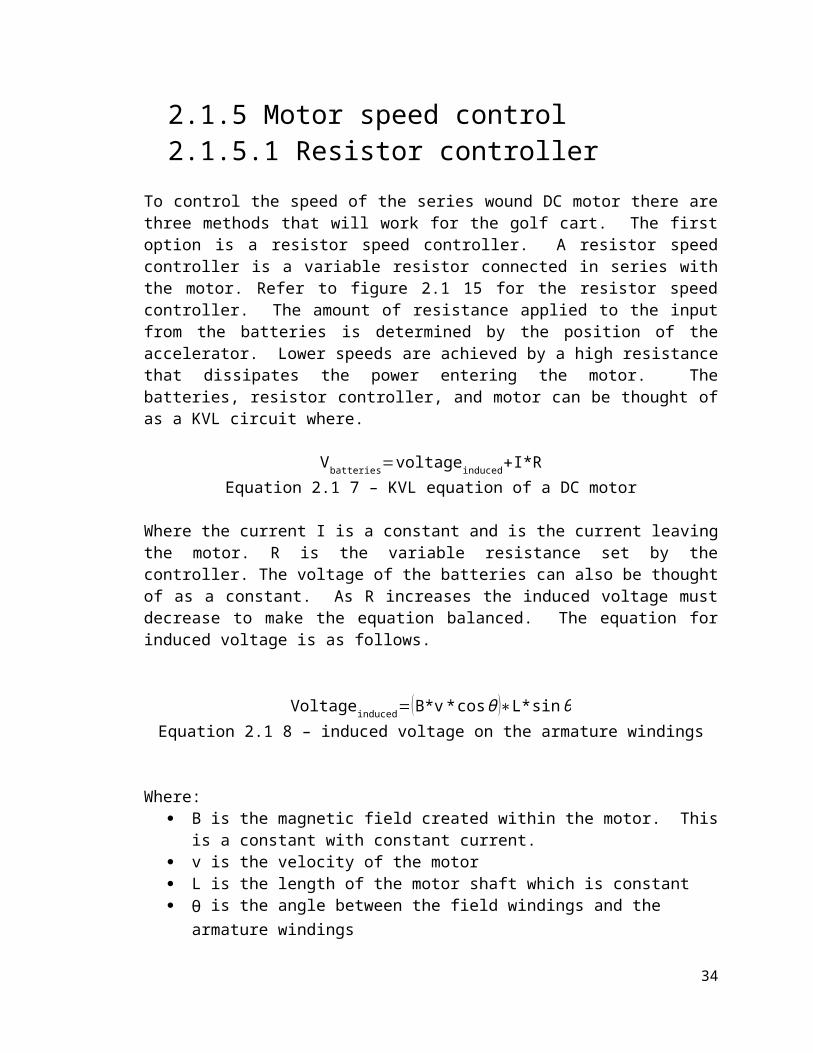
To control the speed of the series wound DC motor there are three methods that will work for the golf cart. The first option is a resistor speed controller. A resistor speed controller is a variable resistor connected in series with the motor. Refer to figure 2.1 15 for the resistor speed controller. The amount of resistance applied to the input from the batteries is determined by the position of the accelerator. Lower speeds are achieved by a high resistance that dissipates the power entering the motor. The batteries, resistor controller, and motor can be thought of as a KVL circuit where.
Vbatteries=voltageinduced+I*REquation 2.1 7 – KVL equation of a DC motor
Where the current I is a constant and is the current leaving the motor. R is the variable resistance set by the controller. The voltage of the batteries can also be thought of as a constant. As R increases the induced voltage must decrease to make the equation balanced. The equation for induced voltage is as follows.
25

Voltageinduced=(B*v * cosθ )∗L* sinθEquation 2.1 8 – induced voltage on the armature windings
Where: B is the magnetic field created within the motor. This is a constant with
constant current. v is the velocity of the motor L is the length of the motor shaft which is constant θ is the angle between the field windings and the armature windings
This relationship shows that as resistance increases the only component of the induced voltage that can decrease is the velocity.
Figure 2.1 15 showing a resistor speed controller
The benefit of using a resistor speed controller is that it makes soft starting the motor possible. The highest current experienced by the motor is when it is first supplied with current. As the motor velocity increases the current required to make it spin decreases. Without the resistor controller in place the motor would receive its maximum current and maximum voltage at the same time. This would cause a force in the motor great enough to cause damage. Also the resistor speed controller is an old technology that is very cheap when compared to other types of controllers. [10] [11] [15]
26

The negative side to using a resistor speed controller is that they are controlled mechanically by the accelerator. This would mean that the different operating modes, outlined in our initial documentation, would not be able to be met. Also it provides no control over the current leaving the batteries. With a constant current leaving the batteries the energy outputted is a constant at all times. The energy dissipated to control the speed of the motor is essentially wasted. The most efficient operating condition of the golf cart is when it is running at full speed. Refer to figure 2.1 16 to see the operation condition of the motor using a resistor speed controller. With the inefficient energy consumption and inability to set different modes of operation, the resistor speed controller will only be chosen if the budget doesn’t allow for anything else. [15]
Figure 2.1 16 Energy loss using a resistor speed controller
2.1.5.2 PWM controllerA PWM speed controller is another type of controller commonly found in golf carts. It uses phase width modulation to control the amount of energy delivered to the motor. Phase width modulation essentially pulses the motor on and off to achieve variable speed control. The width and frequency of these pulses determine the amount of energy delivered as well as the overall speed of the motor. The ratio of time on verses the time off during the period of pulsing is called the duty cycle. Refer to figure 2.1 17 to see the effects of a duty cycle with a period of 1ms on the speed of the motor. [15] [12]
27
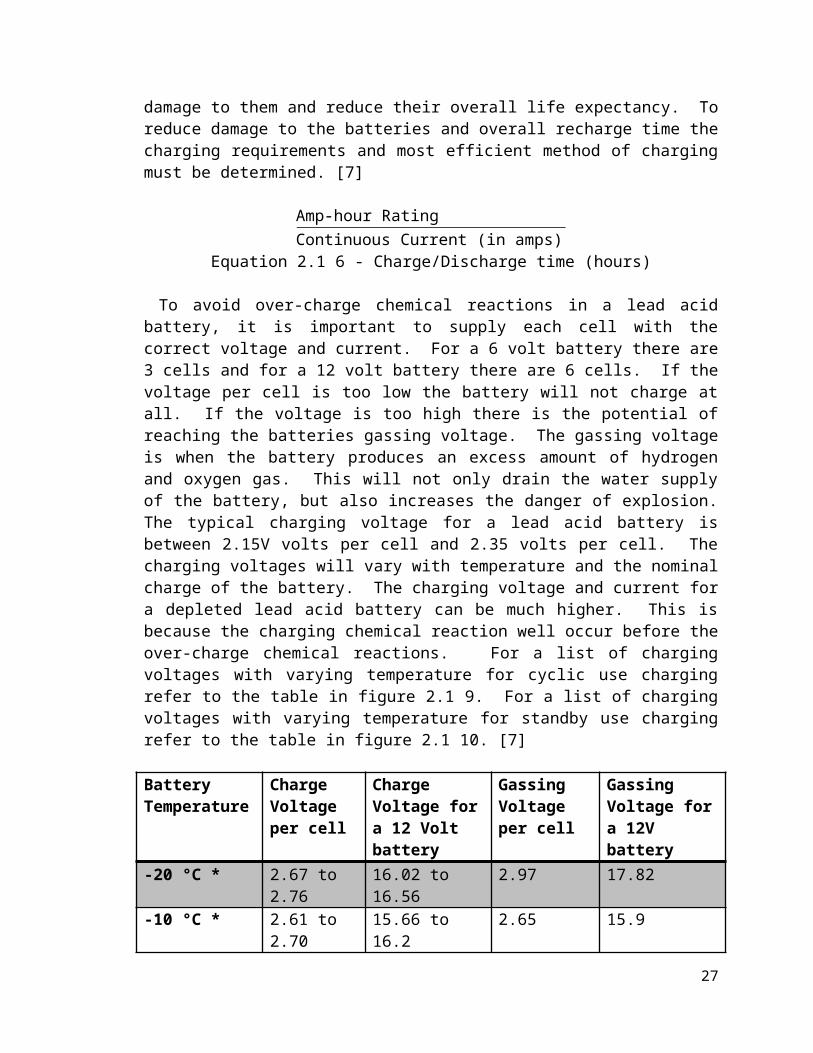
Figure 2.1 17 Duty cycle for varying speeds
Using phase width modulation very little energy supplied to the motor is dissipated within the controller. The increases the overall efficiency of the golf cart at lower speeds. Refer to figure 2.1 18 for the energy consumption of the PWM controller vs. increasing speed. The reduction in the speed of the motor by an increasing load is also reduced using a PWM controller. [15]
Figure 2.1 18 Energy Consumption by a PWM controller
28

Programmable PWM speed controllers are also available to control the speed of the motor. Using a programmable PWM controller the maximum duty cycle as well as the current supplied to the motor can be modified. This would make it possible to developing different operating modes for the golf cart, and achieve one of the design goals for this project. The specific programmable PWM controller that is being used in the comparison of motor controllers for this project is the Alltrax AXE4834. Refer to figure 2.1 19 for the Alltrax AXE4834. The AXE4834 provides many programming aspects and features that are necessary to achieve the design goals of this project. [12] [15]
Figure 2.1 19 the Alltrax 4834
The features of the AXE 4834 include: Programmable via RS232 comm port using PC or Laptop Integrated anodized heat-sink with multi bolt pattern for flexibility Fully encapsulated epoxy fill - environmentally rugged design Advanced MOSFET power transistor design for excellent efficiency
and power transfer 1/2 Speed reverse option and "Plug Brake" options available Type: DC "SERIES WOUND" motor controller Under-voltage cutback: adjustable
o 16-30 VDC, preset to 12 volts under your battery pack voltage Over-voltage shutdown: adjustable
o 30-60 VDC (48V models) (60VDC MAX) Operating Frequency: 18kHz Control voltage range; Key, Throttle and Reverse inputs: Reverse Horn Output: 50mA sink max Standby Current (Powered Up): < 35mA Throttle Input:
o ITS (inductive)o Resistive 0-5K ohm (+/-10%)o 5K-0 ohm (+/-10%)
29
o 0-5Volto 6-10Volt
Operating Temperature: -25C to 75C, 95C shutdown Adjustable via Controller Pro software:
o Throttle acceleration / deceleration rate and map profileo Armature current limito Brake current limito Under / Over-voltage shutdowno Half Speed Reverseo High Pedal Disableo Plug Brake [12]
Using the programmable aspects of the AXE 4834 the following characteristics can be controlled.
Acceleration/deceleration rate Armature current limit Brake current limit Under/over voltage shutdown Half speed reverse High pedal disable Plug brake [12]
The most efficient operation condition of the golf cart will be determined in the testing procedure for this project. [12]
2.1.5.3 PWM regen controllerThe final controller considered for this project was a programmable PWM controller with regenerative breaking capabilities. Regenerative breaking is an energy recovery method that charges the batteries as the golf cart stops. This is done by using the electric motor as an electric generator. Electric motors and generators are essentially the same machine. What separates them is the manner in which they are used. When a sufficient voltage and current are supplied to a generator or motor the armature will attempt to spin at a certain speed of rotation. If the rotational speed is decreased then the machine will act like a motor and apply force to the armature to try and maintain the speed of rotation. If the rotational speed of the machine is increased the armature will act like a generator which induces a back voltage and current that charges the batteries. Upon breaking the PWM regen controller will reduce the voltage supplied to the motor. This will in turn reduce the speed at which the armature will try to spin. The momentum of the golf car will then be increasing the speed that the armature is spinning. This will cause the back current and voltage produced to charge the batteries, while the back force produced will slow the golf cart. At slower speeds the stopping power as well as the energy return of regenerative breaking is greatly reduced. For this reason dynamic breaking
30
using friction pads is still used to bring the golf cart to a full stop. The specific PWM regen controller used in the comparison of motor controllers is the TPM400. Refer to figure 2.1 20 for the TPM400. This programmable speed controller offers many of the features that the programmable PWM controller does, and will be able to meet the design goals for this project. [13] [14]
Figure 2.1 20 the TPM400
Features of the TPM400 include
24 to 48 Volt DC Input 400 amps peak armature current 200 amps continuous armature current Contactor-less motor reversing Regenerative braking Up to 400 amps peak current Fully programmable with the Navitas PC Probit programming package
(Sold separately or I can program it for you before shipping) Safe sequencing and power-up diagnostics\ Battery over-discharge protection Current and thermal limiting Resistive or voltage throttle input Static return to off (SRO) function [13]
2.2 Human Interactive DisplayA human interactive display will be mounted in the golf cart so the driver can change modes of operation and view information related to the golf cart. The human interactive display, at its homepage, will display the current mode of
31
operation, allows the driver to change his current mode of operation, as well as display speed, and estimated charge remaining. For example, if the golf cart is currently in its standard mode of operation, and the driver desires in increase in speed and acceleration at the cost of battery life. He will have the ability to hit the “high performance mode” button, which will in turn change the mode of the golf cart from standard mode to high performance mode. The programmable logic controller for the human interactive display will need inputs from the speed sensor and the voltage sensor associated with the estimated charge remaining. With these inputs, the logic controller must be programmed to display the speed with correct formatting in miles per hour and the estimated charge remaining as a time and percentage. Two types of human interactive displays have been considered: a monitor with a controller and a combination of a touch screen monitor and programmable display controller hardware.
If a monitor with controller is used, we will still need a way for the user to be able to switch modes of the golf cart. Unlike a touch screen, a monitor does not come with any hardware that can accept input from the driver. Three buttons will need to be used which correspond to the three modes of operation. Figure 2.2 1 shows the basic hardware setup if a system with a monitor is used.
Figure 2.2 1 – Monitor Setup
A touch screen can be used with programmable controller hardware to get input from the driver and display information. This method does not require additional hardware, such as buttons, to get input from the driver. Therefore, using a touch screen will mean more programming and less hardware. Figure 2.2 2 shows the basic hardware setup if a system with a touch screen was used. The following subcategories will review various touch screens, touch screen controllers, and LCD controllers.
32

Figure 2.2 2 – Touch Screen Setup
2.2.1 CFAG160128B-TMI-TZ Monitor with T6963CFG Controller OverviewThe CFAG160128B-TMI-TZ monitor with T6963CFG controller is a good match for our project. It is reasonably priced and is one of the larger displays that have been researched at 129mm x 102mm. It has the ability to display several lines per screen which will be necessary to display information such as mode, speed, and charge remaining. It also has graphical capabilities which could be used to display the charge remaining as a graph which shows the percentage remaining. Programming is done via assembly level language. Since the display is not a touch screen, we would need to find other means of inputting data. Figure 2.2 3 shows how the CFAG160128B-TMI-TZ monitor connects with the T6963CFG controller along with the associated drivers. Refer to figure 2.2 4 for information on the various voltages associated with the power supply. [27]
General Specifications: Number of Dots: 160 x 128 Module dimension: 129.0mm x 102.0mm x 16.5mm (MAX) View Area: 101.0mm x 82.0mm Active Area: 95.96mm x 76.76mm Dot Size: 0.56mm x 0.56mm Dot Pitch: 0.60mm x 0.60mm LCD type: STN Negative, Blue, Transmissive Duty: 1/128 View Direction: 6 o'clock Backlight: LED, White Operating Temperature: Min = -20ºC, Max = 70ºC Input Voltage: Min = 0V, Max = 5V Supply Voltage for Logic: Min = -0.3V, Max = +7V Supply Voltage for LCD: Min = 0V, Max = 28V Supply Current: Min = 30mA, Typical = 42mA, Max = 50mA Response Time: Typical = 200ms, Max = 300ms [27]
33

Figure 2.2 3 - Block Diagram of CFAG160128B-TMI-TZ
Figure 2.2 4 – Power Supply of CFAG160128B-TMI-TZ
Vcc = supply voltage for logicVadj = power supply for LCD contrast adjustmentVss = groundVee = negative output voltage
34
The RAM interface is broken up into 3 components: text area, graphic area, and character generator RAM area. [27]
The T6963CFG controller is the built in controller for the CFAG160128B-TMI-TZ monitor.
General Specifications:
Display Format (pin selectable): Columns: 32, 40, 64, 80 Lines: 2, 4, 6, 8, 10, 12, 14, 16, 20, 24, 28, 32
The combination of columns and lines affects the operational frequency of the device. The combination cannot cause the frequency to exceed 5.5 MHz (See Figure 2.2 5). [27]
Figure 2.2 5 – Operational Frequencies of T6963CFG Controller
Character Font (pin-selectable):
35

Horizontal Dots: 5, 6, 7, 8 Vertical dots: 8
Font does not affect frequency unlike columns and rows. [27]
Memory Specifications: External Display Memory: 64 KB Max [27]
Important Registers:Important graphic information is stored in various registers to setup the display. A “Text Home Address” must be set which is the starting address in external display RAM for text. This starting address represents the upper left position of the display. A “Text Area Number” register is used to control the number of columns associated with the text area. [27]
A “Graphic Home Address” must be set which is the starting address in external display RAM for graphics. Again, this starting address represents the upper left position of the display. A “Graphic Area Number” is used to set the number of columns associated with the graphic area. Refer to figure 2.2 6 for information on how these registers interface with the memory and the overall explanation of data flow in the T6963CFG controller. [27]
Figure 2.2 6 - Block Diagram for T6963CFG
2.2.2 CFAF320240F-T-TS Touch Screen with SSD2119 Controller Overview
36

The CFAF320240F-T-TS touch screen with SSD2119 controller also seems to fit all the design requirements of the human interactive display. It also the lowest price touch screen that was reviewed. The lower price accounts for the smaller display area at 71.70mm x 55.65mm. Due to its smaller display area, it will be possible to use more than one of these touch screens in our overall design. Programming is done in C which could make this controller simpler to test than an assembly-programmed controller. This product is very similar to the products in previously reviewed besides the fact that one is a touch screen and one is a monitor. The major differences associated with this touch screen include a lower price, smaller screen, and programming handled in C rather than assembly. One of the most important differences is that a touch screen can have user inputs, where the monitor would need another device to do so. [26]
General Specifications: Number of Pixels: 320 x 240 pixels = 76,800 pixels Viewing Area: 71.70mm x 55.65mm Module Depth: 4.45 mm Active Area Diagonal: 88.9mm Active Area: 70.07mm x 52.55mm Weight: 22 grams Response Time: Typical = 8-17ms [26]
Absolute Maximum Ratings: Operating Temperature: Min = -20º C, Max = +70º C Storage Temperature: Min = -30º C, Max = +80º C Supply Voltage: Min = -0.3V, Max = +4V [26]
The SSD2119 controller is the built-in controller for the CFAF320240F-T-TS touch screen. Below is a list of general features that are described in more detail in Figure 2.2 7.
General Features: Number of Pixels: 320 x 240 with 262k color amorphous TFT LCD Power Supply VDDIO: 1.4V – 3.6V (I/O interface) Power Supply VCI: 2.5 – 3.6V (power supply for internal analog circuit) Output Voltage of Gate Driver: VGH-GND = 9V ~ 18V, VGL-GND = -6V ~
- 15V, VGH-VGL = 30Vp-p max Output Voltage of Source Driver: V0 – V63 = 0 – 6V max Output Voltage of VCOM drive: VCOMH = 3.0V ~ 5.0V, VCOML = -1.0 ~ -
3.0V, VCOMA = 6V max System Interface: 8/9/16/18-bit Parallel Interface (Serial Peripheral
Interface) Moving Picture Display Interface: 18-/6-bit RGB interface (DEN, DOTCLK,
HSYNC, VSYNC, DB[17:0]), VSYNC interface, and WSYNC interface Supports Low Power Consumption: Low supply voltage, low current sleep
37

mode, 8-color display mode for power saving, charge sharing functions High-speed RAM addressing functions: RAM write synchronization
function, window address function, vertical scrolling function, partial display function
Internal power supply circuit: Voltage generator, DC-DC converter up to 6x/-5x
Built-in internal oscillator Internal GDDRAM capacity: 172800 Byte Support Frame and Line inversion AC drive Built in Non Volatile Memory for VCOM calibration [26]
Figure 2.2 7 - Block Diagram of SSD2119 (Reprinted with permission from Crystalfontz)
2.2.3 EA EDIP320J-8LWTP Touch Screen OverviewThe EA EDIP320J-8LWTP Touch Screen is a more expensive solution to our human interactive display design requirements. There are several more display options and the programming is much more user friendly. It uses a mix of C and
38

what they call “macro-oriented” programming to make it simpler to produce the display you desire. Its ability to display touch buttons as shown in Figure 2.2 8 make it a good solution for our design requirements. A tab for each mode of operation: Standard, high performance and efficiency would be ideal. The user could easily switch tabs and view information associated with each mode. It is also a larger touch screen compared to the other touch screens researched. [28]
General features: LCD Graphic Display with touch panel 8 built-in fonts 3 different interface onboard: RS-232, I2C-bus, or SPI-bus 320 x 240 pixels Module dimensions: 138mm x 105mm x 12mm Viewing Area: 115.18mm x 105.00mm Power Supply: Typical = +5V, 50mA (without backlight), 240mA (with
backlight) Power-Down mode: 150uA with wakeup by touch Programmed with high-level language-type graphics commands. Operating Temperature: Min = -20º C, Max = +70º C Storage Temperature: Min = -30º C, Max = +80º C Operating Voltage: Min = 4.5V, Typical = 5V, Max = 5.5V Output Voltage: Low = 0.7V, High = 4V Output Current: 20mA Power Supply: White Backlight = 230mA, Amber Backlight = 190mA,
Backlight off = 50mA, Power down = 5-150uA 8 control outputs [28]
Touch Panel features: Up to 80 touch areas (keys, switches, menus, bar graph input) All fields can be defined with accuracy to the pixel User-friendly commands Sound tones when touched 18 different frame types to easily modularize display (See Figure 2.2 8) Different fill patterns for touch buttons and radio buttons (See Figure 2.2 8) Up to 31 different fonts available [28]
Figure 2.2 8 – Interface of EA EDIP320J-8LWTP
39

2.2.4 NHD-3.5-320240MF-ATXL#T-1 Touch Panel with Associated Driver and Controller OverviewThe NHD‐3.5‐320240MF‐ATXL#‐T‐1 touch panel comes with a built in NT39016D driver. Assuming we are using the AD7877 touch screen controller discussed in section 2.2.5.2, this is a possible solution for our human interactive display. Although this is the smallest touch screen that has been reviewed at 70.08mm x 52.96mm, this size makes it the most affordable touch screen. Where the EA EDIP320J-8LWTP reviewed in section 2.2.3.1 has all of its necessary components built in, the NHD‐3.5‐320240MF‐ATXL#‐T‐1 needs to have a 4-wire touch screen controller. Although this is the cheapest solution for our human interactive display, it turns out to be one of the more complex solutions. [29]
The NHD-3.5-320240MF-ATXL#-T-1 touch panel is an example of a touch panel without a built in controller that could be used as a solution for our design requirements. It is a slightly smaller display than the touch screen reviewed in section 2.2.2. It is small enough so multiple devices could be used. Normally, a single, larger touch screen would be an ideal solution to our design requirements, but the smaller touch screens are significantly easier and could still perform all of the tasks required. [29]
General Specifications: 89mm diagonal 320 x 240 RGB pixels Module Dimensions: 76.9mm x 63.9mm x 2.8mm Viewing Area: 70.08mm x 52.96mm Built-in NT39016D driver (see 2.2.5) No built-in controller White LED backlight 4 wire resistive touch panel 3.3V power supply [29]
Electrical Characteristics: Operating Temperature: Min = -20º C, Max = +70º C Storage Temperature: Min = -30º C, Max = +80º C Digital Supply Voltage: Min = 3.0V, Typical = 3.3V, Max = 3.6V Supply Current (assuming VCC = 3.3V) = 8.6mA Supply Voltage for LCD: Min = 13.5V Backlight Supply Voltage: Min = 18.6V, Typical = 19.2V, Max = 21V Backlight Supply Current: Typical = 20mA, Max = 25mA [29]
40

2.2.5 NT39016D Driver OverviewThe NT39016D driver is the built in driver for the NHD-3.5-320240MF-ATXL#-T-1 touch panel. This driver has the capabilities to be interfaced with even higher quality touch panels with a greater resolution. It was designed in a flexible manner in order to have the ability to be integrated with a wide variety of TFT-LCD touch panels. [29]
General Features: Single-chip solution for 960 x 240 dot TFT LCD and smaller 8-bit resolution 256 gray scale Supports 8-bit / 24-bit digital RGB Supports 2 sets of 3-wire commands for internal parameters setting Built in DC to DC power supplies Configurable color filter type Operating Frequency: 30MHz (Max) Stand-by mode for low power consumption [29]
Absolute Maximum Ratings:Driver should not run at absolute maximum ratings. They are for stress purposes only. Running at absolute maximum ratings could cause damage to the device.
Logic supply voltage, VDD: -0.5V to +5V Analog supply voltage, VDDA: -0.5V to +7.5V Supply voltage, VDDP: -0.5V to +5.5V VGH~VGL: -0.3V ~ +25V Storage Temperature: -55º C to +125º C Operating Temperature: -20º C to +85º C [29]
The NHD‐3.5‐320240MF‐ATXL#‐T‐1 Touch Panel reviewed in section 2.3.4.1 does not come with a controller. The AD7877 is an example of a 4-wire touch screen controller that could be used. [32]
General Features: 4-wire touch screen interface LCD noise reduction feature User programmable conversion parameters On-chip temperature sensor 3 auxiliary analog inputs 2 direct battery measurement channels (0.5V to 5V) 3 interrupt outputs Touch pressure measurement Wake up on touch function 2.7V to 5.25V power supply [32]
41

Touch Screen Principles:A 4-wire touch screen has two flexible, transparent, resistive-coated layers that are separated by a small gap. These layers are composed of the X layer and the Y layer. The X layer has conductive electrodes running down the left and right edges allowing for excitation voltage in the X direction. Similarly, the Y layer has conductive electrodes running along the top and bottom edges to allow for excitation voltage in the Y direction. The voltage produced at any given point is proportional to its X and Y direction, allowing the mapping of a coordinate system. When the screen is touched, the two layers make contact, the X layer electrodes and the Y layer electrodes are sensed, voltages are measured, and the X and Y coordinates can then be found. The pressure can be sensed by measuring the contact resistance between the layers. Figure 2.2 9 shows the input structure and how the x and y coordinate system is set up for a touch panel. Figure 2.2 10 shows how after these x and y coordinates generate reference voltages and the overall use of the registers and logic components. [32]
Figure 2.2 9 - AD7877 Input Structure
42

Figure 2.2 10 - AD7877 Block Diagram
The AR1000 is a cost effective touch screen solution. It supports 4-wire, 5-wire, and 8-wire touch sensor interfaces. It also has many power saving features such as sleep mode and standby. In its power saving modes, it can be activated by either touch or communication input. It supports UART, I2C, and SPI as forms of communication. Figure 2.2 11 shows the basic flow of data in the AR1000. [34]
Figure 2.2 11 – AR1000 Block Diagram
As discussed in “Touch Screen Principles” in section 2.2.5.2, touch screens convert excitation voltages into the X and Y coordinates. Based on these coordinates, the system can recognize where the screen has been touched.
43

Figure 2.2 12 shows how the AR1000 controller is interfaced to get the X and Y coordinates. [34]
Figure 2.2 12 – 5-wire AR1000 Setup
2.2.6 LCD Controllers OverviewThe HD44780U (discussed in section 2.3.6.1) and the SED 1335 (discussed in section 2.3.6.2) are examples of LCD controllers that could be used. The HD44780U is one of the simplest LCD controllers and can only be used to control up to 2 lines of LCD output. For our project, we would need a minimum of 3 HD44780U's to display the information related to the golf cart. Although this method might be the least attractive in terms of looks, it is one of the more simple and cost efficient solutions. The SED 1335 is much more complex of a an LCD controller compared to the HD44780U. Where the HD44780U only allows 2 lines of display on a small LCD, the SED 1335 has much more advanced control options for much larger LCD’s. If we are looking just at cost as a determining factor, the HD44780U's with small LCD's would be a good solution for our human interactive display. Assuming we have the ability to spend more money, the SED 1335 is a more attractive solution because it allows us to display all information on a single, bigger LCD. [30][31]
2.2.6.1 HD44780U Display ControllerOverview:The HD44780U is a display controller that can be used for LCD displays. It is used for very small (80 x 8 bit) displays which means that using one would not allow us to implement our display requirements. Multiple controllers and small
44

display would have to be purchased to display the information such as battery life, mode of operation, speed etc. This would perhaps be the simplest and cheapest solution to our design, but other solutions seem to be more practical and user friendly. [30]
General Features: Can be configured to drive a liquid crystal display under the control of a 4-
bit or 8-bit microprocessor Low power consumption: 2.7V – 5.5V Liquid Crystal Display Driver Power: 3.0V to 11V 80 x 8-bit display RAM (80 characters max) 9,920-bit character generator ROM for 240 character fonts. Pin compatibility with HD44780S For smaller, more simple LCD displays [30]
Registers:The HD44780U has an instruction register and a data register which are both 8-bit. The instruction register is responsible for storing commands such as “display clear” and “cursor shift”. It also can hold address information for display data RAM and character generator RAM. The instruction register can only be edited by the MPU. [30]
The data register is used to temporarily store data to be written into display data RAM or character generator RAM. For data transfer operations, the last step would be obtaining the data transferred from the data register by the MPU. [30]
There is a busy flag that is used to prevent instructions from being executed from the instruction register. This busy flag is checked before any instruction is executed. If it is a 1, the HD44780U is an internal operation mode. The busy flag must be a 0 for instructions to occur. [30]
An address counter is used to assign addresses to the display data RAM and the character generator RAM. When addresses of instructions are written to the instruction register, the addresses are then sent to the address counter. From the instruction, it can decide whether the address corresponds to display data RAM or character generator RAM. [30]
Figure 2.2 13 shows an example of the instruction register (IR), busy flag, address counter, display data RAM (DDRAM), and character generator ram (CGRAM). [30]
45

Figure 2.2 13 – Table of Register Implementation of HD44780U
Character Generator ROM (CGROM) is used to generate 5 x 8 dot or 5 x 10 dot character patterns from 8-bit character codes. [30]
Character Generator RAM (CGRAM) gives the user the ability to rewrite character patterns by program. [30]
Figure 2.2 14 shows how the registers, ROM, RAM, MPU, and drivers are connected and how information flows throughout the HD44780U. [30]
Figure 2.2 14 - HD44780U Block Diagram
Modifying Character Patterns:
New character patterns can be created by the user.1. Determine relationship between character codes and patterns.2. Create a listing that indicates the relationship between EPROM
addresses and data.
46

3. Program the character pattern into the EPROM.4. Send EPROM to Hitachi.5. Computer processing on the EPROM is performed at Hitachi to create a
character pattern listing which is sent back to the user. [30]
Within the scope of our project, creating character patterns could be useful to generate simple graphs to correspond with percentages.
2.2.6.2 SED 1335 LCD controllerThe SED1335 is a controller that can display text and graphics on an LCD. It stores text, character codes, and bit-mapped graphics data in external frame buffer memory. Functions include transferring data from the MPU to the buffer memory, reading memory data, converting data to display pixels, and generating timing signals for the buffer memory, LCD. [31]
General Features: Text mode, graphics mode, and combined text/graphics mode Three overlapping screens in graphics mode Up to 640 x 256 pixel LCD resolution Programmable cursor control Smooth horizontal and vertical scrolling 160, 5 x 7 pixel characters in internal mask-programmed character
generator ROM Up to 64, 8 x 16 pixel characters in external character generator ROM Low power consumption: 3.5mA operating current and .05uA standby
current. [31]
Microprocessor Interface:The SED 1335 controller can be interfaced to a processor in the 8080 or 6800 family. It uses six main control signals for the databus which include SEL1, SEL2, A0, RD, WR, and CS. A0 is connected to the lowest bit of the system address bus. SEL1 and SEL2 are used to change the operations of the RD and WR pins depending on what MPU are used. Figure 2.2 15 shows how the SED 1335 controller is integrated with a microprocessor to show how data flows throughout the device and to the LCD display. [31]
47

Figure 2.2 15 - SED 1335 Block Diagram
2.2.6.3 S1D15G00 LCD ControllerThe SID15G00 LCD Controller is designed for smaller LCD displays (132 x 160 pixels RGB). It has the ability to run two different modes. One mode focuses on performance, and the other mode focuses on running at minimum power. This would be the first touch panel or LCD controller that could change modes based on user input. If the golf cart is in high performance mode, even this LCD controller could change into its associated high performance mode. Figure 2.2 16 shows the basic flow of data in the S1D15G00. [35]
48

Figure 2.2 16 – S1D15G00 Block Diagram
General Features: Direct data display with display RAM Partial display function (used to save power) Low current consumption Supply Voltage
Power for input/output system power: 1.7V – 3.6V Power for internal circuit operation: 2.6V – 3.6V Reference power for booster circuit: 2.6V – 3.6V
49

Power for liquid crystal drive: 12.0V – 21.0V Wide operational temperature range: -40ºC – 85ºC [35]
2.2.7 Nios II 3C25 Microprocessor with LCD Controller Overview
The Nios II 3C25 Microprocessor with built in LCD Controller is a good solution for our design requirements. In previous sections, LCD controllers do not come with MPU units. Choosing this device would simplify the building process, as an MPU will not have to be configured with an LCD controller. The Nios II 3C25 can be implemented in an FPGA system which allows for a lot of design customization. It has three different “cores” which are used to easily configure the device to user-specific needs. A size-optimized economy core, performance-optimum fast core, and a balanced optimum size-to-performance standard core. Although the Nios II 3C25 is typically used to connect to an LCD device, it also supports LCD touch panels. Refer to Figure 2.2 17 for a block diagram of the Nios II 3C25's features. [33]
2.2.7.1 Nios II 3C25 Microprocessor with LCD Controller
Memory Features: Common Flash Interface (CFI) flash memory
16 MB DDR SDRAM memory
32 MB SD/MMC card serial peripheral interface (SPI)
Supports up to 1-Gbit SD card memory Synchronous SRAM memory
1 MByte [33]
Communication Features: Ethernet MAC 10/100/1000 Base T JTAG UART with integrated read and write FIFO UART for RS-232 serial communication 2 wire-interface dedicated to LCD controller interface [33]
Display Features: Integrated LCD controller IP
Supports up to 800 x 480 resolution Interface for LCD control uses 2-wire interface
Integrated touch panel controller IP Interfaces to LCD using 3-wire SPI [33]
50

Figure 2.2 17 – Nios II 3C25 Block Diagram
2.2.8 Arduino Uno OverviewThe Arduino Uno is a microcontroller board that uses the ATmega328. It is programmed via a USB cable in a Java based language. It can be powered by three different sources: USB, AC-to-DC adapter, or one of the pins. It has digital and analog inputs and outputs and interfaces very well with controlling text based LCD screens. It is also capable of generating PWM signals.[49]
General Features [49]: Microcontroller
o Atmega328 Operating Voltage
o 5V Input Voltage
o 7-12V Digital I/O Pins
o 14 Analog Input Pins
o 6
2.3 Control system51

The control systems for the golf cart can be implemented in a few different ways. The first would be to use an FPGA, more specifically the Spartan 6 from Xilinx due to having some familiarity working with it in labs to build our own. The second option would be to use a microcontroller either the PIC 18F4610 from Microchip or the ATmega644-20PU or the ATtiny44A from Atmel. While the Spartan 6 has a lot of good qualities to it, the ATmega644 can do what is need at about a third of the cost and the ATtiny44A at a tenth. The equipment needed to program the Spartan 6 also costs more making the use of it much less likely. It comes down to the fact that 6 ATmega644s or PIC 18F4610 can be accidentally fired during testing for every one Spartan 6.
2.3.1 Spartan 6The Spartan 6 is a family of FPGA chips from Xilinx ISE. It comes in a variety of settings that gives the user multiple models to choose from for their specific project. FPGAs are generally rated by how many logic cells and logic blocks they contain. Below in Figure 2.3 1 is a list of the ranges and features of the Spartan 6 FPGA family from the Xilinx website and data sheet. This FPGA has a lot of different versions that are available. The table below shows the ranges that the particular feature can come in. The block RAM is set in the number of blocks that come in the FPGA and not the size. Each block RAM contains 18kbytes of RAM in them. To get the range of the amount of RAM available just multiply the number of blocks by 18Kbytes. [24]
Logic cells 3,840 – 147,443 Slices 600 – 23,038 Flip Flops 4,800 – 184,304Max distributed RAM 75kbytes – 1,355kbytesBlock RAM blocks (18kbytes each) 12 – 268 CMT 2 – 6 Memory controller blocks 0 – 4 Endpoint Blocks for PCI Express 0 – 1 Maximum GTP Transceivers 0 – 8 Total I/O Banks 4 – 6 Max User I/O 132 – 540 CMT speed 1050MHzBlock RAM speed 250MHzSpecial features Embedded processing
Low Power management modesEnhanced configuration and bitstream protection
Figure 2.3 1 – Features of Spartan 6 FPGA family from Xilinx.com and data sheet [24] [25]
52

The Spartan 6 can be used to help implement a self built microcontroller. There is a lot of flexibility that is allowed when using an FPGA to design a microcontroller than buying an already built one. This would at a lot of design to the project, but has several drawbacks. Designing a microcontroller using the Spartan 6 is a project in itself. While it would be good to do, it would not be practical and would consume a lot of time. The other part of it is cost. To use this method would be to increase the cost of the control system by a great deal. Not only does the FPGA itself cost upwards of fifty dollars, but the additional components that would be needed would also add to price. The added flexibility and control over the design and function of the microcontroller comes with a price, one that would put the project way over the budget. If any errors occurred or the Spartan 6 was damaged during testing, it would not only take another chunk out of the budget, but would also eat up a lot of much needed time.
2.3.2 ATmega644The ATmega644 is an 8-bit microcontroller with 64kbytes of programmable flash memory and 6kbytes of data storage memory divided amongst SRAM (4kbytes) and EEPROM (2kbytes). It operates at 20MHz and executes instructions in one or two cycles. Below is a table of features of the ATmega644. [16]
Some of the pins of the ATmega644 are self explanatory like GND and VCC. AVCC is the same as VCC but leads to the analog-to-digital converter. AREF is the reference pin for the analog signal to the analog-to-digital converter. XTAL1 is the input to the inverting oscillator amplifier and to the internal clock while XTAL2 is the output. [16]
The I/O pins on the microcontroller are bi-directional and each group has its own additional special function as well. The Port A pins serve as the address low byte and data lines for external memory interface. Each pin also acts as a channel for the analog-to-digital converter. All the pins can act as external interrupts which makes it easy to select the pin that the sensors will be attached to and which ones will be used to connect to the display and speed controller. [16]
The Port B pins serve various functions. PB0 and PB1 can act as controls for two of the clocks in the microcontroller. PB0 controls the USART0 external clock deciding whether it is an input or output. Another command associated with the pin is XCK0 which is only active if the USART0 is operating in Synchronous mode. PB1 can act as the output for the Divided System clock. PB2 serves as the positive input for the Analog comparator and as two external interrupt sources. PB3 serves as the negative input to the Analog comparator and as the output for the Timer/Counter0 compare function. PB4 serves as the slave port select input and as an output for the Timer/Counter0 compare function. PB5 can act as either the SPI master data output or slave data input. PB6 serves as PB5’s counterpart by being the SPI master data input or slave data output. PB7 acts as
53

the master clock output or slave clock input for the SPI channel. This port would be the best choice for the speed controller interface since it deals with the timer/counter input and outputs. [16]
Core 8-bitSpeed 20MHzMemory 64k FLASH programmable memory
2k EEPROM4k SRAM
Supply voltage 1.8V – 5.5VInstruction set 131Pin numbers 40 PDIPI/O pins 32Peripherals Two 8-bit Timers/Counters
One 16-bit Timer/Counter6 PWM channels8 channel, 10-bit ADCByte-oriented Two-wire Serial InterfaceOne Programmable Serial USARTMaster/Slave SPI Serial Interface Programmable Watchdog Timer with Separate On-chip OscillatorOn-chip Analog ComparatorInterrupt and Wake-up on Pin Change
Special Features Power-on Reset and Programmable Brown-out Detection Internal Calibrated RC OscillatorExternal and Internal Interrupt SourcesSix Sleep Modes: Idle, ADC Noise Reduction, Power-save, Power-down, Standbyand Extended Standby
Figure 2.3 2 – Features of ATmega644 from information on data sheet [16]
Port C serves as the JTAG interface for the microcontroller. Most of the special functions associated with these pins deal with data testing and timer oscillation. Both PC6 and PC7 serve as pins for the timer oscillator as well as external interrupts for the MCU. PC5 acts as the JTAG Test data input while PC4 acts as the output. PC3 is the JTAG Test Mode Select and PC2 is the Test Clock. PC1 and PC0 are 2-wire serial buses where PC1 deals with data input and output and PC0 deals with a clock. [16]
Port D alternate functions deal mainly with the Timer/Counter1 and 2 Compare outputs. PD6 can act as an input capture pin for the Timer/Counter1. PD3 and PD2 acts as an external interrupt for the MCU. PD1 can be the data output pin for the USART0. PD0 can act as the counterpart to PD1 as the data input pin for
54

the USART0. For a more detailed description of the special functions each pin as, refer the ATmega644 data sheet pages 71 to 83. [16]
2.3.3 ATtiny44AThe ATtiny44A is another 8-bit microcontroller from Atmel. This microcontroller however only has 4kbytes of programmable memory and 256 bytes of EEPROM and 256 bytes of SRAM. It has 12 I/O pins to work with, which is still enough for this project, each of which also has special functions associated with them. It also can operate at the same speed as the ATmega644 and within the same supply voltage range. Below in Table -2 is an overview of the ATtiny44A’s capabilities. It is not as capable as the ATmega644, but it can serve as a cheap alternative if need or if it turns out that it can deal with the requirements of the project on its own. [23]
Like the ATmega644, the ATtiny44A has its I/O pins set up as ports. The tiny AVR only has two ports, A and B, as opposed to four. Port A is similar to the port layouts of the ATmega644 in that it is divided into eight pins. One of the differences is that there are two pins on one side of the microcontroller and the rest are on the other side. Port B is divided into four pins instead of eight making it less flexible to use than Port A. [23]
Like the other AVRs, the I/O pins have special functions associated with them. All the I/O pins can function as interrupts and inputs for the A/D converter. Port A pins deal with the timer/counter inputs, SPI input and output, and USI I/O pins. Pin A0 to A2 deal with the analog comparator inputs. Pin A0 acts as the external reference while Pin A1 is the positive input and Pin A2 is the negative. Pin A3 to A7 can act as input and output sources for the various timers/counters. Pin A4 to A6 also serve as inputs and outputs for the SPI and USI. This port would be the most likely candidate for the speed controller interface since it can connect with an 8-bit bus making data transfer much easier. [23]
Port B deals mainly with the clock outputs and crystal oscillator outputs. This port would most likely be used for the inputs from the sensors and display screen. Three of its pins would be tied to the display screen to receive the input for the correct mode and the last pin would be used to connect to the voltage sensor. This would be the best use for this port, but since there may be more inputs that might be connected to the microcontroller the ATtiny44A will not be a good choice for this project.
Core 8-bitSpeed 20MHz
55

Memory 4k programmable FLASH memory256 EEPROM256 SRAM
Supply Voltage 1.8V- 5.5V Instruction Set 120Pin numbers 14 PDIPI/O pins 12Peripherals One 8-Bit and One 16-Bit
Timer/Counter with Two PWM Channels, Each10-bit ADC• 8 Single-Ended Channels• 12 Differential ADC Channel Pairs with Programmable Gain (1x / 20x) Programmable Watchdog Timer with Separate On-chip OscillatorOn-Chip Analog ComparatorUniversal Serial Interface
Special Features debug WIRE On-chip Debug SystemIn-System Programmable via SPI PortInternal and External Interrupt Sources• Pin Change Interrupt on 12 PinsLow Power Idle, ADC Noise Reduction, Standby and Power-Down ModesEnhanced Power-on Reset CircuitProgrammable Brown-Out Detection Circuit with Software Disable FunctionInternal Calibrated OscillatorOn-Chip Temperature Sensor
Figure 2.3 3 – Features of ATtiny44A from data sheet [23]
2.3.4 PIC 18F4610The PIC 18F4610 is a flash microcontroller with 64k of programmable flash memory and 3968 bytes of SRAM. It comes with 36 I/O pins and 13 10-bit A/D channels. This microcontroller comes from the PIC 18F4X1X family made by Microchip. They come equipped with a flexible oscillator that can go up to 40MHz along with two external clock options and a Phase loop lock. The 18F4610 shares several of the same features with the ATmega644. Some of these features are multiple operation modes, an A/D converter, and watchdog timer. Below in the bulleted lists, the features for the PIC 18F4610 from the datasheet by Microchip is shown and this database can be found at their website. One of the differences between the two microcontrollers is that the PIC 18F4610 has five ports instead of four. Like the ATmega644, each of the I/O ports serves another function. [17]
56

Memory: 64k programmable FLASH memory 3968 bytes SRAM
Supply Voltage: 4.5V – 5.5 V
I/O pins: 36
Pin Number: 40 PDIP
Number of Single word instructions that can be held: 32768
Peripherals: High-Current Sink/Source 25 mA/25 mA Up to 2 Capture/Compare/PWM (CCP) modules, Enhanced Capture/Compare/PWM (ECCP) module (40/44-pin devices only):
- One, two or four PWM outputs- Selectable polarity- Programmable dead time- Auto-shutdown and auto-restart
Master Synchronous Serial Port (MSSP) module Supporting 3-Wire SPI (all 4 modes) and I2C™ Master and Slave modes Enhanced Addressable USART module:
- Supports RS-485, RS-232 and LIN 1.2- RS-232 operation using internal oscillator
block (no external crystal required)- Auto-wake-up on Start bit- Auto-Baud Detect
10-Bit, Up to 13-Channel Analog-to-Digital Converter module (A/D):
- Auto-acquisition capability- Conversion available during Sleep
Dual Analog Comparators with Input Multiplexing Programmable 16-Level High/Low-Voltage Detection (HLVD) module:
- Supports interrupt on High/Low-Voltage DetectionSpecial features:
C Compiler Optimized Architecture:- Optional extended instruction set designed to
optimize re-entrant code 100,000 Erase/Write Cycle Flash Program Memory Typical Three Programmable External Interrupts Four Input Change Interrupts
57

Priority Levels for Interrupts 8 x 8 Single-Cycle Hardware Multiplier Extended Watchdog Timer (WDT):
- Programmable period from 4 ms to 131s Single-Supply 5V In-Circuit Serial Programming™ (ICSP™) via Two Pins In-Circuit Debug (ICD) via Two Pins Wide Operating Voltage Range: 2.0V to 5.5V Programmable Brown-out Reset (BOR) with Software Enable Option
Some of the pins are self-explanatory like VDD and VSS; others need more of an explanation. Like the ATmega644, the rest of the pins have multiple uses aside from basic input/output pins. In the following paragraphs are lists of the other functions that the other I/O pins have. [17]
RA0 and RA1 serve as pins for the same device function. Both serve as inputs for PORTA and comparators C1 and C2 as well as outputs for LATA. RA2 can serve as an A/D input and input for C2 comparator. It also acts as the voltage reference input for the A/D converter and comparator. RA3 can act as an input for comparator C1 and the A/D converter. It also acts as the voltage reference high input for the comparator and A/D. The other RA pins act as inputs and outputs for the oscillator and clocks. [17]
RB0 can act as an external interrupt, A/D input and enhanced PWM fault input. RB1 and RB2 both serve as external interrupts and A/D input channels. RB3 can act as a capture input for the CCP2 compare and output for the CCP2 and PWM. RB5 can serve as the single supply programming entry. RB6 and RB7 serve as controls and I/O ports for serial execution ISCP and ICD operations. [2]RC0 and RC1 serve as Timer oscillator inputs. RC2 deals with several ECCP1 operations and RC3 serves as the MCCP module clock inputs or outputs. RC4 can act as the SPI and I²C input and output for I²C while RC5 serves as the output for the SPI. RC6 and RC7 act as clock and data inputs for the USART module. [17]
Port D also functions the Parallel Slave Port. Each of the pins acts as an input or output for read or write data. All the pins act as write data inputs and read data outputs. RD5, RD6, and RD7 also serve as ECCP1 enhanced a PWM output which takes priority over the PSP data and other port data. This port would be the ideal for the interface with the speed controller since it deals with the PWM outputs. [17]
Port E pins serve several functions. All of the I/O pins act as inputs to the A/D converter. RE0 serves as the read enable input and RE1 and RE2 serves as write enable input for the Parallel Slave Port. RE3 can serve as the external master clear input and high voltage detection for ICSP mode entry detection. For more detailed information on the functions of the PIC 18F4610, see the data
58

sheet at the website listed above. [2]Both the Atmel ATmega644 and Microchip PIC 18F4610 are suitable microcontrollers for the project. The price for these microcontrollers only differs by a few dollars making it irrelevant in the decision of which to choose. Both can be programmed by using a C compiler or an assembly language. The ATmega644 does come with more data storage memory and comes with a recommendation from a former employer. This is why the ATmega644 will be used to implement the control system for the project. [17]
2.3.5 ProgrammingThe other reason for choosing the Atmel microcontroller over the Spartan 6 is the way that the devices are programmed. The Spartan 6 uses Xilinx ISE software to create the programs for the FPGA while the ATmega644 uses AVR Studios. Both softwares are available free from the companies that made them, but the languages used to program the ATmega644 make it easier for the development of the project. There is also a BASIC programming platform available for use with AVR microcontrollers. This would be the best way to program the microcontroller since BASIC commands are very well suited for this type of programming. There are some problems that make the BASIC platform unsuitable for use leaving AVR Studios the best option for the AVRs.
2.3.6 Xilinx ISEXilinx ISE has a couple of ways to program the FPGAs, by either using a Verilog or VHDL program or by using the schematic capture tool. While the schematic capture tool is very useful since the circuit used to implement the design is used to program the FPGA. The only downside is when a circuit gets complicated. It becomes harder to find even the simplest of mistakes in the mess of wires and nodes that can cover the screen. Even though Verilog and the VHDL programs work well, there has not been enough application of these languages elsewhere to make using them worthwhile. The simulator in Xilinx ISE can is also useful but only displays the states of the inputs and outputs. While there is some control over the conditions before running the simulation, there is not as much that can be done with the simulation when compared to the one in AVR Studios.
2.3.7 AVR Studios 4/BASIC PlatformAVR Studios uses either an assembly language (Intel, Motorola, or a Generic) or C to program its microcontrollers. The language is general enough that very few changes need to be made if a different AVR microcontroller was to replace the current model being used. The C program is familiar enough that a person can easily start programming once the commands for the microcontroller are learned. This makes development much easier since a much more familiar programming language is being used. AVR Studios also has a simulator built in that allows the
59

user to see what is happening throughout the microcontroller. The status of the registers and states f the I/O ports can be configured and examined before and after the program has run. This makes for much better development than the simulator in Xilinx ISE. There is also a BASIC compiler for the AVR microcontrollers. This software would allow the user to use BASIC commands to program the microcontroller instead of C or an assembly language. BASIC would make the programming of the microcontroller much easier if the software that allowed this was user-friendly. While writing and compiling the code is not difficult, when it comes to downloading it to the microcontroller there are a few problems. The interface with the starter kit or USB programmer that would be used is not well defined. There is no real instruction given on how to connect and download the program to the microcontroller.
2.4 Sensors2.4.1 Speed sensors
There are two main ways to determine the speed of a golf cart using sensors. One is by using a geartooth sensor to detect a gear mounted on the axel. The other way is to use a ring magnet and Hall sensor. The output changes as the poles of the ring magnet pass by the sensor. From either of these sensors, the RPM of the wheel axel can be found and the speed can then be calculated. Both tend to have the same range of specifications when it comes to operating voltages, output current and voltages, and operating temperatures making choosing one come implementation methodology and price.
The Hall sensor and ring magnet seem to be the easiest to implement. The problem with the geartooth sensor comes from the difficulty of implementing it compared to the Hall sensor. The process of getting a gear on the axel would involve dismantling a good portion of the golf cart. Attaching a magnet to the wheel or around the axel takes much less work. The hall sensors also tend to cost less than the geartooth sensors and can come with a variety of output options like analog, digital, or sinusoid.
Two decent sensors that can be used are the 55100 Mini Flange Mount Hall effect sensor made by Hamlin and the SS440R series made by Honeywell. Below in Figure 2.4 1 is the block diagram for the SS440R from its data sheet provided by Honeywell and can be found at Honeywell’s website. [20][21]
60
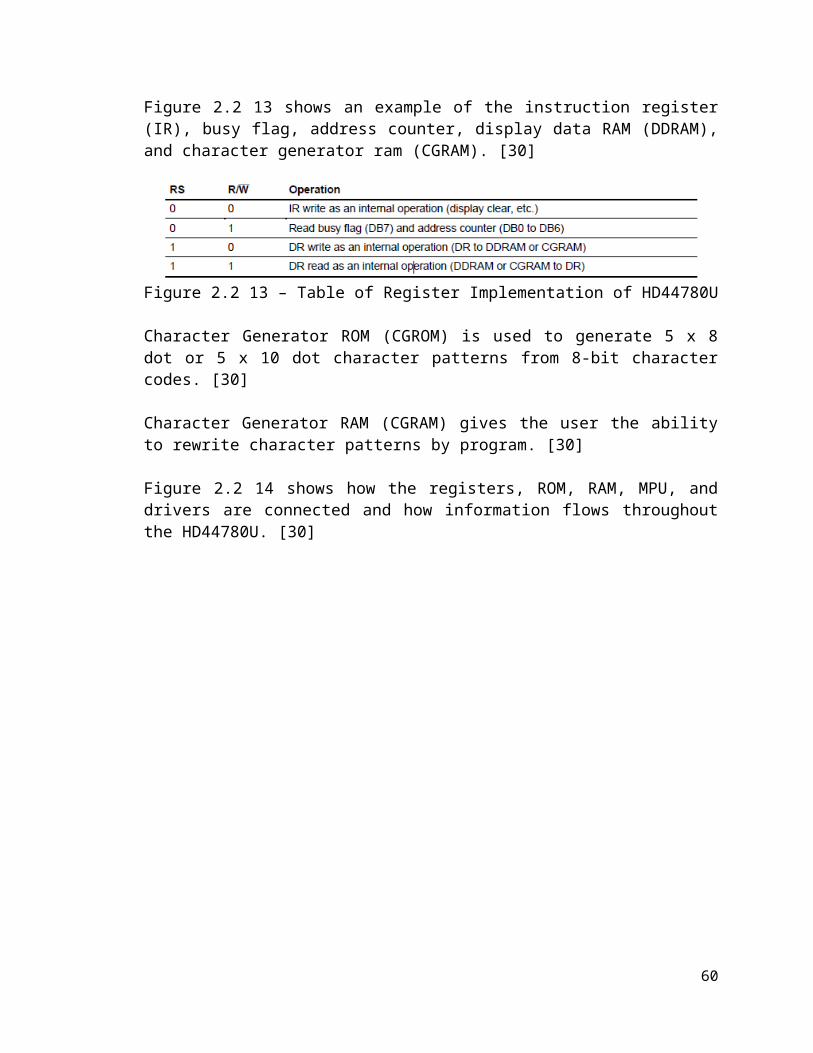
Figure 2.4 1 – block diagram for the SS440R Unipolar Hall Effect Sensor [21]
The difference between the three wires and two wires 55100 is the output type that is desired. The two wire sensor produces a current output while the three wire sensor produces a voltage output. This is one of the reasons the 55100 is going to be used for the speed sensor. While the SS440R is a good sensor, it has some drawbacks in being a board mount sensor. The 55100 already has a durable casing that can withstand a harsh environment like the underside of a golf cart near the axel. The SS440R would need to have a small circuit designed for it, durable housing that would protect it from debris that would be kicked up from the wheels, and a cable made up to connect the sensor to the rest of the circuit. The 55100 is already equipped with a cable whose length can be specified by the buyer making it easier to implement than the SS440R. [20]
2.4.2 Voltage SensorsThere are several ways to monitor the voltage across the batteries. One of these ways would be to place a non-inverting amplifier with unity gain at the positive end of the batteries and sending the output to the HUD to be displayed. It would then be a matter of sending the current value to the HUD and calculating the voltage. A much easier way would be to place a voltage divider in parallel with the batteries and send the voltage at the node to the HUD and microcontroller. This will keep the voltage low enough so the I/O pins are not overloaded. It also simplifies things since the use of op-amps would require more voltage regulators to implement the circuit.
2.4.3 Current Sensors2.4.3.1 Open and Closed Loop Hall-effect
Current sensors come in a variety of forms. The most common of which are the open and closed loop Hall-effect sensors. Both use the same basic principles to produce an output that can then be used to calculate the current. A metal ring is placed around the wire in which the desired current is to be measured which produces a magnetic field. In the open-loop current sensor the magnetic flux created by the passing current produces a voltage that relates to through the equation VO = Ii X B, where VO is the output voltage, Ii is the input current being measured, and B is the magnetic flux created in the device. The closed-loop
61
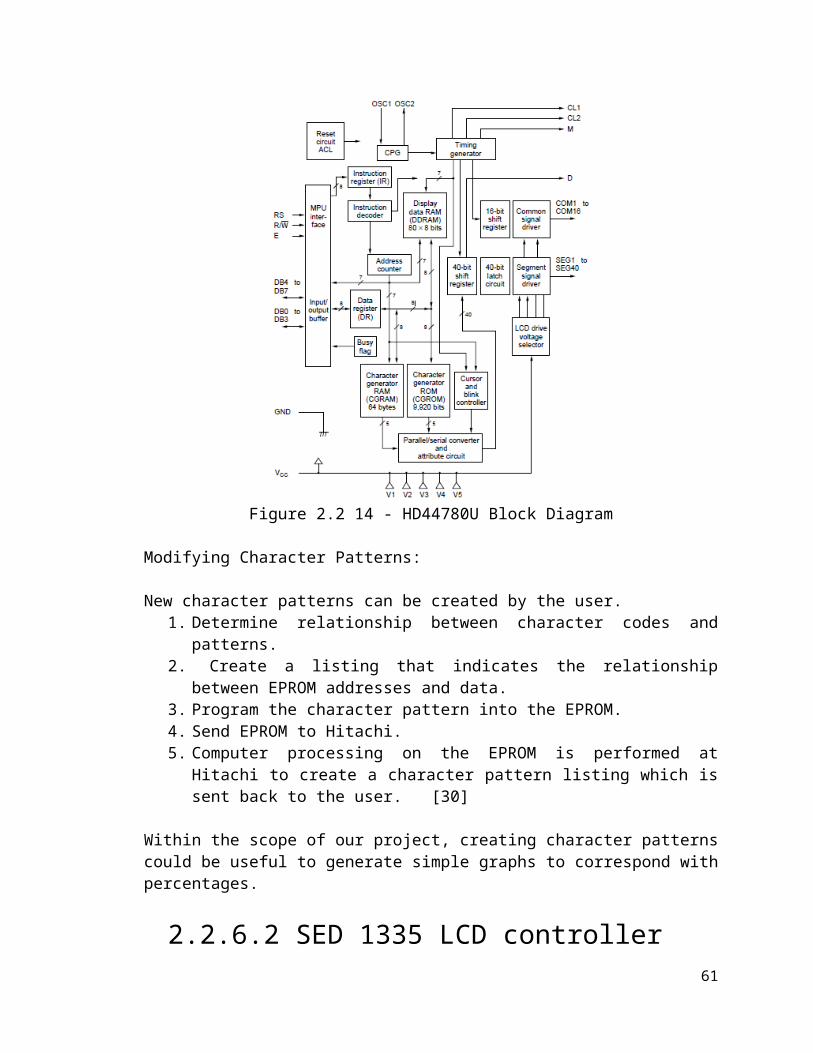
operates in a similar fashion. The addition of a wire wrapped around the metal ring causes a current to be produced that is proportional to desired current. Since the inputs to the display and microcontrollers require a certain voltage that is to be read the open-loop Hall-effect sensor is the best kind of sensor for this project.
2.4.3.2 IC Board mount Current SensorAnother type of current sensor is the IC board mount sensor. These sensors are not ideal for this particular project. While they are cheaper than any other kind of sensor on the market, they have a limited application range. The range of current that are able to be sensed by this particular kind of sensor is very low. The current that will need to measured is in the range of 10 to 200 A while the IC sensors can usually only detect milliamps. The setup for implementing an IC sensor is also more complicated. There are external resistors that need to be added while the Hall-effect sensors only need a supply voltage to get them up and running.
2.4.3.3 CSLT6B100The CSLT6B100 is an Open-loop Hall-effect current sensor made by Honeywell. It requires a supply voltage of 4.5V to 10V. It can sense a current of ± 100 A and has a similar design to the speed sensor as seen in Figure 2.4 2 which is the block diagram for the sensor from the data sheet provided by Honeywell and can be found at Honeywell’s website. It operates in somewhat the same way by taking the output of the Hall sensor at one end of the sensor and then producing an output. [22]
Figure 2.4 2 - block diagram of CSLT6B100 Open-loop Hall-effect sensor [22]
Below in Figure 2.4 3 is the graph of the transfer function of the CSLT6B100 also form the data sheet provided by Honeywell. This shows that there is a linear relationship between the current being measured and the output voltage. This will make it much easier to derive the current and use it for calculations when it comes to programming. The output voltage is displayed in millivolts which may need to be increased to be read by the display unit. This can simply be done with
62

a non-inverting amplifier. The error of the sensor is also displayed as well. As the current reaches the extremes of its range the error increases, but remains relatively small making it well suited for calculations. [22]
Figure 2.4 3 - 2 Output voltage due to current of CSLT6B100 from data sheet [22]
2.4.4 Printed Circuit BoardPrinted circuit boards will be a vital part of the project. They will hold the circuits for the voltage regulators and control system. The printed circuit boards will be designed using software provided by a manufacturer and then ordered. There are several different sites that offer this and the two that will be looked at for the project are ExpressPCB and 4PCB. Both offer design software that can be used to design the printed circuit board, get a quote on how much they will cost, and then order them from the company.
63
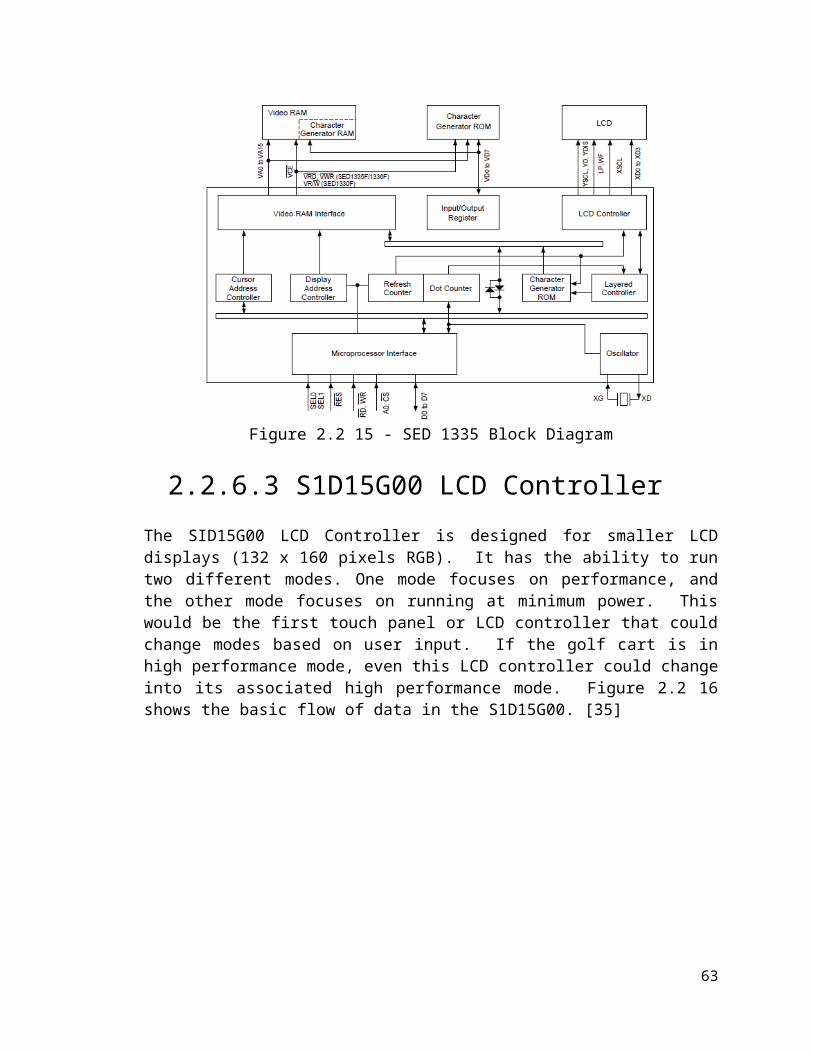
ExpressPCB offers very user friendly software that can be used to design the printed circuit boards. The software comes in two parts, ExpressSCH and ExpressPCB. ExpressSCH allows the user to design a schematic of the desired circuit they want to build. The library of parts consists of common electrical components and IC devices that can be found at Digi-Key using their part numbers to identify them. The library is not complete and is missing some components that are needed for the circuits. There are components available that can be used in place of the missing ones for the sake of designing the printed circuit board. ExpressPCB allows the user to develop a printed circuit board using predefined layouts that correspond to the parts used in the schematic and layouts for specific casing types. One of the benefits of using these two programs is that the schematic designed in ExpressSCH can be linked to ExpressPCB. When the connection point of one part is selected, the corresponding connection points that it is to be connected to will be highlighted as well. This makes laying down traces for the printed circuit board much easier.4PCB offers similar software to ExpressPCB called PCB Artist. The difference is that it first takes you through the steps of designing the board itself. This includes choosing how many layers it has, the type of material it will be made out of, the type of material that will be used for the traces, and the size of the board. The library selection is separated out by the company that makes the component. This component library contains a much less diverse selection than ExpressPCB. The components offered only come in certain casing styles making it hard to design a printed circuit board that requires a different style. The components are easier to find since they are listed their name and not the part number that a site uses.
2.5 Solar PanelsSolar Panels are a cheap and effective way of recharging the batteries as well as taking off a small load from the main battery source of the golf cart. Solar panels will degrade slightly after the first couple of years of use; however, they will maintain a steady level of efficiency for many years to come. Solar panel systems can be expensive to buy and install in many homes and other projects. They are seen as long-term investments and some systems can take about 10 years to pay themselves off. Also plenty of sunlight is needed. In areas that don’t get enough sunshine, the solar panels will not be as effective. Solar panels will degrade slightly after the first couple of years of use; however, they will maintain a steady level of efficiency for many years to come. Solar panel systems can be expensive to buy and install in many homes and other projects. They are seen as long-term investments and some systems can take about 10 years to pay themselves off. Also plenty of sunlight is needed. In areas that don’t get enough sunshine, the solar panels will not be as effective. [37][38]
2.5.1 Batteries for Solar Panel System
64

Since solar panels do not have a continuous steady energy level as well as supply, storage batteries especially for the solar panels are commonly used with most solar panel kits. The idea is to have additional set of batteries separate from the main battery source to store the energy coming from solar panel. This will help keep a constant flow while in the modes of the charging the main set of batteries with the solar power and to help relieve the stress on the main set of batteries when the golf cart is running. Solar Panels can use a number of different types of batteries like wet cells as that are used as most golf cart batteries, and sealed or gel cell batteries. Each battery has different temperature, mounting, and ventilation requirements. Batteries can lose over half of their charge when they are exposed to extreme temperature swings. The batteries must be contained in a location that will stay in a temperature range of 50° to 80° F, or it can be contained in an insulated battery box. A typical 6-volt golf cart battery with an 80 % discharge rate will keep in storage about 1 kilowatt per hour of useful energy. This comes from the equation:6V∗220amp per hour∗80%discharge=1056watts per hour. This however can only power about 2-50 watt incandescent light bulbs, which is shown in the equation 2∗50watts∗10=1000watts per hours. Each golf cart battery weighs about 60 pounds, there can be a weight constriction.
2.5.1.1 Deep Cycle Golf Cart BatteryEvery battery is designed for a specific type of charge and discharge cycle. Car batteries have thin plates to keep their weight down and are designed for a heavy discharge lasting a few seconds, followed by a long period of slow recharging. A 6-volt golf cart battery that is classified as the size T-105 is the minimum battery recommend for the solar application that will be used to power the golf cart project. More 6 volts batteries can be added to get to the desired amount of voltage; however, the project will only need about 3 to 4 to help recharge the main batteries or help power the entire golf cart. Golf cart batteries with larger voltages, such as the 8 or 12 volt batteries can also be in use. They are designed to have thick plates and for hours of heavy discharge almost every day. They also have a fast recharge that designed to be completed in only a few hours. This design principal is used in solar power systems. Solar systems are suppose to be able to provide extended periods of time of deep discharge and must be able to charge in the small amount of time of given sunlight. Very few batteries can take this intense discharge and recharge.
2.5.1.2 Sealed Marine BatterySealed marine batteries are not a recommended choice for solar power systems, since they have a chance to malfunction after being connected to a solar charger for a period of a couple months. This can happen due to overcharging, which can evaporate all of the electrolytes in the sealed battery and warp & expose the
65

plates while the plates oxidize. This will in turn cause an internal short circuit and ignite the hydrogen gases inside the battery.
2.5.1.3 Absorbed Glass Mats BatteryAGM, or absorbed glass mats, batteries are sealed batteries that use absorbed glass mats between the plates. This type of battery is rugged and considered to be maintenance free for a period of time. This still means checks should be happen every once in a while to ensure safe usage. AGM batteries are thus ideally suited for use of a solar power system’s battery back-up. Due to the fact that they are completely sealed they don’t spill, don’t need periodic watering, and emit no corrosive fumes, thus the electrolyte won’t stratify and no equalization charging is required. AGM batteries are also well suited to systems that have an infrequent use as, since they have less than a 2% self discharge rate during transport and storage. They also can be mounted on their side or end and are extremely vibration resistant. AGM batteries come in most popular sizes. The next bit disadvantage of these batteries is the fact that its price is much higher than that of the other batteries. While a normal 12 Volt flooded lead acid deep cycle battery, which is the standard for most solar panel systems and golf carts, cost around $150.00, a 12 Volt absorbed glass mat battery can cost anywhere from $240.00 to $300.00, which is almost double that of the standard flooded lead acid deep cycle battery.
2.5.1.4 Gel BatteryGel batteries contain acid that is kept in a gel-like state through the addition of Silica Gel, which turns the acid into a solid state. These batteries can’t be spilled even if they are broken. The disadvantage of using this battery is that it cannot be fast charged or it may cause permanent damage to the battery. This is not problem usually with solar panel systems though. Unlike a high quality sealed lead-acid battery, extra care must be taken to insure a Gel Cell battery is not charged above the maximum voltage, for example 14.1 volts for a 12 volt battery. Overcharging a Gel Cell can shorten the battery’s lifespan and may even ruin it. Any charge source or charge regulator used must have user adjustable settings for sealed Gel Cell batteries to insure charge voltage does not exceed the safety limit.
2.5.2Solar CellsThere are three basic types of solar cell. Monocrystalline cells are cut from a silicon ingot grown from a single large crystal of silicon, while polycrystalline cells
66

are cut from an ingot made up of many smaller crystals. The third type is the amorphous or the thin-film solar cell. Now the solar cells’ current start to diminish from 2 Amps around 0.5 Volts per cell, as shown in Figure 2.5 2. It is a very rapid diminishing curve, so the solar panels should not have their cells have a voltage higher than 0.5 Volts; however, the max power per solar cell reaches its peak around 0.55V shown in Figure 2.5 3. There are 3 main types of materials used for solar cells monocrystalline silicon, polycrystalline silicon, and amorphous silicon. The lab efficiency, as shown in Figure 2.5 1, is about 24% for monocrystalline silicon, about 18% for polycrystalline silicon, and about 13% for amorphous silicon. The production efficiency, as shown in Figure 2.5 1, is 14%–17% for monocrystalline silicon, 13%–15% for polycrystalline silicon, and 5%–7% for amorphous silicon. Now the lab efficiency will always be a higher value than those of the production value. [36][37][38]
Material Efficiency in the Lab (%)
Efficiency of production Cells
(%)Mono-crystalline
silicon about 24% 14 % to 17 %
polycrystalline silicon about 18% 13 % to 15 %
amorphous silicon about 13% 5 % to 7 %
Figure 2.5 1 – Efficiency of Materials (Approved by DavidDarling.com)
Figure 2.5 2 – Solar Cell I-U Characteristics (Approved by pvresources.com)
67
Figure 2.5 3 – Solar Cell Power Graph (Approved by pvresources.com)
2.5.2.1 Mono-Crystalline Silicon Solar CellsMono-crystalline silicon solar cells are the most widely used by far of any type of solar cell in use and production. They are the primarily used solar cells used in solar power plants. Mono-crystalline silicon solar cells are usually the most efficient at the most reasonable price of solar cells. They, however, are not the most efficient in eyes of certain beholders, and may not be the most inexpensive in the long run for some projects. Their efficiency is limited due to quite a few factors. The energy from the solar cells rapidly decreases at higher wavelengths. The highest wavelength when the energy of the solar cells is still large enough to produce the free electrons for the electricity is 1.15 µm. The highest efficiency of silicon solar cell is around 24 %, but some certain other semi-conductor materials can increase the efficiency up to 30 %, which is still dependent on wavelength and material. Some of the decreased efficiency is caused by metal contacts on the upper side of a solar cell, the normal resistance coming from solar cells, and from solar radiation reflectance on the upper sides of a solar cell, which are glass. Mono-Crystalline solar cells are produced usually as wafers, which are roughly about 0.3 mm thick, and are sawn from silicon ingot that have diameter anywhere from 10 cm to 15 cm. They can generate approximately 35 mA of current per cm2 area, which when combined together all at once can produce anywhere up to 2 A/cell with a voltage of 550 mV during full illumination of the solar cells. Lab solar cells have estimate of 24% in efficiency, and the manufactured solar cells have anywhere from 14% to 17 % in efficiency. Multiple mono-crystalline solar cells are wired in series of each other to produce single solar panels. As each cell produces a voltage of anywhere between 0.5 V and 0.6 V, roughly 36 cells are needed to produce an open-circuit voltage of about 18
68

V to 21.6 V minus the volts used up in the setup. This can be sufficiently charge most 12 V batteries under most normal conditions. In Figure 2.5 4, the table shows the specifications of 2 monocrystalline silicon solar panels. Both panels have the same power rating of 180 Watts. They also have a very close voltage at maximum power, which is 36.3 Volts for the ET-M572185 and 36.8 Volts for the TSM-180DA01. These solar panels are very similar to each other, with only slight differences between the currents and voltages. The TSM-180DA01 is a bit more expensive however it has a higher Vmax, which is 3000 Volts. It does have a lower efficiency versus the ET-M572185, but only at 0.01%. The ET Solar’s ET-M572185 has an efficiency rating of 14.11% versus the efficiency rating of 14.10% Trina Solar’s TSM-180DA01. The solar panels are not the cheapest of the solar panels. These solar panels’ current isn’t as high as polycrystalline silicon solar panels but a have a higher voltage. [36][37][38][39]
Manufacturer ET Solar Manufacturer Trina SolarModel Number ET-M572185 Model Number TSM-180DA01Cell Type Monocrystalline Cell Type MonocrystallinePower Rating 180 W Power Rating 180 WOpen Circuit Voltage 44.6 V Open Circuit
Voltage 44.2 V
Short Circuit Current 5.61 A Short Circuit
Current 5.35 A
Voltage at Pmax 36.3 V Voltage at Pmax 36.8 VCurrent at P max 4.95 A Current at Pmax 4.9 AEfficiency 14.11% Efficiency 14.10%Power Tolerance -1.00% ~ 3.00% Power Tolerance -3.00% ~ 3.00%Vmax 600 V Vmax 3000 VDimensions (HxWxD)
62.2"×31.81"×1.97"
Dimensions (HxWxD)
62.24"x31.85"x1.6"
Weight 34.83 lbs Weight 34.4 lbsPrice $535.00 Price $558.00
Figure 2.5 4 – Table for Mono-Crystalline Silicon Panels
2.5.2.2 Polycrystalline Silicon CellsPolycrystalline silicon cells are made of multiple smaller silicon crystals that were produced by sawing a cast block of silicon first into bars and then made into wafers. These types of solar cells are relatively cheaper to be produced but there efficiency is compromised, where as single silicon crystal cells have better performance. Polycrystalline solar systems are among the cheapest and most common type of panel out there. Although the theoretical efficiency of monocrystalline cells is slightly higher than that of polycrystalline cells, there is little practical difference in performance. Crystalline cells generally have a longer lifetime than the amorphous variety. Two separate polycrystalline silicon solar panels are compared in Figure 2.5 5. These have a very good amount of voltage
69

as well as current. Canadian Solar’s CS6P-215-P has a higher voltage of 29 Volts but a lower current of 7.4 Amps at maximum power. It does sadly, have a lower efficiency rating of 12.70%, which is only a bit lower than the Evergreen’s ES-A-195-fa2 efficiency rating of 12.40%, at a lower price of $406.35 rather than the $497.25. The ES-A-195-fa2 has a voltage of 17.8 Volts during maximum power and a current of 10.96 Amps. It also has a smaller power tolerance, which is only by a 0.01 % difference on both the positive and negative ends and a smaller maximum voltage. The ES-A-195-fa2 has a maximum voltage of 600 Volts, while the CS6P-215-P has a maximum voltage of 1000 Volts. This is the recommended solar panel out of all the shown solar panels of not only the polycrystalline silicon cells, but the others as well. This is mainly due to the low price and high power rating. [36][37][38][40]
Manufacturer Canadian Solar Manufacturer EvergreenModel Number CS6P-215-P Model Number ES-A-195-fa2Cell Type Poly-Crystalline Cell Type PolycrystallinePower Rating 215 W Power Rating 195WOpen Circuit Voltage
36.5 V Open Circuit Voltage 22.3W
Short Circuit Current
8.01 A Short Circuit Current 11.9 A
Voltage at Pmax 44 V Voltage at Pmax 17.8 VCurrent at Pmax 29 V Current at Pmax 10.96 AEfficiency 12% Efficiency 12.40%
Power Tolerance +5 W Power Tolerance -4.99% ~ 4.99%
Vmax 1000 V Vmax 600 VDimensions (HxWxD)
64.5”x38.7”x1.57” Dimensions (HxWxD) 65"x37.5"x1.38"
Weight 44.1 lbs Weight 41 lbsPrice $406.35 Price $497.25
Figure 2.5 5 – Table for Polycrystalline Silicon Panels
2.5.2.3 Thin FilmThin film solar cells are simple, durable lighter and easier to assemble when compared to the other silicon solar cells. Amorphous is used to build best quality thin film cells. The most common as well popular type of thin film is the flexible laminate type due to its versatile. It has the ability to be applied to almost all surfaces and it takes up less space than most traditional panel. Thin film can even be used as a type of roofing material in certain areas. Thin film is just not as efficient as the other types. With about a 5%-7% conversion rate for energy drawn from the sun, they can only draw about half the wattage from sunlight that mono-crystalline and polycrystalline solar panels do. Their thinner structure
70

needs less material, allowing much cheaper panels to be produced. At about seven to ten dollars per watt, the costs are lower than the other solar panels on the market. Thin film cells have advantage of being cost effective; they are required lesser amount semiconductor materials. The biggest advantage currently with thin film solar is its numerous application options. Unlike traditional panels, flexible panels can be applied to a wide variety of surfaces. In addition to the traditional roof mounted design, these cells are being molded to cars, backpacks, clothing, and even windows. Because the manufacturing process is simpler, it often has fewer defects than other types. The highly technical method of building traditional solar panels, sometimes compared to computer chip manufacturing, involves a lot of detailed soldering. This has been historically a place where the traditional panels experienced a lot of warranty issues. Not so with solar film. The process is closer to printing and therefore is subject to fewer defect issues. Many thin solar panels have better energy production in low-light and shading situations than other solar cells. Many early-adopters have reported their cells lasting 15 years and more, though it is still a fairly new concept. These cells also do not need the glass and aluminum casings of traditional cells because the materials within them are flexible and malleable. They are also not brittle like crystalline silicon. Efficiency of these cells has lagged anywhere from 50% - 70% behind that of traditional crystalline cells. Thin film needs approximately 50% more room to produce the same amount of electricity as any other traditional solar setup. Thin film solar may retain more heat, creating a balance act between this and its benefit of better performance at higher temperatures. Thin film solar cells don’t suffer a decrease in output when temperatures go up unlike the other type of solar cells. Some thin films may even have a slight increase in their outputs. Thin film is one of the most durable and least fragile solar cells. Compared to thin film, mono-crystalline panels are especially fragile. There is a possibility that they’ll hold up just as long as their competitors, but this technology is new and still hasn’t been well tested. A decrease in efficiency may occur over time. In Figure 2.5 6, 2 solar panels are compared against each other. Though they have high voltages, the solar panels have very low currents. To make sure it will be able to power the batteries, there will be a need of multiple solar panels, which will increase the price dramatically. Now with the EPV-42 has a much lower power rating, so at least three of them installed in series of each other will be need to get even close to what is need to compare it with the Sharp’s NA-V128H1. The EPV-42 has a voltage of 44 Volts, which when in series with two other ones will be 132 Volts. It still will have the low current of 0.92A even with the other panels connected in series. They, however, have a very low efficiency rating 6% for the EPV-42 and 9% for the NA-V128H1 for the price. Both of these thin film solar panels are not recommended for use in the golf cart’s solar panel system, even though it might be the cheapest of the pricing. [41][42]
71

Manufacturer JMS Solar Handel gmbh Manufacturer Sharp
Model Number EPV-42 Model Number NA-V128H1Cell Type Thin Film Cell Type Thin FilmPower Rating 42 W Power Rating 128 WOpen Circuit Voltage 59 V Open Circuit
Voltage 238 V
Short Circuit Current 1.17 A Short Circuit
Current 0.846 A
Voltage at Pmax 44 V Voltage at Pmax 186 VCurrent at Pmax 0.92 A Current at Pmax 0.688 AEfficiency 6.00% Efficiency 9.00%Power Tolerance -5.00% ~ 5.00% Power Tolerance -5.00% ~ 10.00%Vmax 1000V Vmax 600VDimensions (HxWxD) 49"x25"x0.94" Dimensions
(HxWxD) 39.7”x55.5”x1.8”
Weight 27.1 lbs Weight 42 lbsPrice $60.00 Price $280.88
Figure 2.5 6 – Table for Thin Film Panels
2.5.2.4 Amorphous Silicon Solar CellsAmorphous silicon is the most well developed of the thin film technologies. Amorphous technology is most often seen in small solar panels, such as those in calculators or garden lamps, although amorphous panels are increasingly used in larger applications. The efficiency of amorphous solar cells is typically between 6 and 8%. The lifetime of amorphous cells is shorter than the lifetime of crystalline cells. Amorphous cells have current density of up to 15mA /cm2, and the voltage of the cell without connected load of 0.8 V, which is more compared to crystalline cells. Amorphous silicon solar cells suffer from significant degradation in their power output, which is in the range of around 15%-35% when exposed to the sun. One of the best qualities of solar cells is their relatively low cost per Watt of power generated, though it is often inhibited by its significantly lower power density. In Figure 2.5 7, two amorphous silicon solar panels were compared. They have extremely have voltage, but have extremely low current against the other solar panels. The D100-A2 has 99.3 Volts at Pmax, while its current at Pmax is only at 1.55 A. Now the G-SA060 has a 67 Volts at Pmax, while its current remains at a 0.9 A at Pmax. Though the solar panel’s prices are not very high, the efficiency was not posted with either of the solar panels. Now the D100-A2 also did not post its power tolerance. Its maximum voltage is at 600 Volts for the D100-A2 and 530 Volts for the G-SA060. Neither of these solar panels will be sufficient or a good idea for the golf cart project. [36][37][38][42][43]
72

Manufacturer Dupont Manufacturer KanekaModel Number D100-A2 Model Number G-SA060
Cell Type Amorphous Cell Type AmorphousPower Rating 100 W Power Rating 60 WOpen Circuit
Voltage 77 V Open Circuit Voltage 92 V
Short Circuit Current 1.3A Short Circuit
Current 1.19 A
Voltage at Pmax 99.3 V Voltage at Pmax 67 VCurrent at Pmax 1.55 A Current at Pmax 0.9 A
Efficiency N/A Efficiency N/A
Power Tolerance N/A Power Tolerance -5.00% ~ 10.00%
Vmax 600 V Vmax 530 VDimensions
(HxWxD) 55.47"x43.7"x1.38" Dimensions (HxWxD) 37.8"×39"×1.6"
Weight 44.1 lbs Weight 30.86Price $170.00 Price $235.00
Additional Notes Power Tolerance & Efficiency not given Additional Notes Efficiency not
givenFigure 2.5 7 – Table for Amorphous Silicon Panels
2.5.3 Damaged and Tabbed Solar CellsTo cheapen the cost of solar panels, the idea of using damaged solar cells was thrown around. Damaged solar cells can be still put together into a solar panel and used, though its peak efficiency is significantly lower than that of an undamaged solar cell. When solar cells are manufactured, they are cut into extremely thin wafers, which it still requires an electrical connection in order to provide a path for the electricity to flow. Some companies sell their solar cells listed as being pre-tabbed. This states that the manufacturer has already started to the first step and created this electrical path by connecting metal tabs to the cell. This cuts down in the time and effort to complete the first few steps in building a solar panel. The prices for these tabbed solar cells are roughly around $1.50 to $2.00 per cell, which sadly is not much of an increase in savings. Chipped solar are slightly damaged. They typically are only missing one or two corners. Majority of the solar cell is still intact and operates at a reduced efficiency. Its efficiency and power is directly proportional to the amount of the cell that has been chipped. Chipped solar cells are often cheaper than tabbed solar cells. They are typically auctioned off and sold for around $1.00 to $1.25 per cell which can be a considerable cost savings as far as cheap solar cells go. Broken solar cells are more often damaged significantly more than just a chipped corner or two. Majority of the time, they are broken in multiple pieces. It requires a great deal of more work to piece them all together and get them to properly work again. They will be operating at a greatly reduced efficiency. Though it is a
73

very slim chance of it happening, if pieced together correctly to form a completely whole solar cell, the solar cell can generate close to the same power as it originally once has before it was broken. There is another downside to broken solar cells. It seems that the broken solar cells take up more space than normal solar cells. The prices of these broken solar cells vary greatly depending on the extent of the damage. Most of the time, broken solar cells can be purchased anywhere under $1.00 per cell. [44][45]
2.5.4 Solar Panel Battery Charge ControllerSolar panels have the capability to overcharge most battery systems in due time. To prevent such disaster from happening, a type of cut-off system is needed to stop the flow of power coming from the solar panels to the batteries. Most solar panels do not come with a cut-off system already installed on it. A cut-off system will make sure that the solar panel is not overcharging the batteries, which can multiple problems including a significant rapid decay of battery’s life or make it so the battery is no longer usable. To stop this multiple ideas can come to mind, solar panel controllers seem to be the most effective way of controlling the flow of power to the batteries from the solar panels.
Most solar power systems use a solar charge controller to stop the excessive charge to the batteries. A charge control regulates the power going to the batteries from the panels. The basic principle behind a charge control is that it monitors the batteries’ voltage. When the voltage hits the designated maximum voltage of the batteries, it will open another circuit and cuts off the flow of electricity to the batteries. Controllers also prevent reverse-current flow. When the solar panels aren’t generating any power, it will still draw power from batteries. Controllers detect that no voltage is being produced from the solar panels and opens another circuit to cuts off the solar panel from the batteries. The basic controller uses relays or shunt transistors to disconnect the solar panels at the maximum voltage allowed. These however are not normally used anymore, though they are extremely reliable and don’t use many parts. Many controllers use simple LED lights or digital meters to indicate what the status is; however, some, which normally are the newer models, have built in computer interfaces to monitor and control the solar panel controller. These displays mainly show the voltage and current coming from the batteries and panel. Since most 12 volt solar panels are designed to output anywhere from 16 to 18 volts normally, a controller will be needed. Now most charge controllers have a 3 stage charge cycle. The first stage is called the bulk phase. During the bulk phase, the voltage is raised to the bulk level, which normally is around 14.4 volts to 14.6 volts, while the maximum current is drawn by the batteries. This part will make the voltage reach the absorption phase or the second stage. The absorption stage maintains the voltage at the maximum level from the bulk stage for a given time, which normally last around an hour or so. During this time, the current will taper off. The third and final stage is called the float phase. During the float phase, the voltage begins to lower, which is normally about 13.4 volts to 13.7 volts. The batteries
74

also draw a small about of current to maintain everything until the next cycle of the three stages. The three stages and their relationships with voltage and amps are shown in Figure 2.5 8.[47]
Figure 2.5 8 – Relationship between the voltage and amps during the 3 phases
2.5.4.1 Pulse Width Modulation ControllerModern controllers use a pulse width modulation, or PWM, to have the amount of power decrease slowly as the batteries reach the maximum charge by using the float charging method or by switching the solar system controller’s power devices. This method allows the batteries to reach the maximum charge with the less amount of stress than the basic controller by making sure the batteries do not overheat. This will help extend the batteries’ life expectations and keep the batteries in a state of float, or fully charged state, indefinitely. Instead of having a steady charge coming from the panels, a pulse width modulation charge controller sends out a series of short pulses of voltage to the batteries. The controller constantly checks the voltage in between the pulses. When the batteries are fully charged, it will just send a very short pulse to the batteries every so often. When the battery is being discharged, the pulses will be longer. The Pulse width modulation system works using algorithms, which reduce the current to avoid overheating of the batteries and gas releasing from the batteries. This will still have the a continuous charging be in effect, so the amount of power going to the battery will not raise the amount of time to fully charge the battery. This will have a high efficient and fast charging of the batteries. More advance controllers also have the ability to recover lost battery capacity, raise the amount of charge acceptance, remove excess deposits from the battery, and even regulate the temperature in the battery. In Figure 2.5 9, two pulse width modulation controllers are shown and compared. The Morningstar TS-60 has
75

only a 60 Amp max battery current, while the Morningstar TS-45 has a 45 Amp max battery current. Now both have a nominal system voltage range from 12 Volts to 48 Volts, so it should work with the golf cart 36 Volt motor. Now the peak efficiency of the TS-60 and the TS-45 is the company’s proud standard of 99%. Now the self consumption is split into two parts and converted into mA for the self-consumption for both the TS-60 and TS-45. This means their total self-consumption is <27.5 mA. [47]
Manufacturer Morningstar Manufacturer MorningstarModel Number TS-60 Model Number TS-45Type PWD Type PWDMax Battery Current 60 A Max Battery Current 45 ANominal System Voltage 12 - 48 V
Nominal System Voltage 12 - 48 V
Peak Efficiency 99% Peak Efficiency 99%Max Solar Voltage 125 V Max Solar Voltage 125 VSelf-Consumption (Controller) <20 mA
Self-Consumption (Controller) <20 mA
Self-Consumption (Meter) 7.5 mA
Self-Consumption (Meter) 7.5 mA
Dimensions 10.3"x5"x2.8" Dimensions 10.3"x5"x2.8"Weight 3.5 lbs Weight 3.5 lbsCost $202.86 Cost $169.40
Additional NotesDisplay
Screen, Data Logging
Additional NotesData Logging
Figure 2.5 9 – Table for Pulse Width Modulation Controllers
2.5.4.2 Maximum Power Point Tracking ControllerMaximum power point tracking, or MPPT, is a more recent form of solar charge controllers. This controller optimizes the match between the solar panels and the main set of batteries by taking the higher DC voltage from the panels and downgrades it to a lower voltage to help charge the batteries better. It converts the excess voltage coming from the solar panels into amperage. This can keep the charge voltage at optimal levels, while reducing the time needed to charge the batteries fully. This controller allows higher voltage to pass through the wires from the panels. This will reduce the power loss that comes from the wires. They have an efficiency range of 94% to 98% and can provide 15% to 30% more power to the battery. Now during winter the temperatures of the panels are normally lower, a maximum power point tracking controller will take advantage of this and increase the power output. This is a great advantage since winter
76

usually has less ideal period of time to use the solar panels to charge the batteries. During the winter time, the controller can produce about 20% to 45% in power gain, while during the summer it is only a 10% to 15 %. These measurements are determined by weather, temperature, state of charge from the battery, and other factors. Now the controller tracks the voltage of the panels and batteries normally digitally. There are however a few non-digital maximum power point tracker charge controllers out there. These are normally cheaper, and easier to build and design; however, they are not as effective as the digital ones and can lose their tracking point and slowly become worse over time. It compares the voltage of the batteries to that coming from the solar panel and determines the best power rating to use to charge the batteries in the most efficient manner. Now the controller is a DC to DC converter technically. In Figure 2.5 10, two different maximum power point tracking controllers are compared. Now maximum power point tracking controllers are a bit more expensive as shown with an average cost of roughly $500.00..[47]
Manufacturer Morningstar Manufacturer Outback Power
Model Number TS-MPPT-60 Model Number FM-60Type MPPT Type MPPTMax Battery Current 60 A Max Battery Current 60 ANominal Max Solar Input (12V) 800 W Nominal Max Solar
Input (12V) 900 W
Nominal Max Solar Input (24V) 1600 W Nominal Max Solar
Input (24V) 1800 W
Nominal Max Solar Input (48V) 3200 W Nominal Max Solar
Input (48V) 3600 W
Nominal System Voltage 12/24/36/48 V Nominal System
Voltage12/24/36/48/6
0 VPeak Efficiency 99% Peak Efficiency 98.1%Max Open Circuit Voltage 150 V Max Open Circuit
Voltage 150 V
Battery Operating Voltage Range 8-72 V Battery Operating
Voltage Range 10-60 V
Max Self-Consumption 2.7 Watts Max Self-
Consumption N/A
Dimensions11.4"x5.1"x5.6
" Dimensions 13.5"x5.75"x4"
Weight 9.2 lbs Weight 11.56 lbsCost $502.86 Cost $508.98
Figure 2.5 10 - Table for Maximum Power Point Tracking Controller
Though these controllers are much more expensive than the pulse width modulation controllers, they are far more superior to those average pulse width controller. The Morningstar’s TS-MPPT-60 has a peak efficiency of 99%, while the Outback Power’s FM-60 has a peak efficiency of 98.1%. Now the FM-60 can
77

reach a higher nominal system voltage of 60 Volts, while the TS-MPPT-60 can only reach 48 V. Both controllers have a maximum battery current of 60 Amps. The FM-60 does come with a 3.1” LCD display screen with data logging. Now the TS-MPPT-60 does have a standard display screen with data logging, but it also have an Ethernet port for full internet access
2.6 Power Allocation2.6.1 Voltage Regulators
Voltage regulators will be used in conjunction with a transformer to power the IC devices and sensors. There are two main types of voltage regulators, linear and switching. Linear voltage regulators are easier to implement and can be modified to become switching regulators. Switching regulators are take a bit more work to implement but are much more power efficient than a linear regulator.
2.6.1.1 Linear Voltage RegulatorsLinear voltage regulators, as stated above, are the easiest to implement. They require an input voltage and a few passive elements, usually resistors. Figure 2.6 1 is an example of a simple linear regulator circuit made with LM117HV from National Semiconductors. The figure came from the datasheet for the LM117HV by National Semiconductors. It is a very basic circuit that requires two resistors and two capacitors if needed. The output voltage is controlled by altering the values of the two resistors. In Figure 2.6 2 is the circuit that is used to convert the LM117HV to a switching regulator which was found on page 9 of the datasheet. This takes a bit more work to implement than an already built switching regulator. [18]
78

Figure 2.6 1 – LM117HV voltage regulator circuit [18]
Figure 2.6 2 – LM117HV switching regulator circuit [18] pending
The LM117HV is, like most voltage regulators, inefficient when V in is much larger than Vout. Figure 2.6 3 is the output current vs. Vin – Vout differential graph which
79
came from page 4 of the data sheet. As the difference of the input and output voltage grows, the output current drops severely. From this, the power of the output can be calculated and will decrease like the output current. This means that the regulator is eating up most of the power. This makes it a poor choice for stepping down the voltage that comes out of the transformer. [18]
Figure 2.6 3 – current limit of LM117HV [18] pending
2.6.2 Switching RegulatorsAn alternative to using linear regulators are switching regulators. Switching voltage regulators tend to be more efficient than linear regulators even though it may take a few more parts to implement. It takes less than half of the parts to implement a switching regulator than to convert a linear regulator to a switching regulator as can be plainly seen by comparing Figure 2.6 2 to Figure 2.6 4 which is the switching regulator circuit for the LM2576 adjustable switching regulator [4]. The linear regulator would need twelve additional elements added to turn it into a switching regulator which would take more time to build and more parts to acquire. The adjustable version of the regulator allows for more flexibility in design. If the voltage that needs to be outputted needs to be change at any point in time it can easily be done by altering the values of circuit elements (the formula for which can be found in the data sheet). This is much less of a hassle than finding a different voltage regulator and designing an entirely new circuit around it.
80

Figure 2.6 4 – circuit for implenting LM2576 adjustable voltage regulator [19]Pending
81
3 Design3.1 Solar Panel System
The purpose of the solar power system is to help charge the batteries of the golf cart. In Figure 3.1 1, the basic concept of the solar power system is shown in diagram form. The diagram shows that two solar panels that have been connected in series will be in use. This will be explained below in further detail. The power that is generated by the solar panels will be sent through a solar charge controller. From there, it will determine if the voltage of the batteries require charging or not. It also will prevent reverse charging, which happens when there is no voltage being produced from the solar panels and it is taken from the battery bank. Now if the voltage is sufficient and the batteries need charging, the controller will allow the voltage form the solar panels to charge the batteries. Now the power from the solar panels can be used to run the HUD, speed controller, and the 36 Volt motor if need be. This however, is not recommended. Quick recharge and draining can severely shorten the life span of most batteries. Also it can affect the performance of the equipment and even damage it.
Figure 3.1 1 – Basic Solar Power System Diagram
Since there are 6 – 6 Volts deep cycle lead acid batteries, which are connected in series, the total voltage in the battery bank will be close to 36 Volts. Now since most battery’s cell has a rough estimate of 2.35 Volts per cell, instead of the given 2 Volts per cell and that each 6 Volt battery has 3 cells in it, this information means that each battery has an estimated voltage of 7.05 Volts in each battery and the battery bank has a total voltage of 42.3 Volts in a rough estimate. The voltage that comes out of most solar panels will be lower than the 36 Volts. Since the estimated voltage that the batteries need to is at 42.3, the voltage that comes from the solar panels needs to be well over that. This means that at least two solar panels will be needed to correctly recharge the batteries, through the solar panel system. Because of the great difference in the solar panel’s variables, which are mainly weather and intensity of the sunlight, the solar panels will not always reached their maximum voltage.
82

3.1.1 Solar PanelChoosing which solar panel to use is the biggest decision to be made. While they are more flexible and have very high voltages, thin film and amorphous silicon solar panels have little to no current and have even less protective elements to it. Though these types of solar panels are often relatively cheap, they are the smallest efficiency rating in all of the solar cell types. As can be seen in Figure 3.1 2, their efficiency can range from 5% to at most 7% or 8 % in production and a 13% in the lab, which barely reaches the production efficiency rating of the others. Now monocrystalline are very efficient solar panels, but they tend to be very expensive. These solar panels also normally have a decent voltage and current. They also have the highest efficiency rating as shown in Figure 3.1 2. The lab’s efficiency rating is around 24%. However, when a higher voltage is need, which for this instance at least 36 Volt solar panel, the price will be well over $500.00 for a decent model. The polycrystalline silicon solar panels are the best type of solar panel for a relatively reasonable price. They normally cost around $350.00 for a middle ranged voltage, such as 26 Volts. Their efficiency is still higher than that of the thin film and amorphous silicon solar panels by double the efficiency percentage.
Material Efficiency in the Lab (%)
Efficiency of production Cells
(%)Mono-
crystalline silicon
about 24% 14 % to 17 %
polycrystalline silicon about 18% 13 % to 15 %
amorphous silicon about 13% 5 % to 7 %
Figure 3.1 2 – Efficiency of Solar Cells (Approved by DavidDarling.com)
Now the best model found for the electric golf cart project is the Canadian Solar CS6P-215-P polycrystalline silicon solar panel. Now as stated previously at least 2 of these panels will be necessary to completely charge the main battery bank correctly. Now it is only priced at $406.35, which makes it the most cost effective solar panel that was reviewed in section 2.6 Solar Panels. In Figure 3.1 3, the data table for the CS6P-215-P is shown again. As previously mentioned its voltage at maximum power is only at 29 Volts. Now to successful charge a single cell in the main battery bank, a voltage of 2.35 Volts per cell is needed. Since there are 18 cells in the battery bank, the voltage required to charge the battery bank correctly is roughly 42.3 Volts. This equation is shown in Equation 3.1 1. Now It will be needed to be set up in series as shown in Figure 3.1 1. When connected in series, the solar panels will double their voltage as well as power rating. Sadly this is significantly larger than the existing roof of the golf cart, so a
83
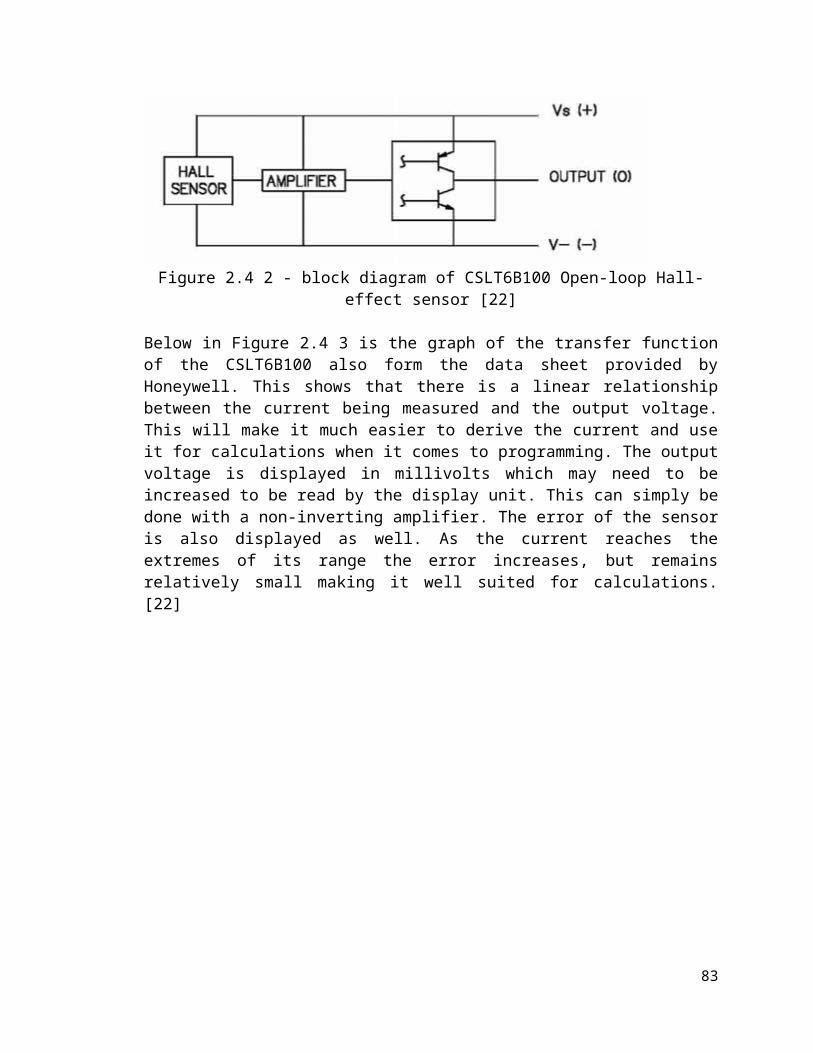
new roof was designed and built in order to keep this correctly on the roof. In Figure 3.1 6, the temperature coefficients of the solar panel are shown. For every degree Celsius, the solar panel will gain 5.6 milliamps of current when it is in short current. The solar panel loses 0.34 percentage per degree Celsius in open circuit. Now for every positive degree Celsius that the solar panel is at the voltage will suffer a 0.43% loss in its voltage at maximum power when it is not on open circuit voltage. From the temperature coefficient a rough estimated voltage is derived the actual voltage of the solar panel can be determined. In Equation 3.1 2, the estimated voltage of two for CS6P-215-P solar panels is shown at 80 degree Fahrenheit. Since 80 degrees Fahrenheit is roughly 27 degree Celsius. 27 degree Celsius will have a temperature coefficient of 90.82%, since 27 multiplied by 0.34% taken from 100% is 90.82%. Now this will be multiplied by double the voltage at maximum power of a single for CS6P-215-P solar panel. The solar panel will produce 52.6756 Volts at a temperature of 80 degree Fahrenheit. This is above the estimated voltage need to charge the battery bank, which is at 42.3 Volts. Now the current during a short circuit is affected by its own temperature coefficient, which is 0.065%. At the same temperature as before, the amount of current is 7.87 Amps. Now the nominal operating cell temperature is 45°C, which is 113°F. The one of the biggest downfalls of using most solar panels is that damage to the exterior panel can reduce the efficiency rating by a slight amount each time. Damages can occur from other natural damages. for CS6P-215-P has a resistance built in against these types of damages, which is show in Figure 3.1 5. This resistance test is called Hailstorm Impact Resistance properties, which is 1” at 50 mph or 25 mm at 80 kph. It also has a wind bearing potential of 50 lbs per squared ft, which is equivalent to 125 mph.
Manufacture Canadian Solar Model Number CS6P-215-P Cell Type Poly-Crystalline Power Rating 215 W Open Circuit Voltage 36.5 V Short Circuit Current 8.01 A Voltage at Pmax 29 V Current at P max 7.40 A Efficiency 12% Power Tolerance +5 W Vmax 1000 V Dimensions (HxWxD)
64.5”x38.7”x1.57”
Weight 44.1 lbs Price $406.35
Figure 3.1 3 – Basic information Table for CS6P-215-P
V charge=¿of cells∗V charge
84

V Charge=18∗2.35Volts=42.3VoltsEquation 3.1 1 – Voltage needed to charge batteries
Max Power Temperature Coefficient -0.43 %/°COpen Circuit Voltage Temperature Coefficient -0.34 %/°CShort Circuit Current Temperature Coefficient -0.065 %/°CNominal Operating Cell Temperature 45°C
Figure 3.1 4 – Temperature Coefficients for CS6P-215-P
V Average=TemperatureCoefficient∗2∗V SolarV Average=¿90.82 %∗2∗29Volts=52.6756Volts ¿
Equation 3.1 2 – Average Voltage from two CS6P-215-P at 80°F or 27°C
Weight 18.1 lb (8.2 kg)Weight (Wind) Bearing Potential 50 lbs/ft^2 (125 mph)
Hailstone Impact Resistance1" @ 50 mph (25 mm @ 80
kph)Figure 3.1 5 – Physical Design Properties of CS6P-215-P
In Figure 3.1 6, a typical IV curve for the CS6P-215-P solar panel is shown. This shows the relationship between the amperage and the voltage. There are several different curves shown to show the differences between the temperatures. When the solar cells are at 25° Celsius, the curve will be shown as a solid red line and will have 1000 Watts per square meter. This curve’s amperage begins to curve downwards rapidly around the 25 Volts mark. When the solar cells are at 45° Celsius, the next curve will be shown as a curve with solid light yellow green line and will have 600 Watts per square meter. The curve’s amperage begins its rapid downward descent around 25 Volt mark as well. When the solar cells are at 65° Celsius, the next curve will be shown as a curve with a solid purple line and will have 400 Watts per square meter. The curve’s amperage has a rapid descent around 25 Volt mark.
85
Figure 3.1 6 – Typical IV Curve for CS6P-215-P
Since this will be designed to be attached to the roof of a golf cart, which will be moving at high speeds for a golf cart and needs to be able to steer decently, many of the installation methods cannot be applied to this specific project. Though it is much more effective and can dramatically increase efficiency, the tracking solar panel mount is dangerous and can easily be broken. Another two methods are the fixed solar panel mount and the adjustable solar panel mount. The solar panels should be designed to have a slight angle, because it will increase the amount of the solar panel to direct sunlight. Now the adjustable solar panel mount allows the driver to adjust the angle according to what the seasons are and the amount of sunlight is out and what direction the sunlight is coming from. Though it is a good design, this design can cause problems in the future with the sliding of the solar panels. The most stable and secure design is to have it fixed at a slight angle on top of the roof of the golf cart. There will have to be at least 4 support beams added to secure and support the heavier solar powered golf cart roof. This design allows the weight of the solar panels to be distributed more equally throughout the golf cart. Now drivers still need to be careful and not tip the golf cart, or it may cause harm to the solar panels on the roof.
Now since most mounts for solar panels are not made for golf carts, a new roof mount has to be designed. Though it was stated previously, it will not have the 4 additional support beams to insure that the roof will not collapse in on itself. Since the CS6P-215-P has a length dimension of 38.7 inches, a width dimension of 64.5 inches and a small height dimension of only 1.57 inches, the best
86

possible way to contain these two very long solar panels are to have them set flushed together on their width size. This will make the new dimensions 77.4 inches for length, 64.5 inches for width, and the same 1.57 inches for height. Now the new roof mount is composed of treated 2x3 and 2x4 wood beams. The dimensions of the new roof will be 78.5 inches for length, 65 inches for width, and 2 inch for height. This allows for a bit of extra room for the solar panels to get settled on. Now this will be placed on top of the existing roof. The existing roof will act as a support structure for the new roof. There are holes that have been drilled into the roof to allow the solar panel to be bolted into the roof. The next section to deal with will be the support beams. Since the existing support beams allow close to 200lbs to be on top of the roof, there will be no need for extra support beams. The top part will be securely anchored to the bottom of the new roof. It will be bolted into the sides of the golf cart. Now in Figure 3.1 7, the actual dimensions of the solar panels are shown. This also includes the mounting holes and the grounding ports. Each drilled hole was made a little bigger to ensure that all the bolts are able to fit in correctly and the solar panel can be mounted to the board. The wooden board have been treated and have a coat of water repellant paint added to it. This ensures that the wood won’t rot and decay from any form of humidity or water.
Figure 3.1 7 – Dimension Schematics for CS6P-215-P
87

Figure 3.1 8 – Drawing for Solar Mount Bottom View
Figure 3.1 9 – Drawing for Solar Mount Side View
88

3.1.2 Solar Charge ControllersThe next major step in designing a solar panel system is to find what kind of solar panel charger will be needed to be in use to help control the flow of power. The maximum power point tracker is the best and most suitable solar charge controller on the market. They are more expensive to the next type, which is the pulse width modulation. Due to budget constraints and the sheer fact that the maximum power point tracker is not necessary for this type of project, a pulse width modulation solar charge controller has been decided to be implemented. Most of the maximum power point tracker, which can be used for a 36 Volt solar system, cost around $500.00, while the pulse width modulation solar charge controller can be found under $200.00. Now the Morningstar TS-45 was decide that it works the best for the solar part of the golf cart project, which the TS-45 manufacturer’s data table is shown in Figure 3.1 10. Morningstar has the highest peak efficiency in the market, which is at 99%. The TS-45 does not have a nominal system voltage of 36 Volts. The 36 Volts is implemented by setting the charge controller to Now the downside to this model is that its maximum self-consumption is pretty high at 2.7 Watts. It also has a nice battery operating voltage range of 8 Volts to 72 Volts. Now the nominal maximum solar input of 36 V is not shown in the table; however, it can be assumed that it will be at 2400 Watts. This assumption comes from the fact that at 12 Volts, the nominal maximum solar input is at 800 Watts. At 24 Volts, it increases to 1600 Watts, and at 48 Volts, it increases to 3200 Watts. Thus for every 12 Volts, the nominal maximum solar input will be increased by 800 Watts.
Manufacturer MorningstarModel Number TS-45Type PWDMax Battery Current 45 ANominal System Voltage 12 - 48 VPeak Efficiency 99%Max Solar Voltage 125 VSelf-Consumption (Controller) <20 mASelf-Consumption (Meter) 7.5 mADimensions 10.3"x5"x2.8"Weight 3.5 lbsCost $169.40Additional Notes Data Logging
Figure 3.1 10 – Table for Morningstar TS-MPPT-60
A major issue with any type of electronics, which will stationed outside in the state of Florida, is the tropical weather and humidity of this state. In Figure 3.1 11, the environmental information for TS-MPPT-60 is shown. This sates what the working temperatures and what kind of precaution is used to protect the
89

electronics aboard the solar charge controller. The TS-MPPT-60 humidity rating is 100% non-condensing, so no moisture from the humidity will stay inside the controller. Now other precautions used is epoxy encapsulation, conformal coating, and marine rated terminals. Now since it has marine rated terminals, this particular model can be used on most boats and most things that will be used nearby any body of water. The ambient temperature of the controller is -40°F to 113°F. Now when in storage, the temperature of the controller shouldn’t drop below -67°F and rise above 212°F. If the controller stays any of these temperatures for an extended period of time, the controller can be damaged.
EnvironmentalAmbient Temperature -40°C to 45°C (-40°F to 113°F)
Storage Temperature -55°C to 100°C (-67°F to 212°F)
Humidity 100% non-condensing
Tropicalization Epoxy Encapsulation, Conformal coating, Marine rated terminals
Figure 3.1 11 – Table of TS-45 Environmental data
According the table in Figure 3.1 12-1 and Figure 3.1 12-2, the TS-45 uses a common 4 stage charging algorithm. It has 4 unique charging stages. These stages are called the bulk stage, absorption stage, float stage, and the equalize stage. All of the stages have been explained in section 2.6.4 Solar Charge Controllers. Now it uses the 4 stage charging stages to equally distribute all the power coming from the solar panels to help charge the batteries correctly and efficiently. There is some temperature compensation used though. The temperature coefficient for the TS-45 is only -5 millivolts per degree of Celsius per cell, which is only a 25° ref. This means that there should only be a -90 millivolts per degree of Celsius for the entire 36 Volt battery bank. Now the effective temperature range of this controller is -30°C to 80°C, which should equal to about -22°F to 176°F. Since the temperature in the state of Florida seem to never get even remotely close to the minimum and maximum of the temperature range, the charge controller can easily charge the batteries here correctly without any interference from the temperature. The set points of the solar charge controller can be set during the absorption stage, the float stage, the equalize stage, and the HVD stage.
Battery ChargingCharging Algorithm 4-Stage
Charging StagesBulk, Absorption, Float,
EqualizeFigure 3.1 12-1 – Table of TS-45 Battery Charging Data
90

Temperature Compensation:Coefficient -5 mV per °C per cell (25° ref)
Range-30°C to 80°C (-22°F to
176°F)
Set pointsAbsorption, Float Equalize,
HVDFigure 3.1 12-2 – Table of TS-MPPT-60 Battery Charging Data
Now the TS-45’s solar charge controller has a system will keep track of the data for up to 200 days. Now it stores the data of each day for the battery and the solar panels. The information from the solar panel includes the maximum amperage for that day and the maximum voltage for that day as well. The solar charge controller only records the minimum voltage of the batteries for that day. Now the data logging is a major factor for testing and upkeep on the electric golf cart. It shows if the solar panels should even be operating on certain days. The information is stored in the solar charge controller and then can be downloaded to a computer using a serial port connector. The solar panels should be turned off if the voltage of the batteries is below that of the solar panel. Also the solar panel system should be shut off if the voltage of the solar panels does not exceed over 42.3 Volts, which is the minimum needed to charge the batteries correctly and without damage to them.
3.1.3 WiresAnother major factor to deal with in the solar panel system design is what type of wires to use and the length those wires needs to be. Now each solar panel and controller will have in their user manuals what type of wires to use. There are even charts that will help explain the voltage drop rate percentage. After a certain distance the wires will start to have a rapid increase in the voltage drop percentage. In Figure 3.1 15, the diagram shows some of the smaller wire gauges versus some lower currents levels. Now it also so what the maximum distance for a 3% loss is at each combination. As the current increase, the distance will decrease rapidly. Now the current will also increase as the wire gauge is increasing one increment at a time.
Wire GaugeCurren
t #12 #10 #8 #6 #4
4 68.1 108.9 173.4 274.8 4386 45.6 72.6 115.8 183.3 292.28 34.2 54.6 86.7 137.4 219.310 27.3 43.5 69.3 110.1 175.2
Figure 3.1 15 – Table for maximum distance for 3% loss using Current vs. Wire Gauge
91

3.2 HUD DesignAfter reviewing several touch screens, LCD displays, and their associated controllers, many important factors for choosing a heads up display were discovered. For touch screens, view area and price were the two most important factors. As the view area of touch screens becomes larger, the price increases significantly. Large touch screens were quickly ruled out based on our budget. Therefore, it was decided that an LCD display with an LCD controller was the best fit for our requirements. Although, since touch screens have the ability to take in user input, a new method must be used for getting input from the driver. Three buttons will be used to take in user input for the three modes of operation. These buttons will be connected to the LCD controller so that the current mode of operation can be displayed on the LCD display. The buttons will also be connected to the micro controller that is responsible for switching modes of operation. In the bulleted lists below, the deciding features are shown to portray the important features that went in to deciding whether or not to use certain products.
CFAG160128B-TMI-TZ Monitor with T6963CFG Controller: Large view area: 101.0mm x 82.0mm Can display more columns and rows than other displays: 40 columns x 16
rows Programmed in assembly
CFAF320240F-T-TS Touch Screen with SSD2119 Controller: Small view area: 71.70mm x 55.65mm Supports moving picture display Programmed in C
EA EDIP320J-8LWTP Touch Screen Largest view area: 115.18mm x 105.00mm Most expensive User-friendly touch screen features such as touch buttons and radio
buttons
NHD-3.5-320240MF-ATXL#-T-1 Touch Panel: Small view area: 70.08mm x 52.96mm High resolution for small area: 320 x 240 RGB pixels
AD7877 Touch Screen Controller: Could be interfaced with the NHD-3.5-320240MF-ATXL#-T-1 touch panel Supports wake-up on touch
HD44780U LCD Controller: Used for very small LCD displays: 80 x 8-bit display RAM (80 characters
max)
92

Simple and cheap solution
SED1335 LCD Controller: Supports text and graphics Supports high resolution: 640 x 256 pixels
SID15G00 LCD Controller: Used for smaller LCD displays Has power saving mode and high performance mode that could
correspond with the three modes of operation of the golf cart
Nios II 3C25 Microprocessor with built in LCD Controller: Only product reviewed with a built in MPU FPGA compatible.
Arduino Uno Open source Many examples to learn from Easiest to program Interfaces well with HD44780 displays
3.3 Power Allocation3.3.1 Voltage Regulator Design
Each of the sensors along with the microcontroller and display screen all require a supply voltage that is significantly less than that of the total voltage produced by the batteries. Since using one battery to power the devices would drain the battery at a faster rate than the rest and using a voltage divider would not add any protection from fluctuations in current and voltage, the best way to power the devices is to use voltage regulators. The LM2576 adjustable voltage regulator and the LM117HV adjustable linear regulator will be used to step down the voltage to appropriate levels.
The LM2576 can handle input voltages up to 40V and the high voltage version can handle an input voltage up to 60V. The circuit used to implement the LM2576 is shown if Fig.-1 with different values and will be used to drop the 36V from the batteries down to 12V to power the speed sensor. V in for the equations will be 36V and Vout will be 12V. The values for R1 and R2 will be calculated using the equations
Vout = Vref (1 + R2/R1) [19]Equation 3.3 1 – Vout
R2 = R1 (Vout/Vref – 1) [19]
93
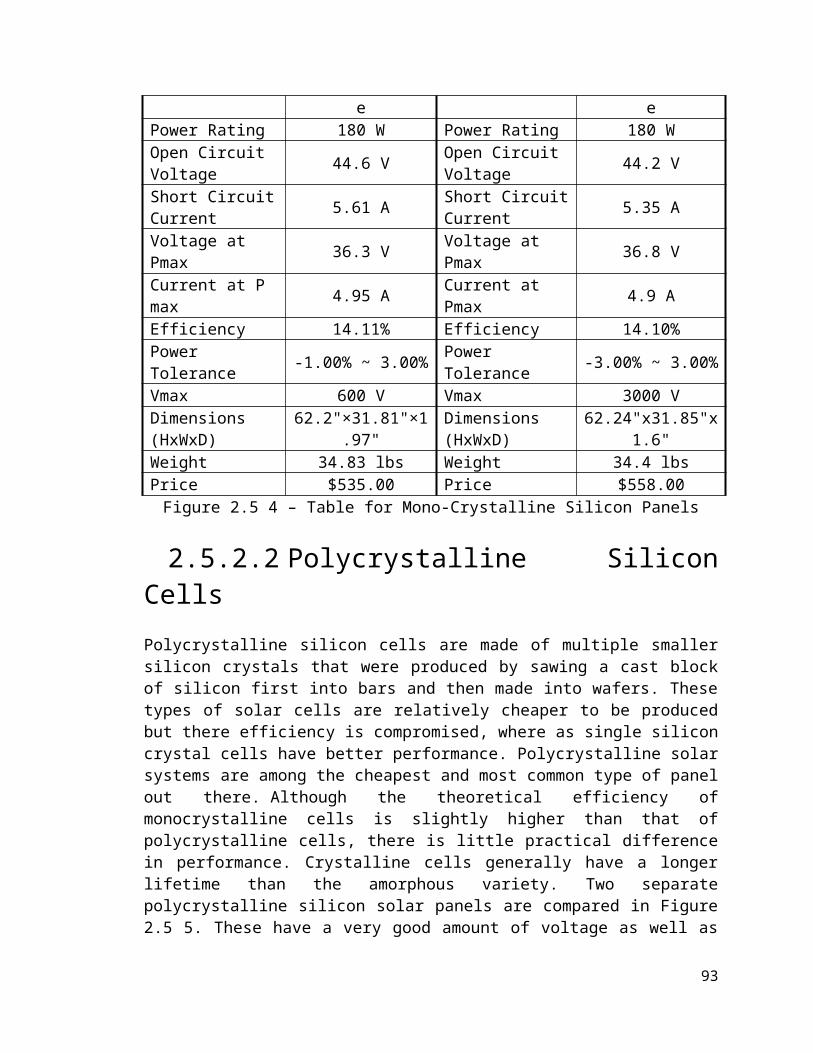
Equation 3.3 2 – R2
with Vref = 1.23V and R1 picked to be between 1 and 5kΩ. To simplify matters, R1 will be chosen to be 1kΩ. The value of R2 came out to be 8.75kΩ. The value of E x T will be calculated using the equation
E x T = (Vin – Vout) Vout/Vin * 10^6/F [19]Equation 3.3 3 – E x T
where F = 52000, and will be used to find the value of L1 using the tables in the data sheet. The value of L1 will then be used to find the minimum output capacitance using the formula
Cout(min) ≥ 13300 Vin/(Vout*L) [19]Equation 3.3 4 – minimum Cout
The minimum value for Cout came out to be 120.91µF. The values of the parts that are needed to implement the circuit can be found in Figure 3.3 1. For simplicity and ease of buying parts, the input and output capacitance will be set at the same value. The resistors will be surface mount, thin film resistors that have a one percent tolerance and ceramic capacitors will be used due to price and tolerance.
Part ValueR1 1kΩR2 8.76kΩCin 470µFCout 470µFL 330µH
Figure 3.3 1 – Values of circuit components found from calculations
94

Figure 3.3 2 – Circuit for LM2576 adjustable regulator from ON Semiconductor data sheet [19]
The LM117HV will be implemented using the circuit in Figure 3.3 2 with the calculated values. The capacitors will be used if it is determined in testing that they are needed. This regulator will be used to step down the voltage from 12V to 5V so the remaining devices can be powered. The value of R1 will be chosen as 1kΩ and the value of R2 will be calculated using the equation below.
Vout = 1.25 (1 + R2/R1) + IADJR2 [18]Equation 3.3 5 – Vout
with Vout = 12V and IADJ assumed to be zero. The value of R2 comes out to be 3kΩ. A 4kΩ potentiometer will be used in place of R2 as a way to adjust the value of R2 to produce the correct output voltage in case there is a mistake in the calculations or to account for any interference or noise that may be present.
Figure 3.3 3 – Circuit for LM117HV linear regulator from National Semiconductor data sheet [18] pending
3.4 Sensor DesignThere are three sensors that need to be taken into account when designing the system. The current sensor that will be used is the CSLT6B100 open-loop Hall Effect sensor made by Honeywell. This sensor will be set to measure the output current of the batteries will be placed directly after the ignition switch. If the cable that will be used to connect the batteries to the system have a diameter of 5.2mm, then the sensor will be placed around the cable with wires attaching it back to the rest of the circuit. If the diameter of the cable is larger or small
95

enough that it can easily go though the sensor, the current sensor will be mounted on the circuit board with an appropriate sized wire fed through it.
The speed sensor that will be used will be the 55100 Mini Flange Mount Hall effect sensor made by Hamlin. This sensor will be mounted above the front wheel axel to make it as close to the rest of the circuit as possible. A three wire cable that will come with the sensor will be used to attach the sensor to the rest of the circuit. A ring magnet will be placed around the axel just below the speed sensor to give it something to detect.
The voltage sensor will be represented by a voltage divider circuit in parallel with the batteries. It is the only sensor that requires some thoughtful design to it since it shouldn’t draw a lot of power from the batteries. A simple two resistor circuit will be used to do the calculations and yielded that the first resistor in the series R1 = 5.8R2 where R2 is the second resistor in the series. R2 will be set at 100kΩ making R1 equal to 580kΩ. The maximum power consumption of this circuit is only 1.91mW of power making it less of a drain on the batteries than if 10kΩ and 58kΩ resistor were used. The problem is that there are no 580kΩ resistors to speak of. R1 will be divided up into two resistors, like in Figure 3.4 1, consisting of a 560kΩ and a 20kΩ resistor. The voltage just before the 100kΩ will be the one being used as the input voltage to the HUD and microcontroller.
Figure 3.4 1 – Voltage divider circuit for voltage sensor
3.5 Microcontroller designThe microcontroller that will be used to implement the design is the ATmega644 from Atmel. Its various functions and peripherals make it a good microcontroller for the job. It can have external interrupts, produce various outputs, comes with an A/D converter, PWM, and analog comparator. This microcontroller will be responsible for controlling the modes of operation for the golf cart. It will receive inputs from the sensors and the HUD and produce an output that will be sent to the speed controller.
96

The only sensor that will be hooked up to the microcontroller will be the voltage sensor. The HUD will be responsible for power calculations and monitoring the system while the Microcontroller will be responsible for controlling it. The voltage needs to be monitored so that when it drops fifteen percent of the total voltage, the microcontroller will automatically switch the golf cart into its power saving mode. Pin D0, located at Pin 14 according to Figure 3.5 1, will serve as the input port for the voltage regulator since it can serve as one of the external interrupts for the microcontroller. Since the voltage that will be inputted to the microcontroller is a fraction of the original, the microcontroller will monitor the percentage of the voltage. The power saving mode is to be switched to when only fifteen percent of the battery voltage is left. The max output voltage of the sensor corresponding to the batteries is about 5.2V. When the battery voltage reaches 5.4V, the input to the microcontroller will be at .78V. At this point, the microcontroller will automatically switch the golf cart into power saving mode.
The microcontroller will be attached to three switches on the HUD that will be used to select the desired mode operation. The switches will be attached to Pins A0, A1, and A2. A switch statement used in the program will be used to select the appropriate operation mode depending on which one of the switches is turned on. A switch statement will be used to implement the change in modes.
The microcontroller also has to be to control the output of the speed controller so that it is operating in the appropriate mode of operation. The speed controller will be attached to Port C of the microcontroller. From this port, the appropriate output will be sent to the speed controller so that it is operating in the correct mode of operation.
97
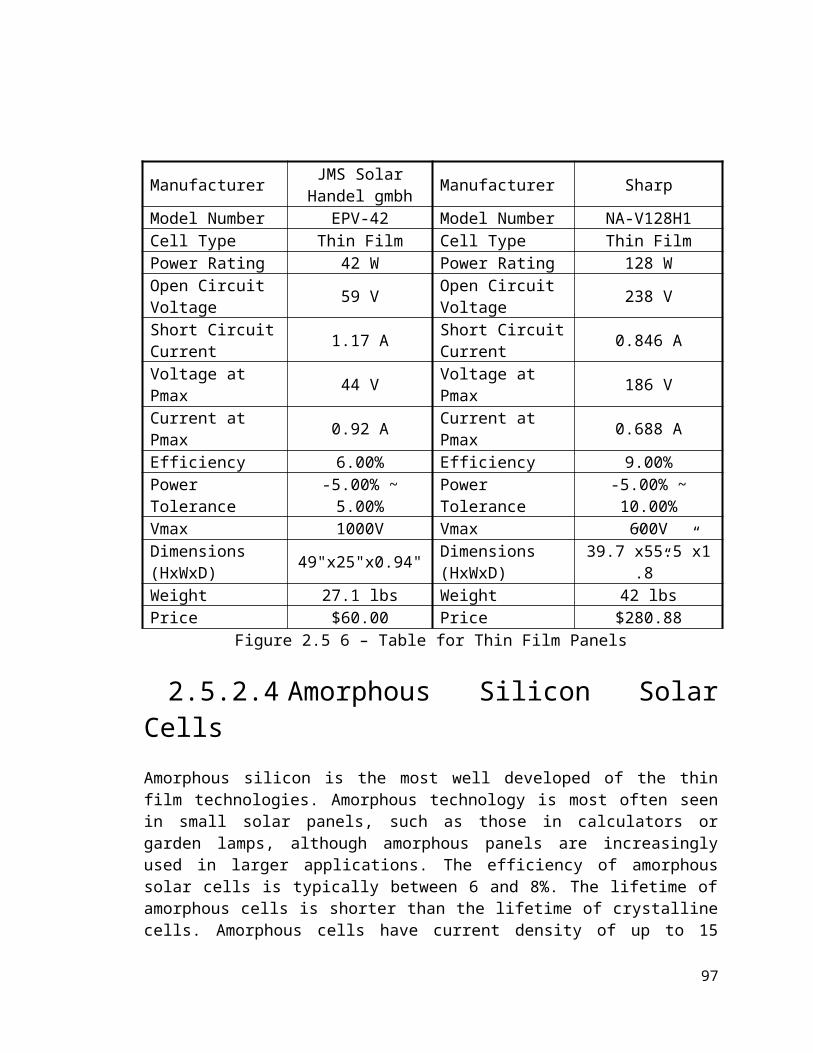
Figure 3.5 1 – Pin layout of ATmega644 microcontroller from Atmel data sheet [16]
3.6 Printed Circuit Board DesignThe printed circuit board was designed using the software PCB123. This software is made by the company Sunstone, who also make the boards that are designed using the software. The board will contain both voltage regulator circuits, the voltage sensor, and will be used to connect the sensor outputs to the Arduino UNO. The circuit board design that was sent in can be seen in Figure 3.6 1 below. Due to some changes in design that occurred after this design, some of the terminals now have different uses or are not used all together. The bottom left corner terminal supplies voltage to the pot box and the ground on the current sensor terminal is used to ground the pot box. The terminal to the right of the seven pin terminal was no longer needed since the Arduino became the only microcontroller that was being used.
98

Figure 3.6 1 – Printed PCB board Diagram
3.7 BatteryThe final consideration into choosing a battery for the golf cart is the budget of the project. An analysis of different types of Trojan deep cycle batteries is shown in Figure 3.7 1.
Model Voltage Ah rating type Peukert number
cost
T105 6 225 Wet Cell 1.2 $1596VGEL 6 240 Gel Cell 1.12 $2696V-AGM 6 200 AGM 1.08 $32924 TMX 12 85 Wet Cell 1.2 $13924GEL 12 77 Gel Cell 1.12 $21927 AGM 12 100 AGM 1.08 $269
Figure 3.7 1 – Table of Batteries
The AGM batteries have the lowest Perkert number and would be the best choice for this project. At lower current draws the AGM batteries will approximately have a 25% larger nominal charge than the wet cell batteries, and approximately an 11% larger nominal charge than the gel cell batteries. At larger current draws the nominal charge difference can be as large as 60% for wet cell batteries and 20% for gel cell batteries. However, the increased performance of an AGM battery does not make up for the difference in cost. The cost of an AGM battery is double the cost of a wet cell battery. The increase in performance offered by the AGM battery does not outweigh the increase in cost. For this
99

project the wet cell flooded lead acid battery will be chosen because it best suits the project budget. The configuration of how the batteries are connected affects how they perform. Once the batteries are connected they can be thought of as a single battery. The total output voltage is the sum of the voltages of the batteries that are connected in series. The total AH rating is the sum of the batteries that are connected in parallel. The motor requires a 36 volt input which can be attained by connecting six 6V batteries in series or three 12V batteries in series. Connecting six 6V batteries in series will produce a battery that is 36V and has a 225Ah capacity. Connecting three 12V batteries in series will produce a battery that is 36V and has an 85Ah capacity. Due to the significant increase in capacity of using 6V batteries, the Trojan T-105 6V wet cell battery will be used for this project. [5]
3.8 Speed controllerDuring the build of the project it was determined that the PWM speed controllers discussed in 2.1.5.2 and 2.1.5.3 would not be able to implement the different modes of operation while the golf cart was running. It was decided that a PWM speed controller would have to be designed and built. The following text discusses how this was done and how the PWM speed controller was implemented. To sense throttle position the accelerator pedal was connected to a 0-5kΩ potentiometer or “pot box”. As the accelerator pedal was pushed down the resistance of the pot box would increase from a resistance close to 0Ω to 5kΩ. The pot pox was placed in series with a 1kΩ resistor to form a voltage divider circuit. A Voltage of 5 volts would be supplied from the PCB board to the voltage divider circuit, and the voltage across the 1kΩ resistor would be read by the arduino uno. Initially the arduino uno would read 5 volts from the voltage divider. As the accelerator pedal was pushed down the read voltage would decrease. Based on how much the voltage decreased the arduino would calculate the duty cycle of the PWM signal required to achieve the speed desired. The PWM signal generated by the arduino was 5 Volts when the duty cycle was high and 0V when the duty cycle was low. This signal was then used as an input into an amplifying circuit. The circuit is shown in figure 3.8.1. The PWM signal after the amplifying circuit would be 8 volts when high and -6 Volts when low. The positive 8 volts was used as the turn on voltage to 4 IXFX320N17T2-ND N-channel MOSFETS. These MOSFETS were connected in parallel to reduce the current flowing through each one, which in turn reduced the heat generated. The negative voltage was necessary to completely stop current flow into the motor during the low portions of the duty cycle. The array of parallel MOSFETS would be connected in series with the batteries, the motor, and a solenoid switch. To engage the solenoid switch 3 other micro switches are required to be closed. The first is the key switch. The second is the forward and reverse switch, and the third is a micro switch placed on the pot box. To close the key switch the switch would need to be in the on position. To close the forward and reverse switch the handle would need to be placed fully in the forward or reverse position. To close the pot box switch the pedal would need to
100

be pushed down. Once pressure was released from the accelerator pedal a spring would return it to the off position and the micro switch on the pot box would open. This would ensure that current could not be supplied to the motor without the drivers consent.
Figure 3.8 1 – PWM amplifying circuit
3.10 Explicit Design SummaryThe overall design of our project is oriented around making a more efficient golf cart. To do this, a solar panel will be installed that will charge the batteries in the golf cart. There will also be three touch buttons in the golf cart that will allow the driver to switch to different modes of operation. The purpose of the modes of operation is to control the energy used by the golf cart. A significant amount of energy can be saved depending on the needs of the driver. There is a standard mode of operation, in which the golf cart runs as normally expected. If the driver wants to extend the battery life, he or she can switch into an efficient mode, in which performance will decrease slightly, but the battery life of the golf cart will increase. On the opposite end of the spectrum, the golf cart driver can use a high-performance mode for increased speed and acceleration at the cost of battery life. These three modes of operation are used by installing a new speed controller into the golf cart. The speed controller is programmable and this is where the three modes of operation will be physically implemented. So the driver can know what mode of operation he or she is in, an LCD monitor will be mounted in the golf cart to display the current mode of operation, speed, distance, battery life remaining, and estimated time remaining. Speed and
101

distance will be measured and calculated using a speed sensor that will be installed on a tire, and battery life and estimated time remaining will be calculated using a voltage sensor. Refer to Figure 3.9 1 for more information on design modules.
Figure 3.10 1 – Design Modules
102

4 Build4.1 Build Plan
The build plan for our project was split up into five basic phases: initial golf cart testing, installing the solar panel, speed controller, sensors, and display. Keep in mind that these were broad generalizations of our build plan. Within each phase, many other tasks were performed such as controlling currents, controlling voltages, and installing micro controllers. Throughout almost the entire process, micro controllers were being designed for various elements in the golf cart, the speed controller was optimized for the various modes of operation, and the display controller was coded to perform all of the required tasks. Figure 4.1 1 shows the basic build plan.
Build Task Date CompletedInitial Golf Cart Testing 01/15/10
Solar Panel Installation 01/30/10
Speed Controller Installation 02/15/10
Sensor Installation 02/30/10
Display Installation 03/15/10Figure 4.1 1 – Build Plan
4.2 Initial Golf Cart TestingAfter obtaining the golf cart for our project, as much information was extracted as possible. The information we obtained before altering the golf cart was vital for designing and installing our new components. The solar panel, speed controller, and display were implemented differently based on the initial setup of the golf cart. For example, the type of battery that the golf cart uses determines how power allocation will be handled. Output currents and output voltages from the battery were measured by a digital multimeter.
The golf cart charger was also analyzed in order to configure the solar panel. It was ideal to match the output current and output voltage of the golf cart charger to the output current and output voltage of the solar panel, but if this was not possible, the information extracted from the golf cart charger was still vital for charging the battery with the solar panel. This information was also used to design charging controllers. Since the golf cart has the ability to be charged by both the solar panel and a wall outlet, a controller was designed to control which unit is charging the battery.
The dimensions of the roof of the golf cart determined the size of the solar panel. Most roofs of golf carts are not flat, therefore, the roof was physically altered to
103

accommodate for our solar panel. It was ideal to obtain the largest solar panel possible and this size will be determined based on the dimensions of the roof. We used a material such as wood or PVC pipe to build a mounting device for our solar panel. This made it possible to mount a solar panel that was even bigger than the golf cart roof.
The speed control system in most golf carts uses a variable resistor to adjust the voltage that controls the speed of the golf cart. This speed controller was replaced with a more efficient speed controller that can also implement the three modes of operation. Measurements were taken of the various output voltages and output currents of the old speed control system before the new speed control system was implemented.
4.3 Solar Panel InstallationSince the solar panels come pre-fabricated, the solar panel system is divided into three parts. The first part that was dealt with was the roof mount. As stated in the design section of the project paper. A new roof had to be built. During a visit to a Henry Cruse’s home, the roof mount was built using 2 by 3s and 2 by 4’s wooden beams. This allows better heat dispersion from the solar panels.
The next phase was to correctly connect the solar in series. Since the wires connected to the wire ends of the solar panels have an unique attachment, a specialty wire was purchased online. This wire was an extender. It was cut in half to allow both solar panels to then be connected to the solar charge controller.
The last phase was properly installing the charge controller. Since the nominal system voltages are 12, 24, and 48 Volts, a custom setting had to be created. The software for programming it was quite simple. All that was essential needed was what the charging voltage was. This was determined by taking the charge voltage of a single cell and times it by the number of cells in the battery bank. This came out to a solid 41 Volts. This then was programmed into the charge controller. The next step was to limiting the charge controller to 37.5 Volts to ensure that the unloaded charge voltage of the batteries can be meet.
4.4 Speed Controller InstallationThe previous resistor speed controller was removed from the golf cart. This included the resistor coil, the wiper assembly, and the linkage connecting the wiper assembly and the accelerator pedal. A longer linkage was installed which connected the accelerator pedal and the potentiometer. The housing for the potentiometer, throttle sensing voltage divider, solenoid, and amplifying circuit was fabricated using sheet metal and a bread board. Once the pot box was installed within the golf cart the voltage divider circuit could be implemented. This was done by running 5V from the PCB board though the pot box which was
104

connected in series with a 1kΩ resistor. The pin used on the arduino to sense the voltage would need to be wired in-between the pot pox and 1kΩ resistor. From there the solenoid switch could be installed. This was done by connecting the positive terminal of the batteries to the micro switch located on top of the pot box. The other side of that switch as connected to one of the small terminals on the solenoid switch. Either of the small terminals will engage the solenoid however a diode must be placed running from one of the terminals to the other. This diode prevents the back surge of voltage when the solenoid disengages. The 2nd unused of the smaller terminals on the solenoid is connected to a 50Ω resistor to reduce the current flow through the circuit. That resistor is then connected to the key switch. The key switch is connected to the forward and reverse switch, and that switch is connected to ground. It is important to connect this circuit in series or else it will not work properly. Next the amplifying circuit must be implemented on the bread board. The +12 volt supply voltage comes from the PCB board. The -12 volt supply voltage comes from a 7912 voltage regulator that must also be implemented on the PCB board. It is important to note that these voltage sources are not the ones used in the simulated circuit diagram found in figure 3.8.1, however they were easier to implement. The positive and negative voltage supplied to the gates of the power MOSFETS was increased by doing this. The current flowing through the MOSFETS was limited by the motor and the duty cycle. The increased turn on and turn off voltages were within the acceptable voltage range for the supplied gate voltage and so did not majorly effect the operation of the motor drive. Once the solenoid switch is installed it can be connected in series with the motor. The power MOSFETS are connected on the ground line of the motor. This was done for two reasons. The first reason was so that forward and reverse could be implemented within the golf cart. Through the forward and reverse switch the positive input into the motor was switched between 2 input lines. This was done to change the magnetic field within the motor causing it to spin in the forward or reverse direction. Placing the MOSFETS between the motor and the solenoid switch would require forward biasing them for forward motion, and reverse biasing them for reverse motion. Placing them on the ground line allowed both directions to be implemented with the MOSFETS being forward biased. The second reason for putting the MOSFETS on the ground line of the motor is to reduce the current surge they experience. At time =0 the motor can be considered a short to ground and the current in the line is very high. As the current passes through the field and armature windings it is reduced to safe levels for the MOSFETS.
105

Item Company Ordered from0-5KΩ potentiometer Donated Donated36V solenoid switch Ez-go Advantage golf cars3X micro switches Donated with golf cart Donated with golf cart
1kΩ resistor Skycraft Skycraft3 X 2kΩ resistors Skycraft Skycraft
20kΩ resistor Skycraft Skycraft7912 voltage regulator Skycraft Skycraft7812 voltage regulator Refer to PCB board Refer to PCB board
LF3555N op-amp UCF Electronics 2 lab kit2N5458 transistor UCF Electronics 1 lab kit
4X IXFX320N17T2-ND IXYS Digikey8 gage AWG wire Skycraft Skycraft22 gage AWG wire Skycraft Skycraft
Table 4.4.1 parts used to implement speed controller
4.5 Sensor InstallationSpeed sensor- The speed sensor was installed by the rear wheel on the driver’s side of the golf cart. A magnet that was purchased at Lowe’s was placed on the inside of the wheel hub while a metal bar with holes drilled into it was placed on the axel covering to mount the speed sensor.
Voltage sensor- The voltage sensor will be placed on the PCB. The output of the sensor will be routed to the appropriate place by the PCB with a wire running the output from the board to the microcontroller.
Current sensor- The current sensor will be placed on the wire that will be running from the positive terminal of the battery to the solenoid. The sensor will be connected to the PCB to get power and to have its output routed to the appropriate place.
4.6 Display InstallationThe Arduino Uno serves multiple purposes for this project. It is used to read from sensors, control the LCD screen, and generate PWM signals for the motor. The voltage sensor, speed sensor, potentiometer from the accelerator pedal, and switch for the modes of operation are connected to the analog or digital input pins. The Arduino then uses the values from these sensors and displays them on the LCD screen. Based on the input read from the potentiometer and the current mode of operation, the Arduino Uno outputs a PWM signal that controls the motor. If the pedal is not pressed down at all, the Arduino outputs a 0% PWM signal. The PWM signal percentage increases as the pedal is pushed down. In high performance mode, the maximum PWM signal is 100%, in standard mode,
106

the maximum PWM signal is 75%, and in efficient mode, the maximum PWM signal is 55%.
The Arduino Uno has many digital and analog input and output pins that were used for multiple purposes. Pin A5 was used to read from the speed sensor to read the number of tire revolutions. The number of revolutions was then entered into a formula to calculate speed. Pin A3 was used to read from the potentiometer connected to the pedal. A value over 670 indicates that the pedal was not pressed at all; a value under 140 indicates that the pedal was pressed down all the way, and if the value is in between these numbers, it is inserted into a formula to calculate which PWM signal to send to the motor. Pin 6 was used to send this PWM signal and was altered to run at a frequency of 250 Hz. Pins A0 and A1 were used to read from the switch and triggers Boolean values that control the modes of operation. Pin A2 reads from the voltage sensor which is used to calculate the charge remaining as both a time and a percentage.
4.7 PCBThe printed circuit board was built using the ValuePro option offered by Sunstone. This allows for a cheap prototype board to be built with free ground delivery offered. The soldering of components on the board was all done by hand. This saves time having to get certified to use the machine in the senior design lab. The components were purchased from both Mouser and Digi-Key. Mouser has a greater passive component selection than Digi-key while Digi-key has a better selection of sensors and IC’s available for purchase. Table 4.7 1 lists the components and where they were purchased from.
During testing and assembly, some problems with design of the PCB were revealed. The holes for the LM 2576 and two of the terminal blocks were made too small. The pad size on the holes for the regulator were large enough that the holes could be drilled larger without destroying the connections to the rest of the board. When the regulator was soldered onto the board, both sides of it were soldered into place to ensure a good connection to the PCB and to negate any negative effects that may have come from drilling the holes wider. The same could not be said for the terminal block holes. Since the pads were relatively small and the hole needed to be widened significantly, wires were connected directly to the PCB and soldered in place. The last design problem with the board was that one of the ground traces that was placed did not connect to the ground plane. This was fixed by connecting that wire directly to the ground pin of the PCB.
During testing, a ground trace on the board blew out for some reason. Since there was no power going to the board and there was no damage to the components, the matter was not really looked into. A jumper wire was able to be connected to the ground pin for the voltage sensor and run to the ground input
107

for the PCB. This fixed the problem and the project was completed without any further incident.
Item Company Ordered fromPCB Sunstone Sunstone 1754546 Barrier Terminal Block
Phoenix Mouser
1751251 Fixed Terminal Block
Phoenix Mouser
1759062 Fixed Terminal Block
Phoenix Mouser
4PCV-02-006 Fixed Terminal Block
Tyco Mouser
7.15k Thick Film Resistor Bourns Mouser20k Thick Film Resistors Bourns Mouser560k Thick Film Resistor Bourns Mouser100k Thick Film Resistors
Bourns Mouser
1k Metal Film Resistors Vishay Mouser330uH Inductor Murata Mouser.1uF Capacitor Nichicon Mouser .33uF Capacitor Nichicon Mouser 470uF Capacitor (2) Vishay Digi-KeySchottky Diode Vishay Digi-KeyZener Diode (2) Vishay MouserLM 2576 ON Semiconductor Digi-KeyLM 7805 Fairchild Semiconductor Digi-Key
Table 4.7 1 – Table of materials for PCB build
108

5 Prototype5.1 Prototypes
There was 5 different prototype phases throughout the process of implementing our design into the golf cart. Each prototype also signifies a time where building was temporarily put on hold and various tests in section 4 had to be done. In the paragraphs below, each phase shows the different features that were completed and parts that have been added. Due to multiple complications throughout the experimentation, many prototypes had to be disbanded and new designs were brought forth to hopefully make the golf cart run correctly.
Prototype 1:The initial prototype is the golf cart that is obtained before any modifications. This is considered a prototype because many elements must be thoroughly tested and measured before implementing the design elements. During this prototype phase, it was determined that the battery average runtime is roughly 5 hours. And a stopping voltage was also determined. Also during this time, the exact method of how the rollers were implemented and adjusted was determined. This greatly reduced the amount of time personnel had to be there. It also allowed other work to be done. The rollers gave a constant variable instead of having a changing variable with the roads and ground.
Prototype 2:During a trip to a one of the group member’s home, the frame of the golf cart bowed and broke. During the second prototype, it was repaired using an arc welder and metal beams. The golf cart was fitted with a new roof mount and had the solar panels installed. The solar panels were later uninstalled for its own safety and transportation. Additional minor changes were made to the solar panels so it will be easier to bolt the solar panels to the new roof mount. The wooden roof mount was also painted black with a specialty paint, which will help reduce the amount of water and humidity damage done to the wooden frame.
Prototype 3:During this phase, the Arduino was installed and it was tested so that the screen will display information. The Arduino worked 100% without any major complications, besides an issue of being powered by the PCB board. This was fixed by setting it to another pin on the PCB Board and soldering it on there. The Texas Instrument Stellarios, which later was discarded, was also installed and its pulse width modulation was functionally; however, it did not reach the needed voltage. After a few attempts we decided that it might work better with a Multiplexer along with some Op-Amps. Due to some arching and testing gone bad, this also became a failure during the testing of prototype 4.
109

Prototype 4:This prototype was first attempt at making the motor actually working, which did not actually work, with the new speed controller installed. Shortly after running it, one of the mosFETs had a short. Thus it wouldn’t allow the pulse width modulation correctly turn on and off the mosFETs very fast. Later it was discovered that some of the leads on the mosFETs were about to break apart or have already have broken apart from the mosFET.
Prototype 5:This is the final version of the prototype. During this phase, it was decided that the new mosFETs will be hanging freely. This was because one of them shorted out and the entire metal golf cart frame became electrified. The mosFET had a metal backing and a generous amount of thermal paste was added to it; however, it did short out the mosFET. The other mosFETts were fine and no other damage to the golf cart’s electronics. The solar panels were later hooked up and worked without any hindrances. A huge problem aroused when transporting the Arduino back from the senior design labs. The Arduino decided to stop sending the correct display to the LCD Screen. After a bit of thought and testing pins, it was determined that the Arduino was bad and a new one was purchased with the fastest shipping possible. The new Arduino worked just as well as the old one and had no problems using the programming and LCD Screen from before.
110

6 Testing6.1 Battery Testing
The battery was tested to confirm that its output current and output voltage corresponded with the optimum output current and output voltage calculated for the various modes of operation. This information was vital to assuring that our three modes of operation were implemented as intended. The high performance mode drew higher current and voltage from the battery than standard mode and efficient mode. Efficient mode on the other hand, drew less current and voltage from the battery than both high performance mode and standard mode. In between high performance mode and efficient mode, standard mode runs at the most optimum current and voltage for both performance and efficiency. Refer to Figure 6.1 1 for more detailed test descriptions and conditions.
Test Description Test ConditionsMeasuring the output current from the battery in standard mode.
Using the switch, the mode of operation was changed to standard mode. A digital multimeter was used to measure the output current of the battery at different speeds.
Measuring the output current from the battery in high performance mode.
Measuring the output current from the battery in efficient mode.
Measuring the output voltage from the battery in standard mode.
Using the switch, the mode of operation was changed to standard mode. A digital multimeter was used to measure the output voltage of the battery at different speeds.
Measuring the output voltage from the battery in high performance mode.
Measuring the output voltage from the battery in efficient mode.
Measuring battery life without solar panel attached.
The battery life was measured from different percentages of charge remaining. The time it takes to charge from 0%, 25%, 50%, and 75% charge remaining was measured.
Measuring battery life with solar panel attached.
The battery life was measured from different percentages of charge remaining. The time it takes to charge from 0%, 25%, 50%, and 75% charge remaining was measured.
Figure 6.1 1 – Battery Testing
111

6.3 Display TestingThe display in the golf cart is used to display various sensor measurements and allow the driver to switch between modes of operation. All sensor measurements were tested to make sure they are accurate. The driver has three touch buttons corresponding to the three modes of operation. When the driver touches a button associated with a certain mode of operation, the golf cart switches into that mode of operation. Refer to bulleted list below for more detailed test descriptions and conditions.
Test Description Test ConditionsDisplaying the time remaining based on how much charge is left in the batteries.
The accuracy of the time remaining displayed on the display was measured using a stop watch. We compared the time remaining displayed at 100%, 75%, 50%, and 25% to the actual time it takes based on the stop watch. If necessary, the formula used to calculate time remaining was altered.
Displaying the battery life as a percentage.
The accuracy of the battery life displayed on the display was measured using a digital multimeter. If necessary, the formula used to calculate battery life was altered.
Displaying the speed of the golf cart.
The accuracy of the speed displayed was tested in two ways. First, a car was driven alongside the golf cart to see if the speed coincides with the cars speedometer. Once this basic speed test was confirmed, a stop watch was used to calculate the average speed over a one mile distance. This calculated speed was compared to the speed displayed throughout the test on the display. If necessary, the formula used to calculate speed was altered.
Displaying and changing the current mode of operation.
The current mode of operation determines the amount of voltage and current pulled from the batteries. Therefore, the output voltage and output current from the batteries was measured using a digital multimeter. These voltages and currents correspond with those calculated in the design process.Figure 6.3 1 – Display Testing
6.3 Performance TestingGeneral performance testing was done to measure the maximum distance, maximum speed, and other general performance metrics. These tests were completed in the three different modes of operation. These results assure that
112

the modes of operation are operating as expected. Refer to Figure 6.4 1 for more detailed test descriptions and conditions.
Test Description Test ConditionsMaximum speed in standard mode. Maximum speed was measured using
the speedometer that is displayed on the display. This testing took place after the speed sensor was already tested and calibrated. Maximum speeds are different in each of the modes of operation and show if the modes are operating as expected.
Maximum speed in high performance mode.
Maximum speed in efficient mode.
Time it takes to go from 0-10 miles per hour in standard mode.
This time was calculated using a stop watch along with the speedometer that are displayed on the LCD. This testing took place after the speed sensor had already been tested and calibrated. These times were different in each mode of operation and show the modes are operating as expected.
Time it takes to go from 0-10 miles per hour in high performance mode.
Time it takes to go from 0-10 miles per hour in efficient mode.
Figure 6.4 1 – Recharging tests
6.4 Sensor TestingBefore the sensors are implemented in the circuit, they will need to be put through a series of tests specific to each sensor. The first test will be to see if the sensor works properly and how it works most effectively. The current sensor, for example, has a graph in the data sheet that shows how the sensor’s output voltage change with the current being measured. The first test will simply be to verify how accurate the graph is and if there is any noise that may be associated with the device. The speed sensor will be tested in a similar fashion and so will the voltage sensor. After the basic tests the sensors will be tested in a simulated circuit to make sure they are still functioning properly. Below are lists with more detailed description of the specific tests that each of the sensors will be put though.
6.4.1 Current sensorsBasic function test- This test will be used to determine whether the sensor works properly or not. A simple resistor circuit will be built using a power source and a resistor box. The current will initially be set at 1A and measured with the current sensor and a multimeter. The output voltage of the sensor will be measured and compared to the graph form the data sheet. After confirming the output voltage, the measured current will be increased to 2A, then 3A all the way up to 10A. The
113

output voltage of the sensor will be measured and compared to the expected result. Any noise will be documented and taken into account when programming the display and microcontroller. The supply voltage for the sensor can range anywhere from 4.5 to 10.5 volts with a typical voltage of 5V. The circuit will be set at a constant current of 10A. The supply voltage of the sensor will be changed to different values starting with 4.5 and going up by .5V until 10.5V is reached. The output voltage will be recorded at each of the intervals to see if there are any notable changes.
Circuit function test- This test will be used to simulate what the current sensor will be subjected to when it is installed in the golf cart. Since the motor is going to be pulsed, the current that is being outputted by the batteries may change with each pulsing of the motor. A similar circuit made of two resistors in parallel with a switch placed before one of them will be built. A 10V power supply will be used as the battery and the combined resistor value will come out to 10Ω. This will make the current in the circuit 1A when both resistors are connected and 2A when the switch is turned off. The current sensor will be used to measure the current right before the junction. The switch will be turned on and off at set intervals to simulate the pulsing of the motor. The output voltage of the sensor will be recorded and graphed to see how it changes with the change in the load that the circuit places on the battery.
6.4.2 Speed sensorBasic function test- The speed sensor will undergo a similar test that the current sensor went through to determine its capabilities. the sensor will be hooked up to a power supply of 12V and the output voltage will be recorded to see if there is a level that indicates that the sensor is idle. A magnet’s north pole will be placed .5in (chosen by looking at the operating distances on the data sheet) from the sensing face of the sensor and the output voltage will be recorded and then the south pole of the magnet will be placed at the same distance from the sensor and the output voltage will be recorded. This will give a baseline for the output voltage during the remainder of the testing. The magnet’s south pole will be used for the remainder of the stationary testing. The magnet will then be moved from .5in from the sensing face to a hair’s width in front of it. Any change in the output voltage will be recorded. The magnet will then be moved away from the sensing face of the magnet until the output voltage returns to its idle state. This test will determine the effective sensor range of the sensor. The magnet will then be moved to its original distance of .5in from the sensing face to be able to test if the change in supply voltage will have an effect on the output voltage. The range of the supply voltage for the speed sensor is 3.8 to 24 volts. The supply voltage will be set to 4V to begin with and slowly increased to 24V. If there is any change in the output voltage it will be recorded.
Circuit function test- This test will be used to simulate what the speed sensor will experience when used on the golf cart. The magnet will be placed on an axel that
114
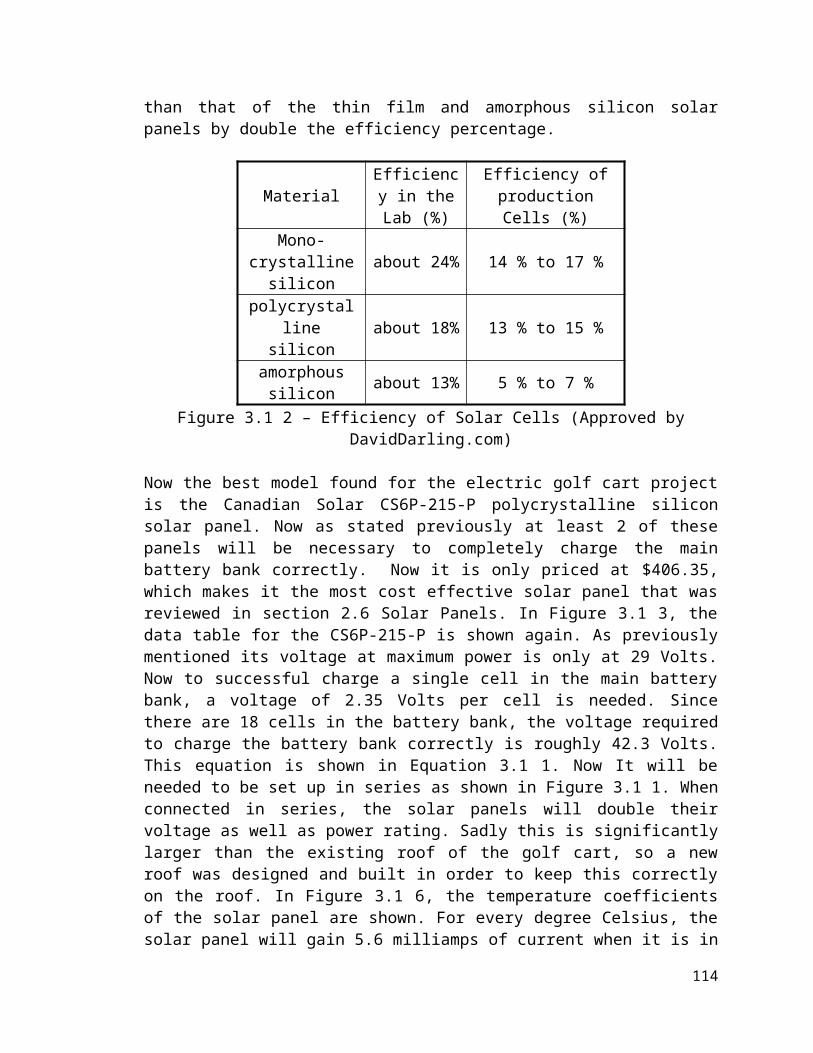
will be positioned at the effective distance that was determined in the Basic function test. The sensor will be given a 12V supply voltage and the output voltage will be measured. The north pole will be rotated to be in front of the sensing surface followed by the south pole. The output voltage will be checked against the results from the previous test to make sure that the sensor is working properly. The axel will then be slowly rotated to simulate the golf cart moving at a slow speed. The output voltage will be monitored to see how it changes with the rotation of the magnet. The rotation of the axel will then be increased to a faster rate to see if the sensor is still changing its output accordingly. The rotation of the axel will then be slowed down and sped up to simulate the acceleration or braking of the golf cart. The output voltage of the sensor will be monitored to see if it changes accordingly with the change in rotation of the axel.
6.4.3 Voltage SensorThe voltage sensor will be composed of a voltage divider placed in parallel with the batteries. Its purpose is to drop the voltage low enough so that it will not damage the I/O pins of the display and microcontroller. It is an important of the circuit and needs to be tested before being implemented. Since the voltage divider is a simple circuit its basic function test and circuit function test will be the same thing.
Circuit function test- The voltage divider will be place with a voltage source at the 58kΩ end of the circuit with the other end grounded. A volt meter will be placed at the node between the resistors to measure the output voltage. The input voltage will be set at 36V and the output voltage will be checked to see that it is correct. The input voltage will then be decreased to make sure that the output voltage decreases accordingly.
6.5 Voltage Regulator Testing The voltage regulators are a vital part of the circuit since they will ensure that the sensors and controllers are powered. Each regulator and their corresponding circuits will need to be tested to make sure that they are working properly and to determine the minimum input voltage that is need for each circuit to regulate effectively. The first tests that the voltage regulators will be put through serve a similar function as the basic tests that the sensors will be put through. They will be used to determine the basic properties of the regulators and operating parameters of each circuit. The regulators will then be tested to see how they operate together in the circuit and how they deal with the effects of pulsing the motor. Below are more detailed descriptions of the tests that the voltage regulators will be put through.
115
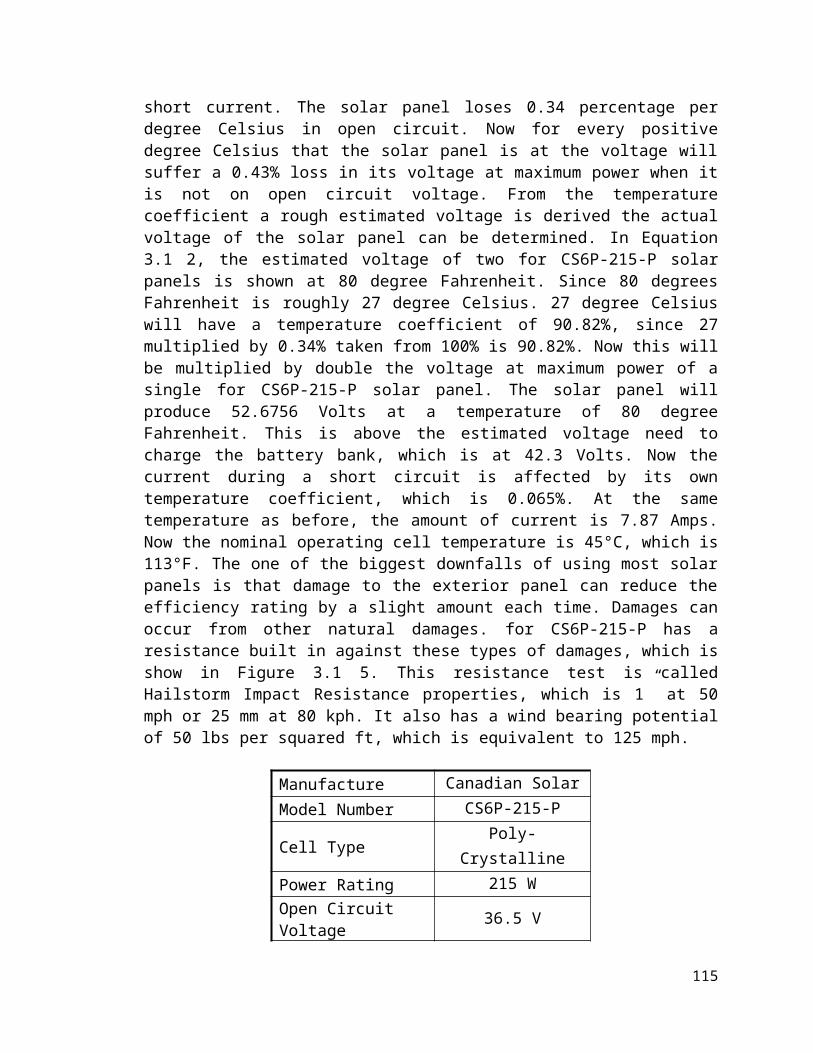
6.5.1 Basic function testLM2576-The LM2576 switching regulator will be the first voltage regulator that will be tested. Its circuit is the most complicated out of the regulator circuits and requires more time and attention than the others. First, the circuit will be constructed and doubled checked to make sure it is assembled correctly. A resistor box set at 500Ω with a switch will be put in parallel with the voltage regulator circuit to help alter the input current to the regulator. The input voltage to the circuit will start out at 0V and then slowly increased until the output voltage of the regulator becomes 12V. The input voltage will then be increased slowly until it reaches 36V. The output voltage will be monitored to see that it remains at 12V. The switch before the resistor box will be turned on and off to simulate the pulsing of the motor. The output voltage will be monitored to see if there are any changes to it while the switch alternates from on to off.
LM117HV-The LM117HV will be tested in a similar fashion to the LM2576. The circuit will be built and double checked to make sure that it is correct. The input voltage will be set at 10V and the variable resistor in the circuit will be set to 4kΩ. The resistor will then be adjusted until the output voltage is 5V. The input voltage will then be increased to 15V to see if the output voltage changes. The input voltage will then be set to 0V and slowly increased until the circuit starts regulating the voltage. This voltage will then be used to find the minimum input voltage for the LM2576 based on the results of the LM2576 Basic function test.
6.5.2 Circuit Function TestThe LM2576 circuit and the LM117HV circuit will be put in series with one another with the LM2576 circuit being first to take the voltage of the batteries and bring it down to a workable level for the LM117HV. For this test the circuits will be put in the previously mentioned configuration with a switch and a resistor box set at 500Ω. The input voltage to the circuit will be set at 0V initially and slowly increased to the minimum input voltage for the LM2576 circuit. The output of the LM2576 circuit and LM117HV will be observed to see that they are the desired outputs. The input voltage will then be increased to 36V. The outputs will be monitored as the input voltage is slowly decreased to see if the circuits are still regulating their voltages properly. The input voltage will then be set at 36V for the next step in the testing. The switch in the parallel branch will then be turned off and on at set intervals to simulate pulsing the motor. The outputs of the regulator circuits will be observed to see that they are correct. The input voltage will then be slowly decreased to the minimum input voltage for the LM2576 while the switch is still being turned on and off to simulate the battery losing power over time while the golf cart is operating. The outputs of the regulators will be monitored to see if there are any significant changes that need to be dealt with.
116
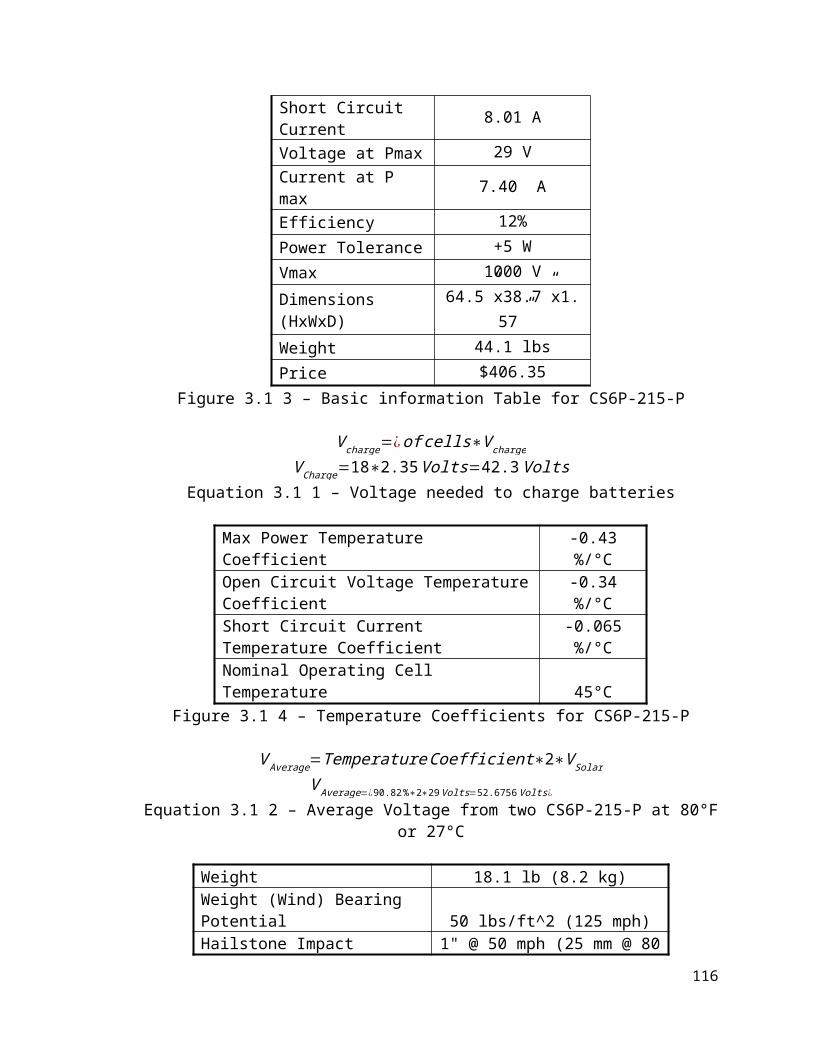
6.7 Solar Panel TestThe solar panels are quite easy to test. The great thing about the Morningstar TS-45 charge controller is that it can display the solar charge controller’s information on a computer screen. This allowed any changes to be noted. The charge controller also allowed the ability to find out what the batteries are currently at as well. Now all that was need is a specific serial to USB port, which was the Tripp Lite U2009-000-R USB to Serial DB9M Adapter. This was combined with a Serial To Serial extender to allow a longer range from the computer to the charge controller. Since it did show that there was voltage and current flowing from the solar panels to the charge controller and then to the batteries, the solar power system was a success. Now during the night time, it had to be checked to ensure that there was no drain coming from the batteries to the solar panels. This also was working properly.
117
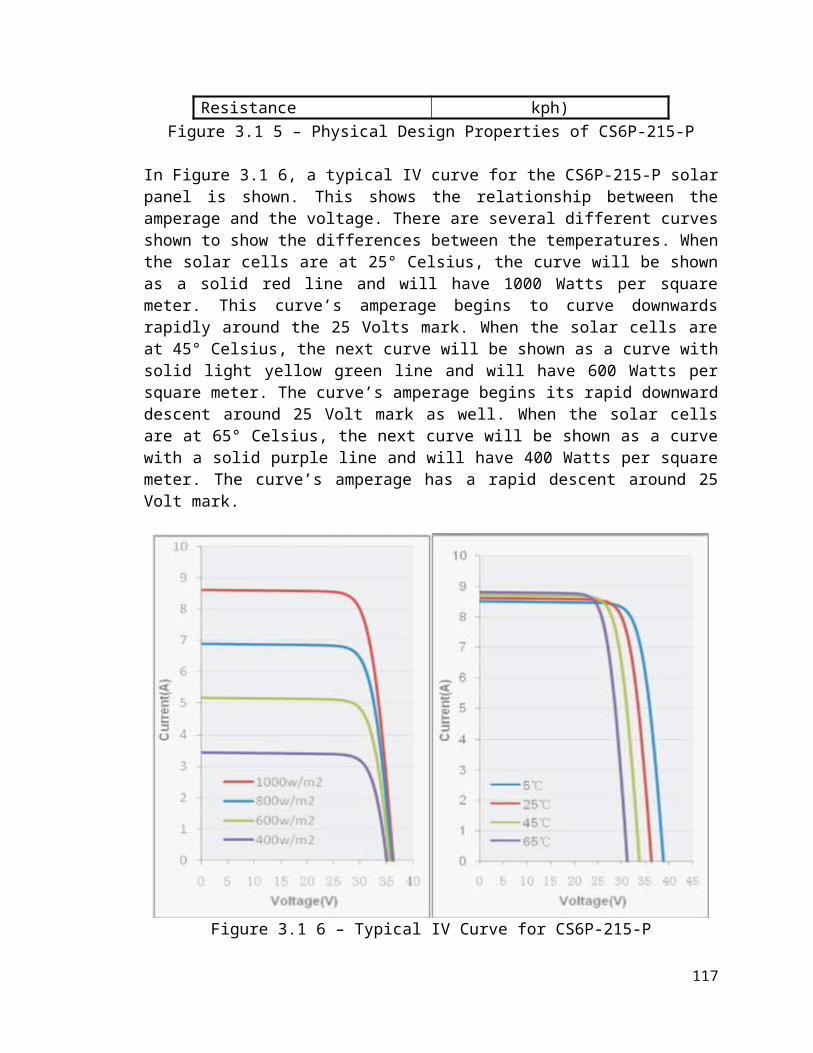
8 Project Summary8.1 Summary
The Arduino Uno serves multiple purposes for this project. It is used to read from sensors, control the LCD screen, and generate PWM signals for the motor. The voltage sensor, speed sensor, potentiometer from the accelerator pedal, and switch for the modes of operation are connected to the analog or digital input pins. The Arduino then uses the values from these sensors and displays them on the LCD screen. Based on the input read from the potentiometer and the current mode of operation, the Arduino Uno outputs a PWM signal that controls the motor. If the pedal is not pressed down at all, the Arduino outputs a 0% PWM signal. The PWM signal percentage increases as the pedal is pushed down. In high performance mode, the maximum PWM signal is 100%, in standard mode, the maximum PWM signal is 75%, and in efficient mode, the maximum PWM signal is 55%.
The solar panels were installed to allow the batteries to be recharged without the need of a wall outlet charge controller. It also relieves some of the stress on the batteries by supplying some current as well as voltage during day time running of the golf cart. It can supply roughly 7 amps of current during a bright day. This will help make the batteries last longer and prolong the batteries lifespan and the golf cart run time, since the batteries will not be drained quite as fast as they normally would.
There are two voltage regulators that supply power to the ICs and sensors. They are the LM 2576 and the LM 7805. Both circuits are placed on a PCB along with the voltage sensor that will be located beneath the forward/reverse switch in the golf cart. The LM 2576 drops the 36V of the batteries down to 10V, which will be used to power the Arduino, and the LM 7805 will be used to drop the 10V down to 5V which will be used to power the sensors and the pot box. The current sensor was to be placed on the wire that connects to the solenoid to the positive terminal of the batteries until it was fried during testing. The speed sensor was placed next to the rear wheel on the driver’s side of the golf cart. The output of all sensors will be routed through the PCB to the Arduino.
8.2 Final Budget and FinancingThe final budget greatly differs from the initial budget in the initial proposal. Both the golf cart and the batteries were donated. The Solar panels and the solar panel controller were very close to budget. We tripled what we needed in misc. materials mainly due to one day shipping for parts that broke before the project was due. We also had to purchase another human interactive display for the golf cart. If not for some destroyed parts we would have been greatly under budget. Now we are only over the budget by roughly $152.00. We also added in the
118

rollers and trailer rental into misc. material. The projected cost has many missing parts involved with it, since it was not fully comprehended. Many other parts of the project were not fully understood. This allowed for huge amount of the funds to be diverted into parts like the Solar Panels and the Misc. Materials. Progress Energy generously allowed $2210.00 to go to the project. The rest will come from the group members.
Items Actual Cost Projected CostGolf Cart $0 (Donated) $600Batteries $0 (Donated) $300Solar Panels $791.20 $400.00Solar Panel Controller $150.00 N/ACircuit Board and Sensors $164.67 $210.00Speed Controller $400.00 N/AHuman Interactive Displays $166.65 $400.00Misc. Material $690.06 $100.00Total $2362.58 $2210.00
Table 8.2 1 – Final Project Budget
8.3 Project OperationsTo operate the solar golf cart you must first sit in the driver’s seat which is located on the side with the steering wheel. Once sitting in the upright position facing the front of the golf cart, locate the control switches on the golf cart. It should be located near your feet and below the seat on the golf cart. From left to right they should be Switch 1, the key switch, Switch 2, and the forward and reverse switch. Pushing switch 1, located to the left of the key switch, in the down position will power the PCB board which supplies power to the sensors, as well as provides the positive and negative voltage to control the power MOSFETS. After pushing switch 1 in the on position wait 15-20 seconds before pushing switch 2. Pushing switch 2, located to the right of the key switch, in the down position will power the Arduino Uno microcontroller. The golf cart is ready for use when you see words displayed on the LCD screen, located above the cup holders. The LCD screen should show white squares when the second switch is put in the on position. If no white squares or words appear after 10 seconds turn both switches off. Wait 5-10 seconds and repeat the process. After repeating the process if the Arduino Uno does not power up turn switch 1 and 2 off. Then remove the wire on the V ¿ pin. Once the wire is removed wait 1 minute. Turn switch 1 on and wait 20 seconds. Then turn switch 1 off and place the removed wire back in the V ¿ pin. Repeat the process of powering up the golf cart. Once the arduino uno is powered up it will display the sensor readings on the LCD screen. The voltage, charge remaining, speed of the golf cart, and the present mode the golf cart is in. If you can see these displayed on the LCD screen then
119
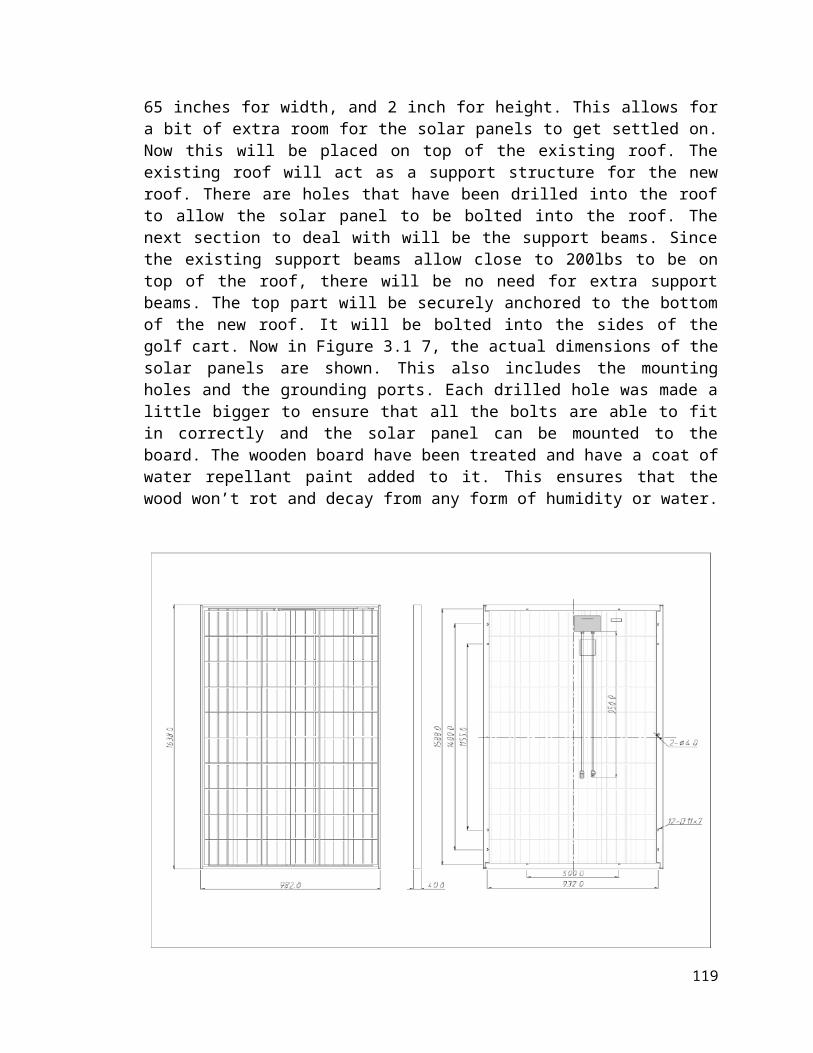
the golf cart is powered and ready to move. Make sure that the key switch is turned on and that the forward and reverse switch is fully in forward or reverse. If the key switch is off or the forward and reverse switch is in neutral the solenoid will not engage and the golf cart will not move forward. If all switches are on then push down on the accelerator pedal. When the accelerator pedal is pushed down the final switch to engage the solenoid will close and current can be supplied to the motor. As the accelerator pedal is pushed down it will adjust a potentiometer within the golf cart. The Arduino Uno will read a voltage based on the resistance of the potentiometer. Based on the voltage red it will generate the duty cycle of the PWM signal and send it to the motor control circuit. The motor control circuit will amplify the PWM signal of the Arduino as well as add a negative voltage to the low part of the PWM signal. This amplified signal will provide the necessary gate voltage to the power MOSFETS which will regulate the speed of the motor. In high performance mode the duty cycle will be 100% and the golf cart will go 100% of its maximum speed. In the economy mode the duty cycle will be 75% and the golf cart will go 75% of its maximum speed. When the batteries are almost drained the golf cart will automatically enter into a power saving mode. This mode will only allow for a 50% duty cycle and the golf cart can reach 50% of its maximum speed.
120

9 Personnel9.1 Suppliers
For the solar panels, the consideration of local and Florida solar distributors were heavily considered. The main reason was due to the expensive shipping and handling cost that occurs with shipping solar panels. Now the cheapest and best option was Sun Electronics down in Miami, Florida. They allowed for pickup, which greatly reduced the shipping cost. They also have one of the best selections of solar panels and solar charge controllers. The wiring from the solar panels to the solar charge controller had to be specially ordered due to the unique connector heads. These were found at Windsun.com for a relatively cheap price.
For all other wiring needs, the help of Skycraft in Orlando, Florida was the best bet. They also supplied much needed extra voltage regulators and crimps at a very low price. A larger wire cutter and stripper were also purchased there for the 6 to 10 gauge wires that were needed.
Arduino Uno and HD44780 display was purchased from www.adafruit.com. During a testing session, the display stopped working properly and another Arduino Uno and HD44780 display had to be purchased and shipped in one day shipping. The main reason was due to the fact the problem was a faulty pin and to not risk any other problems, both the board and LCD display was replaced.
Majority of the materials used for building the testing rollers were obtained from Home Depot and Lowes. Galvanized Steel piping and wood used for the frame were obtained from Home Depot. The rebar and screws were obtained from Lowes, during another trip. The ball bearings were purchased from Skycraft Surplus.
Majority of the PCB Board parts came from either Digi-Key or Mauser. Both are online sites that have a diverse selection and made it easier to work with the parts already tested in the simulator. The PCB board itself was made from Sunstone. It was quickly made and shipped so it was much more expensive.
9.1 ConsultantsOnly a handful of consultants were used in the production of this project. The main and most important one is Henry Kruse, a retired foreman for Pratt and Whitney. He helped us build the testing rollers as well helped fix up the golf cart. He also allowed us extensive use of his large varieties of tools in his work shop. He also helped build the roof mount.
121

Appendix A: Work Cited1. “Golf Carts Buyer’s Guide: Types of utility vehicles and golf carts”; Buyer
Zone; nd; November 3, 2010; <http://www.buyerzone.com/residential/golf-cars/bg-golf-carts-types/>
2. “Golf Carts Buyer’s Guide: Types of utility vehicles and golf carts”; Buyer Zone; nd; November 3, 2010; <http://www.golfcartcomparison.com/types-of-vehicles.jsp?id=>
3. “Batteries” From a technical guide to building robots.” July 5, 2004 <http://homepages.which.net/~paul.hills/Batteries/BatteriesBody.html>
4. “Battery and Energy Technologies: battery Performance Characteristics”; Woodbank Communications; 2005 <http://www.mpoweruk.com/performance.htm>
5. “How Lead Acid Batteries Work”; Constantin Von Wentzel; January 21, 2008; <http://www.vonwentzel.net/Battery/00.Glossary/>
6. “Thermo-Analytics: Battery Modeling”; nd <http://www.thermoanalytics.com/docs/batteries.html>
7. “Power Stream Sealed Lead Acid Battery Charging Basics”; nd <http://www.powerstream.com/SLA.htm>
8. “CSB VRLA battery: Charge Method”, CSB Battery Co. 2005 <http://www.csb-battery.com/english/03_support/01_support_detail.php?fid=1&id=9&page=3&action=page>
9. “Basic Motor Theory”; Baldor Electric Company; September 1, 1998 <http://www.reliance.com/mtr/mtrthrmn.htm>
10. “Motor controlling: Electrical Motor Control”; 2007 <http://www.epanorama.net/links/motorcontrol.html#dc>
11. “All Manufacturers Resistor Speed Control for Golf Carts”; nd <http://www.teetimegolfcars.com/Resistor-Speed-Control-For-Golf-Carts-On-Sale-8-0_16.html>
12. “EV Drives: AXE Products Page”; nd http://www.evdrives.com/alltrax_axe4844.html
13. “EV Drivers: Navitas Motor Controller’s Overview”; nd <http://www.evdrives.com/Navitas_TMP400.html>
14. “Reliance Electric: Regeneration Vs. Dynamic Braking in DC Drivers”; March 2005; 10/20/2010; <http://www.reliance.com/prodserv/standriv/appnotes/d7733.pdf>
15.Allison, Jack; Vergez, Paul; “Transistorized Switching Control of a Variable-Speed Dc Motor.” Industrial Electronics, IRE Transactions on Volume IE-8 issue: 1 (1961): pages 19-24. IEEE Xplore. November 24, 2010 <http://ieeexplore.ieee.org.ezproxy.lib.ucf.edu/stamp/stamp.jsp?tp=&arnumber=5007064>
16. “Atmel ATmega644 data sheet”; http://www.atmel.com; 07/10; 10/13/10; <http://www.atmel.com/dyn/resources/prod_documents/doc2593.pdf>
1

17. “Microchip PIC18F2X1X/4X1X data sheet”; http://ww1.microchip.com; nd; 10/14/10; <http://ww1.microchip.com/downloads/en/DeviceDoc/39636d.pdf>
18. “National Semiconductor LM117HV/LM317HV 3-Termincal Adjustable Regulator data sheet”; nd; <http://www.national.com/ds/LM/LM117HV.pdf>
19. “ON Semiconductor LM2576 data sheet”; http://onsemi.com; 1/06; 11/08/10; <http://www.onsemi.com/pub_link/Collateral/Lm2576-D.pdf>
20. “Hamlin 55100 Mini Flange Mount Hall effect sensor data sheet”; www.hamlin.com; 7/16/09; 10/20/10; <http://www.hamlin.com/specssheets/5510%20IssueAF.pdf>
21. “Honeywell SS340RT and SS440R Series data sheet”; http://sensing.honeywell.com; 8/09; 11/10/10; <http://sensing.honeywell.com/index.cfm/ci_id/156452/la_id/1/document/1/re_id/0>
22.Honeywell CSLT Series data sheet”; http://sensing.honeywell.com; 11/05; 10/06/10; <http://sensing.honewell.com/index/cfm/ci_id/140409/la_id/1/document/1/re_id/0>
23. “Atmel ATtiny44A data sheet”; http://www.atmel.com; 3/10; 10/13/10; <http://www.atmel.com/dyn/resources/prod_documents/doc8183.pdf>
24. “Xilinx Spartan 6 Family data sheet”; http://xilinx.com; ND; 11/5/10; <http://www.xilinx.com/support/documentation/data_sheets/ds160.pdf>
25. “Xilinx Spartan 6 LXT FPGAs”; http://www.xilinx.com; ND; 10/14/10; <http://www.xilinx.com/products/spartan6.lxt.htm>
26. “CFAG160128B-T-TS-LCD Monitor and SSD2119 Controller”; Crystalfontz; nd; 10/20/2010; <http://www.crystalfontz.com/product/CFAF320240F-T-TS>
27. “CFAG160128B-TMI-TX Touch Screen and T6963C Controller”; Crystalfontz; nd; 10/20/2010; <http://www.crystalfontz.com/product/CFAG160128B-TMI-TZ>
28. “EA EDIP320J-8LWTP Touch Screen”; Electronic Assembly; nd; 10/20/2010; <http://www.lcd-module.de/eng/pdf/grafik/edip320-8e.pdf>
29. “NHD-3.5-320240MF-ATXL#-T-1 Touch screen”; Electronic Assembly; nd; 10/20/20/10; <http://www.newhavendisplay.com/specs/NHD-3.5-320240MF-ATXL-T-1.pdf>
30. “HD44780U LCD Controller”; Hitachi; nd; 10/20/2010; <http://www.sparkfun.com/datasheets/LCD/HD44780.pdf>
31. “SED1330 LCD Controller”; Epson; nd; 10/20/2010; <http://www.tstonramp.com/~pddwebacc/ics_app%20notes/epson/SED1330.pdf>
32. “AD7877 Touch Screen Controller”; Analog Devices; nd; 10/20/2010; http://www.analog.com/static/imported-files/data_sheets/AD7877.pdf
33. “Nios II 3C25 Microprocessor with LCD Controller”; Altera; nd; 11/15/2010; <http://www.altera.com/literature/ds/ds_nios2_3c25_lcd.pdf>
2

34. “AR1000 Series Resistive Touch Screen Controller”; Microchip; nd; 11/15/2010; <http://ww1.microchip.com/downloads/en/DeviceDoc/41393A.pdf>
35. “SID15G00 LCD Controller”; Hantronix; nd; 11/15/2010; <http://hantronix.com/down/S1D15G00_REV1_0.pdf>
36. “Crystalline Silicon Solar Cells”; PVRESources; nd; 10/24/2010; <http://www.pvresources.com/en/solarcells.php>
37. “Solar Cells”; Solarbotics; nd; 10/24/2010; <http://www.solarbotics.net/starting/200202_solar_cells/200202_solar cell_types.html>
38. “Working of Photovoltaic cells – Solar Cells”; Solar power notes; nd; 10/24/2010; <http://www.solarpowernotes.com/how-solar-cells-work.html>
39. “Advantages and Disadvantages of Monocrystalline Solar Panels”; Solar power fast; nd; 10/24/2010; <http://www.solarpowerfast.com/build-solar-panel/monocrystalline-solar-panels/>
40. “Advantages and Disadvantages of Polycrystalline Solar Panels”; Solar power fast; nd; 10/24/2010; <http://www.solarpowerfast.com/build-solar-panel/polycrystalline-solar-panels/>
41. “Advantages and Disadvantages of Thin Film Solar Panels”; Solar power fast; nd; 10/24/2010; <http://www.solarpowerfast.com/build-solar-panel/thin-film-solar-panels/>
42. “Solar Cells”; Solar power answers; nd; 10/24/2010; <http://ww.solar-power-answers.co.uk/solar_cell_types.php>
43. “Types of Solar Cells”; Energy Savers; nd; 10/30/2010; <http://www.energysavers.gov/your_home/electricity/index.cfm/mytopic=10791>
44. “Cheap Solar Cells”; Hank The DIY Energy Guy; nd; 10/30/2010; <http://www.thediyenergyguy.com/cheap-solar-panels/cheap-solar-cells/>
45. “Broken Solar Cells”; Solar Energy Home 2; nd; 10/30/2010; <http://www.solarenergyhome2.com/broken-solar-cells/>
46.Yago, Jeffery; “Solar Power 101”; Backwoods Home; June 2004; 10/30/2010 <http://www.backwoodshome.com/articles2/yago87.html>
47. “What is a solar charge controller”; Wind Sun; nd; 11/15/2010; <http://www.windsun.com/ChargeControls/ChargeCont.htm>
48.Martinez, Valdez J.S; Lopez, Guevara P.; Juarez, Medel J.J. “Series Wound DC Motor Modeling and Simulation, Considering Magnetic, Mechanical and Electrical Losses”; Circuits and Systems, 2009. MWSCAS’09. 52 nd IEEE International Midwest Symposium on 2009: pages 1073-1077; IEEE Xplore; November 11, 2010; <http://ieeexplore.ieee.org/ezyproxy.lib.ucf.edu/stamp.stamp.jsp?tp=&arnumber=5235954>
49. “Arduino Uno”; Arduino; nd; 04/28/2011;<http://arduino.cc/en/Main/ArduinoBoardUno>
3

Appendix B: Permission Emails:Status: ApprovedRequest:From: [email protected]: [email protected]: Request for permission to use figuresDate: Sun, 5 Dec 2010 14:43:44 -0500
To Whom this may concern:
I am a current University of Central Florida senior computer engineering student. I am currently taking Senior Design I. I was wondering if it is all right to use the images and tables from your website, http://www.pvresources.com/en/solarcells.php. Please respond as soon as possible.
Patrick Taylor
Reply:From: [email protected]: [email protected]: RE: Request for permission to use figuresDate: Mon, 6 Dec 2010 21:03:20 +0100These images (links below) are mine, you may use them. They are related to particular solar cell (U,I values defined) RgdsDenis Lenardic
B i

Status: ApprovedRequest:From: [email protected]: [email protected]: Request for permission to use figuresDate: Sun, 5 Dec 2010 14:40:36 -0500
To Whom this may concern:
I am a current University of Central Florida senior computer engineering student. I am currently taking Senior Design I. I was wondering if it is all right to use the images and tables from your website, http://www.daviddarling.info/encyclopedia/S/AE_solar_cell.html. Please respond as soon as possible.
Patrick Taylor
Reply:Date: Sun, 5 Dec 2010 12:19:00 -0800Subject: Re: Request for permission to use figuresFrom: [email protected]: [email protected] Yes that's fine, Patrick Regards,David Darling
B ii

Status: ApprovedRequest:Sent: Saturday, October 23, 2010 9:18 AMTo: [email protected]: [Webmaster] (no subject)My name is Nick Paperno and I was wondering if it would be alright if I used your parts of your data sheet in me report for my senior design project? Nick [email protected]
Reply:Nick,You may use portions of our datasheets or other material from our website as long as you cite the source/owner of the material.Regards, Michael De CaroWeb Operations Manager / Atmel CorporationTel: (+1) (408) 436-4352 / Fax: (+1) (408) [email protected] / www.atmel.com
The information contained in this email message may be privileged, confidential and/or protected from unauthorized disclosure. If you are not the intended recipient, any dissemination, distribution or copying is strictly prohibited. Please immediately notify the sender by reply if you received this email in error. Thank you for your cooperation.
B iii
Status: ApprovedRequest:From: [email protected]@MICROCHIP Sent: Wednesday, November 03, 2010 7:14 PMTo: UniversitySubject: My name is Nick Paperno and I was wondering if I could use information from your data sheet for PIC 18F4X1X microcontrollers for my senior design project. Nick Paperno
Reply:HI Nick: You are welcome to use information from our datasheets in accordance with the following:http://www.microchip.com/stellent/idcplg?IdcService=SS_GET_PAGE&nodeId=487¶m=en023282I hope this helpsRegards,Marc McCombAcademic Program Sales Engineer 2355 West Chandler Blvd., Mailstop 9-BChandler, AZ 85224-6199office: 480-792-4391mobile: 480-478-5676Need more information on Microchip's Academic Program or would like to become a Partner? Visit www.microchip.com/academic for more information.
B iv

Status: ApprovedRequest:From: [email protected] [mailto:[email protected]] Sent: Saturday, November 06, 2010 1:56 PMTo: Sc, InfoSubject: My name is Nick Paperno and I was wondering if it would be alright if I used your parts of your data sheet in me report for my senior design project? Nick [email protected]
Reply:Thank you for your interest in Honeywell Sensing & Control products. Any documentation found on our website is free to use for your project. Please be advised it is solely up to the customer to determine suitability of our products in their applications. If you have any further questions, or need any other assistance, do not hesitate to contact us. Honeywell International, Inc. Sensing & Control Products Customer Response Center Phone: 1-800-537-6945 International: 815-235-6847 FAX: 815-235-6545 E-Mail: [email protected] Website: www.honeywell.com/sensing/
B v

Status: ApprovedRequest:>>> <[email protected]> 11/11/2010 4:40 PM >>>I was wondering if I could use information from your data sheet for the 55100 Mini Flange Mount Hall effect sensor in my senior design project report. Nicholas [email protected]
Reply:Hi Nick,Yes this is OKKind regards,Paula Paula MaraschCustomer Service /Inside SalesT: (920) 648-6273F: (920) 648-3001E: [email protected]
Xilinx requestDone through website
Confirmation: PendingNational Semiconductor request
Done through websiteConfirmation: pending
ON Semiconductor requestPendingConfirmation: pending
B vi
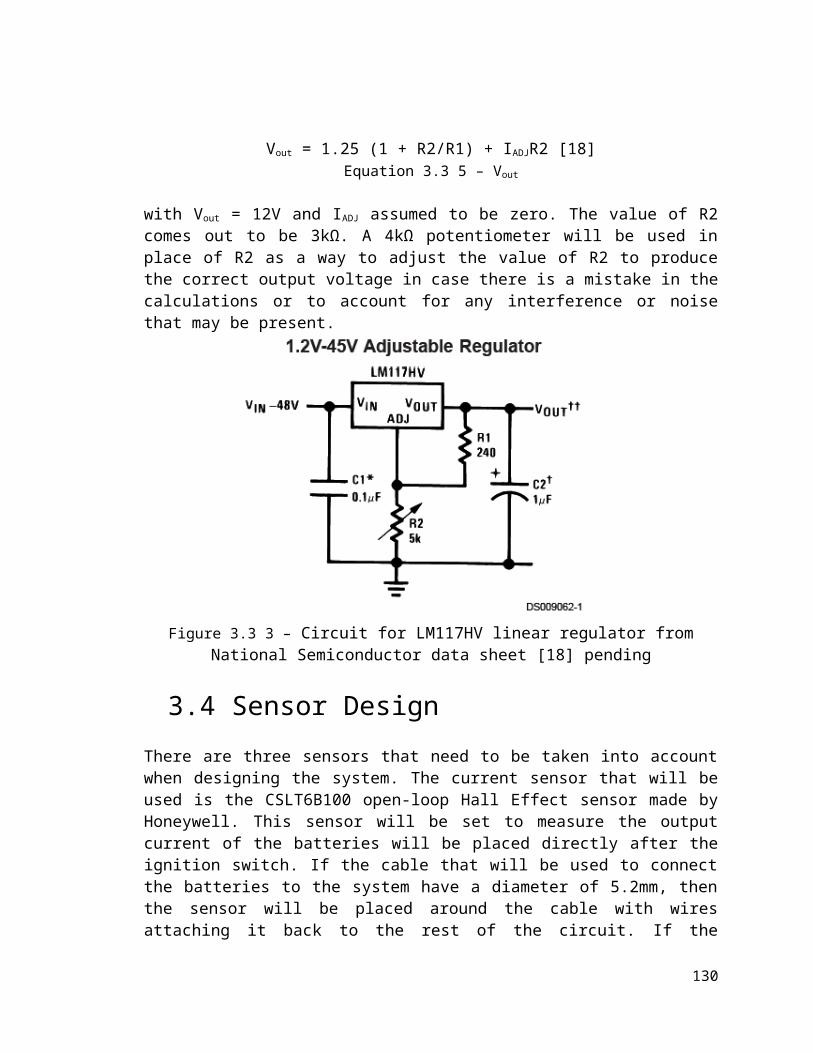
Status: ApprovedRequest:From [email protected]: [email protected]
To whom it may concern, My name is Andrew Bridges and I am currently a senior student of Electrical Engineering at the University of Central Florida. I was wondering if I may have permission to use some of the pictures, graphs, or information presented in http://homepages.which.net/~paul.hills/Batteries/BatteriesBody.html for my senior design documentation. Anything I use would have the appropriate citation. Thank you for your time.-AndrewE-mail asking permission from [email protected]: [email protected]
Reply:Help yourself to anything! Cheers,paul
Paul Hills
Software Manager
Landis+Gyr UK Ltd
Office: +44 161 919 8960 begin_of_the_skype_highlighting +44 161 919 8960 end_of_the_skype_highlighting
www.landisgyr.com
manage energy better
Landis+Gyr Ltd is a limited company registered in England and Wales. Registered number: 1202284Registered office: 1 Lysander Drive, Northfields Industrial Estate, Market Deeping, Peterborough, PE6 8FB, UK
B vii

B viii

Status: ApprovedRequest:From [email protected]: [email protected]
To whom it may concern, My name is Andrew Bridges and I am currently a senior student of Electrical Engineering at the University of Central Florida. I was wondering if I may have permission to use some of the pictures, graphs, or information presented in http://www.mpoweruk.com/performance.htm for my senior design documentation. Anything I use would have the appropriate citation. Thank you for your time.-Andrew
Reply:Andrew, Go ahead! Cheers! Constantin >>To whom it may concern, >My name is Andrew Bridges and I am currently a senior student of>Electrical Engineering at the University of Central Florida. I was>wondering if I may have permission to use some of the pictures, graphs,>or information presented in >http://www.vonwentzel.net/Battery/00.Glossary/ for my senior design>documentation. Anything I use would have the appropriate citation. >Thank you for your time.>-Andrew -------------------------------------------------------------------~~~ ~~~ ~~ ~ ~~~ ~~ ~~~~~~ ~ I love sailing!~ ~ www.vonwentzel.net/) ~~~~~~~~~~~~~~~~~~~~~~~~~~~~~~~~~~~~~~~~~~~~~~~~~~~~~~~~~~~~~~~~~~~
B ix

Status: ApprovedRequest:From [email protected]: [email protected]
To whom it may concern, My name is Andrew Bridges and I am currently a senior student of Electrical Engineering at the University of Central Florida. I was wondering if I may have permission to use some of the pictures, graphs, or information presented in http://www.vonwentzel.net/Battery/00.Glossary/ for my senior design documentation. Anything I use would have the appropriate citation. Thank you for your time.-Andrew
Reply:Yes, that is OK.best regardsmarkOn 12/5/2010 8:41 AM, Andrew Bridges wrote:
To whom it may concern, My name is Andrew Bridges and I am currently a senior student of Electrical Engineering at the University of Central Florida. I was wondering if I may have permission to use some of the pictures, graphs, or information presented in http://www.powerstream.com/SLA.htm for my senior design documentation. Anything I use would have the appropriate citation. Thank you for your time.-Andrew
__________ NOD32 5675 (20101205) Information __________
This message was checked by NOD32 antivirus system.http://www.eset.com
-- --------------------------------------------------------------Mark W. Lund, PhD ** Battery ChargersCEO ** Bulk Cells and Custom Battery PacksPowerStream Technology ** Custom Power Supplies1163 S. 1680 West ** DC/DC ConvertersOrem Utah 84058 ** Custom UPS(01)801-764-9060 ** Battery backup http://www.PowerStream.com ** Engineering, manufacturing, consulting
B x

Status: ApprovedRequest:From: [email protected]: [email protected] and [email protected]
To whom it may concern, My name is Andrew Bridges and I am currently a senior student of Electrical Engineering at the University of Central Florida. I was wondering if I may have permission to use some of the pictures, graphs, or information presented in http://www.powerstream.com/SLA.htm for my senior design documentation. Anything I use would have the appropriate citation. Thank you for your time.-Andrew
Reply:Hi Andew,
Yes, you are welcome to use any of the pictures you would like and documentation. Thank you for asking.
Regards,Carl PiehlOwner
1240 W Sims Way #1Port Townsend WA 98368Ph: 360-355-8372 begin_of_the_skype_highlighting 360-355-8372 end_of_the_skype_highlightingCell: 541-218-8890 begin_of_the_skype_highlighting 541-218-8890 end_of_the_skype_highlighting
B xi

Status: ApprovedRequest:From [email protected]: [email protected]
To whom it may concern, My name is Andrew Bridges and I am currently a senior student of Electrical Engineering at the University of Central Florida. I was wondering if I may have permission to use some of the pictures, graphs, or information presented in http://www.evdrives.com/alltrax_axe4844.html for my senior design documentation. Anything I use would have the appropriate citation. Thank you for your time.-Andrew
Reply:> Dear Andrew Bridges:> > This is in response to your letter below, in which you have requested> permission to reprint, in your upcoming thesis/dissertation, the described> IEEE copyrighted figures. We are happy to grant this permission.> > Our only requirements are that you credit the original source (author,> paper, and publication), and that the IEEE copyright line ( © [Year] IEEE)> appears prominently with each reprinted figure.> > Sincerely,> > Jacqueline Hansson
B xii

Status: ApprovedRequest:To whom it may concern, My name is Andrew Bridges and I am a senior student of Electrical Engineering at the University of Central Florida. I am wondering if I may have permission to use some of the figures presented in the article “Transistorized Switching Control of a Variable-Speed DC Motor by Jack Allison and Paul Vergez” for my senior design documentation. Any information used with of the appropriate citation. Thank you for your time. -Andrew
Reply:Thank you for using the Schneider Electric website.
You may use the information requested.
Please advise if you need further assistance. Regards, Schneider Electric North America
B xiii