edwin cox, m.d. olli what to eat & why!
TRANSCRIPT

Food Fiber & Other Indigestibles
Edwin Cox, M.D.OLLI What To Eat & Why!

Objectives
● Describe dietary fiber (indigestible carbohydrate) and its food sources
● Review evidence relating fiber consumption to health outcomes, including cardiovascular disease and mortality
● Discuss other indigestibles – the statistical tools (survival analysis) used to analyze nutritional epidemiology data – and illustrate their use

What is dietary fiber?
● Dietary fiber is indigestible carbohydrates (polysaccharides)– Digestible carbs are sugars and starches
– Specific enzymes break sugars and starches into glucose, which gets absorbed
– Lacking enzymes for longer, more complex polysaccharides, fiber passes to colon intact
● Insoluble fiber– Cellulose, lignins, others
– Passes out of colon intact, binds bile salts, adds bulk to stool
● Soluble fiber– Feedstock for intestinal micro-organisms (“gut microbiome”)
– Products of fermentation include many compounds that are beneficial to the colon and body: short-chain fatty acids providing energy, immune signaling, psychoactive compounds

Sources of dietary fiber
● Whole grains– Wheat, barley, quinoa, rice, corn, aramanth, ...
– Fiber is in the kernel
– Processed grains have the fiber removed
● Fruits● Vegetables● Pulses (AKA legumes, beans)● Nuts● Seeds

Fiber ca. 1960’s knowledge
● Useful for treating constipation, irritable bowel, and similar intestinal problems
● Adjunct for lowering cholesterol level by removing bile salts before they recirculate
● Psyllium seed (Metamucil) was the main preparation recommended; inulin, dextran
● Fruits and vegetables contain substantial amounts of fiber, and we know they are good for us
● Fiber slows intestinal absorption, reducing glucose spikes and resulting insulin spikes
● Beans are “good for the heart”, but are hard to digest and bring on undesirable side effects (“the musical fruit”)

Fiber ca. 2016 knowledge
● Fiber feeds our gut microbiome– The human “meta-organism”: human + microbiome
– Gut microbiome considered by some to be an endocrine organ
– Food for our microbiome given the name “prebiotics”
● The quality of what we feed our microbiome is a key determinant of how well it functions on our behalf– More about the microbiome and its functions in a later
session

Vegetarianism and fiber
● The emergence of the vegetarian diet and its apparent health benefits focused attention on fiber– Seventh Day Adventists were major adherents of vegetarian
diets
– Longevity was somewhat greater in Adventists than the general population
– Loma Linda University, in the heart of California Adventist population, began systematic study of disease incidence and mortality relative to diet in 1950s with the support of the NIH
– Fiber is a major aspect of plant-based foods

Fiber and mortality
● First studies to go beyond effects of fiber on heart disease to effects on overall mortality emerged around 2000– Scottish Heart Health Study
– Zutphen Study (Netherlands)
– Israeli study
– All showed inverse relation between amount of fiber consumed and mortality, i.e., lower mortality with increasing dietary fiber
● NIH-AARP Study– Largest, most detailed to date

Fiber & mortality: NIH-AARP
Park et al Arch Int Med 2011

Fiber & mortality: NIH-AARPInvitation to participate went to half a million AARP members in 6 states and two metro areas responding to questionaire in 1995-96
219,123 men & 168,999 women eligible, ages 50-71
Follow-up 9 years avg.
Excluded: existing cancer, heart disease, diabetes, stroke
Food frequency questionaire – 124 items
Lifestyle data: Smoking, exercise, personal and family medical history, HRT, BMI, alcohol, ASA, education

Fiber & mortality: NIH-AARP
Cases• Men: 5,248 CVD & 8,244 cancer deaths• Women: 2,417 CVD & 4,917 cancer deaths
Deaths per 100,000 from all-cause, CVD & cancer (age-adjusted)• Men: 991, 258, 406• Women: 716, 153, 311

AnalysisSeparate men and women, in case there are important differences
Divide into equal size groups - “quantiles”• Two groups: halves; three: tertiles; four: quartiles• Five groups: quintiles – 219,123/5 = 43,824 men per quintile
Examine changes in outcome (mortality) across the groups
Formal statistical test of trends (change in mortality with increasing fiber)
Multivariate analysis (MVA) to account for possible effects of other factors (“covariates”)


Fiber & mortality: NIH-AARP
Men and women who consumed more fiber • more educated • rated their general health higher• smoked less• consumed less alcohol• ate less red meat• lower BMI

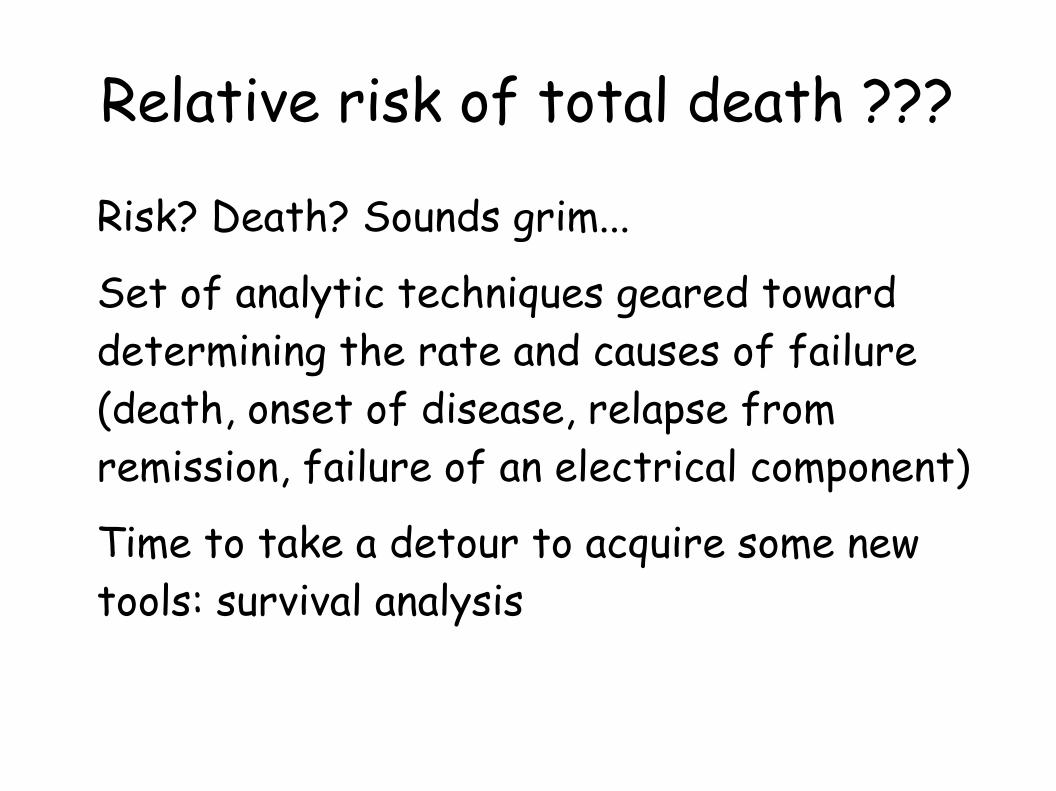
Relative risk of total death ???
Risk? Death? Sounds grim...
Set of analytic techniques geared toward determining the rate and causes of failure (death, onset of disease, relapse from remission, failure of an electrical component)
Time to take a detour to acquire some new tools: survival analysis

Life Table: Leukemia Disease-Free Survival
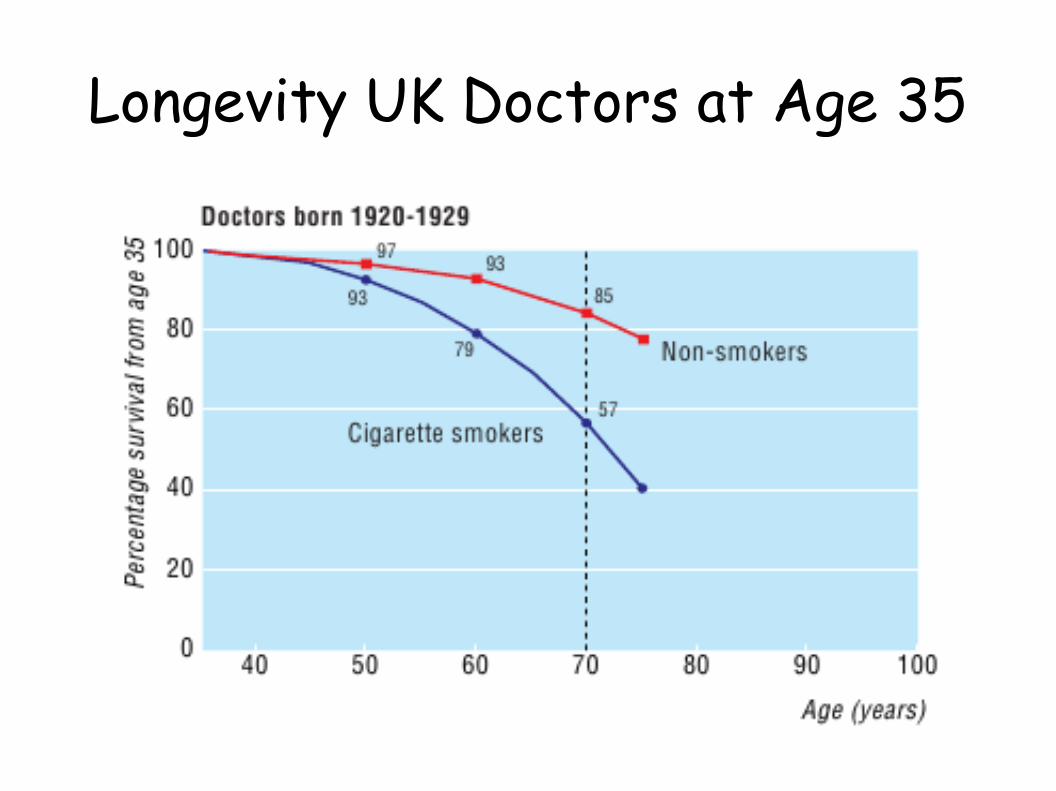
Longevity UK Doctors at Age 35


U.S. Mortality Rates by Age

Smoking MDs got none of the benefits of increasing survival that accompanied improvements in public health and medical care from 1800s into mid 1900s!

Confidence intervals
95% confidence interval• With 95% confidence, the true mean value of the
underlying distribution lies within this interval• Depends jointly on sample size and variability
within data• If a specified non-significant value (1.0 for RR) is
covered by the 95% CI, the difference from that value is not statistically significant


Forest plotsCompact graphical depiction of RR and 95% CI
Combining data from multiple studies: Meta-analysis
Comparing data from multiple factors
Icon size indicates relative number of subjects
Horizontal line spans CI, usually 95% CI


Relative risk vs. amount of fiber
Threapleton BMJ 2013 Meta-analysis

U.S. Mortality Rates by Age

Effect of fiber on mortality
If true, going from lowest daily intake (~0) to very high intake (80 g/d) is associated with mortality decrease equivalent to setting back the biological clock 1.5 decades!
However...• Plot I showed was RR of onset of cardiovascular disease
vs. fiber amount• Plot was extrapolated beyond range of actual data

Linear regression analysis
log(RR) = a + bx

Multiple linear regressionEstimate the relationships of multiple cofactors on the outcome variable concurrently• y = Σ aixi
Adjusting for the effects of confounding cofactors (correlated)• Those eating more fiber are less likely to smoke
Stepwise regression• Enter covariates into the model, one at a time, to obtain
greatest amount of variance explained

Proportional hazards multiple regression
Relative risk also known as relative hazard
Hazard functions may vary with time• U.S. survival vs. age: Hazard rate increases exponentially
(doubles with each decade of life)
Outcome variable is log(h(t)/ho(t)), i.e., the log of the hazard ratio
Hazard function need not be known or specified, as long as proportional hazard qualification reasonably well met


Fiber Rule of 10%We get about 1000 calories / day from carbs (50% of 2000 Kcal)
That’s 250 g of carbs (1000 g / 4 cal per g)
We’re aiming for 25 g of fiber / day
25/250 is 10%
If we eat carbs where fiber is 10% or more of total carbs, we will get 25 g of fiber / day• White pasta has 2 g fiber, 40 g total carb per serving 5% fiber→
• Whole grain pasta has 5 g fiber, 40 g carb per serving 12.5% fiber→
• Whole grain pasta contributes a good share, white pasta not so much
Data needed is on Nutrition Facts label on package

Fiber content of various foods